Embed Size (px)
Citation preview

11
Market Study
• Three components to perform a market study and valuation:
– Market Study
– Forecast of Revenues & Expenses
– Valuation
Bernard Jaquier - Novembre 2010

22
Define the primary market area
• A market area is a perimeter surrounding the subject property.
• determine the primary segments of demand presently using local hotels.
• The three markets segments generally found in most market areas are. – commercial travellers– meeting/convention visitors (group business)– and pleasure/leisure travellers
• Other segments often present include:
• government, airline crews, extended stay/relocation guests, sports teams, military, truck drivers, hospital/out patient, cruise ship, etc.
Bernard Jaquier - Novembre 2010

33
Historical Supply & Demand in
the market area
600'000
700'000
800'000
900'000
1'000'000
1'100'000
1'200'000
1'300'000
2000 2001 2002 2003 2004 2005 2006 2007 2008 2009
Years
Room Night Demand Room Night Supply
Bernard Jaquier - Novembre 2010

44
Historical Supply & Demand in the market area
-4.0%
-2.0%
0.0%
2.0%
4.0%
6.0%
8.0%
2000 2001 2002 2003 2004 2005 2006 2007 2008 2009
Years
Perc
enta
ge
∆%RND ∆%RNS
Bernard Jaquier - Novembre 2010

55
Competition in the market area
• Primary Competitors
• Secondary Competitors
Bernard Jaquier - Novembre 2010

66
Primary Competitors
Primary competitors are those hotels that
are similar to the subject property with
respect to the class and type of facilities
offered
Bernard Jaquier - Novembre 2010

77
Primary Competitors 2009
The 124-room Courtyard by Marriott opened on July l, 2009.
Its historic average room count (HARC) is 62 rooms
Primary Competitors Market Segmentation
Hotels # Rooms HARCAverage
RateOccupancy
Commercial
Meeting & Convention Leisure
Embassy Suites 200 200 151.00 78% 80% 5% 15%
Hilton Inn 275 275 136.00 72% 40% 50% 10%
Radisson Hotel 250 250 131.00 68% 45% 40% 15%
Holiday Inn 175 175 127.00 73% 55% 25% 20%
Courtyard 124 62 133.00 65% 75% 5% 20%
Ramada Inn 150 150 124.00 66% 65% 20% 15%
Island Inn 135 135 110.00 62% 60% 30% 10%
Quality Inn 175 175 125.00 78% 50% 10% 40%
Days Hotel 120 120 121.00 74% 70% 5% 25%
1604 1542
Bernard Jaquier - Novembre 2010

88
Primary Competitors 2009
Total Market Segmentation : Rooms sold Annual
Rooms sold Comm Convention Leisure Revenue
56'940 45'552 2'847 8'541 8'597'940
72'270 28'908 36'135 7'227 9'828'720
62'050 27'923 24'820 9'308 8'128'550
46'629 25'646 11'657 9'326 5'921'851
14'710 11'032 735 2'942 1'956'364
36'135 23'488 7'227 5'420 4'480'740
30'551 18'330 9'165 3'055 3'360'555
49'823 24'911 4'982 19'929 6'227'813
32'412 22'688 1'621 8'103 3'921'852
401'518 228'478 99'190 73'850 52'424'384
56.90% 24.70% 18.39% 130.57
Bernard Jaquier - Novembre 2010

99
Secondary Competitors
Secondary competition consists of those
lodging facilities that would not normally
attract the same type of visitor, but because
of special circumstances (such as location)
they become competitive.
Bernard Jaquier - Novembre 2010
1010
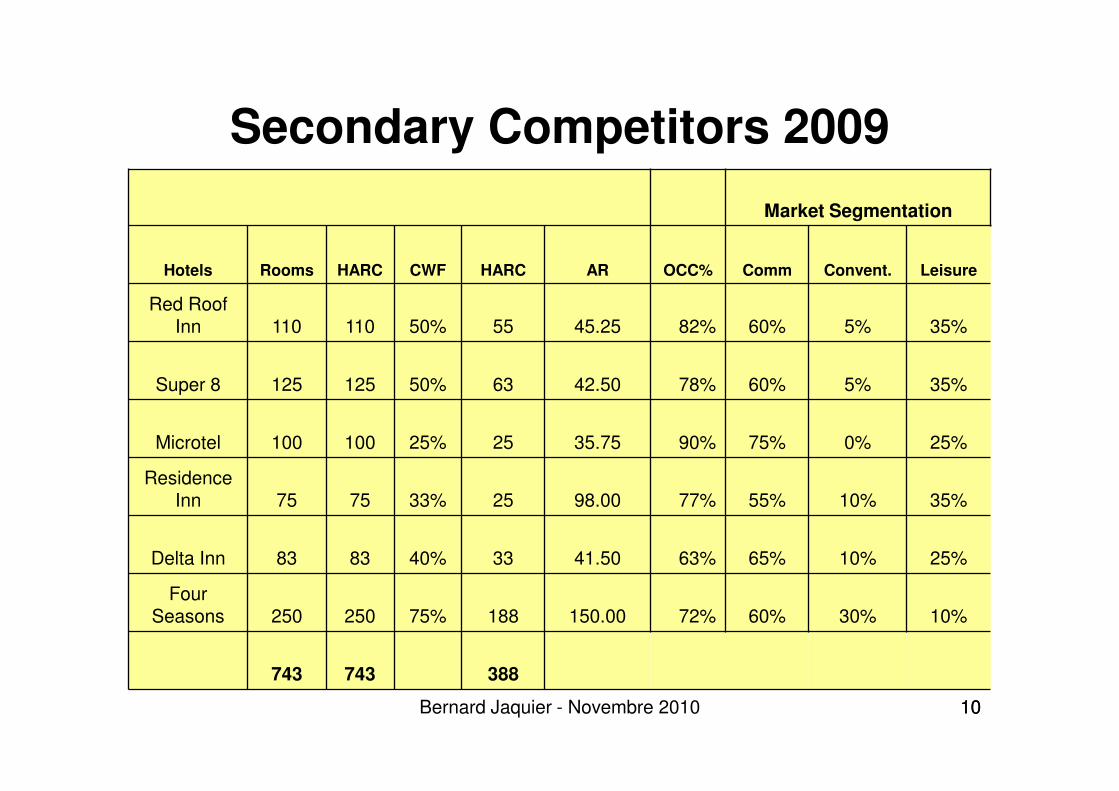
Secondary Competitors 2009
Based on competitive criteria, competitive weighting factors (CWF)
were assigned to each secondary hotel.
Market Segmentation
Hotels Rooms HARC CWF HARC AR OCC% Comm Convent. Leisure
Red Roof Inn 110 110 50% 55 45.25 82% 60% 5% 35%
Super 8 125 125 50% 63 42.50 78% 60% 5% 35%
Microtel 100 100 25% 25 35.75 90% 75% 0% 25%
Residence Inn 75 75 33% 25 98.00 77% 55% 10% 35%
Delta Inn 83 83 40% 33 41.50 63% 65% 10% 25%
Four Seasons 250 250 75% 188 150.00 72% 60% 30% 10%
743 743 388
Bernard Jaquier - Novembre 2010

1111
Secondary CompetitorsCWF
Based on competitive criteria, competitive
weighting factors (CWF) were assigned to
each secondary hotel.
Bernard Jaquier - Novembre 2010
1212
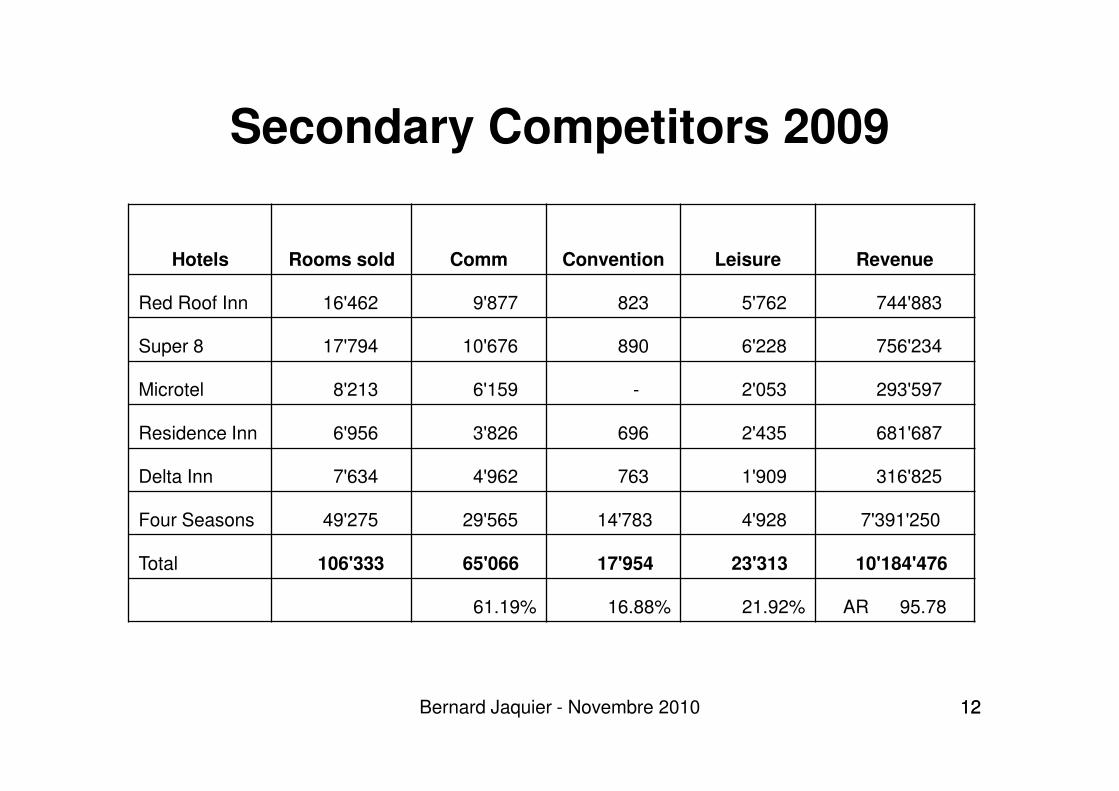
Secondary Competitors 2009
Hotels Rooms sold Comm Convention Leisure Revenue
Red Roof Inn 16'462 9'877 823 5'762 744'883
Super 8 17'794 10'676 890 6'228 756'234
Microtel 8'213 6'159 - 2'053 293'597
Residence Inn 6'956 3'826 696 2'435 681'687
Delta Inn 7'634 4'962 763 1'909 316'825
Four Seasons 49'275 29'565 14'783 4'928 7'391'250
Total 106'333 65'066 17'954 23'313 10'184'476
61.19% 16.88% 21.92% AR 95.78
Bernard Jaquier - Novembre 2010
1313
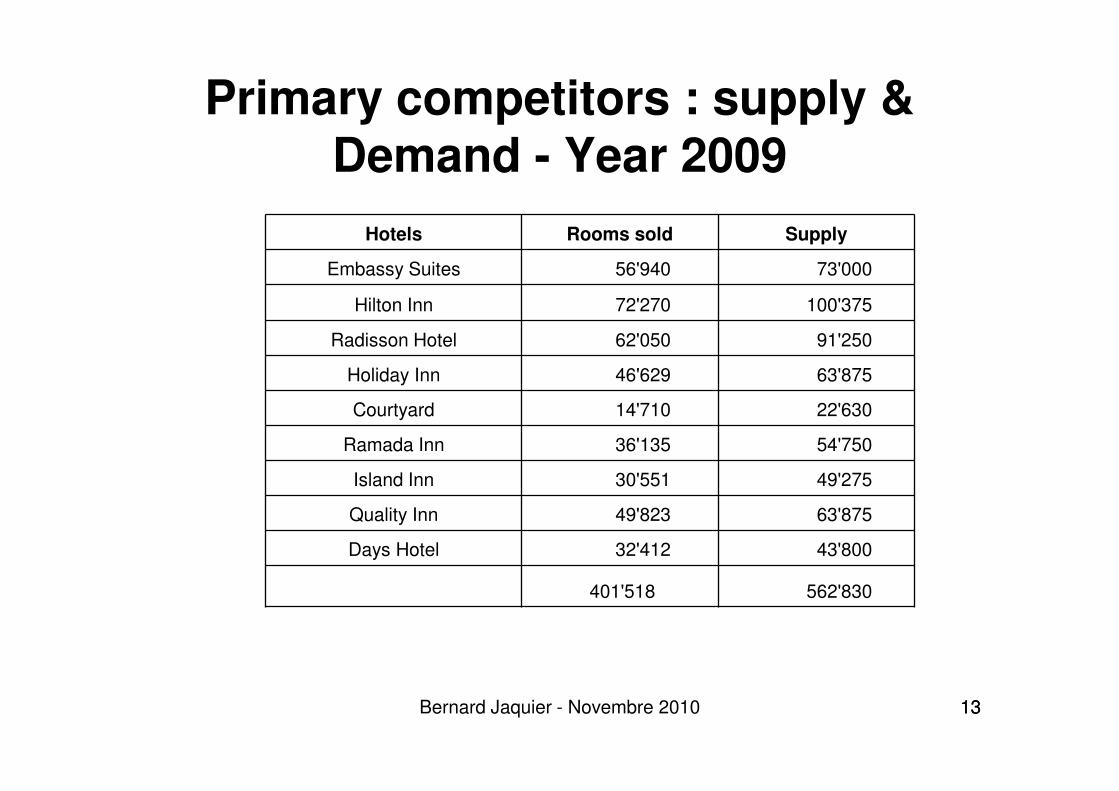
Primary competitors : supply & Demand - Year 2009
Hotels Rooms sold Supply
Embassy Suites 56'940 73'000
Hilton Inn 72'270 100'375
Radisson Hotel 62'050 91'250
Holiday Inn 46'629 63'875
Courtyard 14'710 22'630
Ramada Inn 36'135 54'750
Island Inn 30'551 49'275
Quality Inn 49'823 63'875
Days Hotel 32'412 43'800
401'518 562'830
Bernard Jaquier - Novembre 2010

1414
Secondary competitors : supply & Demand - Year 2009
Hotels Rooms sold Supply
Red Roof Inn 16'462 20'075
Super 8 17'794 22'813
Microtel 8'213 9'125
Residence Inn 6'956 9'034
Delta Inn 7'634 12'118
Four Seasons 49'275 68'438
106'333 141'602
Bernard Jaquier - Novembre 2010

1515
Total supply & Demand - Year 2009
Rooms sold Supply
Primary 401'518 562'830
Secondary 106'333 141'602
Total Market 507'851 704'432
Bernard Jaquier - Novembre 2010

1616
Fair Share
The fair share for a given property is that
property's room count as a percent of the
total room count in the competitive set
Bernard Jaquier - Novembre 2010

1717
Fair Share
Hotels Occupancy Rooms Rooms Sold Fair Share
A 80% 200 160 40%
B 60% 300 180 60%
Market 68% 500 340
markettheonavailableRooms
HotelaofavailableRoomsShareFair
⋅⋅⋅⋅
⋅⋅⋅⋅=⋅
Bernard Jaquier - Novembre 2010

18
Primary Competitors 2009 Fair Share
Hotels OCC% HARC Rooms sold Fair share
Embassy Suites 78.00% 200 56'940 10.4%
Hilton Inn 72.00% 275 72'270 14.2%
Radisson Hotel 68.00% 250 62'050 13.0%
Holiday Inn 73.00% 175 46'629 9.1%
Courtyard 65.00% 62 14'710 3.2%
Ramada Inn 66.00% 150 36'135 7.8%
Island Inn 62.00% 135 30'551 7.0%
Quality Inn 78.00% 175 49'823 9.1%
Days Hotel 74.00% 120 32'412 6.2%
71.3% 1542 401'518 79.9%
Bernard Jaquier - Novembre 2010

19
Secondary Competitors 2009 Fair Share
Hotels OCC% Eff HARC Rooms sold Fair share
Red Roof Inn 82.00% 55 16'462 2.8%
Super 8 78.00% 63 17'794 3.2%
Microtel 90.00% 25 8'213 1.3%
Residence Inn 77.00% 25 6'956 1.3%
Delta Inn 63.00% 33 7'634 1.7%
Four Seasons 72.00% 188 49'275 9.7%
75.1% 388 106'333 20.1%
Bernard Jaquier - Novembre 2010

20
Market Competitors 2009 Fair Share
OCC% HARC Rooms sold Fair share
Primary 71.3% 1'542 401'518 79.90%
Seconday 75.1% 388 106'333 20.10%
Total Market 72.1% 1'930 507'851 100.00%
Bernard Jaquier - Novembre 2010

2121
Market Penetration
The market penetration is used to assess
the relative competitiveness of each hotel,
as a whole and within each market segment.
OccupancyMarket
OccupancyHotelfactornPenetratioOverall
⋅
⋅=⋅⋅
Bernard Jaquier - Novembre 2010

2222
Overall Market Penetration FactorExample
Hotels OCC Rooms Fair Share
Rooms
Sold Market Segment % Market Segment Rooms Sold
Comm Meet Leis Comm Meetg Leisure
A 80% 200 40 % 160 60% 10% 30% 35040 5840 17520
B 60% 300 60 % 180 50% 30% 20% 32850 19710 13140
Market 68% 500 340 67890 25550 30660
Bernard Jaquier - Novembre 2010

2323
Overall Market Penetration Factor
Market Segment PEN factors
Hotels Overall PEN Commercial Meeting Leisure
A 118% 129% 57% 143%
B 88% 81% 129% 71%
%118%68
%80)( ==AOMPF
Bernard Jaquier - Novembre 2010

2424
The market segment penetration factor (MSPF)
The market segment penetration factor
(MSPF) results from calculating the within
segment actual rooms sold as a percent of
the within segment fair share
• Example :
soldRoomsCommercialTotalShareFair
soldRoomsCommercialMSPFCommercial
⋅⋅⋅×⋅
⋅⋅=⋅
Bernard Jaquier - Novembre 2010

2525
The market segment penetration
factor (MSPF)
Market Segment PEN factors
Hotels Overall PEN Commercial Meeting Leisure
A 118% 129% 57% 143%
B 88% 81% 129% 71%
%129156'27
040'35
890'67%40
040'35)( ==
×
=AMSPF
Bernard Jaquier - Novembre 2010

26
Overall Market Penetration
Primary : OCC OMP
Embassy Suites 78.0% 108.2%
Hilton Inn 72.0% 99.9%
Radisson Hotel 68.0% 94.3%
Holiday Inn 73.0% 101.3%
Courtyard 65.0% 90.2%
Ramada Inn 66.0% 91.5%
Island Inn 62.0% 86.0%
Quality Inn 78.0% 108.2%
Days Hotel 74.0% 102.6%
Total Primary 71.3% 99.0%
Bernard Jaquier - Novembre 2010

27
Overall Market Penetration
Secondary OCC OMP
Red Roof Inn 82% 113.7%
Super 8 78% 108.2%
Microtel 90% 124.8%
Residence Inn 77% 106.8%
Delta Inn 63% 87.4%
Four Seasons 72% 99.9%
Total Secondary 75.1% 104.2%
Market 72.1% 100.0%
%7.113%1.72
%82Re)(Re ==
⋅
⋅⋅=⋅
OccupancyMarket
OccupancyRoofdRoofdOMPF
Bernard Jaquier - Novembre 2010
28
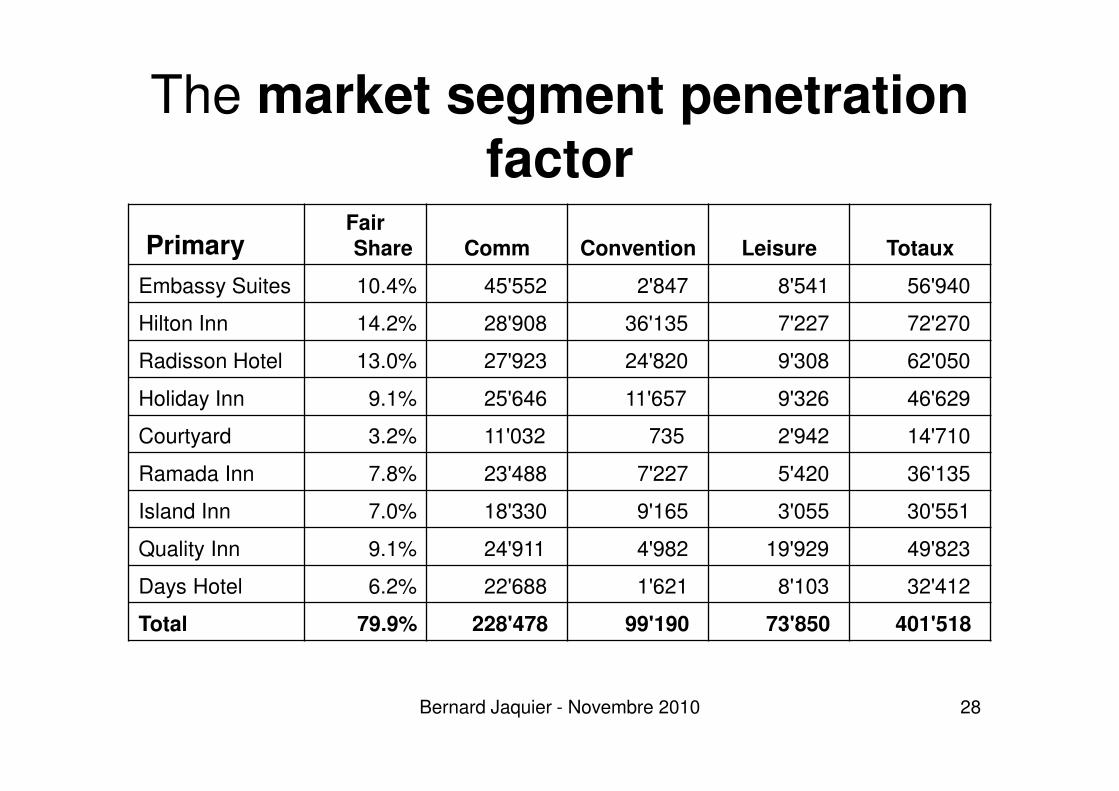
The market segment penetration
factor
PrimaryFair
Share Comm Convention Leisure Totaux
Embassy Suites 10.4% 45'552 2'847 8'541 56'940
Hilton Inn 14.2% 28'908 36'135 7'227 72'270
Radisson Hotel 13.0% 27'923 24'820 9'308 62'050
Holiday Inn 9.1% 25'646 11'657 9'326 46'629
Courtyard 3.2% 11'032 735 2'942 14'710
Ramada Inn 7.8% 23'488 7'227 5'420 36'135
Island Inn 7.0% 18'330 9'165 3'055 30'551
Quality Inn 9.1% 24'911 4'982 19'929 49'823
Days Hotel 6.2% 22'688 1'621 8'103 32'412
Total 79.9% 228'478 99'190 73'850 401'518
Bernard Jaquier - Novembre 2010

29
The market segment penetration
factorSecondary Fair Share Comm Convention Leisure Totaux
Red Roof Inn 2.8% 9'877 823 5'762 16'462
Super 8 3.2% 10'676 890 6'228 17'794
Microtel 1.3% 6'159 - 2'053 8'213
Residence Inn 1.3% 3'826 696 2'435 6'956
Delta Inn 1.7% 4'962 763 1'909 7'634
Four Seasons 9.7% 29'565 14'783 4'928 49'275
Total 20.1% 65'066 17'954 23'313 106'333
Total market 100.0% 293'544 117'144 97'164 507'851 Bernard Jaquier - Novembre 2010

30
The market segment penetration
factorMarket Segment Rooms Sold
Primary OCC Comm Convention Leisure
Embassy Suites 78.0% 150% 23% 85%
Hilton Inn 72.0% 69% 216% 52%
Radisson Hotel 68.0% 73% 164% 74%
Holiday Inn 73.0% 96% 110% 106%
Courtyard 65.0% 117% 20% 94%
Ramada Inn 66.0% 103% 79% 72%
Island Inn 62.0% 89% 112% 45%
Quality Inn 78.0% 94% 47% 226%
Days Hotel 74.0% 124% 22% 134%
Total Primary 71.3% 97.4% 106.0% 95.1%
Bernard Jaquier - Novembre 2010

31
The market segment penetration factor
Market Segment Rooms Sold
Secondary :
OCC Comm Convention Leisure
Red Roof Inn 82% 118% 25% 208%
Super 8 78% 112% 23% 198%
Microtel 90% 162% 0% 163%
Residence Inn 77% 102% 46% 195%
Delta Inn 63% 98% 38% 114%
Four Seasons 72% 104% 130% 52%
Total Secondary 75.1% 110.3% 76.2% 119.4%
All segments 72.1% 100.0% 100.0% 100.0%
%118544'293%8.2
877'9)(Re =
×
=⋅⋅ RoofdMSPFCommercial
Bernard Jaquier - Novembre 2010

32
Following Steps
• Forecast Market Demand
• Forecast Market Supply
Bernard Jaquier - Novembre 2010

33
Forcast Market DemandGrowth Rates
Commercial Convention Leisure
2010 5.00% 2.00% 1.50%
2011 4.00% 2.50% 1.50%
2012 3.00% 2.75% 1.50%
2013 3.00% 2.75% 1.50%
2014 3.00% 2.75% 1.50%
2015 3.00% 2.75% 1.50%
2016 3.00% 2.75% 1.50%
2017 3.00% 2.75% 1.50%
2018 3.00% 2.75% 1.50%
2019 3.00% 2.75% 1.50%
Bernard Jaquier - Novembre 2010

34
Forcast Market Demand
Commercial Convention Leisure Total
2009 293'544 117'144 97'164 507'851
2010 308'221 119'487 98'621 526'329
2011 320'550 122'474 100'100 543'124
2012 330'166 125'842 101'602 557'610
2013 340'071 129'303 103'126 572'500
2014 350'273 132'859 104'673 587'805
2015 360'782 136'512 106'243 603'537
2016 371'605 140'266 107'837 619'708
2017 382'753 144'124 109'454 636'331
2018 394'236 148'087 111'096 653'419
2019 406'063 152'159 112'762 670'985
Bernard Jaquier - Novembre 2010

35
Forecast Market Supply2009 2010 2011 2012 2013
Existing rooms Primary 1'542 1'542 1'542 1'542 1'542
Existing rooms Secondary 388 388 388 388 388
Change in HARC (Courtyard) 62 62 62 62
Sheraton project (new hotel) 250 250
Marriott (new hotel) 200 200 200
Best Western (new hotel) 35 140 140 140
Total new rooms - 97 305 250 -
Total Rooms 1'930 2'027 2'332 2'582 2'582
LT Supply Growth 2,93%/year 76
Total Supply 1'930 2'027 2'332 2'582 2'658
Total Rooms Nights available (Supply) 704'450 739'855 851'180 942'430 970'043
Total demand 507'851 526'329 543'124 557'610 572'500
Occupancy 72.09% 71.14% 63.81% 59.17% 59.02%
Bernard Jaquier - Novembre 2010
36
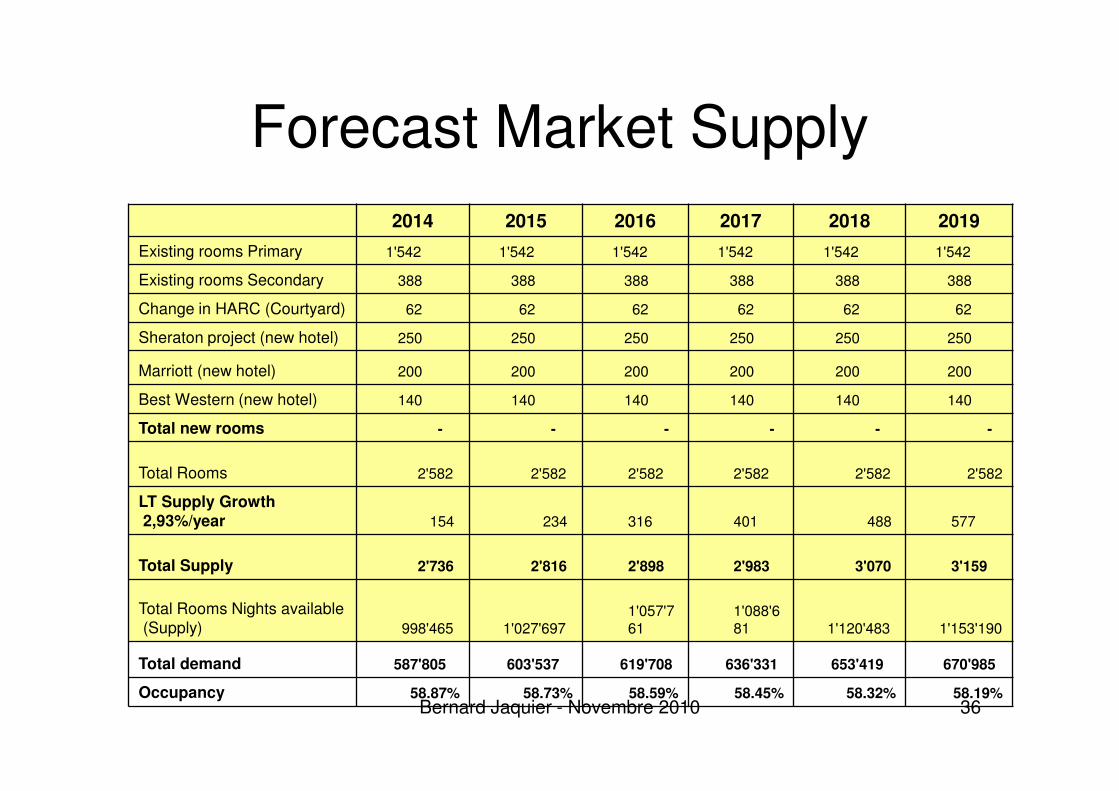
Forecast Market Supply
2014 2015 2016 2017 2018 2019
Existing rooms Primary 1'542 1'542 1'542 1'542 1'542 1'542
Existing rooms Secondary 388 388 388 388 388 388
Change in HARC (Courtyard) 62 62 62 62 62 62
Sheraton project (new hotel) 250 250 250 250 250 250
Marriott (new hotel) 200 200 200 200 200 200
Best Western (new hotel) 140 140 140 140 140 140
Total new rooms - - - - - -
Total Rooms 2'582 2'582 2'582 2'582 2'582 2'582
LT Supply Growth2,93%/year 154 234 316 401 488 577
Total Supply 2'736 2'816 2'898 2'983 3'070 3'159
Total Rooms Nights available
(Supply) 998'465 1'027'697 1'057'761
1'088'681 1'120'483 1'153'190
Total demand 587'805 603'537 619'708 636'331 653'419 670'985
Occupancy 58.87% 58.73% 58.59% 58.45% 58.32% 58.19%Bernard Jaquier - Novembre 2010

37
Long Term Supply Growth Rate
Years Room Night Supply ∆%RNS
2000 990'083
2001 1'018'286 2.85%
2002 1'028'256 0.98%
2003 1'036'876 0.84%
2004 1'058'952 2.13%
2005 1'109'618 4.78%
2006 1'165'655 5.05%
2007 1'205'831 3.45%
2008 1'238'459 2.71%
2009 1'283'078 3.60%
Annual Average Growth Rate 2.93%
Bernard Jaquier - Novembre 2010

38
New Rooms from 2013
Year Rooms Add Rooms Rooms cumul
2012 2'582
2013 2'658 76 76
2014 2'733 78 154
2015 2'811 80 234
2016 2'891 82 316
2017 2'974 85 401
2018 3'058 87 488
2019 3'145 90 577
Bernard Jaquier - Novembre 2010

39
Forecast Market D & S
Year Supply Demand Occupancy
2009 704'450 507'851 72.09%
2010 739'855 526'329 71.14%
2011 851'180 543'124 63.81%
2012 942'430 557'610 59.17%
2013 970'043 572'500 59.02%
2014 998'465 587'805 58.87%
2015 1'027'697 603'537 58.73%
2016 1'057'761 619'708 58.59%
2017 1'088'681 636'331 58.45%
2018 1'120'483 653'419 58.32%
2019 1'153'190 670'985 58.19%
Bernard Jaquier - Novembre 2010

40
Forecast Market D & S
450'000
550'000
650'000
750'000
850'000
950'000
1'050'000
1'150'000
2009 2010 2011 2012 2013 2014 2015 2016 2017 2018 2019
Years
Supply Demand
Bernard Jaquier - Novembre 2010

41
Next Steps
• Forecast Revenues & Costs
• Valuation
Bernard Jaquier - Novembre 2010

Sources
• Source : Hotels & Motels Valuations And
Market Studies, S. Rushmore, Eric Baum,
2001
• Real Estate course, Bernard Jaquier
Bernard Jaquier - Novembre 2010 42