Embed Size (px)
Citation preview
Defence Research and Development Canada External Literature (P) DRDC-RDDC-2021-P076 March 2021
CAN UNCLASSIFIED
CAN UNCLASSIFIED
Chapter 09: Managing the Personnel Resources of a Military Occupation:
Attrition Forecasting And Production Planning
Lynne Serré DRDC – Centre for Operational Research and Analysis RCAF Defence Economics Canadian Forces Aerospace Warfare Centre ISBN: 978-0-660-29729-3 Pages 241 to 260 Date of Publication from Ext Publisher: July 2019
Terms of Release: This document is approved for public release. The body of this CAN UNCLASSIFIED document does not contain the required security banners according to DND security standards. However, it must be treated as CAN UNCLASSIFIED and protected appropriately based on the terms and conditions specified on the covering page.
Template in use: EO Publishing App for CR-EL Eng 2021-02-11.dotm
© Her Majesty the Queen in Right of Canada (Department of National Defence), 2019
© Sa Majesté la Reine en droit du Canada (Ministère de la Défense nationale), 2019
CAN UNCLASSIFIED
CAN UNCLASSIFIED
IMPORTANT INFORMATIVE STATEMENTS
This document was reviewed for Controlled Goods by Defence Research and Development Canada using the Schedule to the Defence Production Act.
Disclaimer: This document is not published by the Editorial Office of Defence Research and Development Canada, an agency of the Department of National Defence of Canada but is to be catalogued in the Canadian Defence Information System (CANDIS), the national repository for Defence S&T documents. Her Majesty the Queen in Right of Canada (Department of National Defence) makes no representations or warranties, expressed or implied, of any kind whatsoever, and assumes no liability for the accuracy, reliability, completeness, currency or usefulness of any information, product, process or material included in this document. Nothing in this document should be interpreted as an endorsement for the specific use of any tool, technique or process examined in it. Any reliance on, or use of, any information, product, process or material included in this document is at the sole risk of the person so using it or relying on it. Canada does not assume any liability in respect of any damages or losses arising out of or in connection with the use of, or reliance on, any information, product, process or material included in this document.
Managing the Personnel Resources of a Military Occupation: Attrition Forecasting
and Production PlanningLynne Serré
CH09
242 CH09 Managing the Personnel Resources of a Military Occupation
RCAF DEFENCE ECONOMICS
CH09 Table of ContentsIntroduction .............................................................................................................................243
Background .......................................................................................................................243
Outline .............................................................................................................................244
Overview of the Planning Models ............................................................................................244
Modelling of Occupation Intake and Production .....................................................................245
Intake distribution by entry plan .......................................................................................245
Training success rates ........................................................................................................246
School capacity and training backlogs ...............................................................................247
Modelling of Occupation Attrition...........................................................................................247
Attrition rates by years of service .......................................................................................248
Forecasting of attrition ......................................................................................................249
Forecasting of challenges and limitations ...........................................................................252
Operating the Planning Models and Evaluating the Output .....................................................252
Discussion ................................................................................................................................254
Conclusion ...............................................................................................................................255
Appendix A: Reporting Historical Attrition Rates ....................................................................256
Overall attrition rate .........................................................................................................256
YOS-based attrition rates ..................................................................................................256
Appendix B: Formulas for Forecasting TES Attrition................................................................257
Notes .......................................................................................................................................260
Additional Reading ..................................................................................................................260
243Managing the Personnel Resources of a Military Occupation CH09
RCAF DEFENCE ECONOMICS
Introduction�e Canada First Defence Strategy allocates just over half of total defence spending to the Canadian Armed Forces (CAF) and to Department of National Defence (DND) personnel: the DND’s most important resource.1 Canada’s military personnel are a highly skilled, trained and diverse workforce, and Regular Force (Reg F) personnel are employed in just over 100 di�erent military occupations, many of which are also found in the Reserve Force (Res F). One of the primary tools used to manage the health of occupations within the CAF is the Annual Military Occupation Review (AMOR). An occupation is said to be healthy if it has su�cient quali�ed personnel to meet its operational require-ments. Knowledge of attrition plays a crucial role in e�ectively managing an occupation’s health, and attrition forecasts are needed in order to plan the annual recruitment and training of CAF members, as well as for budgeting purposes.
Background
�e AMOR is a military personnel management tool that provides occupation authorities, occu-pation advisors, branch advisors, training authorities and other DND/CAF representatives with a forum to discuss and address internal and external issues that may impact the health of an occupa-tion.2 Examples of internal issues a�ecting the health of occupations include retention strategies, career advancement opportunities, limitations on recruitment and training capacity, compensation and bene�ts, advanced training opportunities, and deployment opportunities. Examples of external issues include changes to industry accreditation standards and pay rates and employment opportun-ities in comparable civilian occupations.
�e health of an occupation can be measured by comparing the size of its trained e�ective strength (TES) to its preferred manning level (PML). �e TES is the number of personnel who have reached the operationally functional point (OFP) for their occupation. �e OFP is reached when personnel have completed all training and quali�cations required for �rst employment in their occupation.3 �e PML is the number of authorized positions for each occupation and rank, and is used to establish the target size for the TES. �us, an occupation is healthy if its TES is close to its PML.4
�e amount of time and training needed for new recruits to reach the OFP depends on their occupa-tion as well as the entry plan through which they enrolled. For example, a new recruit who enrolled through a university training plan must �rst complete his/her university degree before starting occu-pational training, and thus can take up to four or more years to reach the OFP, compared to a recruit who enrolled with a degree.
When a recruit reaches the OFP, an employable member is said to have been produced. �us, for an occupation to stay healthy, its annual production must match annual attrition as closely as possible. Since it can take several years for a new recruit to reach the OFP, attrition forecasting plays a crucial role in maintaining an occupation’s health because recruitment needs must be established well in advance. Attrition forecasting in support of the AMOR is conducted each year by the Director General Military Personnel Research and Analysis (DGMPRA), a research centre within Defence Research and Development Canada (DRDC).
244 CH09 Managing the Personnel Resources of a Military Occupation
RCAF DEFENCE ECONOMICS
One of the key deliverables of the AMOR is the recommended intake needed to meet the production requirements that will either maintain or restore the health of an occupation. �e recommendations from each AMOR are used as the starting point for the development of the CAF’s strategic intake plan (SIP), which de�nes the recruitment plan for the following year. �e SIP aligns the AMOR recommendations with the CAF’s strategic interests, while taking �nancial constraints into account.5
Outline�e purpose of this chapter is to describe the process by which the attrition behaviour of a CAF occu-pation is analyzed and used to forecast future attrition volumes in order to inform the annual intake and production planning that occurs in the AMOR. �e chapter is organized as follows: the second section provides an overview of the planning models used in the AMOR by the Royal Canadian Air Force (RCAF). �e planning models have two main components. �e �rst component, discussed in the third section, focuses on the modelling of intake and production. �e second component, outlined in the fourth section, focuses on attrition forecasting. �e �fth section explains how the planning model is used in the AMOR and how AMOR stakeholders should assess the model output, and possibly discuss retention and recruitment strategies. �e sixth section discusses how in some cases, the current metric of comparing an occupation’s TES to its PML may not re�ect the occupation’s true health. At the end of the chapter, the seventh section provides a summary of the chapter’s main points.
Overview of the Planning ModelsPlanning models are used during the AMOR to determine the annual intake needed to meet the production requirements that will maintain or restore the health of an occupation. Forecasted attrition volumes play a key role in these models because attrition is often the driving force behind production and intake requirements. Future production and intake requirements can also be driven by growth or a reduction in an occupation’s PML, as well as by an existing personnel shortage or surplus.
�e planning models used by the RCAF were designed and developed by the DGMPRA, and tailored to each o�cer and non-commissioned member occupation to accommodate di�erences in their training systems. Each planning model has the same overall structure, which can be divided into two components. �e �rst component, described in more detail in the third section, focuses on determin-ing the intake needed so that the annual production targets either maintain or restore the occupation to a healthy level. �e second component forecasts TES attrition and the TES population using the methodology outlined in the fourth section. �e two components of the model are interdependent. Attrition volumes in�uence production requirements because production targets must be set in order to �ll vacancies arising from attrition. At the same time, production in�uences attrition volumes because annual production in�uences the size of the TES.
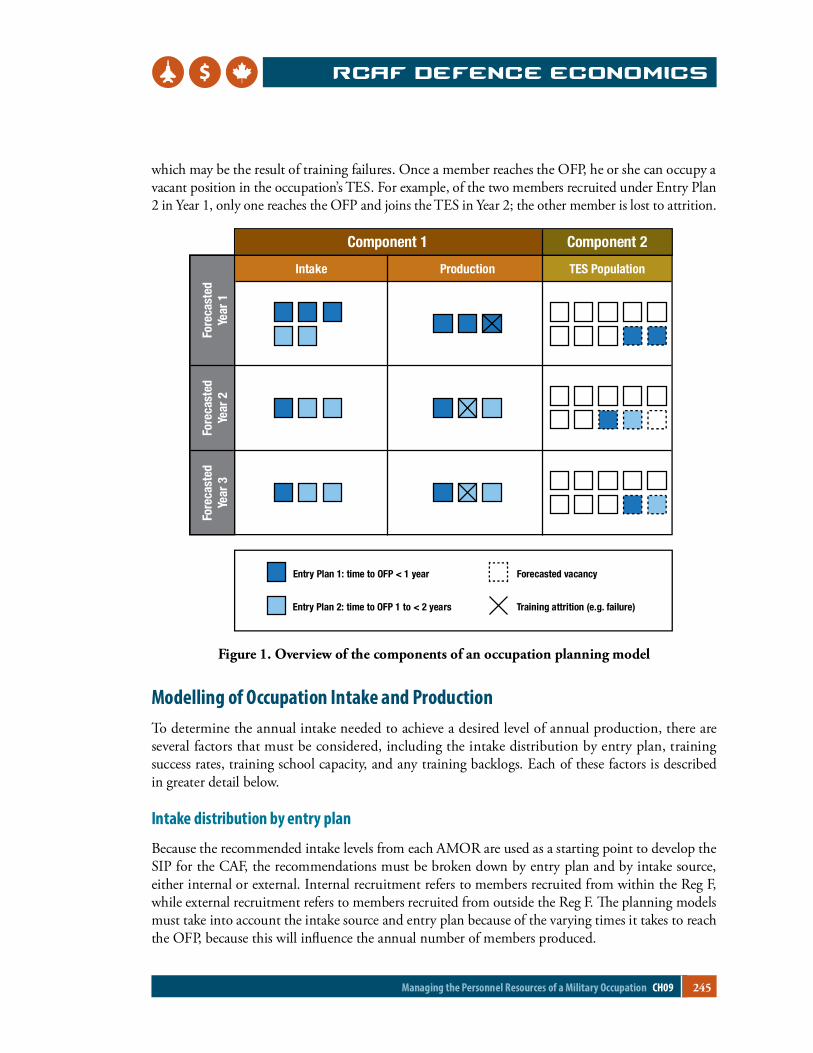
Figure 1 illustrates the two components of the planning model for an occupation with two entry plans. �e intake column represents the number of members recruited, while the production column repre-sents the number of recruited members who reach the OFP. In this example, the intake column shows �ve new members recruited in Year 1, three in Year 2, and three in Year 3. Members recruited under Entry Plan 1 reach the OFP in the same year they were recruited, while members recruited under Entry Plan 2 reach the OFP in the year after they were recruited. Both entry plans are subject to attrition,
245Managing the Personnel Resources of a Military Occupation CH09
RCAF DEFENCE ECONOMICS
which may be the result of training failures. Once a member reaches the OFP, he or she can occupy a vacant position in the occupation’s TES. For example, of the two members recruited under Entry Plan 2 in Year 1, only one reaches the OFP and joins the TES in Year 2; the other member is lost to attrition.
Component 1
Intake
Fore
cast
edYe
ar 1
Fore
cast
edYe
ar 2
Fore
cast
edYe
ar 3
Production TES Population
Component 2
Entry Plan 1: time to OFP < 1 year
Entry Plan 2: time to OFP 1 to < 2 years
Forecasted vacancy
Training attrition (e.g. failure)
Figure 1. Overview of the components of an occupation planning model
Modelling of Occupation Intake and ProductionTo determine the annual intake needed to achieve a desired level of annual production, there are several factors that must be considered, including the intake distribution by entry plan, training success rates, training school capacity, and any training backlogs. Each of these factors is described in greater detail below.
Intake distribution by entry plan
Because the recommended intake levels from each AMOR are used as a starting point to develop the SIP for the CAF, the recommendations must be broken down by entry plan and by intake source, either internal or external. Internal recruitment refers to members recruited from within the Reg F, while external recruitment refers to members recruited from outside the Reg F. �e planning models must take into account the intake source and entry plan because of the varying times it takes to reach the OFP, because this will in�uence the annual number of members produced.
246 CH09 Managing the Personnel Resources of a Military Occupation
RCAF DEFENCE ECONOMICS
For external recruitment, entry plans can be grouped into two categories: Direct Entry and Paid Education. An applicant who enrolls through a Direct Entry plan would have already met the educa-tion requirements of the occupation, while an applicant who enrolls through a Paid Education plan would still have to complete his/her college or university studies. For a given occupation, the time to reach the OFP for those enrolling through Paid Education plans will be longer than those enrolling through Direct Entry plans because college or university studies must be completed in addition to occupation training. Although Paid Education plans require more time to reach the OFP, applicants who enroll through these plans will also have a longer period of mandatory service.
Component transfers from the Res F are also a form of external recruitment and provide a valuable source of trained military personnel. Reservists who are already trained in an occupation that also exists in the Reg F may transfer directly to the TES and therefore have the shortest time to OFP. Since Reservists may not have completed all of their training or may choose to change occupations, they may transfer through any of the external entry plans, including Paid Education plans.6
Internal recruitment is a valuable source of experienced military personnel. �ere are a variety of entry plans for internal recruitment purposes, including paid education options as well as mechanisms to enable non-commissioned members to go into o�cer occupations. Some occupations, for example, a supervisory trade with no junior ranking positions, are only open to internal recruitment, while other occupations depend on a mix of internal and external applicants. Although internal recruitment is a valuable source of experienced personnel, when members move from one occupation to another, they create a vacancy in the occupation from which they left. �erefore, depending on the health of an occu-pation, the total number of members permitted to move to another occupation may be very limited.
�e intake distribution by entry plan will vary from one occupation to another, depending on the occupation’s ability to attract internal and external applicants through each entry plan, as well as the need for skilled versus unskilled applicants. Additionally, the distribution by entry plan may vary from year to year, depending on production targets and the respective times to OFP of each entry plan. For example, an occupation that is below PML may increase the proportion of intake targeted through a Direct Entry plan rather than a Paid Education plan because of the shorter time to OFP. Conversely, an occupation that is above PML may increase the proportion of intake targeted through a Paid Education plan in order to keep production lower in the shorter term.
Training success rates
Training from the time of enrolment to OFP can be divided into three phases: (1) university or college studies, (2) basic military training, and (3) occupational training. �e �rst phase applies only to those who enrolled through a Paid Education entry plan. �e second phase, basic military training, applies to all military members, and, for those who enrolled through a Paid Education entry plan, is typically completed concurrently with Phase 1. �e third phase consists of one or more courses speci�c to the occupation.
Each phase of training is subject to training failures, which may result in the member releasing or being reassigned to another occupation for which he/she is better suited. Additionally, because train-ing can take months or even years, members may fail to reach the OFP for reasons other than training
247Managing the Personnel Resources of a Military Occupation CH09
RCAF DEFENCE ECONOMICS
failures. For example, a member may choose to voluntarily release during basic training or may su�er an injury during occupational training that results in a medical release. �e training success rates used in the planning models should re�ect the proportion of the intake expected to reach the OFP regardless of the reason.
School capacity and training backlogs
Annual intake and production must be planned in accordance with the capacity of the training school. �is is one reason why an occupation’s return to PML may be planned over several years. Alternatively, it may be possible to increase a school’s training capacity on a short-term basis to help the occupa-tion recover more quickly.
Minimum course capacity should also be considered so that a su�cient number of personnel are available for the course to be given. To optimize the use of training resources, intake should be planned in terms of multiples of the course capacity, so that courses are given at maximum capacity. Depending on the occupation, it is possible that both Reg F and Res F members may take the same course. �erefore, the number of Reservists who may start training should also be taken into account, because this reduces the course capacity for Reg F recruits. However, Reservists have lower training priority than Reg F members.
�e number of personnel awaiting training is another factor to consider when planning future intake and production. Depending on the number of personnel awaiting training and their expected wait time, it may be desirable to reduce intake in the near term in order to clear the training backlog.
Modelling of Occupation AttritionWhen the CAF’s Reg F population as a whole is considered, attrition is de�ned as releases from the Reg F, which includes members leaving for voluntary or medical reasons and members who have completed their service. For the AMOR, attrition forecasting is done at the occupation level. �erefore, the de�nition of attrition must be expanded to include transfers to another occupation, because members who transfer out of an occupation create vacant positions that will need to be �lled. �is expanded de�nition of attrition is especially important when modelling occupations that feed into other occupations because releases alone may severely under-represent the annual number of vacan-cies created by departures.
An attrition rate is de�ned as the proportion of members in a given population that release or transfer out within a speci�ed period of time. �e method used to calculate and report attrition rates must be selected in such a way as to be compatible with the type, format and meaning of the available person-nel data. �e DGMPRA’s historical personnel database consists of year-end snapshots of the Reg F population extracted from DND’s Human Resources Management System. For reporting and fore-casting purposes, the DGMPRA calculates annual attrition rates using a method that accounts for the fact that recruits and transfers arrive throughout the year. Details can be found in the appendices.
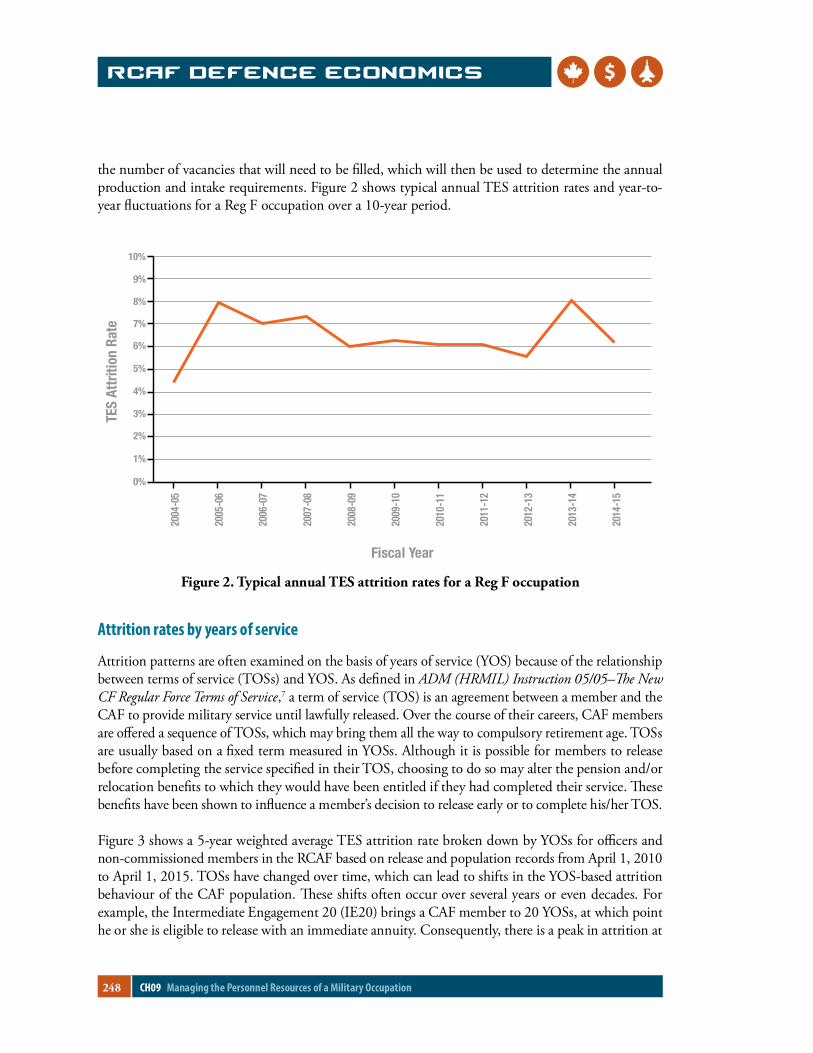
Within the context of the AMOR, attrition reporting and forecasting is done for an occupation’s TES. Future releases and transfers out from an occupation’s TES are forecasted in order to determine
248 CH09 Managing the Personnel Resources of a Military Occupation
RCAF DEFENCE ECONOMICS
the number of vacancies that will need to be �lled, which will then be used to determine the annual production and intake requirements. Figure 2 shows typical annual TES attrition rates and year-to-year �uctuations for a Reg F occupation over a 10-year period.
0%
1%
2%
3%
4%
5%
6%
7%
8%
9%
10%
TES
Attr
ition
Rat
e
2014
-15
2013
-14
2012
-13
2011
-12
2010
-11
2009
-10
2008
-09
2007
-08
2006
-07
2005
-06
2004
-05
Fiscal Year
Figure 2. Typical annual TES attrition rates for a Reg F occupation
Attrition rates by years of service
Attrition patterns are often examined on the basis of years of service (YOS) because of the relationship between terms of service (TOSs) and YOS. As de�ned in ADM (HRMIL) Instruction 05/05–�e New CF Regular Force Terms of Service,7 a term of service (TOS) is an agreement between a member and the CAF to provide military service until lawfully released. Over the course of their careers, CAF members are o�ered a sequence of TOSs, which may bring them all the way to compulsory retirement age. TOSs are usually based on a �xed term measured in YOSs. Although it is possible for members to release before completing the service speci�ed in their TOS, choosing to do so may alter the pension and/or relocation bene�ts to which they would have been entitled if they had completed their service. �ese bene�ts have been shown to in�uence a member’s decision to release early or to complete his/her TOS.
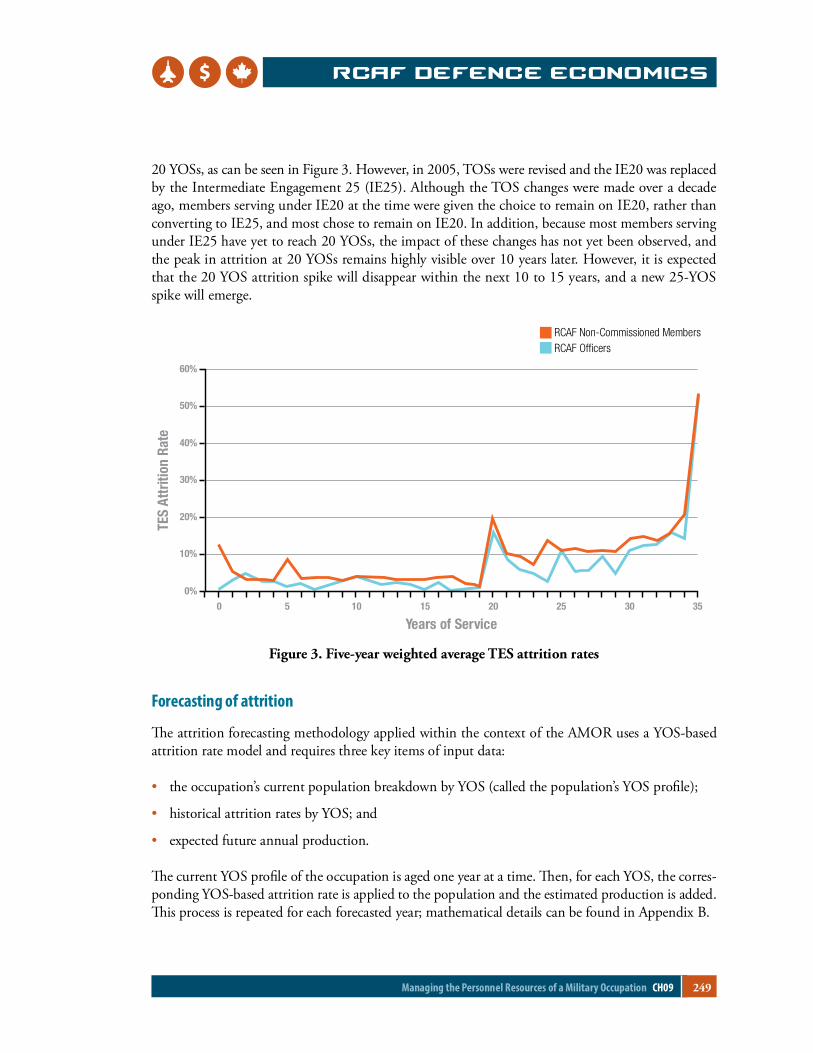
Figure 3 shows a 5-year weighted average TES attrition rate broken down by YOSs for o�cers and non-commissioned members in the RCAF based on release and population records from April 1, 2010 to April 1, 2015. TOSs have changed over time, which can lead to shifts in the YOS-based attrition behaviour of the CAF population. �ese shifts often occur over several years or even decades. For example, the Intermediate Engagement 20 (IE20) brings a CAF member to 20 YOSs, at which point he or she is eligible to release with an immediate annuity. Consequently, there is a peak in attrition at
249Managing the Personnel Resources of a Military Occupation CH09
RCAF DEFENCE ECONOMICS
20 YOSs, as can be seen in Figure 3. However, in 2005, TOSs were revised and the IE20 was replaced by the Intermediate Engagement 25 (IE25). Although the TOS changes were made over a decade ago, members serving under IE20 at the time were given the choice to remain on IE20, rather than converting to IE25, and most chose to remain on IE20. In addition, because most members serving under IE25 have yet to reach 20 YOSs, the impact of these changes has not yet been observed, and the peak in attrition at 20 YOSs remains highly visible over 10 years later. However, it is expected that the 20 YOS attrition spike will disappear within the next 10 to 15 years, and a new 25-YOS spike will emerge.
RCAF Non-Commissioned MembersRCAF Officers
0%
0 5 10 15 20 25 30 35
10%
20%
30%
40%
50%
60%
TES
Attr
ition
Rat
e
Years of Service
Figure 3. Five-year weighted average TES attrition rates
Forecasting of attrition
�e attrition forecasting methodology applied within the context of the AMOR uses a YOS-based attrition rate model and requires three key items of input data:
• the occupation’s current population breakdown by YOS (called the population’s YOS pro�le);
• historical attrition rates by YOS; and
• expected future annual production.
�e current YOS pro�le of the occupation is aged one year at a time. �en, for each YOS, the corres-ponding YOS-based attrition rate is applied to the population and the estimated production is added. �is process is repeated for each forecasted year; mathematical details can be found in Appendix B.
250 CH09 Managing the Personnel Resources of a Military Occupation
RCAF DEFENCE ECONOMICS
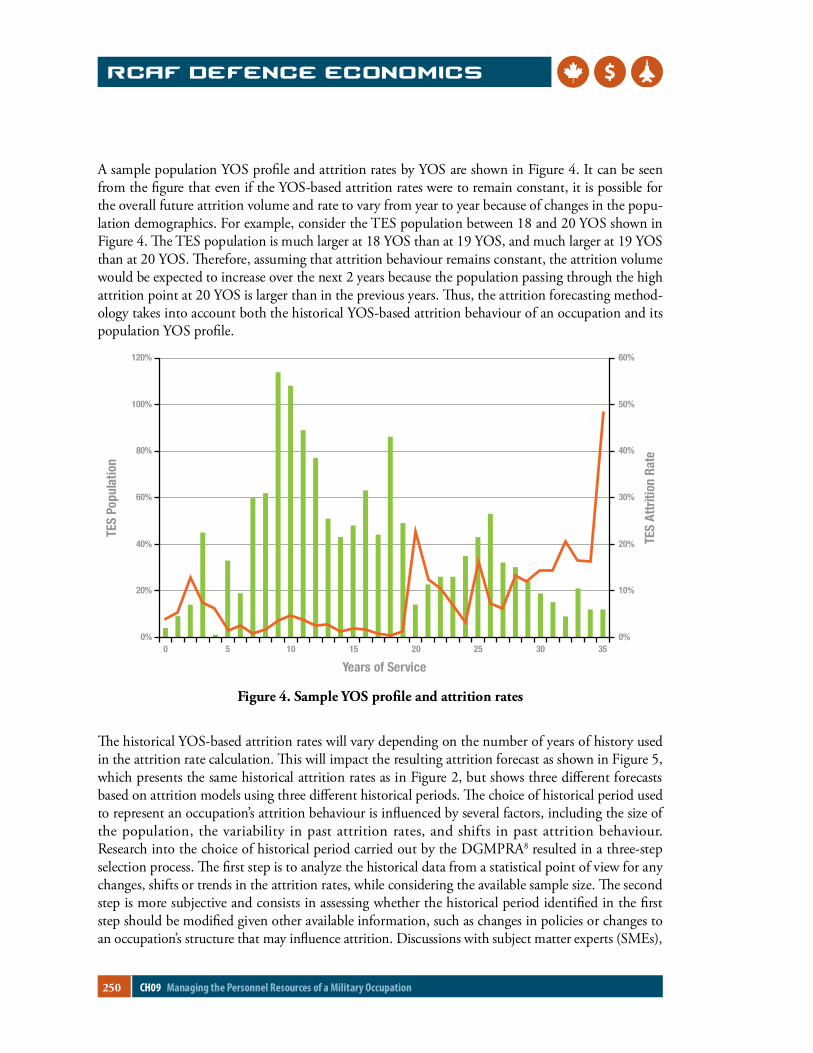
A sample population YOS pro�le and attrition rates by YOS are shown in Figure 4. It can be seen from the �gure that even if the YOS-based attrition rates were to remain constant, it is possible for the overall future attrition volume and rate to vary from year to year because of changes in the popu-lation demographics. For example, consider the TES population between 18 and 20 YOS shown in Figure 4. �e TES population is much larger at 18 YOS than at 19 YOS, and much larger at 19 YOS than at 20 YOS. �erefore, assuming that attrition behaviour remains constant, the attrition volume would be expected to increase over the next 2 years because the population passing through the high attrition point at 20 YOS is larger than in the previous years. �us, the attrition forecasting method-ology takes into account both the historical YOS-based attrition behaviour of an occupation and its population YOS pro�le.
Figure 4. Sample YOS pro�le and attrition rates
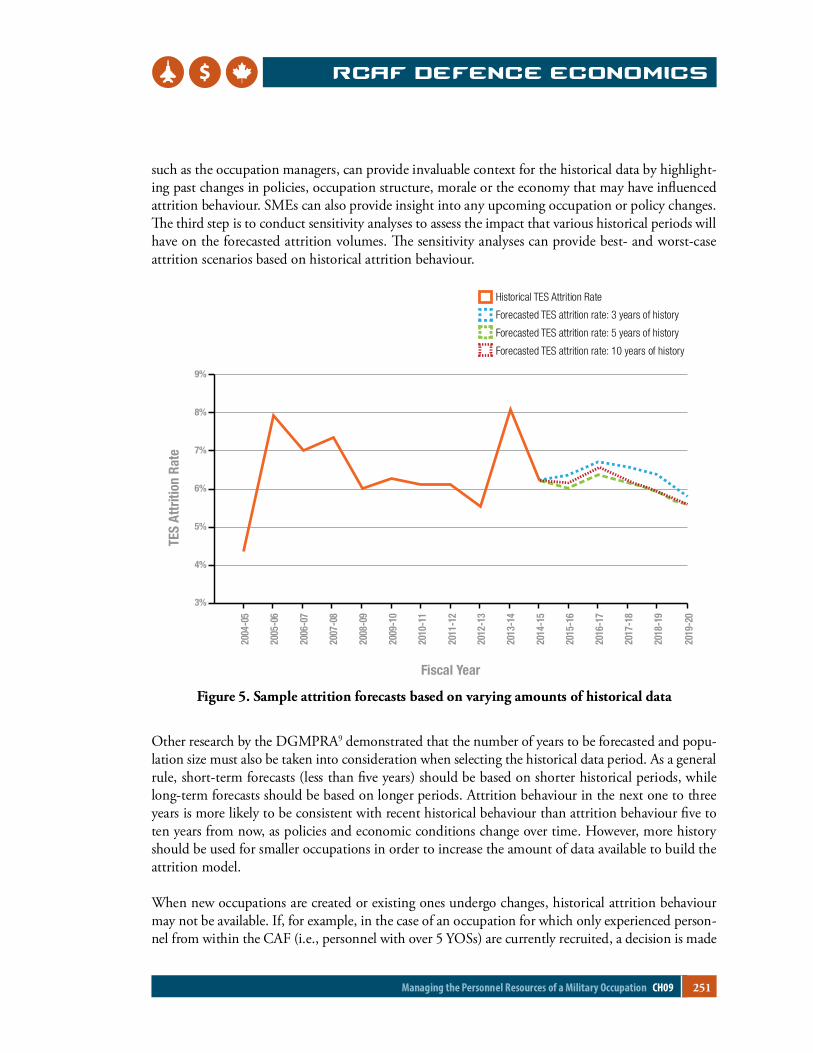
�e historical YOS-based attrition rates will vary depending on the number of years of history used in the attrition rate calculation. �is will impact the resulting attrition forecast as shown in Figure 5, which presents the same historical attrition rates as in Figure 2, but shows three di�erent forecasts based on attrition models using three di�erent historical periods. �e choice of historical period used to represent an occupation’s attrition behaviour is in�uenced by several factors, including the size of the population, the variability in past attrition rates, and shifts in past attrition behaviour. Research into the choice of historical period carried out by the DGMPRA8 resulted in a three-step selection process. �e �rst step is to analyze the historical data from a statistical point of view for any changes, shifts or trends in the attrition rates, while considering the available sample size. �e second step is more subjective and consists in assessing whether the historical period identi�ed in the �rst step should be modi�ed given other available information, such as changes in policies or changes to an occupation’s structure that may in�uence attrition. Discussions with subject matter experts (SMEs),
0%0 5 10 15 20 25 30 35
20%
40%
60%
80%
100%
120%
0%
10%
20%
30%
40%
50%
60%
TES
Popu
latio
n
TES
Attr
ition
Rat
eYears of Service
251Managing the Personnel Resources of a Military Occupation CH09
RCAF DEFENCE ECONOMICS
such as the occupation managers, can provide invaluable context for the historical data by highlight-ing past changes in policies, occupation structure, morale or the economy that may have in�uenced attrition behaviour. SMEs can also provide insight into any upcoming occupation or policy changes. �e third step is to conduct sensitivity analyses to assess the impact that various historical periods will have on the forecasted attrition volumes. �e sensitivity analyses can provide best- and worst-case attrition scenarios based on historical attrition behaviour.
Figure 5. Sample attrition forecasts based on varying amounts of historical data
Other research by the DGMPRA9 demonstrated that the number of years to be forecasted and popu-lation size must also be taken into consideration when selecting the historical data period. As a general rule, short-term forecasts (less than �ve years) should be based on shorter historical periods, while long-term forecasts should be based on longer periods. Attrition behaviour in the next one to three years is more likely to be consistent with recent historical behaviour than attrition behaviour �ve to ten years from now, as policies and economic conditions change over time. However, more history should be used for smaller occupations in order to increase the amount of data available to build the attrition model.
When new occupations are created or existing ones undergo changes, historical attrition behaviour may not be available. If, for example, in the case of an occupation for which only experienced person-nel from within the CAF (i.e., personnel with over 5 YOSs) are currently recruited, a decision is made
3%
4%
5%
6%
7%
8%
9%
TES
Attr
ition
Rat
e
2014
-15
2015
-16
2016
-17
2017
-18
2018
-19
2019
-20
2013
-14
2012
-13
2011
-12
2010
-11
2009
-10
2008
-09
2007
-08
2006
-07
2005
-06
2004
-05
Fiscal Year
Historical TES Attrition Rate
Forecasted TES attrition rate: 3 years of history
Forecasted TES attrition rate: 5 years of history
Forecasted TES attrition rate: 10 years of history
252 CH09 Managing the Personnel Resources of a Military Occupation
RCAF DEFENCE ECONOMICS
to open up the recruitment plan for that occupation to direct entry recruits, the occupation will now have members with 0 to 5 YOSs for whom there is no historical attrition behaviour. In such a case, it may be necessary to base attrition behaviour on one or more occupations with similar characteristics in order to forecast future personnel demand.
Forecasting of challenges and limitations
In the context of the AMOR, all types of attrition, whether for voluntary, medical or other reasons, in addition to transfers out of the occupation, must be forecasted because each departure creates a vacancy in the occupation’s TES. At the CAF level, from 2011 to 2015, voluntary attrition was the most common type of attrition for trained Reg F personnel, followed by medical attrition and service completion. However, the ordering and proportion of release types varies by occupation. For example, in some occupations managed by the RCAF, service completion was the most common type of attrition.
Internal factors, such as policy changes to pay and bene�ts, and external factors, such as economic conditions, can impact one or more types of attrition; and sometimes in opposite ways. For example, an increase in the compulsory retirement age may impact service completion and voluntary attrition behaviour, and perhaps medical attrition rates as well because of its potential for contributing to an aging workforce. Regardless of the type of attrition a�ected, these internal and external factors can lead to changes in the overall attrition behaviour of the occupation, often in ways that are di�cult to predict quanti�ably. Since the attrition forecasting methodology is based on past attrition behaviour, if future attrition behaviour di�ers signi�cantly from past behaviour, this will a�ect the accuracy of the forecasts. �e accuracy of the forecasts will also be a�ected by deviations in the expected production in future years, which is often dependent on whether the occupation was able to meet its recruitment targets.
An inherent challenge with occupation-level forecasting in the CAF is the size of the populations being studied: from 2011 to 2015, 80% of occupations within the RCAF averaged less than 50 releases from the TES per year and 95% of occupations averaged less than 100 releases from the TES per year. �e small release volumes pose a challenge in terms of detecting and quantifying trends between occupa-tion-level attrition and external economic factors, such as unemployment rates, as well as the lag time between changes in the economy and changes in attrition behaviour. Because of the unique nature of the work in some military occupations, the impact of economic factors likely varies by occupation and may be minimal or even negligible in some cases.
Operating the Planning Models and Evaluating the Output�e planning models are spreadsheet-based models designed to allow interactive and instantaneous what-if scenario analysis to be conducted during the AMOR meeting while all stakeholders are present. Each year, in advance of the AMOR meetings, the DGMPRA populates the planning model for each occupation with the needed historical data and current TES population and conducts the attrition forecasting. Model inputs, such as intake distribution by entry plan and training success rates, are validated by the occupation managers and updated as needed.
253Managing the Personnel Resources of a Military Occupation CH09
RCAF DEFENCE ECONOMICS
�e planning models provide three key outputs:
• an attrition forecast over the next �ve to ten years;
• the projected gap between the TES and PML over the next �ve to ten years; and
• the annual intake by entry plan needed to meet the production requirements over the next �ve to ten years.
�e third output is one of the key deliverables of the AMOR and provides a starting point for draw-ing up the CAF’s SIP.
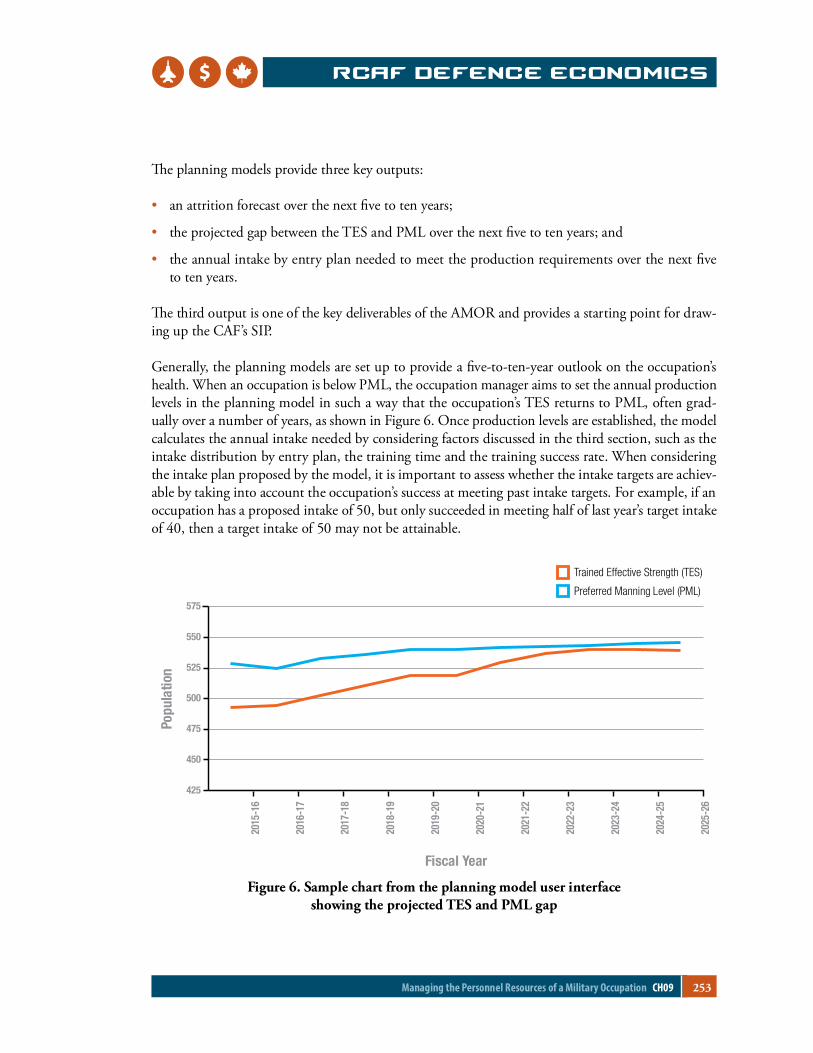
Generally, the planning models are set up to provide a �ve-to-ten-year outlook on the occupation’s health. When an occupation is below PML, the occupation manager aims to set the annual production levels in the planning model in such a way that the occupation’s TES returns to PML, often grad-ually over a number of years, as shown in Figure 6. Once production levels are established, the model calculates the annual intake needed by considering factors discussed in the third section, such as the intake distribution by entry plan, the training time and the training success rate. When considering the intake plan proposed by the model, it is important to assess whether the intake targets are achiev-able by taking into account the occupation’s success at meeting past intake targets. For example, if an occupation has a proposed intake of 50, but only succeeded in meeting half of last year’s target intake of 40, then a target intake of 50 may not be attainable.
Figure 6. Sample chart from the planning model user interface showing the projected TES and PML gap
Trained Effective Strength (TES)
Preferred Manning Level (PML)
425
450
475
500
525
550
575
Popu
latio
n
2025
-26
2024
-25
2023
-24
2022
-23
2021
-22
2020
-21
2019
-20
2018
-19
2017
-18
2016
-17
2015
-16
Fiscal Year
254 CH09 Managing the Personnel Resources of a Military Occupation
RCAF DEFENCE ECONOMICS
�e process of determining the production targets is often iterative. If the proposed intake is not expected to be achievable, the model user, typically the occupation manager, can adjust the produc-tion targets to reduce the annual intake. AMOR stakeholders are then able to immediately see the impact of lower intake targets on the occupation’s long-term health, which can be used to support or initiate discussions about strategies that may be required to boost annual intake, such as advertising campaigns or the use of specialized recruiters.
If stakeholders at the AMOR meeting have reason to expect that future attrition will be higher or lower than that forecast by the model, the planning model is set up so that the model user can increase or decrease the attrition forecast by a �xed percentage in order to see the potential impact on the occu-pation’s long-term health for the current set of production targets. If attrition is expected to be higher than in the recent past, the AMOR can be used as a platform to discuss new or ongoing retention initiatives while all stakeholders are present, which could include retention bonuses, advanced training opportunities, or changes to the TOS sequence. Alternatively, stakeholders may consider increasing their production targets to accommodate an anticipated increase in attrition.
It is important that the recommended intake be reviewed by the training authorities to ensure that the school has the capacity to meet the training demand. A surge in recruitment is only possible if the schools can accommodate the increased number of recruits, which may require approval and funding for additional training instructors and infrastructure, or for training options outside the CAF, such as courses o�ered by external contractors. While a surge in recruitment may be supported by the model and recommended by the stakeholders, the development of the SIP will align the recommendations from each AMOR with the CAF’s strategic interests, while taking �nancial constraints into account. In particular, the overall intake target for the CAF must align with its annual capacity to process and enroll applicants. �erefore, in some occupations, a reduction in the recommended intake may be necessary so that the overall intake goal does not exceed capacity.
DiscussionAn occupation is healthy if it has su�cient quali�ed personnel to meet its operational requirements, which is measured by comparing an occupation’s TES to its PML. However, if the PML has remained unchanged for years while the operational demands on the occupation have increased, the PML may have become outdated and is in need of review. In these cases, it is possible for an occupation to be unhealthy even though its TES is equal to its PML.
In order to review the PML of an occupation and its personnel requirements, the occupation’s oper-ational and workload requirements must be reviewed. If the number of positions is found to be insu�cient, instead of increasing the PML, it may be possible to reduce pressure on the occupation by �nding e�ciencies in administrative tasks or reassigning selected administrative and training tasks to civilian or Reservist positions. Alternatively, it may be possible to redistribute an occupation’s work-force either geographically, for example, to military bases with a higher operational tempo, or to convert positions exercising an institutional role to an operational role. If an increase in establishment size is
255Managing the Personnel Resources of a Military Occupation CH09
RCAF DEFENCE ECONOMICS
the only option, it may be di�cult to increase the occupation’s PML without impacting the health of another occupation because the total number of paid positions across all occupations within the CAF is subject to �nancial constraints.
Another aspect of occupation health is whether there are su�cient quali�ed personnel in the lower ranks to be promoted into the higher ranks when vacancies arise through attrition. If attrition is unusually high in one rank, there may not be a su�cient number of quali�ed personnel to be promoted when vacancies arise in the next rank. Previous periods of low recruitment or force reduction programs can also create experience gaps, resulting in a small pool of quali�ed personnel who are eligible for promo-tion to the next rank. Although not captured in the planning models, this aspect of health may be discussed during the AMOR.
Conclusion�e AMOR is a military personnel management tool designed to manage the health of occupations within the CAF. One of the key deliverables of AMOR meetings is the recommended intake level by entry plan for each occupation, which provides the starting point for drawing up the CAF’s SIP. Attrition forecasting plays a key role in determining the annual intake and production needed to restore and maintain an occupation’s health. Production requirements must be planned in order to �ll future vacancies arising through attrition as well as to manage any desired growth or reduction in an occupation’s PML.
�is chapter describes the process used by the DGMPRA, in support of the AMOR, to measure historical attrition behaviour, forecast future attrition volumes, and plan production and intake requirements for occupations managed by the RCAF. �is process does not always lead to healthy occupations across the RCAF, because there are many complex factors that may place an occupation in an unhealthy situation. However, it allows personnel planning decisions to be made with object-ive information about the state of the occupation and knowledge of the likely outcome of possible courses of action. In general, this produces more e�ective personnel planning decisions that will help keep occupations within the CAF as healthy as possible in a context of continuing economic, budget-ary, and policy challenges and changes.
256 CH09 Managing the Personnel Resources of a Military Occupation
RCAF DEFENCE ECONOMICS
Appendix A: Reporting Historical Attrition Rates
Overall attrition rate
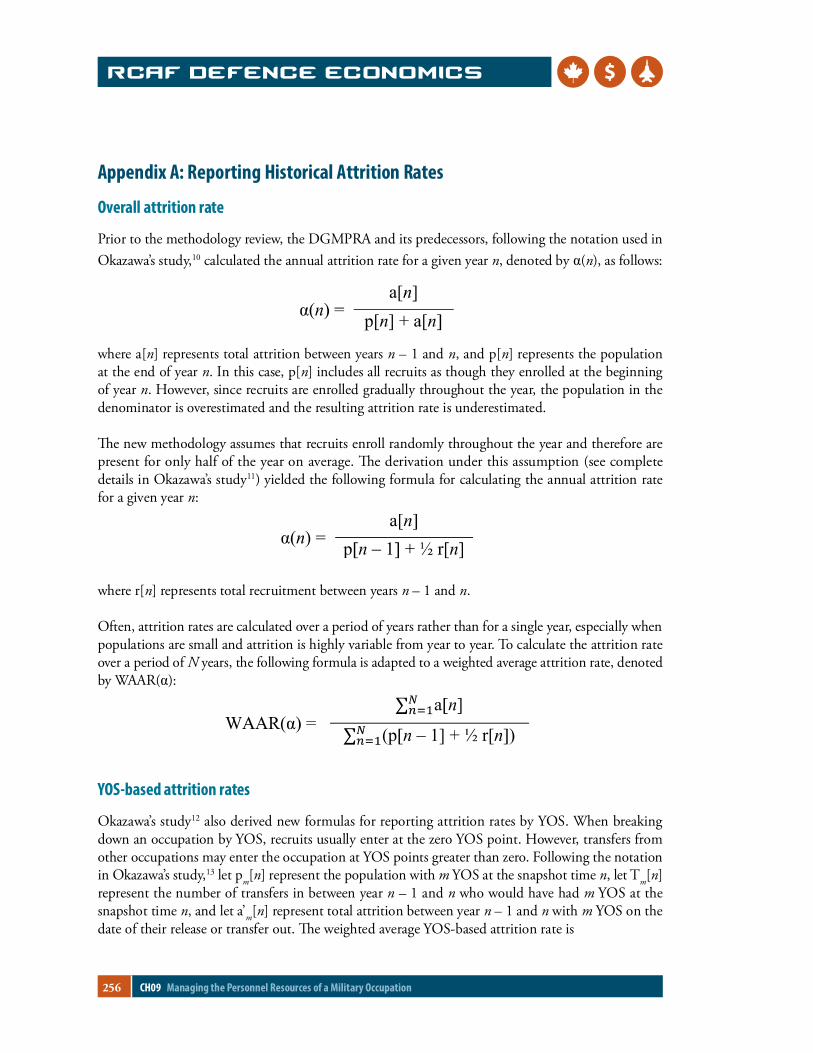
Prior to the methodology review, the DGMPRA and its predecessors, following the notation used in Okazawa’s study,10 calculated the annual attrition rate for a given year n, denoted by α(n), as follows:
where a[n] represents total attrition between years n – 1 and n, and p[n] represents the population at the end of year n. In this case, p[n] includes all recruits as though they enrolled at the beginning of year n. However, since recruits are enrolled gradually throughout the year, the population in the denominator is overestimated and the resulting attrition rate is underestimated.
�e new methodology assumes that recruits enroll randomly throughout the year and therefore are present for only half of the year on average. �e derivation under this assumption (see complete details in Okazawa’s study11) yielded the following formula for calculating the annual attrition rate for a given year n:
where r[n] represents total recruitment between years n – 1 and n.
Often, attrition rates are calculated over a period of years rather than for a single year, especially when populations are small and attrition is highly variable from year to year. To calculate the attrition rate over a period of N years, the following formula is adapted to a weighted average attrition rate, denoted by WAAR(α):
YOS-based attrition rates
Okazawa’s study12 also derived new formulas for reporting attrition rates by YOS. When breaking down an occupation by YOS, recruits usually enter at the zero YOS point. However, transfers from other occupations may enter the occupation at YOS points greater than zero. Following the notation in Okazawa’s study,13 let pm[n] represent the population with m YOS at the snapshot time n, let Tm[n] represent the number of transfers in between year n – 1 and n who would have had m YOS at the snapshot time n, and let a’m[n] represent total attrition between year n – 1 and n with m YOS on the date of their release or transfer out. �e weighted average YOS-based attrition rate is
257Managing the Personnel Resources of a Military Occupation CH09
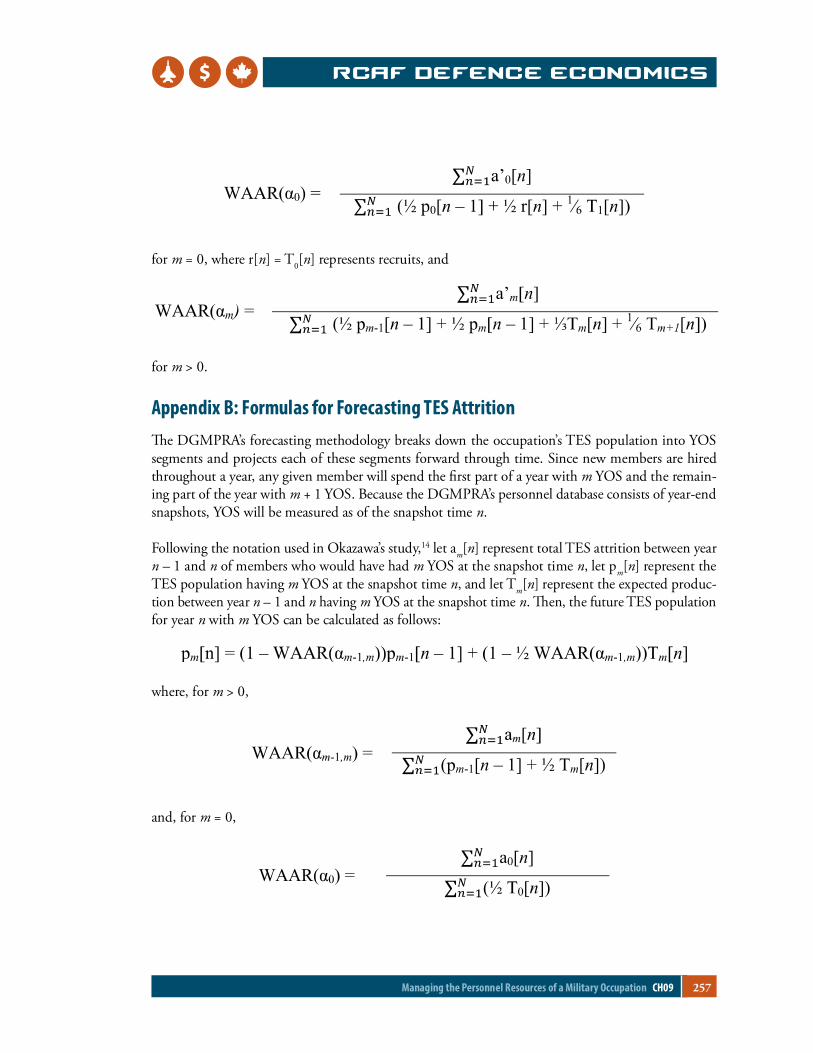
RCAF DEFENCE ECONOMICS
for m = 0, where r[n] = T0[n] represents recruits, and
for m > 0.
Appendix B: Formulas for Forecasting TES Attrition�e DGMPRA’s forecasting methodology breaks down the occupation’s TES population into YOS segments and projects each of these segments forward through time. Since new members are hired throughout a year, any given member will spend the �rst part of a year with m YOS and the remain-ing part of the year with m + 1 YOS. Because the DGMPRA’s personnel database consists of year-end snapshots, YOS will be measured as of the snapshot time n.
Following the notation used in Okazawa’s study,14 let am[n] represent total TES attrition between year n – 1 and n of members who would have had m YOS at the snapshot time n, let pm[n] represent the TES population having m YOS at the snapshot time n, and let Tm[n] represent the expected produc-tion between year n – 1 and n having m YOS at the snapshot time n. �en, the future TES population for year n with m YOS can be calculated as follows:
where, for m > 0,
and, for m = 0,
258 CH09 Managing the Personnel Resources of a Military Occupation
RCAF DEFENCE ECONOMICS
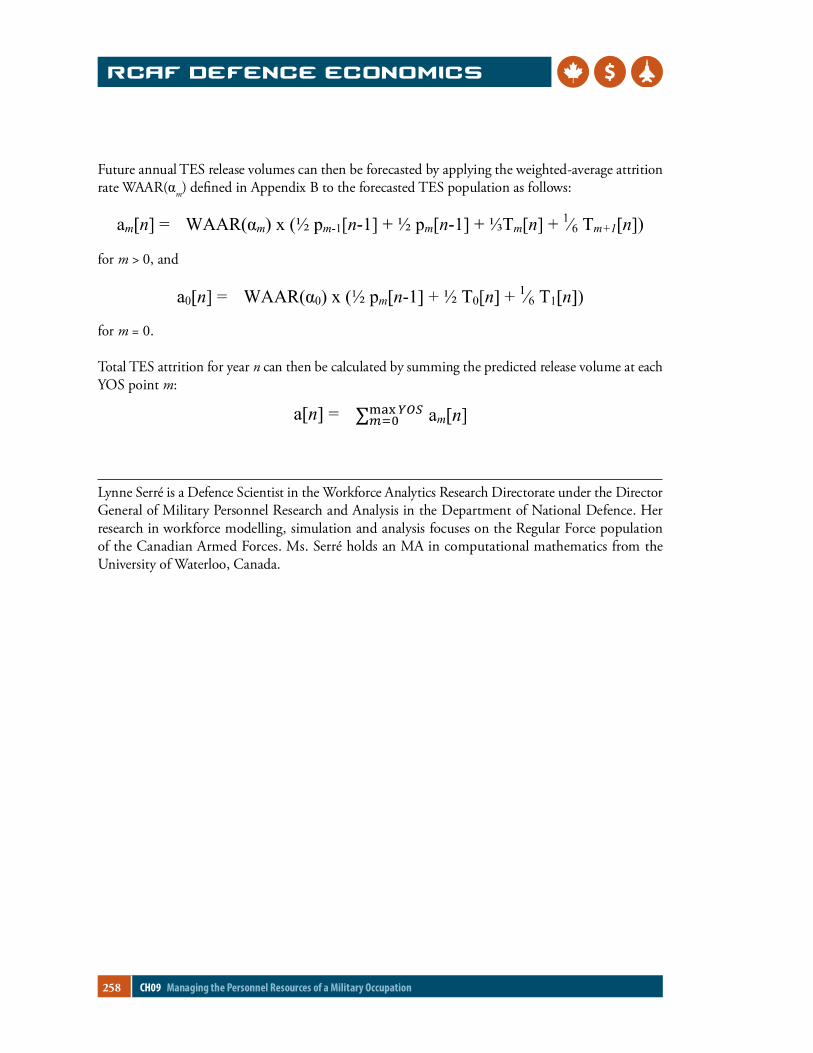
Future annual TES release volumes can then be forecasted by applying the weighted-average attrition rate WAAR(αm) de�ned in Appendix B to the forecasted TES population as follows:
for m > 0, and
for m = 0.
Total TES attrition for year n can then be calculated by summing the predicted release volume at each YOS point m:
Lynne Serré is a Defence Scientist in the Workforce Analytics Research Directorate under the Director General of Military Personnel Research and Analysis in the Department of National Defence. Her research in workforce modelling, simulation and analysis focuses on the Regular Force population of the Canadian Armed Forces. Ms. Serré holds an MA in computational mathematics from the University of Waterloo, Canada.
259Managing the Personnel Resources of a Military Occupation CH09
RCAF DEFENCE ECONOMICS
AbbreviationsAMOR Annual Military Occupation ReviewCAF Canadian Armed ForcesDGMPRA Director General Military Personnel Research and AnalysisDND Department of National DefenceDRDC Defence Research and Development CanadaOFP operationally functional pointPML preferred manning levelRCAF Royal Canadian Air ForceReg F Regular ForceRes F Reserve ForceSIP strategic intake planSME subject matter expertTES trained e�ective strengthTOS term of serviceYOS years of service
260 CH09 Managing the Personnel Resources of a Military Occupation
RCAF DEFENCE ECONOMICS
Notes1. Canada, DND, Canada First Defence Strategy, 2008.
2. Canada, DND, CAF Military Personnel Instructions 01/08 – Annual Military Occupation Review (AMOR), revised on 25 September 2013, 2008.
3. Canada, DND, �e Canadian Armed Forces Military Employment Structure, Volume 1 of 4, 2015.
4. �e standard threshold used within DND is that an occupation is healthy if its TES is no more than 5% below its PML. An occupation’s health is considered critical once its TES is more than 10% below its PML.
5. Canada, DND, CAF Military Personnel Instructions 01/08.
6. Canada, DND, CAF Military Personnel Instructions 01/08.
7. Canada, DND, ADM (HRMIL) Instruction 05/05 – �e New CF Regular Force Terms of Service, revised on 17 January 2008, 2005.
8. M. Fang, Systematic Review on Attrition, presented to the TTCP Workforce Modelling and Analysis Working Group, Ottawa, May 6, 2008 (Ottawa: DRDC, 2008).
9. S. Okazawa, Determining the Optimal Volume of Historical Data to Use in Attrition Models, DRDC CORA Technical Memorandum 2008-02 (Ottawa: DRDC, 2008).
10. S. Okazawa, Measuring Attrition Rates and Forecasting Attrition Volume, DRDC CORA Technical Memorandum 2007-02 (Ottawa: DRDC, 2007).
11. Okazawa, Measuring Attrition Rates and Forecasting Attrition Volume.
12. Okazawa, Measuring Attrition Rates and Forecasting Attrition Volume.
13. Okazawa, Measuring Attrition Rates and Forecasting Attrition Volume.
14. Okazawa, Measuring Attrition Rates and Forecasting Attrition Volume.
Additional ReadingCanada, Department of National Defence. Report on Plans and Priorities. 2016.
DOCUMENT CONTROL DATA *Security markings for the title, authors, abstract and keywords must be entered when the document is sensitive
1. ORIGINATOR (Name and address of the organization preparing the document. A DRDC Centre sponsoring a contractor's report, or tasking agency, is entered in Section 8.)
Canadian Forces Aerospace Warfare Centre http://www.rcaf-arc.forces.gc.ca/en/cf-aerospacewarfare-centre/index.page
2a. SECURITY MARKING (Overall security marking of the document including special supplemental markings if applicable.)
CAN UNCLASSIFIED
2b. CONTROLLED GOODS
NON-CONTROLLED GOODS DMC A
3. TITLE (The document title and sub-title as indicated on the title page.)
Chapter 09: Managing the Personnel Resources of a Military Occupation:: Attrition Forecasting And Production Planning
4. AUTHORS (Last name, followed by initials – ranks, titles, etc., not to be used)
Serré, L.
5. DATE OF PUBLICATION (Month and year of publication of document.)
July 2019
6a. NO. OF PAGES (Total pages, including Annexes, excluding DCD, covering and verso pages.)
20
6b. NO. OF REFS(Total references cited.)
14
7. DOCUMENT CATEGORY (e.g., Scientific Report, Contract Report, Scientific Letter.)
External Literature (P)
8. SPONSORING CENTRE (The name and address of the department project office or laboratory sponsoring the research and development.)
DRDC – Centre for Operational Research and Analysis Defence Research and Development Canada Carling Campus, 60 Moodie Drive, Building 7S.2 Ottawa, Ontario K1A 0K2 Canada
9a. PROJECT OR GRANT NO. (If appropriate, the applicable research and development project or grant number under which the document was written. Please specify whether project or grant.)
9b. CONTRACT NO. (If appropriate, the applicable number under which the document was written.)
10a. DRDC PUBLICATION NUMBER (The official document number by which the document is identified by the originating activity. This number must be unique to this document.)
DRDC-RDDC-2021-P076
10b. OTHER DOCUMENT NO(s). (Any other numbers which may be assigned this document either by the originator or by the sponsor.)
11a. FUTURE DISTRIBUTION WITHIN CANADA (Approval for further dissemination of the document. Security classification must also be considered.)
Public release
11b. FUTURE DISTRIBUTION OUTSIDE CANADA (Approval for further dissemination of the document. Security classification must also be considered.)

12. KEYWORDS, DESCRIPTORS or IDENTIFIERS (Use semi-colon as a delimiter.)
Operations Research; personnel; forecasting; attrition; workforce planning; intake plan
13. ABSTRACT/RÉSUMÉ (When available in the document, the French version of the abstract must be included here.)