Embed Size (px)
Citation preview

CHAPTER 1
Computational Modeling ofPhotocatalytic Cells
STEVEN J. KONEZNY AND VICTOR S. BATISTA*
Department of Chemistry, Yale University, P.O. Box 208107, New Haven,CT 06520-8107, USA*Email: [email protected]
1.1 Introduction
Solar energy conversion into chemical fuels is one of the ‘‘holy grails’’ of the21st century. Significant research efforts are currently underway towardunderstanding natural photosynthesis and artificial biomimetic systems. Pho-tocatalytic cells absorb solar energy and use it to drive catalytic water oxidationat photoanodes:1,2
2H2O! 4Hþ þ 4e� þO2ðgÞ ð1:1Þ
effectively extracting reducing equivalents from water (i.e., protons and elec-trons) that can be used to generate fuel, for example H2(g) by proton reduction:
4Hþ þ 4e� ! 2H2ðgÞ ð1:2Þ
The water oxidation half-reaction, introduced by Equation (1.1), is the mostchallenging obstacle for solar hydrogen production,3–6 since it requires a four-electron transfer process coupled to the removal of four protons from watermolecules to form the oxygen–oxygen bond. In Nature, this process is driven bysolar light captured by chlorophyll pigments embedded in the protein antennas
RSC Energy and Environment Series No. 8
Solar Energy Conversion: Dynamics of Interfacial Electron and Excitation Transfer
Edited by Piotr Piotrowiak
r The Royal Society of Chemistry 2013
Published by the Royal Society of Chemistry, www.rsc.org
1
Dow
nloa
ded
on 1
5/10
/201
3 13
:53:
00.
Publ
ishe
d on
09
Oct
ober
201
3 on
http
://pu
bs.r
sc.o
rg |
doi:1
0.10
39/9
7818
4973
5445
-000
01

of photosystem II and the energy harvested is used to oxidize water in theoxygen-evolving complex.3,7 The development of photocatalytic solar cellsmade of earth-abundant materials that mimic these mechanisms and photo-catalyze water oxidation has been a long-standing challenge in photoelec-trochemistry research, dating back to before the discovery of ultraviolet wateroxidation on n-TiO2 electrodes by Fujishima and Honda 40 years ago.8
However, progress in the field has been hindered by a lack of fundamentalunderstanding of the underlying elementary processes and the lack of reliabletheoretical methods to model the photoconversion mechanisms.
The landscape of research in solar photocatalysis has been rapidly changingin recent years, with a flurry of activity in the development and analysis ofcatalysts for water oxidation9–23 and fundamental studies of photocatalysisbased on semiconductor surfaces.24,25 Significant effort is currently focused onthe development of more efficient catalysts based on earth-abundant materialsand various strategies for the design of molecular assemblies that efficientlycouple multielectron photoanodic processes to fuel production. Theoutstanding challenge is to identify robust materials that could catalyze thenecessary multielectron transformations at energies and rates consistent withsolar irradiance.
A promising approach for photocatalytic water oxidation involves designinghigh potential photoanodes based on surface-bound molecular complexes andcoupling the anodic multielectron reactions to fuel production at the cathodewith long-range free energy gradients. Such a design problem requires funda-mental understanding of the factors affecting photoabsorption, interfacialelectron transfer to the photoanode, charge transport, storage of oxidizingequivalents for catalysis at low overpotentials and irreversible carrier collectionby fuel-forming reactions at the cathode. The characterization of theseprocesses by computational techniques clearly requires methods for modelingthe complete photocatalytic mechanism as well as methods for understandingand characterizing the elementary steps at the detailed molecular level,including visible light sensitization of semiconductor surfaces by molecularadsorbates, charge transport and redox catalytic processes. This chapterreviews recent advances in the field, with emphasis on computational researchfocused on modeling photocatalytic cells and the elementary processes involvedat the molecular level. The reviewed studies are part of an interdisciplinaryresearch program including synthesis, electrochemistry and spectroscopy in ajoint theoretical and experimental effort to advance our understanding ofstructure/function relations in high potential photoanodes based on functio-nalization of nanoporous TiO2 thin films with transition metal catalysts.
The chapter is organized as follows. Section 1.2 reviews recent computationalefforts focused on modeling current–voltage characteristics of functional dye-sensitized solar cells (DSSCs) under operational conditions, with emphasis onthe effect of the nature of the molecular adsorbates and redox couple on theoverall efficiency of photoconversion. Section 1.3 reviews recent developmentsof methods for inverse design of molecular adsorbers with suitable solar-lightphotoabsorption. Section 1.4 reviews the development of theoretical models of
2 Chapter 1
Dow
nloa
ded
on 1
5/10
/201
3 13
:53:
00.
Publ
ishe
d on
09
Oct
ober
201
3 on
http
://pu
bs.r
sc.o
rg |
doi:1
0.10
39/9
7818
4973
5445
-000
01View Online

charge transport in nanoporous metal oxide thin films, with emphasis on thefluctuation-induced tunneling conduction (FITC) model as applied to the de-scription of the temperature dependence of dc and ac conductivities and directcomparisons to experimental data. Section 1.5 is focused on reliable methodsfor modeling the redox properties of molecular adsorbates, with emphasis onthe reduction of systematic errors introduced by either the level of theory (i.e.,the choice of density functional theory (DFT) functional, basis set andsolvation model) or the electrochemical measurement conditions, including thenature of the solvent, electrolyte and working electrode. Section 1.6 presents asummary of the conclusions and outlook.
1.2 Photoelectrochemical Device Modeling
Modeling can provide a fundamental insight into the effects of individualsystem components on the overall device functionality.26 A parameter-spaceanalysis by systematic variation in device composition can lead to the discoveryof assemblies with optimum performance. Insight into observed trends can beextracted from the parameters of equivalent-circuit current–voltage simu-lations. Here, we illustrate this systematic approach by analyzing of a series ofhigh-potential porphyrin photoanodes, metal oxides and redox couples, suit-able for photocatalytic cells. We show that DSSCs based on porphyrin dyesdemonstrate superior performance owing to increased open-circuit voltage andthe short-circuit current when using the relatively high-potential bromide–tribromide redox couple as a regenerative electron mediator rather than thestandard iodide–triiodide couple. The resulting potentials progress towardsufficiently positive values suitable for water oxidation chemistry.
1.2.1 Modeling Current-Voltage Characteristics
The current–voltage characteristics, that is the current density J as a function ofthe applied voltage V, of photoelectrochemical cells are used to extract im-portant parameters related to device performance. In the case of a DSSC,parameters of interest include the short-circuit current JSC� J(V¼ 0), opencircuit voltage VOC�V(J¼ 0) and the power conversion efficiency. However,owing to the complex nature of DSSC operation, these data alone offer alimited understanding of the underlying physical/electrochemical processes.Device modeling of current–voltage characteristics is needed in order to de-velop this understanding and establish property–performance relationships.This kind of an analysis is useful not only to DSSCs but to photoelec-trochemical cells in general since they share common system components.
The equivalent circuit diagram used to model solar cell current–voltagecharacteristics is shown at the top of Figure 1.1. The schematic energy leveldiagram of a DSSC at the bottom of Figure 1.1 shows the various chargetransfer processes that occur in photoelectrochemical cells and relates theseprocesses to current pathways via components of the model circuit.An illumination current density JL is induced upon photoexcitation of the
Computational Modeling of Photocatalytic Cells 3
Dow
nloa
ded
on 1
5/10
/201
3 13
:53:
00.
Publ
ishe
d on
09
Oct
ober
201
3 on
http
://pu
bs.r
sc.o
rg |
doi:1
0.10
39/9
7818
4973
5445
-000
01View Online

adsorbed dye molecule, followed by interfacial electron injection into theconduction band of the metal oxide semiconductor. Direct recombination ofthe photoinjected carriers with redox species in the electrolyte solution and thedark current along the edges of the cell contribute to the shunt resistance RSH ofthe cell. Under applied bias, the cell can be modeled as a diode with a currentdensity JD that runs parallel to JL and shunt current density JSH that opposesJL. The cell also has a net series resistance RS, which includes the resistance ofthe metal oxide and the ionic resistance of the redox pair in the electrolyte.
The output current density J of the solar cell as a function of applied biasvoltage in the equivalent circuit model is:26,27
J ¼ JL � J0 expqðV þ JARSÞ
fkT
� �� 1
� �� V þ JARS
ARSH; ð1:3Þ
where J0 is the reverse saturation current, k is the Boltzmann constant, T is theabsolute temperature, q is the electronic charge, A is the device area and f is the
Figure 1.1 Simple equivalent circuit (top) for modeling solar cell current–voltagecharacteristics and energy level diagram (bottom) mapping the variouscharge transfer processes in a DSSC to the current pathways of the modelcircuit. The dominant mechanisms are described by a current density JLinduced upon photoexcitation and electron injection into the conductionband of the metal oxide semiconductor surface MO, linear (JSH) and non-linear (JD) reverse current densities in parallel with photocurrent sourceand a series resistance RS to account for electrode and ionic resistances. InSection 1.2.2: MO¼TiO2, SnO2, X¼Br, I.
4 Chapter 1
Dow
nloa
ded
on 1
5/10
/201
3 13
:53:
00.
Publ
ishe
d on
09
Oct
ober
201
3 on
http
://pu
bs.r
sc.o
rg |
doi:1
0.10
39/9
7818
4973
5445
-000
01View Online

ideality factor. Equation (1.3), which was originally developed to describe thenon-ideal diode behavior of inorganic semiconductor p–n junctions, has beenapplied to a wide range of solar cell technologies including hydrogenatedamorphous silicon p–i–n cells, Cu(In,Ga)Se2 cells, organic bulk heterojunctioncells and DSSCs.26–29 In the case of photoelectrochemical cells, J0 is related tothe energy level alignment between the bottom of the conduction band of themetal oxide and the excited state donor level of the dye D*. This differs from JL,which is related to the coupling between D* and states in the metal oxide thatare closer in energy and therefore typically deeper in the conduction band. Thismeans that a clear strategy for improving device performance is to adjust theenergetic position of D* relative to the metal oxide density of states to achievemaximum JL and minimum J0. The benefits of this approach are apparent inEquation (1.3), which gives an estimate of the open circuit voltage of the cellin the regime of high shunt resistance:
VOC �fkT
qln
JL
J0þ 1
� �ð1:4Þ
We note that this model could be extended to incorporate electrochemicalprocesses. For example, the electrochemical kinetics at the electrodes ismore appropriately described by the Butler–Volmer equation with non-linearJ–V characteristics rather than an ohmic resistor. However, as shown inSection 1.2.2, much insight can be gained when using the equivalent circuitmodel of Figure 1.1 and Equation (1.3) to do a comparative analysis of a seriesof device architectures in which the relevant energy levels are systematicallyvaried.
1.2.2 Bioinspired High-Potential Porphyrin Photoanodes
Table 1.1 compares the equivalent circuit parameters that characterize theperformance of solar cells based on sensitizers 1, 2 and 3 (Figure 1.2) and N719.The analysis includes solar cells with either I�3 =I
� or Br�3 =Br� redox couples as
regenerative electron mediators and TiO2 or SnO2 nanocrystalline substrates.It is shown that the series resistance increases when the TiO2 photoanodeis replaced by SnO2, for a given dye and electrolyte, consistent with lowerin vacuo room temperature nanoporous-film dark conductivities in TiO2
(B10�10O�1 cm�1; Figure 1.7) compared to SnO2 (B10�6O�1 cm�1;Figure 1.10). In addition, the series resistance RS decreases for iodide relative tobromide for dyes 1–3, consistent with the higher conductivity of iodide whencompared to bromide at low concentrations.30 In addition to changes caused bythe intrinsic properties of the ions, the substitution of I� by Br� leads to areduction in the saturation recombination current J0 and an increase in theopen circuit voltage VOC, as observed for solar cells based on sensitizers 1–3.These changes in the current–voltage characteristics are due to a tighter bindingof bromide to the porphyrin adsorbates, as shown by the analysis of the elec-trostatic potentials.
Computational Modeling of Photocatalytic Cells 5
Dow
nloa
ded
on 1
5/10
/201
3 13
:53:
00.
Publ
ishe
d on
09
Oct
ober
201
3 on
http
://pu
bs.r
sc.o
rg |
doi:1
0.10
39/9
7818
4973
5445
-000
01View Online
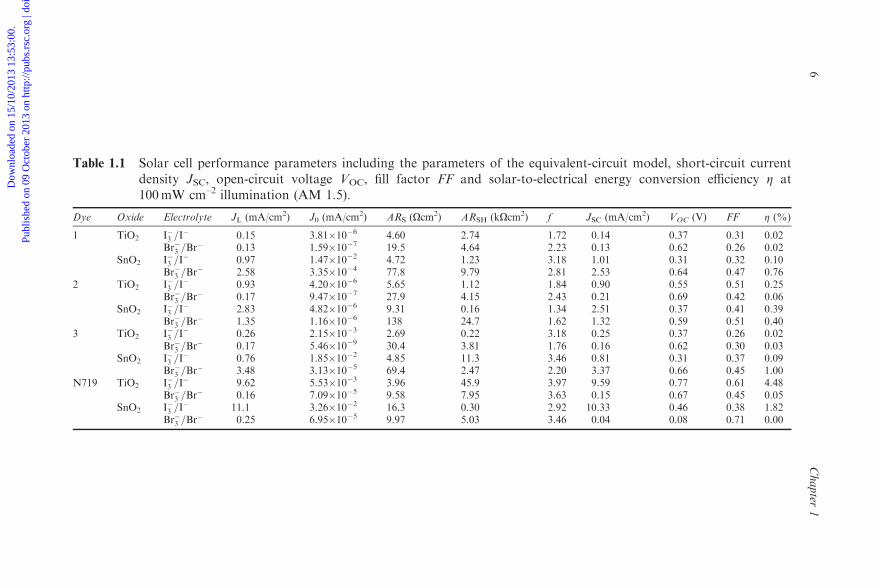
Table 1.1 Solar cell performance parameters including the parameters of the equivalent-circuit model, short-circuit currentdensity JSC, open-circuit voltage VOC, fill factor FF and solar-to-electrical energy conversion efficiency Z at100mW cm–2 illumination (AM 1.5).
Dye Oxide Electrolyte JL (mA/cm2) J0 (mA/cm2) ARS (Ocm2) ARSH (kOcm2) f JSC (mA/cm2) VOC (V) FF Z (%)
1 TiO2 I�3 =I� 0.15 3.81�10�6 4.60 2.74 1.72 0.14 0.37 0.31 0.02
Br�3 =Br� 0.13 1.59�10�7 19.5 4.64 2.23 0.13 0.62 0.26 0.02
SnO2 I�3 =I� 0.97 1.47�10�2 4.72 1.23 3.18 1.01 0.31 0.32 0.10
Br�3 =Br� 2.58 3.35�10�4 77.8 9.79 2.81 2.53 0.64 0.47 0.76
2 TiO2 I�3 =I� 0.93 4.20�10�6 5.65 1.12 1.84 0.90 0.55 0.51 0.25
Br�3 =Br� 0.17 9.47�10�7 27.9 4.15 2.43 0.21 0.69 0.42 0.06
SnO2 I�3 =I� 2.83 4.82�10�6 9.31 0.16 1.34 2.51 0.37 0.41 0.39
Br�3 =Br� 1.35 1.16�10�6 138 24.7 1.62 1.32 0.59 0.51 0.40
3 TiO2 I�3 =I� 0.26 2.15�10�3 2.69 0.22 3.18 0.25 0.37 0.26 0.02
Br�3 =Br� 0.17 5.46�10�9 30.4 3.81 1.76 0.16 0.62 0.30 0.03
SnO2 I�3 =I� 0.76 1.85�10�2 4.85 11.3 3.46 0.81 0.31 0.37 0.09
Br�3 =Br� 3.48 3.13�10�5 69.4 2.47 2.20 3.37 0.66 0.45 1.00
N719 TiO2 I�3 =I� 9.62 5.53�10�3 3.96 45.9 3.97 9.59 0.77 0.61 4.48
Br�3 =Br� 0.16 7.09�10�5 9.58 7.95 3.63 0.15 0.67 0.45 0.05
SnO2 I�3 =I� 11.1 3.26�10�2 16.3 0.30 2.92 10.33 0.46 0.38 1.82
Br�3 =Br� 0.25 6.95�10�5 9.97 5.03 3.46 0.04 0.08 0.71 0.00
6Chapter
1
Dow
nloa
ded
on 1
5/10
/201
3 13
:53:
00.
Publ
ishe
d on
09
Oct
ober
201
3 on
http
://pu
bs.r
sc.o
rg |
doi:1
0.10
39/9
7818
4973
5445
-000
01
View Online
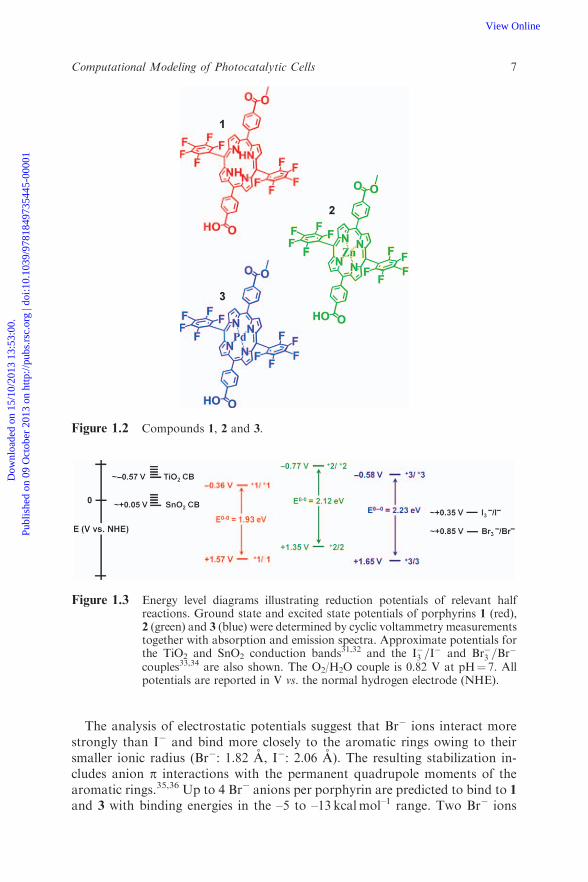
The analysis of electrostatic potentials suggest that Br� ions interact morestrongly than I� and bind more closely to the aromatic rings owing to theirsmaller ionic radius (Br�: 1.82 A, I�: 2.06 A). The resulting stabilization in-cludes anion p interactions with the permanent quadrupole moments of thearomatic rings.35,36 Up to 4 Br� anions per porphyrin are predicted to bind to 1
and 3 with binding energies in the –5 to –13 kcalmol–1 range. Two Br� ions
Figure 1.2 Compounds 1, 2 and 3.
Figure 1.3 Energy level diagrams illustrating reduction potentials of relevant halfreactions. Ground state and excited state potentials of porphyrins 1 (red),2 (green) and 3 (blue) were determined by cyclic voltammetry measurementstogether with absorption and emission spectra. Approximate potentials forthe TiO2 and SnO2 conduction bands31,32 and the I�3 =I
� and Br�3 =Br�
couples33,34 are also shown. The O2/H2O couple is 0.82 V at pH¼ 7. Allpotentials are reported in V vs. the normal hydrogen electrode (NHE).
Computational Modeling of Photocatalytic Cells 7
Dow
nloa
ded
on 1
5/10
/201
3 13
:53:
00.
Publ
ishe
d on
09
Oct
ober
201
3 on
http
://pu
bs.r
sc.o
rg |
doi:1
0.10
39/9
7818
4973
5445
-000
01View Online

8 Chapter 1
Dow
nloa
ded
on 1
5/10
/201
3 13
:53:
00.
Publ
ishe
d on
09
Oct
ober
201
3 on
http
://pu
bs.r
sc.o
rg |
doi:1
0.10
39/9
7818
4973
5445
-000
01View Online

bind to the pentafluorophenyl groups while the other two bind to the carbo-methoxyphenyl groups (Figure 1.4). In addition, Br� can bind to Zn in 2, with abinding energy of –12.5 kcal mol–1. However, metal–anion interactions forZn� I� and Pd�Br� are much weaker (i.e., comparable to thermal fluctu-ations).26 In contrast to bromide, iodide ions show much weaker specificinteractions with 1–3 probably due to the larger ionic radius.
The analysis of adsorbate ions interactions provided fundamental under-standing of the origin of changes in the I–V characteristics induced by changesin the nature of the redox couple. The larger concentration of smaller ions shiftsthe electron donor and acceptor states and the edge of the conduction band tomore negative potentials, preventing recombination and reducing J0(Figure 1.4). Therefore, the open circuit voltage VOC is increased and theslope of the characteristic curve is reduced as V-0. The illumination currentdensity increases (or decreases) when the donor state is poised where the con-duction band has a larger (or smaller) density of states.
The comparative analysis of porphyrin-based photoanodes suggests that newhigh-potential sensitizers and device architectures can significantly expand theavailable parameter space of DSSC current–voltage simulation methods. Inparticular, a suitable choice of electron-withdrawing substitution groups, ortransition metal, can shift the porphyrin redox potential and make it sufficientlypositive to activate water oxidation catalysts.26,34 However, the porphyrin ex-cited state which injects the photoexcited electrons into the metal oxide con-duction band typically experiences a similar stabilization when changing themetal center or the substitution groups, giving similar vertical excitation bandsas seen in the absorption spectra (Figure 1.3). Therefore, it is natural to expectthat adsorbates that generate deep positive holes by excitation with visible lightwould photoinject electrons only into metal oxides with conduction bands thatare more positive than the NHE (e.g., SnO2). Achieving efficient water oxi-dation and proton reduction by visible light photocatalysis on sensitized metaloxide surfaces thus might require two-photon schemes.37 A simple example isshown in Figure 1.5 where red photons inject electrons into the photocathodeat potentials more negative than the NHE, while blue photons generate holes in
Figure 1.4 Top: Illustration of photoinduced electron transfer into the semiconductorconduction band. Middle: Bromide binding to the bis-pentafluorophenylfree-baseporphyrin sensitizer bearing linkers for attachment to metaloxide surfaces: two equivalent low-energy positions at 3.9 A from thepentafluorophenyl groups, stabilized by p-anion interactions with a stabil-ization energy of �7.9 kcal mol–1 and two similar positions at 4.9 A fromthe carbomethoxyphenyl groups stabilized by �4.9 kcal mol–1. Bottom:Shift of the edge of the conduction band upon substitution of I�3 =I
�
(dotted lines) by Br�3 =Br� (solid lines) in solar cells based on 1, 2, or 3,
using TiO2 or SnO2 nanocrystalline substrates. Such shift leads to areduction of J0 since the barrier for back electron transfer, from thebottom of the metal oxide conduction band to the donor state, is in-creased. The illumination current density JL is smaller (left) or larger(right) in Br�3 =Br
�, according to the smaller or larger amplitude of theDOS at the energy of the donor state.
Computational Modeling of Photocatalytic Cells 9
Dow
nloa
ded
on 1
5/10
/201
3 13
:53:
00.
Publ
ishe
d on
09
Oct
ober
201
3 on
http
://pu
bs.r
sc.o
rg |
doi:1
0.10
39/9
7818
4973
5445
-000
01View Online

porphyrins adsorbed on the photoanode, sufficiently positive as to activatewater oxidation catalysts.
1.3 Inverse Design of Photoabsorbers
The search for molecular adsorbates for high potential photoanodes with highphotoconversion efficiency is challenging. Most of the work reported to datehas been based on direct molecular design using empirical strategies, wheretypical ‘‘guess-and-check’’ procedures face the challenge of selecting suitablecandidates from an immense number of accessible stable molecules. Therefore,there is significant interest in the development of inverse design methods thatbypass the combinatorial problem in the development of materials for solarenergy conversion.
In recent work, a systematic inverse design methodology suitable to assist thesynthesis and optimization of molecular sensitizers for dye sensitized solarcells has been proposed.38 The method searches for molecular adsorbateswith suitable photoabsorption properties through continuous optimization of‘‘alchemical’’ structures in the vicinity of a reference molecular framework,avoiding the exponential scaling problem of high throughput screeningtechniques. It has been as applied to the design and optimization of linkerchromophores for TiO2 sensitization using the recently developed phenylace-tylacetonate (i.e., phenylacac) anchor39 as a reference framework. A novelanchor (3-acac-pyran-2-one) was found to be a local optimum, with improvedsensitization properties compared to phenyl-acac. Its molecular structure is re-lated to known coumarin dyes which could be used as lead chromophore anchorsfor practical applications in DSSCs. The findings are particularly relevant to the
Figure 1.5 Energy diagram (left) and schematic representation (right) of a photo-catalytic cell based on a 2-photon tandem Z-scheme with high potentialporphyrins covalently attached to SnO2.
10 Chapter 1
Dow
nloa
ded
on 1
5/10
/201
3 13
:53:
00.
Publ
ishe
d on
09
Oct
ober
201
3 on
http
://pu
bs.r
sc.o
rg |
doi:1
0.10
39/9
7818
4973
5445
-000
01View Online
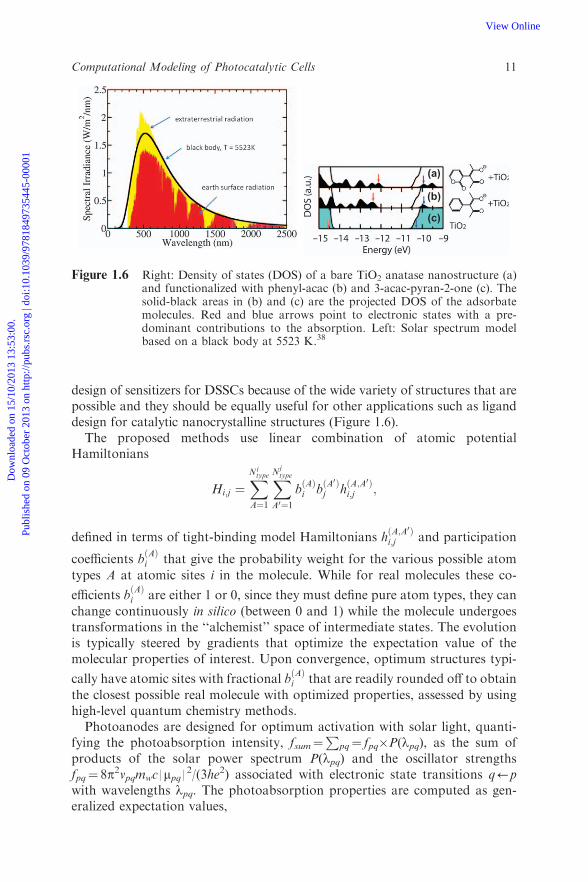
design of sensitizers for DSSCs because of the wide variety of structures that arepossible and they should be equally useful for other applications such as liganddesign for catalytic nanocrystalline structures (Figure 1.6).
The proposed methods use linear combination of atomic potentialHamiltonians
Hi;j ¼XNitype
A¼1
XNjtype
A0¼1bðAÞi b
ðA0Þj h
ðA;A0Þi;j ;
defined in terms of tight-binding model Hamiltonians hðA;A0Þi;j and participation
coefficients bðAÞi that give the probability weight for the various possible atom
types A at atomic sites i in the molecule. While for real molecules these co-
efficients bðAÞi are either 1 or 0, since they must define pure atom types, they can
change continuously in silico (between 0 and 1) while the molecule undergoestransformations in the ‘‘alchemist’’ space of intermediate states. The evolutionis typically steered by gradients that optimize the expectation value of themolecular properties of interest. Upon convergence, optimum structures typi-
cally have atomic sites with fractional bðAÞi that are readily rounded off to obtain
the closest possible real molecule with optimized properties, assessed by usinghigh-level quantum chemistry methods.
Photoanodes are designed for optimum activation with solar light, quanti-fying the photoabsorption intensity, fsum¼
Ppq¼ fpq�P(lpq), as the sum of
products of the solar power spectrum P(lpq) and the oscillator strengthsfpq¼ 8p2vpqmwc |mpq|
2/(3he2) associated with electronic state transitions q’pwith wavelengths lpq. The photoabsorption properties are computed as gen-eralized expectation values,
(a)
(b)
(c)
Figure 1.6 Right: Density of states (DOS) of a bare TiO2 anatase nanostructure (a)and functionalized with phenyl-acac (b) and 3-acac-pyran-2-one (c). Thesolid-black areas in (b) and (c) are the projected DOS of the adsorbatemolecules. Red and blue arrows point to electronic states with a pre-dominant contributions to the absorption. Left: Solar spectrum modelbased on a black body at 5523 K.38
Computational Modeling of Photocatalytic Cells 11
Dow
nloa
ded
on 1
5/10
/201
3 13
:53:
00.
Publ
ishe
d on
09
Oct
ober
201
3 on
http
://pu
bs.r
sc.o
rg |
doi:1
0.10
39/9
7818
4973
5445
-000
01View Online

�O ¼XNi¼1
XNj¼1
XNitype
A¼1
XNjtype
B¼1Q�ðAÞi Q
ðBÞj O
ðA;BÞi;j
in the basis of states obtained by solving the Schrodinger equation:HQ¼E SQ,whereQ is typically the matrix of eigenvectors in the basis of Slater-type atomicorbitals (STO), E is the diagonal matrix of energy eigenvalues and S is theoverlap matrix
Sia;jb ¼XNitype
A¼1
XNjtype
B¼1b�ðAÞi b
ðBÞj S
ðA;BÞia;jb
While computationally demanding, these methods can be parallelized andscale only as (NNtype)
2, with N and Ntype the number of atoms and atom types,
respectively. In contrast, assessing all possible NNtype structures by brute force
screening would obviously scale exponentially with Ntype. Therefore, it is nat-ural to anticipate that this kind of systematic methodology will providepowerful computational methods as well as guidelines for design of new ma-terials for efficient solar energy conversion.
1.4 Charge Transport in Nanoporous Metal Oxides
The electronic mechanisms responsible for dark conductivity in nanoporousmetal oxide materials control the efficiency of energy photoconversion in a widerange of applications, including photovoltaic devices,40–42 photocatalysisand remediation of hazardous waste,41–44 electrochromic windows and dis-plays,42,45,46 and chemical sensors.42,47 Measurements in the 78–335 K tem-perature range show dc conductivity values spanning over four orders ofmagnitude, with a high-temperature Arrhenius dependence that graduallychanges into a temperature-independent plateau at low temperatures. It has re-cently been shown that a FITC mechanism is fully consistent with TiO2 andSnO2 conductivity measurements over this entire temperature range.48,49 Thesefindings suggest that charge transport in nanoporous metal oxide films dependsstrongly on the properties of the junctions linking the constituent nanoparticles.
In recent years, there have been significant contributions towards under-standing charge transport in nanoporous titania thin films.50–60 The mostpopular models include variable range hopping (VRH) and/or multiple trapand release (MTR) of electrons in an electrically homogeneous medium con-taining a distribution of traps. These models have been particularly successfulwhen applied to the conductivity of photogenerated electrons at temperaturesexperimentally accessible in a native device environment. However, they predicta temperature (T) dependence of the dark DC conductivity of the form lnspT�a, where a¼ 1 in the MTR model61 and a¼ 1/4 for VRH.62 As shown inFigure 1.7, this dependence does not account for the observed saturation ofdark conductivity at low temperature, as reported here and elsewhere.63–66 Incontrast, the FITC model offers a quantitative description of conductivity over
12 Chapter 1
Dow
nloa
ded
on 1
5/10
/201
3 13
:53:
00.
Publ
ishe
d on
09
Oct
ober
201
3 on
http
://pu
bs.r
sc.o
rg |
doi:1
0.10
39/9
7818
4973
5445
-000
01View Online

the entire temperature range with a single set of structural parameters, pre-dicting not only the Arrhenius high-temperature behavior but also the tun-neling regime at low temperature. Since the model can be closely tied to thenanoporous film microstructure, it should provide valuable insight in the de-velopment of high performance electrode materials.
Most conductivity measurements reported to date have been limited to thehigh-temperature regime since the low-temperature conductivity is typicallyvery small (sE10�13O�1cm�1) and, therefore, difficult to measure. In the limit,the Arrhenius-type behavior predicted by the FITC model is indistinguishablefrom models based solely on thermally activated processes. Thus, it is notsurprising that, until recently, the FITC mechanism has been largely over-looked.48,49 Recent work, however, has been focused on high sensitivitymeasurements that allow for reliable measurements at very low temperaturesand on the characterization of the samples by scanning electron microscope(SEM) images, powder X-ray diffraction (XRD) measurements and atomisticmodeling. The combined experimental and theoretical analysis provided insightinto the nature of conductivity in sintered TiO2 thin films, as characterized bythe FITC mechanism, with rate-limiting processes determined by the barriersfor electron transport through the nanoparticle contact junctions.67
1.4.1 Fluctuation-Induced Tunneling Conductivity
The FITC model for dc conductivity is described in our previous work48,49,68, 69
and in other studies that apply a FITC model to systems with a comparable
10−15
10−14
10−13
10−12
10−11
10−10
10−9
2 4 6 8 10 12 14
335
K
250
K
200
K
150
K
125
K
100
K
78 K
1000/T (K−1)
Sample ASample B
FITCVRHMTR
σ (Ω
−1cm
−1)
Figure 1.7 Comparison of the dark DC conductivities of nanoporous TiO2 films,made by sintering Sigma-Aldrich (Sample A, filled circles) and Ishihara(Sample B, open squares) nanoparticles, as a function of inverse tempera-ture (temperatures in K are shown on the top axis). Experimental data(solid circles and red boxes) are fitted by using the fluctuation-inducedtunneling conduction (FITC) model (solid line), the variable-rangehopping model (VRH, short-dashed line) and the multiple-trap-and-re-lease model (MTR, long-dashed line).
Computational Modeling of Photocatalytic Cells 13
Dow
nloa
ded
on 1
5/10
/201
3 13
:53:
00.
Publ
ishe
d on
09
Oct
ober
201
3 on
http
://pu
bs.r
sc.o
rg |
doi:1
0.10
39/9
7818
4973
5445
-000
01View Online

microstructure.70–73 A nanoporous metal oxide film can be modeled as a net-work of junctions that form where the nanoparticles come into contact[Figure 1.8(a)]. An important component of the FITC mechanism is that thejunction is electrically inhomogeneous. Molecular dynamics simulation resultsfor sintered TiO2 nanoparticles show that anatase TiO2 nanoparticles have anon-crystalline TiO2 shell surrounding a crystalline core (Figure 1.9), which isconsistent with reports of TiO2 nanoparticle sizes, obtained from microscopydata, being larger than the size of the crystalline centers of the nanoparticlessize, determined by XRD.48,74 The conduction band offset between the crys-talline and non-crystalline TiO2 phases creates a barrier for electron transport.The fact that our data are consistent with the FITC model suggests that this
(b)
(c)
(a)
Figure 1.8 (a) Contact junction of two noncrystalline TiO2 nanoparticles (blue)sintered by disordered TiO2 (green). (b) Energy diagram for electrontransport through the junction, showing the potential energy barrierunder a bias VþVT, where V is the applied voltage and VT is the voltagefluctuation caused by thermal fluctuations in the density of free electronsat the junction. (c) Equivalent RC circuit of the contact junction.
14 Chapter 1
Dow
nloa
ded
on 1
5/10
/201
3 13
:53:
00.
Publ
ishe
d on
09
Oct
ober
201
3 on
http
://pu
bs.r
sc.o
rg |
doi:1
0.10
39/9
7818
4973
5445
-000
01View Online

core shell structure applies to SnO2 nanoparticles and, by extension, othernanoporous metal oxides as well.
The FITC model describes the nanoparticle contact junction as an effectivepotential energy barrier for the transferring electron, owing to the intrinsicdisorder of the semiconductor material between the nanocrystallineparticles [Figure 1.8(b)].48 At a given temperature, the electron transmissionprobability depends on the zero-field barrier height j0, effective width w andjunction area A. In addition, fluctuations in the free-electron density on eitherside of the junction give rise to large voltage fluctuations that modulate theeffective tunneling barrier. Typical parameters for TiO2 nanoparticle junctionsare given in Table 1.2. For a static dielectric constant of er E 20 inside thejunction, the effective junction capacitance C¼ ere0A/w [Figure 1.8(c)] is on theorder 10�6 pF. Therefore, small thermal fluctuations in the density of freeelectrons near the junction give rise to significant voltage fluctuations with
V2T
� ¼ kBT=C.
As a function of the electric field E, the dark dc conductivity can beexpressed as:
sdcðEÞ ¼g jdcðEÞh iA
tVð1:5Þ
where V is the voltage across the junction, t is the thickness of the sample,jdcðEÞh i is the thermal average of the net dc current density and g is a factor thatrelates the conductance of a single junction to the sheet conductance of the film.
Figure 1.9 (a) Molecular dynamics simulation results of two 4-nm particles sinteredat 450 1C. (b) Cylindrical sample cut from (a) showing the crystalline anatasecore and noncrystalline shell of the nanoparticles. (c) Average atomic root-mean-squared deviation (RMSD) relative to bulk anatase.
Computational Modeling of Photocatalytic Cells 15
Dow
nloa
ded
on 1
5/10
/201
3 13
:53:
00.
Publ
ishe
d on
09
Oct
ober
201
3 on
http
://pu
bs.r
sc.o
rg |
doi:1
0.10
39/9
7818
4973
5445
-000
01View Online

The tunneling current density is determined by the density of electrons per unittime incident on the junction and the transmission probability as a function ofenergy. Integrating over all electron energies one obtains:48,68
jdcðEÞ ¼mqk2BT
2
2p2�h3e�2wwx
T 02ð1� e�T
0qEw=kBT� �
þ e�2wwx
1þ T 0ð1� e�T
0qEw=kBT� �� �
þ fe�jm=kBTð1� e�qEw=kBTÞg þ e�2wwx
1þ T 0½ð1� e�ð1�T
0Þjm=kBTÞ�
� ð1� e�ð1�T0ÞðjmþqEwÞ=kBT Þe�T 0qEw=kBT �
�;
ð1:6Þwhere m is the charge carrier mass, �h is the reduced Planck constant, w ¼ð2mj0=�hÞ1=2 is the tunneling constant, q is the electron charge, the dimen-sionless temperature-dependent parameter T0 is given by 2wwZkBT/j0 and jm isthe maximum in the potential barrier. x and Z are field-dependent dimensionlessparameters that originate from the first two terms in a power series expansionof the exponent of the transmission coefficient under the WKB approxi-mation.75 Equations (1.5) and (1.6) provide a more explicit form of the dcconductivity than the approximation sEs0exp[�T/(T0þT)], where s0, T0 andT1 are temperature-independent parameters. The simplified expression has alimited range of validity and can lead to inaccurate estimations of the contactjunction parameters.
Equation (1.6) accounts for both the Arrhenius regime and the temperature-independent low-temperature behavior, as described by the fluctuation-inducedtunneling conductivity model. Each of the terms in curly brackets include adescription of the forward current density component, in the direction of theapplied electric field and a backflow current density in the opposite direction.The first term corresponds to the net current in the low-temperature limit, withan abrupt change in the density of states at the Fermi energy, while the otherterms are corrections caused by expansion of the Fermi–Dirac distribution tofirst order in temperature.
Figure 1.7 compares the DC conductivity of nanoporous TiO2 thin films andthe corresponding conductivity curves obtained according to the FITC model
Table 1.2 FITC model parameters used for samples A and B in Figure 1.7,including the effective area A, width w, zero-field barrierheight j0 of the junction and the effective junction diameter given
by dj � 2ffiffiffiffiffiffiffiffiffiA=p
pcompared to the nanocrystallite diameter dnc
measured by XRD.48
dnc (nm) j0 (meV) w (nm) A (nm2) dj (nm)
A 17.0 421 3.45 71.6 9.54B 15.9 388 3.73 22.5 5.35
16 Chapter 1
Dow
nloa
ded
on 1
5/10
/201
3 13
:53:
00.
Publ
ishe
d on
09
Oct
ober
201
3 on
http
://pu
bs.r
sc.o
rg |
doi:1
0.10
39/9
7818
4973
5445
-000
01View Online

with structural parameters given in Table 1.2. Note that the FITC model de-scribes the conductivity data over the entire temperature range, including boththe thermally activated high-temperature regime (T4250 K) and thetemperature-independent regime (To150 K) in quantitative agreement withexperiments. In contrast, the VRH and MTR models can only account for oneof the two regimes with a unique set of parameters. The high-temperatureconductivity for sample B gives an activation energy of 439 meV and a pre-exponential factor of 7.4�10�4 O�1cm�1, assuming a thermally activatedprocess (MTR model), while the VRH model gives s¼ s0 exp[�(T0/T)
1/4] with
s0 ¼ 1:3� 1020 O�1cm�1 and T0¼ 7.4�109 K. The effective zero-field barrierheights of 420 and 390 mV predicted by the FITC model for samples A and B,respectively, are similar to the activation energies Ea measured for the high-temperature data in various studies.63–66 The slope of ln s vs. 1/T in the high-temperature regime is largely determined by j0 and therefore j0EEa.
The value of j0 depends on the distribution of traps below the conduction
band, typically attributed to oxygen vacancies, Tiþ3 states and interface
states.63–66,76 Therefore, j0 depends on measurement and fabrication con-ditions such as the sintering time and exposure to ambient oxygen and N-doping.64–66,76 In fact, the experimental data show that the low-temperatureplateau in the conductivity of sample A is nearly an order of magnitude lowerthan that of sample B, reflecting both a larger barrier height and a widertunneling width (see Table 1.3). Increasing j0 typically decreases the low-temperature plateau conductivity and increases the slope of ln s vs. 1/T in thehigh-temperature region. Increasing the tunneling width w only reduces theformer,69 while increasing the effective junction area A increases the conduct-ivity for the entire temperature range, with a negligible effect on the high-temperature slope. Therefore, it is clear that the parameters A and j0 determinethe dark dc conductivity and can be tuned to optimize performance. Thechallenge ahead is thus to find materials that generate lower conduction bandoffsets, or fabrication conditions that optimize the defect distributions at thecontact junctions.
Table 1.3 Power law exponent s for the frequency-dependent component ofthe ac conductivity measured on different days and the FITC modelparameters extracted from the dc component for the sintered SnO2
nanoparticle film. A, w and j0 are the effective area, width andzero-field barrier height of the junction, respectively and dj is the
effective junction diameter given by dj � 2ffiffiffiffiffiffiffiffiffiA=p
p.
Day s j0 (meV) w (nm) A (nm2) dj (nm)
1 1.23 166 3.13 5.58 2.679 1.13 137 3.68 44.2 7.5011 1.09 113 3.49 11.6 3.8320 sdc only 102 3.43 29.7 6.14
Computational Modeling of Photocatalytic Cells 17
Dow
nloa
ded
on 1
5/10
/201
3 13
:53:
00.
Publ
ishe
d on
09
Oct
ober
201
3 on
http
://pu
bs.r
sc.o
rg |
doi:1
0.10
39/9
7818
4973
5445
-000
01View Online

The FITC model parameters have been compared to atomistic models ofthe contact junctions, obtained by sintering anatase nanoparticles using an-nealing molecular dynamics simulations, after thermalization of the system at450 1C. Typical simulations of the sintering process were performed by usingthe LAMMPS package77 in the NVT ensemble and the force field by Matsuiand Akaogi78 to describe the interactions between the atoms of the nano-particle as in previous work.79 The temperature was maintained at 450 1Cusing a Nose-Hoover thermostat with a damping time of 10 fs. The atomicpositions and velocities were updated using the velocity-Verlet algorithm witha time step of 1 fs and a total run time of 250 ps. Atomic root mean squaredeviations (RMSD) were quantified to characterize the extension of thecontact junctions by alignment of the anatase crystal structure to thecrystalline core of each nanoparticle. Figure 1.9(a) shows a representativeconfiguration of two sintered TiO2 nanoparticles, obtained by annealingmolecular dynamics simulations at 450 1C. A cylindrical sample extractedfrom these two nanoparticles, shown in Figure 1.9(b) reveals the internalatomic structure with non-crystalline TiO2 at the contact junction andnanoparticle surface. The analysis of atomic RMSDs relative to the anatasecrystal structure shown in [Figure 1.9(c)] quantifies the disorder observed inthe non-crystalline phase at the junction and extremities of the cylindricalcore. These RMSDs clearly indicate that the TiO2 nanoparticles have a non-crystalline shell surrounding the crystalline core. This core shell structure isconsistent with reports of the overall TiO2 nanoparticle size, obtained frommicroscopy data, being larger than the nanocrystallite size, determined byXRD.48,74 These results also agree with conductivity measurements ofunsintered, spin-coated nanoparticle thin films that display both thermallyactivated and temperature-independent conductivity regimes,63 suggestingfluctuation-induced carrier tunneling between crystalline cores through non-crystalline shells.
SEM and XRD data, as well as computational structural models, showthat tunneling junctions are formed upon sintering TiO2 nanoparticles, owingto the resulting multiphase composition at the contact.48 The tunneling barrierheight is determined by the energy difference between the conduction bandof crystalline anatase and the electronic states of disordered TiO2 at contact(see Figure 1.8). This picture is consistent with optical pump/THz probemeasurements providing evidence that the AC conductivity is within a factorof 2 to 4 of the single crystal DC value, although the DC conductivity ofphotoexcited nanocrystalline TiO2 and ZnO is suppressed relative to bulkvalues.52, 80 These results are therefore consistent with conductivity limited bytransport through disordered TiO2 at the contact junctions, while carriers arerelatively free within the crystalline nanoparticles. These observations arelimited to vacuum conditions, while the presence of impurities, gas, or anelectrolyte at the junctions might have a significant influence on the shape of thebarriers and therefore on the overall conductivity through the nanoparticlenetwork. It is therefore imperative to explore these effects since they are of greattechnological relevance.
18 Chapter 1
Dow
nloa
ded
on 1
5/10
/201
3 13
:53:
00.
Publ
ishe
d on
09
Oct
ober
201
3 on
http
://pu
bs.r
sc.o
rg |
doi:1
0.10
39/9
7818
4973
5445
-000
01View Online

1.4.2 Power Law Dependence of the Dark AC Conductivity
The total measured ac conductivity can often be separated into frequency-dependent and dc components and expressed as:
sðoÞ ¼ sdc þ s0ðoÞ ð1:7Þ
where s0ðoÞ is the frequency-dependent component of the total conductivity s.In a wide variety of disordered materials, including the systems studied in thiswork, Equation (1.7) is valid and s0ðoÞ has a power law form:81–83
s0ðoÞ ¼ cos ð1:8Þ
where both the power law coefficient c and exponent s have temperature andfrequency dependences that are indicative of the underlying charge transportmechanism. The functional forms of these parameters have been derived formany different models based on quantum mechanical tunneling or hopping.For example, the VRH model predicts a temperature-independent thoughfrequency-dependent s, with a value of 0.8 for a typical characteristic relaxationtime of 10�13 s�1 and a frequency of 10 kHz.82 The correlated barrier hopping(CBH) model also has a frequency-dependent s, though its value tends towards¼ 1 as T-0 K.83 Current efforts are focused on deriving functional forms of cand s based on FITC. The present study focuses on extractions of the dccomponent, which was discussed in the previous section.
Figure 1.10 shows the temperature dependence of the dc conductivity onseveral measurement days spanning a 20-day period. The conductivity of thesample steadily grows with time and saturates after 20–25 days.49 Such aging ofthe sintered SnO2 film is not surprising, as it is well known that the nanoporoussemiconductor films are highly sensitive to the environment owing to their large
Day 20Day 11
Day 9Day 1
335
K
250
K
200
K
150
K
125
K
100
K
78 K
10−9
10−8
10−7
10−6
10−5
10−4
10−3
σ (Ω
−1cm
−1)
1000/T (K−1)
2 4 6 8 10 12 14
Figure 1.10 Temperature dependence of the dc conductivity of the SnO2 sample.Solid lines illustrate the FITC model fitting. The corresponding fittingparameters are listed in Table 1.3.
Computational Modeling of Photocatalytic Cells 19
Dow
nloa
ded
on 1
5/10
/201
3 13
:53:
00.
Publ
ishe
d on
09
Oct
ober
201
3 on
http
://pu
bs.r
sc.o
rg |
doi:1
0.10
39/9
7818
4973
5445
-000
01View Online

surface areas, a fact widely exploited in chemical sensor applications.42,47 Weascribe the aging to changes (under ambient conditions) in the concentration of
trap states, which have been attributed to oxygen vacancies, Tiþ3 states and
interface states.76 In the FITC model, j0 is affected by defect states since theycan reduce the effective barrier height for tunneling, though it is important tonote that the defect states at the contact junction are relevant.
The measured conductivity is well described by the model at all stages ofsample aging. The results of FITC model fitting are shown by solid lines inFigure 1.10 and the contact junction parameters are listed in Table 1.3. Thejunction width w did not change appreciably as the sample aged and no sys-tematic change in the junction area A was observed. This suggests that physicalrearrangement of the nanoparticles was not the primary cause of the increasedconductivity over time. The large spread in the obtained values of A is likely tobe due to a low sensitivity of the FITC fitting procedure to this parametercompared to w and j0 for the range of junction parameters involved. Therewas, however, a systematic lowering of the tunneling barrier j0 with sampleaging (Table 1.3), which is consistent with continuous contaminant adsorptionto SnO2 at the nanoparticle contact junctions. Contaminant adsorption canresult in mid-barrier electronic states in the necking region that effectively lowerj0. Learning how to design materials and fabrication conditions to minimize j0
is of particular interest for designing materials for solar energy conversionapplications because the conductivity is most sensitive to this parameter for theentire range of temperatures studied, including room temperature.
1.4.3 Experimental Methods
Anatase nanoparticles were obtained from Sigma-Aldrich Corporation andIshihara Corporation with diameters ofo25 nm and 7 nm, respectively. 1.5 gof TiO2 was added to 1.3 mL of water, followed by sonication for 15 minutes.For the conductivity measurements, the nanoparticle slurry was spread onto abottom electrode between two fiberglass spacers, which were 200� 4 mm thickwith measured resistance4200 TO. Immediately thereafter, the top electrodewas applied, the excess slurry was removed and the sample was dried for 24 hatB70 1C. Dried samples were annealed at 450 1C for 1 h, the typical sinteringconditions used for DSSCs. The sample electrodes were high chromium contentstainless steel (grade 309). Samples for electrical measurements were lightlyclamped with grade 309 bolts to maintain constant sample-to-electrode contactduring the measurement and eliminate the effects of thermal expansion. Thesamples were loaded in a cryostat (Janis ST-100) and kept in the dark undervacuum (o 20 mTorr) for more than 24 h prior to measurement. A StanfordResearch Systems SR570 low-noise current preamplifier was used to supply a4 V bias and measure the current in a two-terminal measurement. To quantifythe contact resistance in our devices, we varied the thickness of the TiO2
nanoparticle films. We found that the use of chromium-rich stainless steel as thecontact surface minimizes both the oxide layer formed on the electrode during
20 Chapter 1
Dow
nloa
ded
on 1
5/10
/201
3 13
:53:
00.
Publ
ishe
d on
09
Oct
ober
201
3 on
http
://pu
bs.r
sc.o
rg |
doi:1
0.10
39/9
7818
4973
5445
-000
01View Online

sintering and the corresponding contact resistance, which is negligible com-pared to the resistance of the TiO2 film.
SnO2 nanoparticles with diameters of 22–43 nm where purchased from AlfaAesar (tin (IV) oxide, NanoArc) for ac impedance and dc resistance measure-ments on sintered nanoparticle films. Nanoparticle slurry was made from 1.1 gof nanoparticle powder and 1 ml of distilled water by mixing with pestle andmortar. The sample was prepared with electrodes as described above for ana-tase samples, dried for 1 week at room temperature and then annealed in air at450 1C for 40 minutes, the typical sintering conditions used for SnO2 inDSSCs.84 The applied bias voltage for the SnO2 sample was 0.2V and thesample displayed a linear I–V curve at room temperature at bias voltages up to1 V. AC impedance was measured in the 0.3–30 000 Hz range using a StanfordResearch Systems SR830 digital lock-in amplifier with ac biases of 0.25 and 1 V.
1.5 Calculations of Redox Potentials: Reduction of
Systematic Error
We recently presented a practical, yet rigorous, methodology for quantitativepredictions of redox potentials of transition metal complexes.85 This is a par-ticularly powerful tool in the context of solar energy conversion since it can givevaluable insight into catalytic mechanisms and provide guidelines for the designof new electrocatalysts. In Section 1.2, we emphasized the importance of thepotential of the regenerative electron mediators (e.g., I�3 =I
� vs. Br�3 =Br� redox
couples), the position of the donor excited state level relative to the DOS of themetal oxide conduction band and the general investigation and optimization ofthe energy level alignment between of the redox active species in photoelec-trochemical cells (Figure 1.1). Just as the ground and excited states can beestimated experimentally using cyclic voltammetry together with absorptionand emission spectra, these data can be predicted using calculations of theground state redox potential in parallel with the absorption spectra simulationmethodologies discussed in Section 1.3. These predictive abilities enable therational design of system components (e.g., sensitizer, redox mediator, pho-tocatalyst) with optimal energetics.
The method reduces systematic errors that result from the theoretical ap-proach (i.e., the choice of DFT functional, basis set and solvation model) aswell as the electrochemical measurement conditions, including the nature of thesolvent, electrolyte and working electrode. Therefore, this method is particu-larly reliable in correlating experimental and theoretical data, even for second-and third-row transition metal complexes for which larger deviations have beenpreviously reported. Standard methods for computation of redox potentials arecommonly applied in electrochemical studies,86–101 although methodologiesthat could account for systematic uncertainties about experimental or com-putational origin had yet to be established. Earlier reports typically docu-mented deviations between experimental and theoretical values of redoxpotentials in the 150–540 mV range for most of the available
Computational Modeling of Photocatalytic Cells 21
Dow
nloa
ded
on 1
5/10
/201
3 13
:53:
00.
Publ
ishe
d on
09
Oct
ober
201
3 on
http
://pu
bs.r
sc.o
rg |
doi:1
0.10
39/9
7818
4973
5445
-000
01View Online

methodologies.86–94 While these deviations continue to stimulate the develop-ment of more sophisticated DFT functionals, basis sets and solvation models,we note that deviations in the documented experimental data can often be amajor factor in accounting for discrepancies of comparable magnitude. This islargely due to the fact that redox properties are typically quite sensitive to theparticular choice of solvent, electrode, or electrolyte conditions. Therefore,identifying and reducing these sources of error is critical in establishing thecapabilities and limitations of existing methods as well as for the design of newcomputational approaches.
In this section we outline a systematic methodology for removing un-certainties that are commonly included in comparisons between experimentaland theoretical redox potentials, which are frequently reported relative to ex-ternal reference couples, or reference electrodes. We study benchmark redoxcouples, including complexes that span three transition metal rows in variousnon-aqueous solvents. It is shown that the use of appropriate references,measured under the same conditions and calculated by using compatiblecomputational frameworks, allows quantitative correlations between experi-mental and theoretical data. This approach leads to DFT redox potentials withstandard deviations comparable to the experimental errors of cyclic voltam-metry measurements, even at a rather modest level of theory (64 mV standarddeviation for DFT/UB3LYP/LACVP/6-311G* level; see Figure 1.11).
Figure 1.11 Top: Correlation between measured E0exp and calculated E0
calcredox potentials in V vs. RC, where RC¼ [FeCp2]
0/1, [Ru(bpy)3]21/31 and
[Ir(acac)3]0/1 for first-, second-, and third-row transition-metal com-
plexes, respectively, at the DFT/UB3LYP/LACVP/6-311G* level oftheory. Bottom: Distribution in E0
calc � E0exp (� 2 mV mean and 64 mV
standard deviation).
22 Chapter 1
Dow
nloa
ded
on 1
5/10
/201
3 13
:53:
00.
Publ
ishe
d on
09
Oct
ober
201
3 on
http
://pu
bs.r
sc.o
rg |
doi:1
0.10
39/9
7818
4973
5445
-000
01View Online
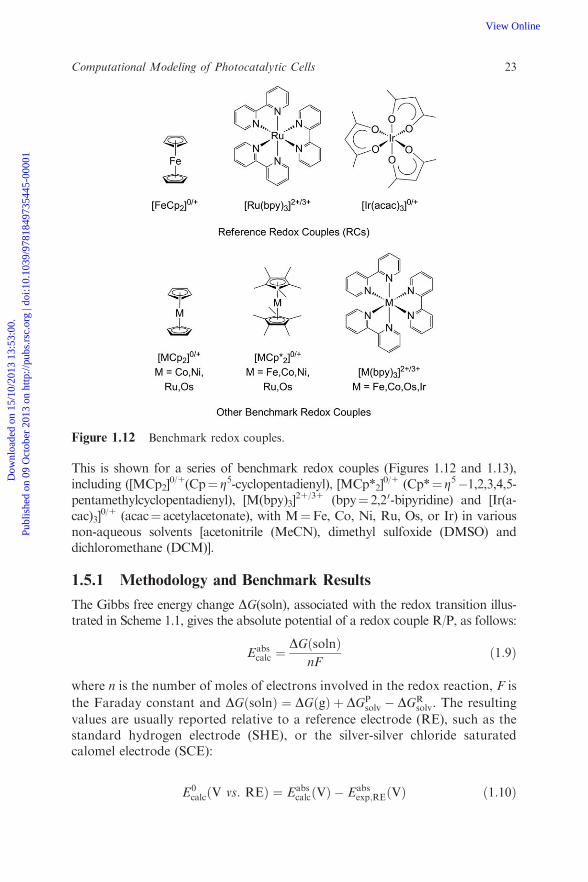
This is shown for a series of benchmark redox couples (Figures 1.12 and 1.13),including ([MCp2]
0/1(Cp¼ Z5-cyclopentadienyl), [MCp*2]0/1 (Cp*¼ Z5�1,2,3,4,5-
pentamethylcyclopentadienyl), [M(bpy)3]21/31 (bpy¼ 2,20-bipyridine) and [Ir(a-
cac)3]0/1 (acac¼ acetylacetonate), with M¼Fe, Co, Ni, Ru, Os, or Ir) in various
non-aqueous solvents [acetonitrile (MeCN), dimethyl sulfoxide (DMSO) anddichloromethane (DCM)].
1.5.1 Methodology and Benchmark Results
The Gibbs free energy change DG(soln), associated with the redox transition illus-trated in Scheme 1.1, gives the absolute potential of a redox couple R/P, as follows:
Eabscalc ¼
DGðsolnÞnF
ð1:9Þ
where n is the number of moles of electrons involved in the redox reaction, F is
the Faraday constant and DGðsolnÞ ¼ DGðgÞ þ DGPsolv � DGR
solv. The resulting
values are usually reported relative to a reference electrode (RE), such as thestandard hydrogen electrode (SHE), or the silver-silver chloride saturatedcalomel electrode (SCE):
E0calcðV vs: REÞ ¼ Eabs
calcðVÞ � Eabsexp;REðVÞ ð1:10Þ
Figure 1.12 Benchmark redox couples.
Computational Modeling of Photocatalytic Cells 23
Dow
nloa
ded
on 1
5/10
/201
3 13
:53:
00.
Publ
ishe
d on
09
Oct
ober
201
3 on
http
://pu
bs.r
sc.o
rg |
doi:1
0.10
39/9
7818
4973
5445
-000
01View Online

Experimental redox potentials are typically reported with respect to a ref-erence redox couple (RC), such as ferrocene/ferrocenium ([FeCp2]
0/1):
E0expðV vs: RCÞ ¼ E0
expðV vs: REÞ � E0exp ;RCðV vs: REÞ ð1:11Þ
Therefore, comparisons between calculated E0calcðV vs: REÞ and experi-
mental E0expðV vs: REÞ values require accurate potentials of the redox couples
relative to the reference electrodes. However, the experimental values of boththe redox couples and reference electrodes vary by hundreds of millivolts fromsolvent to solvent, or from experiment to experiment with the same solvent butdifferent electrolytes (Table 1.4). Furthermore, the SCE typically generates aliquid junction potential that may not be reproducible in a given experiment
–400
–200
0
200
400
600
800
–2.5 –2 –1.5 –1 –0.5 0 0.5 1 1.5 2
Cur
rent
den
sity
(μA
/cm
2 )
Potential (V vs. [FeCp2]0/+)
Figure 1.13 Cyclic voltammograms of [CoCp*2]0/1 (blue), [CoCp2]
0/1 (red),
[FeCp*2]0/1 (green), [FeCp2]
0/1 (black), [Ir(acac)3]0/1 (grey) and
[Ru(bpy)3]21/31 (purple) couples in 0.1 M [NBu4][BF4] in acetonitrile
(100 mV s�1 scan rate, T¼ 25 1C, current density of [Ir(acac)3]0/1 is
reduced by a factor of 3).
R(g) P(g)
P(soln)R(soln)
ΔGPsolv−ΔGR
solv
ΔG(soln)
ΔG(g)
Scheme 1.1 Thermodynamic cycle used for the calculation of changes in free energyin solution DG(soln) from states R to P based on gas-phase minimum-energy geometries and solvation free energies DGsolv.
24 Chapter 1
Dow
nloa
ded
on 1
5/10
/201
3 13
:53:
00.
Publ
ishe
d on
09
Oct
ober
201
3 on
http
://pu
bs.r
sc.o
rg |
doi:1
0.10
39/9
7818
4973
5445
-000
01View Online

and non-aqueous reference electrodes are prone to issues of reproducibilitycaused by electrode surface chemistry.106 In addition, the reference redoxcouple (such as the ferrocene/ferrocenium pair) can change by tens to hundredsof mV with solvent or electrolyte (see Table 1.5 and Section 1.5.3).107–110 All ofthese aspects therefore introduce systematic errors into the correlation betweenexperimental and theoretical data. Removing this uncertainty requires com-parison of experimental and calculated redox potentials relative to a redoxcouple measured under the same solvent and electrolyte conditions, rather thanrelative to a reference electrode.
An outstanding challenge is to identify a set of redox couples that could beused as internal references for a wide range of electrolytes, solvents andworking electrode conditions. Calculated redox potentials would then be re-ported as follows:
E0calcðV vs: RCÞ ¼ Eabs
calcðVÞ � Eabscalc;RCðVÞ ð1:12Þ
where both Eabscalc and Eabs
calc;RC are computed according to Equation (1.9).
Analogous internal reference methodologies are common practice in otherfields (e.g., reports of NMR chemical shifts) and reduce the systematic un-certainties caused by the sensitivity of the measurements to experimentalconditions. Recent studies have shown that errors are significantly reduced
when E0expðV vs: RCÞ, obtained via Equation (1.11), is compared to
E0calcðV vs: RCÞ calculated via Equation (1.12) and the following criteria are
met:85 (i) Eabscalc and Eabs
calc;RC in Equation (1.12) are calculated using identical
conditions (e.g., same level of theory and solvent parameters); (ii) E0exp and
Table 1.4 Experimental redox potentials reportedfor the SHE in various solvents.102–105
Solvent Eabsexp;SHEðVÞ
Water 4.24–4.44Acetonitrile 4.56–4.66Dimethylsulfoxide 3.83–4.04Ethanol 4.20–4.24
Table 1.5 Redox potentials for the [FeCp2]0/1 couple (in V vs. SCE) in
various solvents and electrolyte solutions.107–110
Solvent Li[ClO4]a [NBu4][ClO4]
108 [NEt4][PF6]109 [NBu4][PF6]
110
MeCN 0.31 0.40 0.38 0.40DMSO 0.45 0.43DCM 0.48 0.46DMF 0.47 0.46 0.45
aKuwana et al.,107 quarter-wave potential.
Computational Modeling of Photocatalytic Cells 25
Dow
nloa
ded
on 1
5/10
/201
3 13
:53:
00.
Publ
ishe
d on
09
Oct
ober
201
3 on
http
://pu
bs.r
sc.o
rg |
doi:1
0.10
39/9
7818
4973
5445
-000
01View Online

E0exp;RC in Equation (1.11) are measured under identical conditions, for ex-
ample, the same solvent, electrolyte and working electrode; (iii) A reference
transition metal complex is chosen for E0exp;RC in Equation (1.11) and the cal-
culation of Eabscalc;RC in Equation (1.12) is such that the metal lies in the same row
of the periodic table as the complex used to calculate E0calc. These criteria are
discussed in more detail in Sections 1.5.3 to 1.5.5.
1.5.2 Density Functional Theory Computational Methods
DFT calculations were performed using the B3LYP exchange correlationfunctional with unrestricted Kohn–Sham wave functions (UB3LYP) as im-plemented in the Jaguar electronic structure program.111 Minimum energyconfigurations were obtained by using a mixed basis in which the metalcenters are described by the non-relativistic effective core potentials (ECPs) ofthe LACVP basis set. Different levels of theory were used in an effort tocompare the effect of the ligand basis set on the resulting correlation betweencalculated and experimental data. In order of increasing computational cost,the ligand basis sets investigated were 6-31G, 6-311G* and Dunning’scorrelation-consistent triple-z basis set112–114 cc-pVTZ(-f), which includes adouble set of polarization functions. In addition, the geometry optimizationsbased on 6-31G and 6-311G* basis sets were followed by UB3LYP singlepoint energy calculations with the cc-pVTZ(-f) basis. The resulting correl-ations with experimental data were analyzed to assess the minimum compu-tational effort necessary for quantitative prediction of redox potentials andthe validity of the single-point approximation method, a commonly usedmethod to save on computational cost, as it applies to calculations of redoxpotentials.
All reduction potentials were computed, according to Equation (1.9), bycalculating the free energy changes DG(soln) associated with reduction of thecomplexes in solution, as follows:
DGðsolnÞ ¼ DGðgÞ þ DGPsolv � DGR
solv ð1:13Þ
where DG(g)¼DH(g)�TDS(g) is the free energy change for the reduction re-action in the gas phase. Solvation free energies for reactants and products,
DGRsolv and DGP
solv, respectively, were computed using the standard self-
consistent reaction field approach for the gas phase minimum energy con-figurations with dielectric constants of e¼ 8.93, 37.5 and 47.24 and solvent radiiof 2.33, 2.19 and 2.41 A for DCM, MeCN and DMSO, respectively.111,112
1.5.3 Method Benchmark Results
The correlation between the computational and experiment data vs. RC, whereRC¼ [FeCp2]
0/1, [Ru(bpy)3]21/31 and [Ir(acac)3]
0/1 for first- (red), second-(navy) and third-row (green) metal complexes, respectively, is shown in
26 Chapter 1
Dow
nloa
ded
on 1
5/10
/201
3 13
:53:
00.
Publ
ishe
d on
09
Oct
ober
201
3 on
http
://pu
bs.r
sc.o
rg |
doi:1
0.10
39/9
7818
4973
5445
-000
01View Online

Figure 1.11 for the DFT/UB3LYP/LACVP/6-311G* level of theory. This levelof theory, though not the most computationally expensive, is the best per-forming in terms of standard deviation with respect to the experimental data.This level gives a standard deviation of 56 mV for 12 of 18 couples that lie in thefirst row, compared to 150 and 90 mV when using 6-31G and cc-pVTZ(-f) basissets, respectively. When the same [FeCp2]
0/1 RC is used and extended to allcouples, the standard deviation using 6-311G* rises to 148 mV. Although thisstandard deviation is an improvement over previous reports of method per-formance, which we attribute to reductions in systematic error in the experi-mental data, it still marks a sharp decrease in performance compared to thefirst-row couples alone. However, when a RC with a similar ECP is used, thevalues are comparable to the first-row statistics. The DFT/UB3LYP/LACVP/6-311G* level of theory yields a standard deviation of 64 mV and a mean of–2 mV for all 18 couples.
1.5.4 Choice of Reference Redox Couple
Internal reference redox couples can provide results that are consistent over awide range of experimental conditions since they bypass problems common toreference electrodes Like SCE or SHE that might generate liquid junctionpotentials. Even non-aqueous reference electrodes are prone to issues ofreproducibility owing to electrode surface chemistry.106 These factors cancontribute to discrepancies on the order of tens to hundreds of millivolts, evenwhen comparing measurements reported under the same electrolyte and solventconditions. Internal reference redox couples can remove these systematicuncertainties.
Earlier computational studies have been focused on finding appropriate func-tionals and basis sets to obtain accurate estimates of absolute redox poten-tials.86–94 However, removing systematic errors caused by variations in theexperimental conditions requires referencing the calculated potentials to redoxcouples calculated with the same functional and basis set, as in Equation (1.12).These systematic errors are partially canceled when the reference is calculated
directly (e.g., see Table 1.4). This is important since the accuracy of E0calcðVvs:RCÞ
is equally as dependent on the reference value as it is on the calculated absolutepotential of the couple being studied [Equations (1.10) and (1.12)].
The results of Section 1.5.3 show that a suitable choice of a reference redoxcouple is period dependent.85 For example, the [FeCp2]
0/1 redox couple is avaluable reference for transition metal complexes of the first period in non-aqueous solutions and has been extensively used in a host of electrochemicalstudies under a wide variety of experimental conditions.85,108,110,115–119 Inaddition, several studies have explored first principle methods for calculatingredox potentials with [FeCp2]
0/1 as a reference RC.87,98 While comparisons fortransition metal complexes of the first period have been successful, comparisonsfor second- and third-row transition metal complexes have proven to be morechallenging. These discrepancies are likely to be due to systematic errors
Computational Modeling of Photocatalytic Cells 27
Dow
nloa
ded
on 1
5/10
/201
3 13
:53:
00.
Publ
ishe
d on
09
Oct
ober
201
3 on
http
://pu
bs.r
sc.o
rg |
doi:1
0.10
39/9
7818
4973
5445
-000
01View Online

introduced by the choice of basis sets, pseudopotentials, or solvation modelsthat are expected to be comparable for transition metals of the same period.Therefore, reference couples based on transition metals of the same period asthe system of interest should partially cancel the resulting systematic deviationsand provide satisfactory results.
[FeCp2]0/1 is the most common choice of RC. References for the second and
third row, however, are a bit more challenging and have yet to be established.Electrochemical data is scarce and for most complexes (e.g., the metalloceneanalogs) the measurements are reproducible only under limited experimentalconditions. For example, it has been shown that ruthenocene and osmoceneexhibit single, quasi-reversible oxidation waves in solutions of DCM and[NBu4][B(ArF)4] (ArF¼ 3,5-bistrifluoromethylphenyl).119 However, in MeCN,oxidation of these metallocenes involves irreversible processes.115 In addition,the [RhCp2]
0/1 couple can be highly reversible while the lifetime of rhodocene ison the order of seconds and is unstable at room temperature on the cyclicvoltammetry timescale.120 Therefore, instead of the metallocene analogs, ref-erence couples for the second and third period have been based on[Ru(bpy)3]
21/31, which is of interest in photoredox catalysis and artificialphotosynthesis,121–123 and [Ir(acac)3]
0/1, which is often used as a precursor forcomplexes relevant to organic light-emitting diodes.124–126 Both of these com-plexes show reversible or quasi-reversible peaks in both DCM and MeCN.
1.5.5 Accounting for Solvent Polarity and Supporting
Electrolyte
The solvent and supporting electrolyte can significantly influence both thereference and the couple being studied. As an example, Figure 1.14 shows cyclicvoltammograms of [FeCp2]
0/1 measured in 0.1 M [NBu4][BF4] in MeCN,DMSO and DCM solvents. The redox potential of such a couple is 84 (MeCN),33 (DMSO) and 210 (DCM) mV vs. Ag/AgNO3, with a significant shift as largeas 177 mV when comparing the oxidation potential in DCM relative to DMSO(see Figure 1.14). Similarly, calculations predict a shift of 179 mV in the calcu-lated absolute redox potential of the [FeCp2]
0/1 couple in DMSO and DCMusing the DFT/UB3LYP/LACVP/6-311G* level of theory. These results illus-trate the capabilities of self-consistent reaction field methods to account forsolvent effects in electrochemistry calculations which are essential for comparisonto experimental data.
The supporting electrolyte also affects the values for the redox potentialsobtained by cyclic voltammetry and should be accounted for when comparingcalculated and experimental data. The electrolyte affects the ionic strength, theconductivity and reactivity as well as the effective dielectric constant of themedium.127 In addition, ion pairing with the supporting electrolyte counterionscan become favorable in low dielectric solvents or when the complex is highlycharged, as in the case of the [Ru(bpy)3]
21/31 couple. All of these effects can bepartially removed by referring the measured potentials relative to an internal
28 Chapter 1
Dow
nloa
ded
on 1
5/10
/201
3 13
:53:
00.
Publ
ishe
d on
09
Oct
ober
201
3 on
http
://pu
bs.r
sc.o
rg |
doi:1
0.10
39/9
7818
4973
5445
-000
01View Online

reference to analogous electrolyte interactions. As an example, we consider theredox potential of the [Ru(bpy)3]
21/31 couple which is higher in DCM than inMeCN by 174 mV vs. Ag/AgNO3. However, when explicit [BF4]
� counterionsare included in DCM, the calculated difference in absolute potential is 102 mVat the DFT/UB3LYP/LACVP/6-311G* level of theory. In contrast, a shift of574 mV is obtained when ion pairing is neglected. Therefore, it is clear that ionpairing can account for significant shifts (e.g., 472 mV in low-polar DCM,e¼ 8.93). These results emphasize the importance of including explicit coun-terions for highly charged species in low-polarity solvents.
1.6 Conclusions and Outlook
Photocatalytic solar cells based on semiconductor materials functionalized withearth-abundant transition metal complexes are promising developments thatshould allow the sustainable production of chemical fuel from renewable re-sources (e.g., water). In this chapter we have reviewed recent advances incomputational modeling of fundamental aspects and mechanisms that affectthe overall efficiency of solar light photoconversion, as determined by photo-absorption, charge transport and redox properties of systems with molecularadsorbates on metal oxide surfaces. While powerful on its own, when combinedwith structural and mechanistic characterization based on high-resolutionspectroscopy and electrochemistry, the resulting computational methods arepowerful tools for the design and characterization of new photocatalytic ma-terials. These emerging methods are thus expected to continue to make sig-nificant contributions to the development of novel semiconductor materials forphotocatalytic solar cell applications.
The chapter has focused on computational methods for analyzing completesolar cell assemblies using equivalent circuit modeling. A photoelectrochemical
–300
–200
–100
0
100
200
300
400
–2 –1.5 –1 –0.5 0 0.5 1 1.5
Cur
rent
den
sity
(μA
/cm
2 )
Potential (V vs. Ag/AgNO3)
MeCNDMSO
DCM
Figure 1.14 Cyclic voltammograms of the [FeCp2]0/1 couple in 0.1 M [NBu4][BF4] in
acetonitrile (red), dimethylsulfoxide (blue) and dichloromethane (green)solvents (100 mV s�1 scan rate, T¼ 25 1C).
Computational Modeling of Photocatalytic Cells 29
Dow
nloa
ded
on 1
5/10
/201
3 13
:53:
00.
Publ
ishe
d on
09
Oct
ober
201
3 on
http
://pu
bs.r
sc.o
rg |
doi:1
0.10
39/9
7818
4973
5445
-000
01View Online

device model can be used to study current–voltage characteristics to provide adeeper understanding of the physical and electrochemical processes importantto device performance. When used in conjunction with the methodologiesdiscussed in order to calculate redox potentials, absorption spectra and theother relevant device parameters, these predictive abilities enable the rationaldesign of photocatalytic solar cells, including tandem two-photon Z-schemesbased on high potential photoanodes. Therefore, the computational methodsdiscussed represent valuable tools for accurate prediction of redox potentials,photoabsorption and conductivity at the photoanode surface, which are ne-cessary for optimizing the energetics of fundamental processes that determinethe performance of photoelectrocatalytic devices.
The analysis of redox potentials in transition metal complexes shows thatcalculated and experimental data can be correlated with a standard deviation of64 mV for 18 benchmark redox potentials and seven reference potentials cal-culated at the DFT/UB3LYP level of theory with LACVP and 6-311G* basissets. This correlation is within the experimental error of cyclic voltammetrymeasurements and is achieved when using three important guidelines for re-ducing systematic error: (i) using an experimental reference redox couplemeasured under the same experimental conditions as the system of interest; (ii)using a computational reference redox couple calculated at the same level oftheory (which serves the dual purpose of removing computational systematicerror while preventing the use of an external measurement of the absolutepotential of a reference electrode that can introduce additional experimentalsystematic error); (iii) using references with metal centers of the same row of theperiodic table as the electrochemically active complex. The choice of referenceis essential to ensure a reduction of computational systematic error sinceelements in the same row share a common set of core electrons and there istherefore better agreement of the pseudopotentials of the metal basis set. Theresulting methodology leads to accurate calculations of redox potentials at arelatively low computational cost, even for transition metal complexes in thesecond and third rows for which poor performance was previously reportedand assigned to deficiencies in the DFT functionals.
Charge carrier collection and series resistance can have a significant impacton the efficiency of photoelectrocatalytic devices. It is therefore important tounderstand the mechanisms of electrical conductivity in photoanodes andphotocathodes. It has been shown that the FITC model can describe electrontransport in nanoporous metal oxide thin films in quantitative agreement withexperimental data over the entire range of temperature accessible to reliablemeasurements. The structural parameters extracted from the conductivity dataare consistent with the characterization of sintered TiO2 nanoparticle films bySEM, XRD and annealing molecular dynamics simulations. The analysis re-veals that the sintering process forms disordered TiO2, surrounding the crys-talline core of nanoparticles and at the points of contact between thenanoparticle cores. The contact junctions determine rate-limiting energy bar-riers for electron transport from nanoparticle to nanoparticle that are signifi-cantly affected by the preparative procedures and by thermal fluctuations in the
30 Chapter 1
Dow
nloa
ded
on 1
5/10
/201
3 13
:53:
00.
Publ
ishe
d on
09
Oct
ober
201
3 on
http
://pu
bs.r
sc.o
rg |
doi:1
0.10
39/9
7818
4973
5445
-000
01View Online

density of free carriers. Therefore, improvements in emerging technologiesbased on nanoporous TiO2 electrodes could be focused on ways of optimizingthe nanoparticle interconnectivity and on sintering conditions that wouldprovide optimum particle size and shape, choice of electrolyte, ambient con-ditions that affect the level of doping and therefore the alignment of electronicenergy levels at the interparticle contact junctions. AC conductivity measure-ments of sintered SnO2 nanoparticle films exhibit a power law behavior with adc component that is in quantitative agreement with the FITC description ofelectronic transport. This, coupled with the results for nanoporous TiO2 filmsand other systems that share a similar inhomogeneous microstructure, suggeststhat the FITC mechanism may have broad applicability for the wide variety ofmaterials used for solar energy conversion.
Acknowledgements
This work was supported by the Office of Basic Energy Sciences of the USDepartment of Energy (DE-FG02-07ER15909) and supercomputer time fromNERSC and XSEDE. This work was also supported in part by the facilities andstaff of the Yale University Faculty of Arts and Sciences High PerformanceComputing Center and by the National Science Foundation under grant #CNS08-21132 that partially funded acquisition of the facilities.
References
1. N. S. Lewis and D. G. Nocera, Proc. Natl. Acad. Sci. U.S.A., 2006, 103,15729–15735.
2. A. J. Esswein and D. G. Nocera, Chem. Rev., 2007, 107, 4022–4047.3. J. P. McEvoy and G. W. Brudvig, Chem. Rev., 2006, 106, 4455–4483.4. S. Karlsson, J. Boixel, Y. Pellegrin, E. Blart, H.-C. Becker, F. Odobel and
L. Hammarstrom, Faraday Discuss., 2012, 155, 233–252.5. R. Eisenberg and H. B. Gray, Inorg. Chem., 2008, 47, 1697–1699.6. F. Liu, J. J. Concepcion, J. W. Jurss, T. Cardolaccia, J. L. Templeton and
T. J. Meyer, Inorg. Chem., 2008, 47, 1727–1752.7. Y. Umena, K. Kawakami, J.-R. Shen and N. Kamiya, Nature, 2011, 473,
55–60.8. A. Fujishima and K. Honda, Nature, 1972, 238, 37–8.9. N. D. McDaniel, F. J. Coughlin, L. L. Tinker and S. Bernhard, J. Am.
Chem. Soc., 2008, 130, 210–217.10. J. F. Hull, D. Balcells, J. D. Blakemore, C. D. Incarvito, O. Eisenstein,
G. W. Brudvig and R. H. Crabtree, J. Am. Chem. Soc., 2009, 131, 8730–8731.
11. G. Li, E. M. Sproviero, R. C. Snoeberger III, N. Iguchi, J. D. Blakemore,R. H. Crabtree, G. W. Brudvig and V. S. Batista, Energy Environ. Sci.,2009, 2, 230–238.
12. J. Limburg, J. S. Vrettos, L. M. Liable-Sands, A. L. Rheingold,R. H. Crabtree and G. W. Brudvig, Science, 1999, 283, 1524–1527.
Computational Modeling of Photocatalytic Cells 31
Dow
nloa
ded
on 1
5/10
/201
3 13
:53:
00.
Publ
ishe
d on
09
Oct
ober
201
3 on
http
://pu
bs.r
sc.o
rg |
doi:1
0.10
39/9
7818
4973
5445
-000
01View Online

13. E. M. Sproviero, J. A. Gascon, J. P. McEvoy, G. W. Brudvig andV. S. Batista, Curr. Opin. Struct. Biol., 2007, 17, 173–180.
14. E. M. Sproviero, J. A. Gascon, J. P. McEvoy, G. W. Brudvig andV. S. Batista, Coord. Chem. Rev., 2008, 252, 395–415.
15. W. J. Youngblood, S.-H. A. Lee, K. Maeda and T. E. Mallouk, Acc.Chem. Res., 200, 42, 1966–73.
16. M. W. Kanan and D. G. Nocera, Science, 2008, 321, 1072–1075.17. M. W. Kanan, Y. Surendranath and D. G. Nocera, Chem. Soc. Rev., 200,
38, 109–114.18. Z. Chen, J. J. Concepcion, J. W. Jurss and T. J. Meyer, J. Am. Chem. Soc.,
2009, 131, 15580–15581.19. J. J. Concepcion, J. W. Jurss, M. K. Brennaman, P. G. Hoertz, A. O.
T. Patrocinio, N. Y. Murakami Iha, J. L. Templeton and T. J. Meyer,Acc. Chem. Res., 2009, 42, 1954–1965.
20. J. J. Concepcion, J. W. Jurss, M. R. Norris, Z. Chen, J. L. Templeton andT. J. Meyer, Inorg. Chem., 2010, 49, 1277–1279.
21. S. W. Gersten, G. J. Samuels and T. J. Meyer, J. Am. Chem. Soc., 1982,104, 4029–4030.
22. R. Brimblecombe, A. M. Bond, G. C. Dismukes, G. F. Swiegers andL. Spiccia, Phys. Chem. Chem. Phys., 2009, 11, 6441–6449.
23. R. Brimblecombe, G. F. Swiegers, G. C. Dismukes and L. Spiccia, Angew.Chem., Int. Ed., 200, 47, 7335–7338.
24. A. Mills and S. L. Hunte, J. Photochem. Photobiol., A, 1997, 108,1–35.
25. J. A. Treadway, J. A. Moss and T. J. Meyer, Inorg. Chem., 1999, 38, 4386–4387.
26. G. F. Moore, S. J. Konezny, H.-e. Song, R. L. Milot, J. D. Blakemore,M. L. Lee, V. S. Batista, C. A. Schmuttenmaer, R. H. Crabtree andG. W. Brudvig, J. Phys. Chem. C, 2012, 116, 4892–4902.
27. S. M. Sze, Physics of Semiconductor Devices, John Wiley & Sons, 1981,p 868.
28. S. Dongaonkar, J. D. Servaites, G. M. Ford, S. Loser, J. Moore,R. M. Gelfand, H. Mohseni, H. W. Hillhouse, R. Agrawal, M. A. Ratner,T. J. Marks, M. S. Lundstrom and M. A. Alam, J. Appl. Phys., 2010,108, 124509.
29. J. Halme, P. Vahermaa, K. Miettunen and P. Lund, Adv. Mater., 2010,22, E210–E234.
30. Z.-S. Wang, K. Sayama and H. Sugihara, J. Phys. Chem. B, 2005, 109,22449–22455.
31. D. Rehm and A. Weller, Ber. Bunsenges. Phys. Chem., 1969, 73,834–839.
32. M. Gratzel, Nature, 2001, 414, 338–344.33. G. Boschloo and A. Hagfeldt, Acc. Chem. Res., 2009, 42, 1819–1826.34. G. F. Moore, J. D. Blakemore, R. L. Milot, J. F. Hull, H.-e. Song, L. Cai,
C. A. Schmuttenmaer, R. H. Crabtree and G. W. Brudvig, Energy En-viron. Sci., 2011, 4, 2389–2392.
32 Chapter 1
Dow
nloa
ded
on 1
5/10
/201
3 13
:53:
00.
Publ
ishe
d on
09
Oct
ober
201
3 on
http
://pu
bs.r
sc.o
rg |
doi:1
0.10
39/9
7818
4973
5445
-000
01View Online

35. C. Garau, A. Frontera, D. Quinonero, P. Ballester, A. Costa andP. M. Deya, ChemPhysChem, 2003, 4, 1344–1348.
36. C. Garau, A. Frontera, D. Quinonero, P. Ballester, A. Costa andP. M. Deya, J. Phys. Chem. A, 2004, 108, 9423–9427.
37. R. E. Blankenship, D. M. Tiede, J. Barber, G. W. Brudvig, G. Fleming,M. Ghirardi, M. R. Gunner, W. Junge, D. M. Kramer, A. Melis,T. A. Moore, C. C. Moser, D. G. Nocera, A. J. Nozik, D. R. Ort,W. W. Parson, R. C. Prince and R. T. Sayre, Science, 2, 332, 805–809.
38. D. Xiao, L. A. Martini, R. C. Snoeberger, R. H. Crabtree andV. S. Batista, J. Am. Chem. Soc., 2011, 133, 9014–9022.
39. W. R. McNamara, R. C. Snoeberger, G. Li, J. M. Schleicher, C. W. Cady,M. Poyatos, C. A. Schmuttenmaer, R. H. Crabtree, G. W. Brudvig andV. S. Batista, J., Am. Chem. Soc., 2008, 130, 14329–14338.
40. C. J. Barbe, F. Arendse, P. Comte, M. Jirousek, F. Lenzmann,V. Shklover and M. Gratzel, J. Am. Ceram. Soc., 1997, 80, 3157–3171.
41. M. Gratzel, Chem. Lett., 2005, 34, 8–13.42. X. Chen and S. S. Mao, Chem. Rev., 2007, 107, 2891–2959.43. M. Hoffmann, S. Martin, W. Choi and D. Bahnemann, Chem. Rev., 1995,
95, 69–96.44. O. Carp, C. L. Huisman and A. Reller, Prog. Solid State Chem., 2004, 32,
33–177.45. C. Bechinger, S. Ferrere, A. Zaban, J. Sprague and B. A. Gregg, Nature,
1996, 383, 608–610.46. C. G. Granqvist, Sol. Energy Mater. Sol. Cells, 2007, 91, 1529–1598.47. M. Tiemann, Chem. Eur. J., 2007, 13, 8376–8388.48. S. J. Konezny, C. Richter, R. C. Snoeberger III, A. R. Parent,
G. W. Brudvig, C. A. Schmuttenmaer and V. S. Batista, J. Phys. Chem.Lett., 2011, 2, 1931–1936.
49. S. J. Konezny, D. Talbayev, I. E. Baggari, C. A. Schmuttenmaer andV. S. Batista, Proc. SPIE, 2007, 8098, 809805.
50. P. E. Jongh and D. Vanmaekelbergh, Phys. Rev. Lett., 1996, 77, 3427–3430.
51. T. Dittrich, J. Weidmann, F. Koch, I. Uhlendorf and I. Lauermann, Appl.Phys. Lett., 1999, 75, 3980–3982.
52. G. M. Turner, M. C. Beard and C. A. Schmuttenmaer, J. Phys. Chem. B,2002, 106, 11716–11719.
53. C. O. Park and S. A. Akbar, J. Mater. Sci., 2003, 38, 4611–4637.54. A. J. Frank, N. Kopidakis and J. van de Lagemaat, Coord. Chem. Rev.,
2004, 248, 1165–1179.55. J. Nelson and R. E. Chandler, Coord. Chem. Rev., 2004, 248, 1181–1194.56. G. Boschloo and A. Hagfeldt, J. Phys. Chem. B, 2005, 109, 12093–12098.57. L. M. Peter, A. B. Walker, G. Boschloo and A. Hagfeldt, J. Phys. Chem.
B, 2006, 110, 13694–13699.58. N. Kopidakis, K. D. Benkstein, J. van de Lagemaat, A. J. Frank, Q. Yuan
and E. A. Schiff, Phys. Rev. B, 2006, 73, 045326.59. J. Bisquert, J. Phys. Chem. C, 2007, 111, 17163–17168.
Computational Modeling of Photocatalytic Cells 33
Dow
nloa
ded
on 1
5/10
/201
3 13
:53:
00.
Publ
ishe
d on
09
Oct
ober
201
3 on
http
://pu
bs.r
sc.o
rg |
doi:1
0.10
39/9
7818
4973
5445
-000
01View Online

60. J. R. Jennings, A. Ghicov, L. M. Peter, P. Schmuki and A. B. Walker,J. Am. Chem. Soc., 2008, 130, 13364–13372.
61. T. Tiedje, J. M. Cebulka, D. L. Morel and B. Abeles, Phys. Rev. Lett.,1981, 46, 1425–1428.
62. N. F. Mott and E. A. Davis, Electronic Properties in Non-CrystallineMaterials, Oxford University Press, New York, 1971.
63. A. K. Hassan, N. B. Chaure, A. K. Ray, A. V. Nabok and S. Habesch,J. Phys. D-Appl. Phys., 2003, 36, 1120–1125.
64. E. Barborini, G. Bongiorno, A. Forleo, L. Francioso, P. Milani,I. Kholmanov, P. Piseri, P. Siciliano, A. Taurino and S. Vinati, Sens.Actuators, B, 2005, 111–112, 22–27.
65. K. Pomoni, A. Vomvas and C. Trapalis, Thin Solid Films, 2008, 516,1271–1278.
66. K. M. Reddy, S. V. Manorama and A. R. Reddy, Mater. Chem. Phys.,2003, 78, 239–245.
67. There are several studies that consider the effects of geometrical nar-rowing between nanoparticles when trapped in a homogeneous me-dium,54, 128, 129 although they do not address the inhomogeneous natureof the contact junctions and the barriers to electron transport they createas described by the FITC model.
68. S. J. Konezny, M. N. Bussac and L. Zuppiroli, Appl. Phys. Lett., 2008,92, 012107.
69. S. J. Konezny, M. N. Bussac, A. Geiser and L. Zuppiroli, Proc. SPIE,2007, 6658, 66580D.
70. P. Sheng, Phys. Rev. B, 1980, 21, 2180–2195.71. S. Paschen, M. N. Bussac, L. Zuppiroli, E. Minder and B. Hilti, J. Appl.
Phys., 1995, 78, 3230–3237.72. J. Ederth, P. Johnsson, G. A. Niklasson, A. Hoel, A. Hultaker, P. Heszler,
C. G. Granqvist, A. R. van Doorn, M. J. Jongerius and D. Burgard, Phys.Rev. B, 2003, 68, 155410.
73. M. Salvato, M. Cirillo, M. Lucci, S. Orlanducci, I. Ottaviani,M. L. Terranova and F. Toschi, Phys. Rev. Lett., 2008, 101, 246804.
74. H. B. Yin, Y. Wada, T. Kitamura, S. Kambe, S. Murasawa, H. Mori,T. Sakata and S. Yanagida, J. Mater. Chem., 2001, 11, 1694–1703.
75. J. J. Sakurai, Quantum Mechanics, Addison-Wesley, Massachusetts, 1994.76. J. Nelson, A. M. Eppler and I. M. Ballard, J. Photochem. Photobiol., A,
2002, 148, 25–31.77. S. Plimpton, J. Comput. Phys., 1995, 117, 1–19.78. M. Matsui and M. Akaogi, Mol. Simul., 1991, 6, 239–244.79. V. N. Koparde and P. T. Cummings, J. Phys. Chem. B, 2005, 109, 24280–
24287.80. J. B. Baxter and C. A. Schmuttenmaer, J. Phys. Chem. B, 2006, 110,
25229–25239.81. A. Jonscher, Nature, 1977, 673–679.82. A. Long, Adv. Phys., 1982, 31, 553–637.83. S. Elliott, Adv. Phys., 1987, 36, 135–217.
34 Chapter 1
Dow
nloa
ded
on 1
5/10
/201
3 13
:53:
00.
Publ
ishe
d on
09
Oct
ober
201
3 on
http
://pu
bs.r
sc.o
rg |
doi:1
0.10
39/9
7818
4973
5445
-000
01View Online

84. N. Dinh, M. Bernard, A. Hugot-Le Gof, T. Stergiopoulos and P. Falaras,C. R. Chim., 2006, 9, 676–683.
85. S. J. Konezny, M. D. Doherty, O. R. Luca, R. H. Crabtree,G. L. Soloveichik and V. S. Batista, J. Phys. Chem. C, 212, 116, 6349–6356.
86. M.-H. Baik and R. A. Friesner, J. Phys. Chem. A, 2002, 106, 7407–7412.87. L. E. Roy, E. Jakubikova, M. G. Guthrie and E. R. Batista, J. Phys.
Chem. A, 2009, 113, 6745–6750.88. I. Chiorescu, D. V. Deubel, V. B. Arion and B. K. Keppler, J. Chem.
Theory Comput., 2008, 4, 499–506.89. J. Li, C. L. Fisher, J. L. Chen, D. Bashford and L. Noodleman, Inorg.
Chem., 1996, 35, 4694–4702.90. J. Moens, P. Geerlings and G. Roos, Chem.-Eur. J., 2007, 13, 8174–8184.91. J. Moens, P. Jaque, F. De Proft and P. Geerlings, J. Phys. Chem. A, 2008,
112, 6023–6031.92. M. Uudsemaa and T. Tamm, J. Phys. Chem. A, 2003, 107, 9997–10003.93. A. Galstyan and E.-W. Knapp, J. Comput. Chem., 2009, 30, 203–211.94. M. T. Groot and M. T. M. Koper, Phys. Chem. Chem. Phys., 2008, 10,
1023–1031.95. T. Wang, G. W. Brudvig and V. S. Batista, J. Chem. Theory Comput.,
2010, 6, 2395–2401.96. T. Wang, G. Brudvig and V. S. Batista, J. Chem. Theory Comput., 2010, 6,
755–760.97. (a) J. Moens, G. Roos, P. Jaque, F. De Proft and P. Geerlings, Chem.-Eur.
J., 2007, 13, 9331–9343; (b) N. Dinh, M. Bernard, A. Hugot-Le Gof,T. Stergiopoulos and P. Falaras, C. R. Chimie, 2006, 9, 676–683.
98. L. E. Roy, E. R.v Batista and P. J. Hay, Inorg. Chem., 2008, 47, 9228–9237.
99. T. Wang and R. A. Friesner, J. Phys. Chem. C, 2009, 113, 2553–2561.100. M.-K. Tsai, J. Rochford, D. E. Polyansky, T. Wada, K. Tanaka, E. Fujita
and J. T. Muckerman, Inorg. Chem., 2009, 48, 4372–4383.101. R. Ayala and M. Sprik, J. Chem. Theory Comput., 2006, 2, 1403–1415.102. S. Trasatti, Pure Appl. Chem., 1986, 58, 955–966.103. C. P. Kelly, C. J. Cramer and D. G. Truhlar, J. Phys. Chem. B, 2006, 110,
16066–16081.104. C. P. Kelly, C. J. Cramer and D. G. Truhlar, J. Phys. Chem. B, 2007, 111,
408–422.105. W. R. Fawcett, Langmuir, 2008, 24, 9868–9875.106. G. Gritzner and J. Kuta, Pure Appl. Chem., 1984, 56, 461–466.107. T. Kuwana, D. E. Bublitz and G. Hoh, J. Am. Chem. Soc., 1960, 82,
5811–5817.108. D. Chang, T. Malinski, A. Ulman and K. M. Kadish, Inorg. Chem., 1984,
23, 817–824.109. J. P. Chang, E. Y. Fung and J. C. Curtis, Inorg. Chem., 1986, 25,
4233–4241.110. N. G. Connelly and W. E. Geiger, Chem. Rev., 1996, 96, 877–910.
Computational Modeling of Photocatalytic Cells 35
Dow
nloa
ded
on 1
5/10
/201
3 13
:53:
00.
Publ
ishe
d on
09
Oct
ober
201
3 on
http
://pu
bs.r
sc.o
rg |
doi:1
0.10
39/9
7818
4973
5445
-000
01View Online

111. Jaguar, version 7.7, Schrodinger, LLC, New York, NY, 2010.112. T. H. Dunning, J. Chem. Phys., 1989, 90, 1007–1023.113. R. A. Kendall, T. H. Dunning and R. J. Harrison, J. Chem. Phys., 1992,
96, 6796–6806.114. D. E. Woon and T. H. Dunning, J. Chem. Phys., 1993, 98, 1358–1371.115. S. P. Gubin, S. A. Smirnova, L. I. Denisovich and A. A. Lubovich, J.
Organomet. Chem., 1971, 30, 243–255.116. S. P. Gubin, S. A. Smirnova and L. I. Denisovich, J. Organomet. Chem.,
1971, 30, 257–265.117. I. Noviandri, K. N. Brown, D. S. Fleming, P. T. Gulyas, P. A. Lay,
A. F. Masters and L. Phillips, J. Phys. Chem. B, 1999, 103,6713–6722.
118. U. Kolle and F. Khouzami, Angew. Chem., Int. Ed., 1980, 19, 640–641.119. M. G. Hill, W. M. Lamanna and K. R. Mann, Inorg. Chem., 1991, 30,
4687–4690.120. N. El Murr, J. E. Sheats, W. E. Geiger and J. D. L. Holloway, Inorg.
Chem., 1979, 18, 1443–1446.121. K. Zeitler, Angew. Chem., Int. Ed., 2009, 48, 9785–9789.122. A. J. Bard and M. A. Fox, Acc. Chem. Res., 1995, 28, 141–145.123. A. Juris, V. Balzani, F. Barigelletti, S. Campagna, P. Belser and A. von
Zelewsky, Coord. Chem. Rev., 1988, 84, 85–277.124. A. Tsuboyama, H. Iwawaki, M. Furugori, T. Mukaide, J. Kamatani,
S. Igawa, T. Moriyama, S. Miura, T. Takiguchi, S. Okada, M. Hoshinoand K. Ueno, J. Am. Chem. Soc., 2003, 125, 12971–12979.
125. S. Lamansky, P. Djurovich, D. Murphy, F. Abdel-Razzaq, R. Kwong,I. Tsyba, M. Bortz, B. Mui, R. Bau and M. E. Thompson, Inorg. Chem.,2001, 40, 1704–1711.
126. K.-T. Wong, Y.-M. Chen, Y.-T. Lin, H.-C. Su and C.-c. Wu, Org. Lett.,2005, 7, 5361–5364.
127. D. Bao, B. Millare, W. Xia, B. G. Steyer, A. A. Gerasimenko, A. Ferreira,A. Contreras and V. I. Vullev, J. Phys. Chem. A, 2009, 113, 1259–1267.
128. M. J. Cass, F. L. Qiu, A. B. Walker, A. C. Fisher and L. M. Peter, J. Phys.Chem. B, 2003, 107, 113–119.
129. S. Nakade, Y. Saito, W. Kubo, T. Kitamura, Y. Wada and S. Yanagida,J. Phys. Chem. B, 2003, 107, 8607–8611.
36 Chapter 1
Dow
nloa
ded
on 1
5/10
/201
3 13
:53:
00.
Publ
ishe
d on
09
Oct
ober
201
3 on
http
://pu
bs.r
sc.o
rg |
doi:1
0.10
39/9
7818
4973
5445
-000
01View Online