Embed Size (px)
Citation preview
Chapter 1Functional Genomics, Proteomics,Metabolomics and Bioinformaticsfor Systems Biology
Stéphane Ballereau, Enrico Glaab, Alexei Kolodkin,Amphun Chaiboonchoe, Maria Biryukov, Nikos Vlassis,Hassan Ahmed, Johann Pellet, Nitin Baliga, Leroy Hood,Reinhard Schneider, Rudi Balling and Charles Auffray
Abstract This chapter introduces Systems Biology, its context, aims, conceptsand strategies, then describes approaches used in genomics, epigenomics, trans-criptomics, proteomics, metabolomics and lipidomics, and how recent techno-logical advances in these fields have moved the bottleneck from data production todata analysis. Methods for clustering, feature selection, prediction analysis, textmining and pathway analysis used to analyse and integrate the data produced arethen presented.
Keywords Emergence ! Holistic ! Bottom-up ! Top-down ! Middle-out !Interactions ! Data integration ! Mathematical model ! Functional genomics !High-throughput ! Epigenomics ! Transcriptomics ! Proteomics !Metabolomics !Next generation sequencing ! Mass spectrometry ! Bioinformatics ! Knowledgemanagement ! Ontology ! Pathway ! Network ! High-dimensionality ! Curse ofdimensionality ! Clustering ! Feature selection ! Prediction analysis ! Text-mining
S. Ballereau (&) ! A. Chaiboonchoe ! H. Ahmed ! J. Pellet ! C. AuffrayEuropean Institute for Systems Biology & Medicine, CNRS-UCBL—Université de Lyon,50 Avenue Tony Garnier, 69007 Lyon, Francee-mail: [email protected], [email protected], [email protected],[email protected], [email protected]
E. Glaab ! A. Kolodkin ! M. Biryukov ! N. Vlassis ! R. Schneider ! R. BallingLuxembourg Centre for Systems Biomedicine, University of Luxembourg,7 Avenue des Hauts-Fourneaux, 4362 Esch-sur-Alzette, Luxembourge-mail: [email protected], [email protected], [email protected],[email protected], [email protected], [email protected]
N. Baliga ! L. HoodInstitute for Systems Biology, 401 Terry Avenue North, Seattle, WA 98109–5234, USAe-mail: [email protected], [email protected]
A. Prokop and B. Csukás (eds.), Systems Biology,DOI: 10.1007/978-94-007-6803-1_1,! Springer Science+Business Media Dordrecht 2013
3
Abbreviations
BASE BioArray Software EnvironmentBS BiSulphiteCATCH-IT Covalent Attachment of Tags to Capture Histones and Identify
TurnoverCFS Correlation-based Feature SelectionCHARM Comprehensive High-throughput Array for Relative MethylationChIA-PET Chromatin Interaction Analysis by Paired-End TagChIP Chromatin ImmunoPrecipitationCLIP Crosslinking immunoprecipitationDHS DNAse I hypersensitivityDNA DeoxyriboNucleic AcidEFS Ensemble Feature SelectionELISA Enzyme-Linked ImmunoSorbent AssaysENCODE ENCyclopedia Of DNA ElementsESI ElectroSpray IonisationEWAS Epigenome-Wide Association StudiesFAB Fast Atom BombardmentFAIRE Formaldehyde-assisted isolation of regulatory elementsFDR False Discovery RateFT-ICR Fourier Transform Ion Cyclotron ResonanceFUGE Functional Genomics Experiment data modelGAGE Generally Applicable Gene-set EnrichmentGC Gas ChromatographyGEO Gene Expression OmnibusGO Gene OntologyGSEA Gene Set Enrichment AnalysisGWAS Genome-Wide Association StudiesHITS-CLIP HIgh-Throughput Sequencing of RNAs isolated by CrossLinking
ImmunoPrecipitationHMM Hidden Markov ModelsHPLC High Performance Liquid ChromatographyIMS Imaging Mass SpectrometryIP ImmunoPrecipitationiTRAQ Isobaric Tags for Relative and Absolute QuantitationKEGG Kyoto Encyclopedia of Genes and GenomeskNN k-Nearest NeighborLC Liquid ChromatographyMALDI Matrix Assisted Laser Desorption IonisationMBD Methyl-CpG Binding DomainMCAM Multiple Clustering Analysis MethodologyMeDIP Methylated DNA ImmunoprecipitationMGDE Microarray Gene Expression DataMIAME Minimum Information About a Microarray Experiment
4 S. Ballereau et al.
MIAPE Minimum Information About a Proteomics ExperimentMINSEQE Minimum INformation about a high-throughput SeQuencing
ExperimentMMASS Microarray-based Methylation Assessment of Single SamplesMN Microccocal NucleaseMRM Multiple Reaction MonitoringmRNA Messenger RiboNucleic AcidMS Mass SpectrometryNCBI National Center for Biotechnology InformationNER Named-Entity RecognitionNGS Next Generation SequencingNIH National Institutes of HealthNMR Nuclear Magnetic ResonancePaGE Patterns from Gene ExpressionPCR Polymerase Chain ReactionPRIDE PRoteomics IDEntificationsPSM Peptide-Spectrum MatchQMS Quadrupole Mass AnalyserRNA RiboNucleic AcidRRBS Reduced Representation Bisulphite SequencingRT-qPCR Reverse Transcription quantitative PCRSAGE Serial Analysis of Gene ExpressionSELDI Surface Enhanced Laser Desorption IonizationSILAC Stable Isotope Labeling by Amino acids in Cell cultureSNP Single Nucleotide PolymorphismSRM Selected Reaction MonitoringSUMCOV SUM of COVariancesSVM Support Vector MachineToF Time-of-FlightUCSC University of California, Santa CruzVOCs Volatile Organic Compounds
1.1 Background
1.1.1 Context
Life in a broad scientific context can be defined as the phenomenon that emergesfrom particles of inorganic matter organised in molecules which interact with eachother within a cell [1]. This property is systemic because it only appears in thesystem and not in its parts [2]. Living systems are complex, modular and hierar-chical structures. Indeed, a multicellular organism consists of molecules, such asdeoxyribonucleic acid (DNA), ribonucleic acid (RNA), proteins, lipids and
1 Functional Genomics, Proteomics, Metabolomics and Bioinformatics 5
metabolites involved in chemical reactions and structures of cells. Cells areorganised in tissues forming organs with specific functions that are required for thehealth of the organism. Systemic properties appear at each level, for examplehomeostasis and response to stimuli in a single intracellular network, metabolism,growth, adaptation, reproduction in a single cell.
Information that defines an organism and its ability to react to its environment isencoded in its DNA and is expressed differentially in space and time throughoutlife. Typical studies in biology have until recently used the reductionist approachand addressed specific issues employing one or a few types of molecules at a smallscale, each shedding light on only a small fraction of vastly complex phenomena.Some findings were remarkable, such as the discovery of the structure of DNA,and later of the way genetic information stored in DNA is transcribed in messengerRNA (mRNA) then translated in proteins, essential components of the cellmachinery and the engines of life. The accumulation of such knowledge onmolecules and mechanisms led to the ‘bottom-up’ approach to modeling biologicalsystems, using genes as core elements to simulate cells, organs and the wholeorganism. This was complementary to the ‘top-down’ view of an organism as aphysiological system integrating information from its various constituents andtheir interaction with the environment.
Major technological advances have in the last 15 years enabled biologists toeventually gather information on a larger scale in various tissues, including samplesobtained with non-invasive methods, such as the collection of blood and urine. Themassive increase in throughput has had several consequences. First, biologists cannow study the vast majority of constituents, i.e. ‘ome’, of a given element, e.g. genes,of a system be it an organism, organ or cell, e.g. all genes in its genome. Second, thesheer size of data sets implies that their analysis relies increasingly on computationaltools and power available to analysts. Third, because characterisation of several‘omes’, e.g. genome, transcriptome, proteome and metabolome, progresses rapidlyalong with other disciplines such as imaging and in particular pharmaceuticalresearch with cheminformatics, compound libraries, high throughput screening,safety and clinical data [3–5], one can now attempt to disentangle interactionsbetween the different elements of a biological system, or ‘interactome’, to under-stand its behavior across several scales in a holistic manner, in health and disease.
1.1.2 Aims and Concepts
Systems Biology is the integrative study of complex systems in life with a holisticapproach now based on large-scale data sets analyzed iteratively with mathe-matical models and simulation tools [6, 7]. Understanding each component of acomplex system in isolation is not sufficient to characterise the system. Indeed,properties of the system are not only defined by the simple addition of elementaryfunctions but also emerge from the interactions between the elements [7–9]. Theseemergent properties are studied by inferring networks of interactions between
6 S. Ballereau et al.
these constituents, e.g. genes, proteins and ligands, and by unraveling their reg-ulatory mechanisms. Because of the very large number of elements in these net-works, such an endeavor relies on concepts defined in the framework of the theoryof complex systems [10]. Systems Biology not only aims at understanding therelationships between different levels of the expression of genetic information, viadata integration, but also at defining the system as a whole and producing aconvincing mathematical model of it, linking the highly complex interactionsbetween its components to its emergent properties [11–14]. In this context, diseasecan be viewed as a shift of homeostasis from the normal range due to a large set ofperturbations in the network of interacting biomolecules in the whole organism.Distinct perturbations may therefore result in a single disease phenotype, inagreement with our understanding of complex diseases. Conversely, shifting thesystem back to healthy homeostasis may be achieved in multiple ways and bytargeting several points in the network [15, 16].
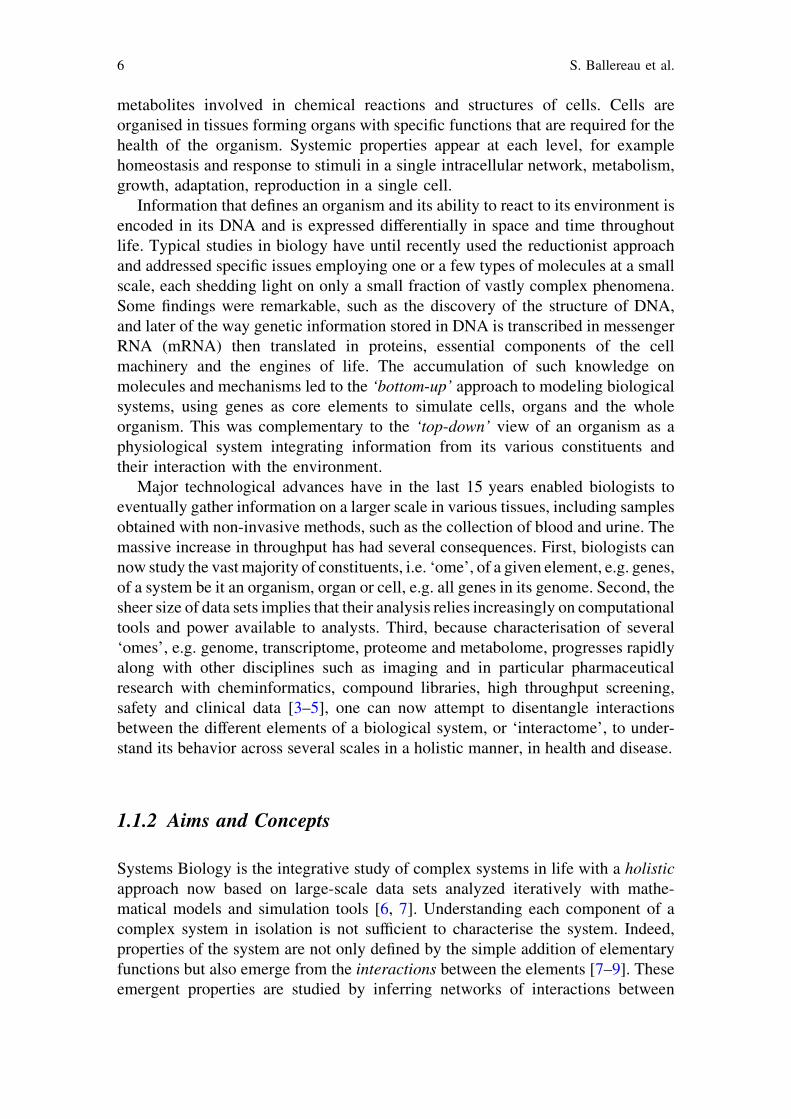
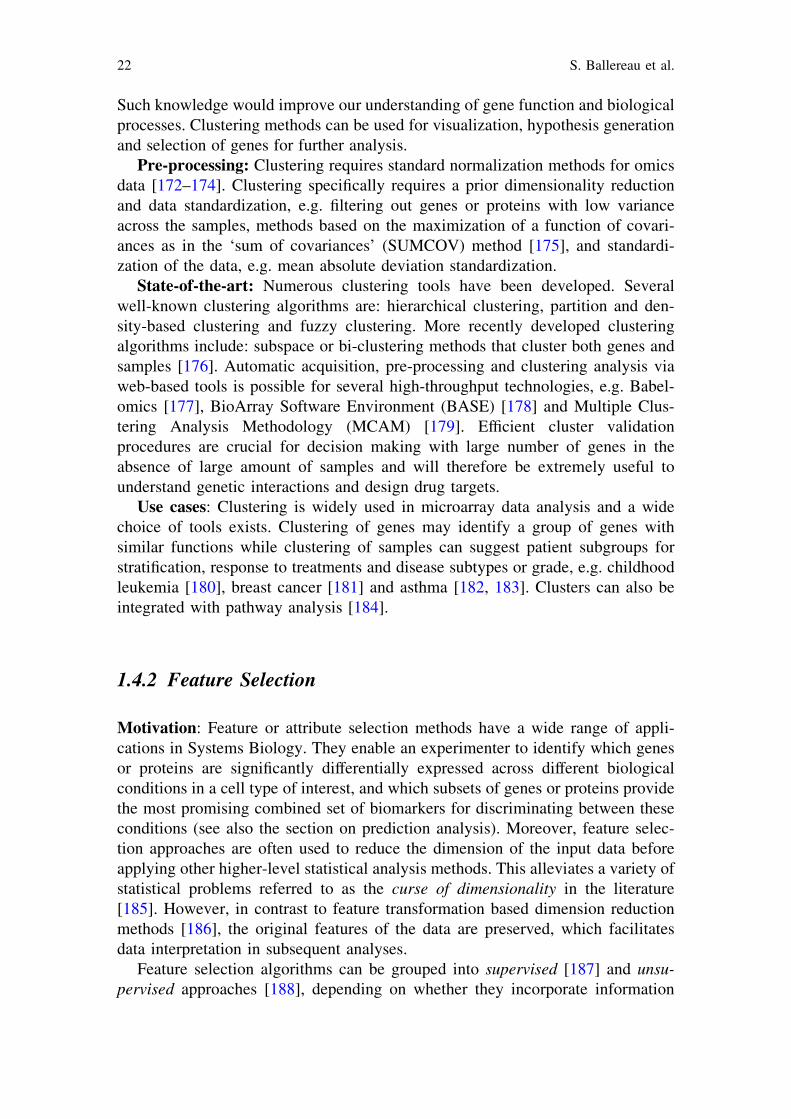
Systems Biology follows an integrative and iterative approach that relies onexperimental and mathematical methods (Fig. 1.1). First, existing data relating todifferent hierarchical levels of the system are integrated into mathematical orgraphical models to generate hypotheses towards understanding mechanisms atplay and build predictions on the functions of that system. Some components ofthe system are then perturbed experimentally, such as in in vitro or in vivo modelsof a disease. The outcome is assessed in the context of the model and the initialhypotheses are revised accordingly. These revised hypotheses finally inform newperturbation experiments. The approach is repeated until the system’s behaviour isfaithfully simulated by the model [7]. Further complexity is added when oneconsiders the environmental factors of the model.
Predictive simulations,
model analysis
Model validationModel fits
Model
Systematic behavior
Interacting biomolecules
ScalesHypothesis and experimental data
Organize and store data Assessment of
goodness-of-fit
Integration Compare with experimental data
and hypothesis
Update hypothesis and obtain new data
Model does not fit
Discover missing parts
Mathematical Modelling
Drug design, biotechnology,
bioengineering...
Biological system
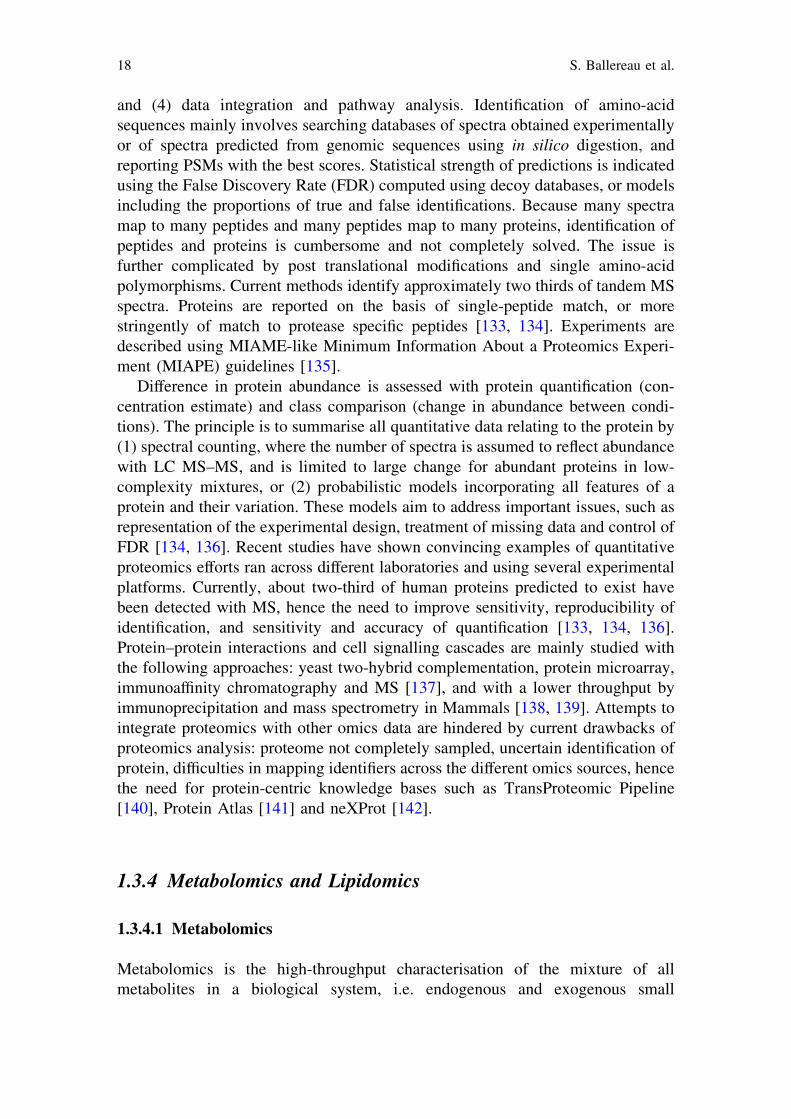
Fig. 1.1 Modeling in Systems Biology. Modeling starts with the integration of differentexperimental data into a single knowledge base to organize and store data. Mathematicaldescriptions of the interaction between model elements allow (1) simulation of the emergentbehavior of the system, (2) comparison of this simulated behavior with experimental data, (3)adjustment of the model and (4) design of further experiments. When the model fits experimentaldata, studying the role of particular design features may help identify mechanisms at play and designprinciples. The model may also be used in drug design, biotechnology or bioengineering for example
1 Functional Genomics, Proteomics, Metabolomics and Bioinformatics 7
1.1.3 Strategies
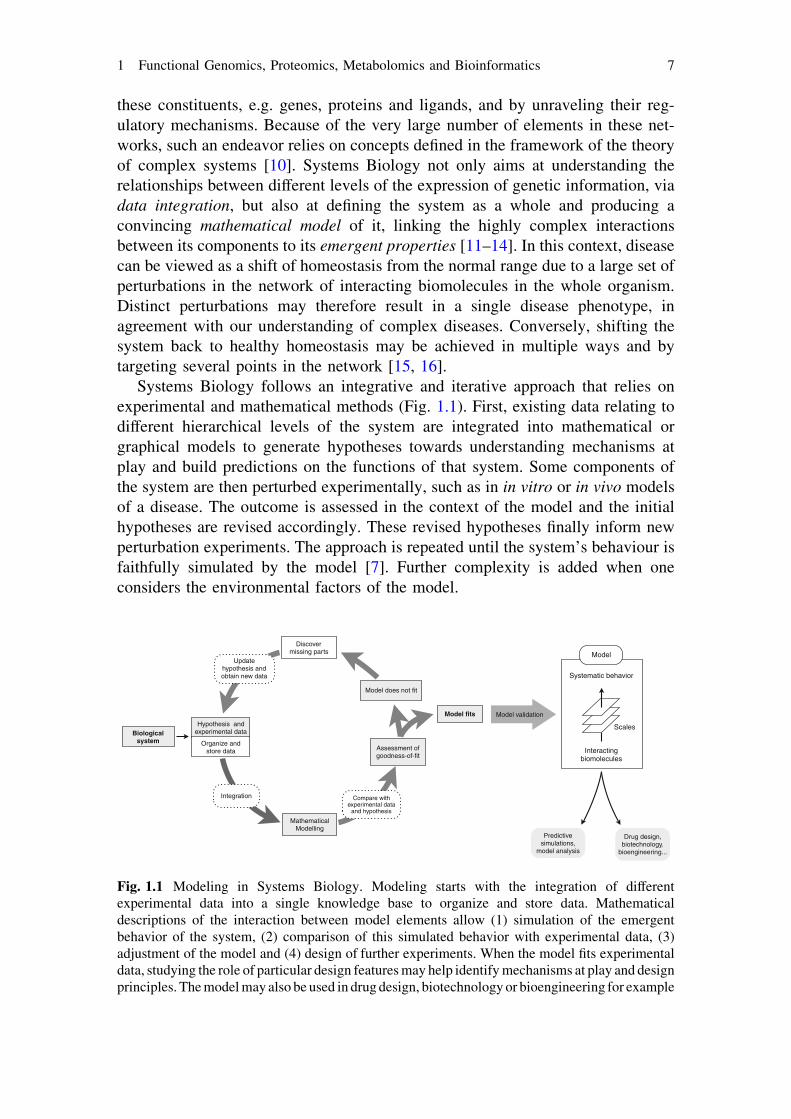
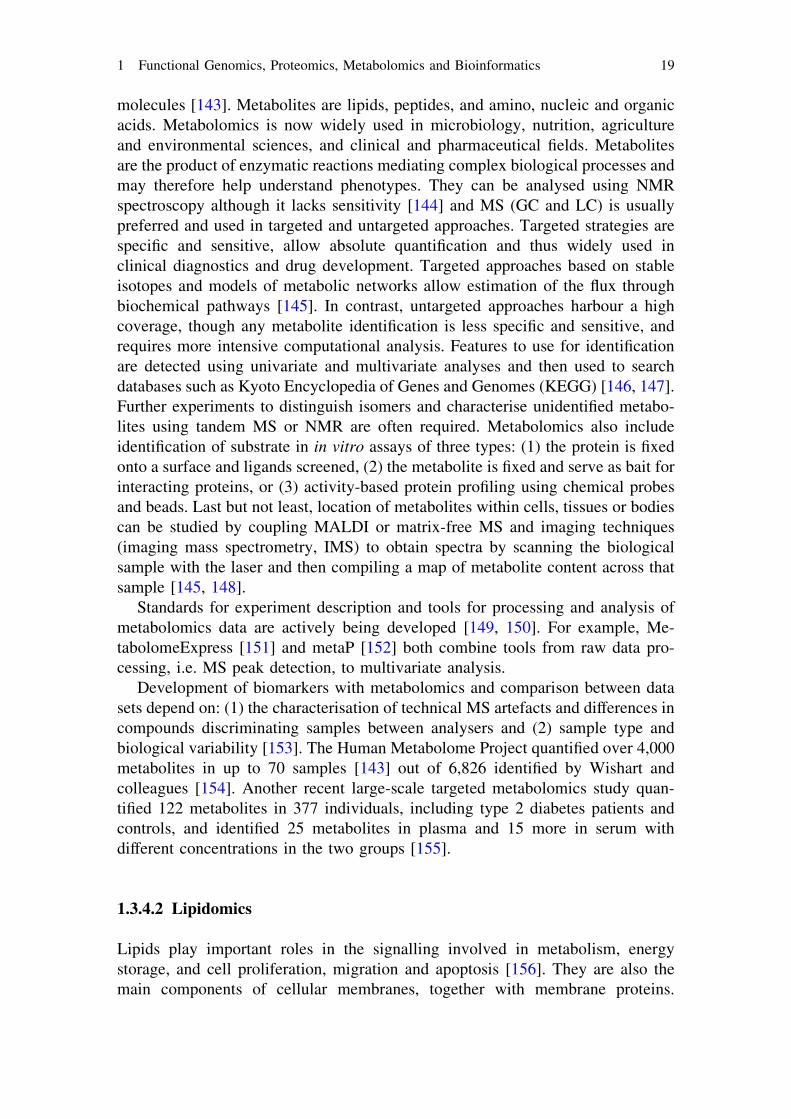
Three main strategies aim to build the link between the system’s components andits emerging properties: ‘bottom-up’, ‘top-down’ and ‘middle-out’ (Fig. 1.2). Themain steps of the ‘bottom-up’ approach are to graphically or mathematicallymodel relationships between the components of the system, starting with those atthe lowest level of the multiscale structure, hence ‘bottom’, e.g. genes and pro-teins, set model parameters using experimental values and verify the model bycomparing its systemic behavior with the behavior of a real system. The termbottom-up also refers to the direction chosen: from known or assumed propertiesof the components one deduces system functions [17]. This molecular biologystrategy has been successful in modeling biological systems with relatively lownumber of components, e.g. a single intracellular network or a single prokaryoticcell. It may however not be suited to reconstruction of the emergence of largersystems, e.g. the whole body physiological behavior in Mammals. In contrast, the‘top-down’ or physiology approach relies on the systemic behavior. It firstinvolves defining ways the complicated systemic function of interest varies withconditions and/or time, and then inferring hypothetical structures responsible forthis function. The system behavior is perturbed and the effects studied at the levelof the system components, i.e. genome, transcriptome, proteome and metabolome.This strategy is limited to an extent by the challenge of inferring DNA sequences
Fig. 1.2 Multiple scale strategies in Systems Biology. Starting at the molecular level,interactions between DNA, epigenetic factors, RNA, proteins, lipids and metabolites define thecore biological processes required for higher order functions. These processes are defined bymolecular interaction networks, which communicate with each other within a given cell, betweencells in the same tissue or distinct tissues, or between organs of a complex organism
8 S. Ballereau et al.
from phenotypes. Also, models built with top-down approaches must be updatedwith every new experiment using all existing experiments, making the analyticaland computational challenges increasingly difficult. In contrast, models built withthe bottom-up approach such as an in silico cell model comprise modules whichare updated independently of each other [18]. The ‘middle-out’ strategy intends toovercome the intrinsic limitations of the above approaches, taking into accountthat chains of causality can operate in biological systems in both directions,starting at any levels of biological organization. The behavior of a single func-tional system is thus modeled in terms of interactions between entities at a levelsufficiently well described by experimental data (‘middle’), typically of the lowerlevels of organization but not necessarily down to molecules. The model is thenextended to higher and lower levels (‘out’) iteratively by combining ‘bottom-up’and ‘top-down’ approaches. It was successfully implemented in the Physiomeproject [19, 20].
Systems Biology will play a crucial role in the development of personalizedmedicine as it will enable integration of different types of data to profile patients,identify unbiased biomarkers and produce precise disease phenotypes. It willhence help prevention, diagnosis and treatment, or Systems Medicine [21, 22].
1.2 Introduction to Functional Genomics, Proteomics,Metabolomics and Bioinformatics
Genomics is the study of the sequence, structure and content of the genome, inparticular the genes and their number, structure, function and organisation alongthe genome. Functional genomics is the study of the function of genes and theregulation of their expression at the level of the cell, organ or organism, spatiallyand at different time points and/or health status, by deciphering the dynamics ofgene transcription, translation and protein–protein interactions on a genome-widescale using high-throughput technologies. The main large-scale experimental toolsused to study epigenetics (epigenomics) and gene expression (transcriptomics)have so far involved microarrays and more recently next-generation sequencing.Mass spectrometry is widely used to study proteins (proteomics), metabolites(metabolomics), and more recently volatile organic compounds (VOCs) in exhaledbreath condensate (breathomics). Technical advances also led to the developmentof computational tools to handle and analyse their output.
1.2.1 Sequencing Technologies
Whole genome sequencing started with the sequencing of a bacteriophage in 1977using the Sanger sequencing technique. The development and maturation of
1 Functional Genomics, Proteomics, Metabolomics and Bioinformatics 9
4-color automated Sanger sequencing produced the instruments that sequenced thehuman genome (Smith et al. 1986). Several high-throughput sequencing tech-niques, or Next Generation Sequencing (NGS), arose subsequently which wereeach inferior to the more established automated Sanger technique, being slowerper run, less accurate, with shorter read length and more expensive, but farsuperior by virtue of the vastly larger number of nucleotides read [23–25]. Now 3rd
generation sequencing strategies employ nanopores and single molecule reads, andpromise to increase the throughput and decrease the cost of sequencing strikingly.Computational tools are being developed to process the very large amount of NGSshort, low quality reads and assemble them into a genome sequence [26]. Genomesequences of over sixty pro- and eu-karyotes are annotated in online public gen-ome browsers [27, 28]. Knowledge of whole genomes also enabled the large-scalestudy of gene expression and the development of functional genomics. NGS canindeed be used for DNA or RNA sequence analyses and has several advantagesover microarrays: it does not require array design, enables wider scale, whole-genome studies, improved resolution, more flexibility, allele-specificity, lower costand amount of input material. NGS now also enables routine discovery of variantsin entire exomes and even large genomes [29, 30] as in Human with the 1000Genomes Project [31], in cancer research [32, 33] and studies of allele specificityin gene expression [34]. NGS also catalyzed the massive development of me-tagenomics [35] and will thus help decipher host-gene-microbial interactions [36].NGS is however not mature enough for routine use in clinical field [37]. The everincreasing speed, quality and range of applications of sequencing methods havecreated a huge flow of data and related challenging requirements not only forcomputing power, memory and storage [38–40] but also data sharing [41]. Readsmapped onto a reference genome can be displayed with other sources of annotationsuch as NCBI [42] with Ensembl [28] and UCSC browsers [43].
1.2.2 Mass Spectrometry
Mass spectrometry (MS) relies on deflection of charged atoms by magnetic fieldsin a vacuum to measure their mass/charge (m/z) ratio. A typical experiment fol-lows five steps: (1) introduction of the sample, (2) ionisation of its particles, (3)acceleration, (4) deflection proportional to the mass and charge of the ion, and (5)detection, recorded as a spectrum showing peaks on a plot of relative quantity as afunction of the m/z ratio.
Several methods for introduction, ionisation and types of spectrometers enablea wide range of analyses. Introduction methods are Gas chromatography (CG) forthermally stable mixtures, liquid chromatography (LC) for thermally labile mix-tures, and solid probes. Some compounds such as large proteins and polymersmust be ionized directly. Ionisation methods can be hard or soft. Hard ionisationintroduces high amount of energy in the molecules that results in fragmentationand thus helps identify the compound but resulting spectra rarely contain the
10 S. Ballereau et al.
molecular ion. ElectroSpray Ionisation (ESI) uses high voltage to disperse andionise macromolecules through a spray nozzle. It is soft, limits fragmentation andproduces multiply charged ions, allowing detection of large compounds at lowermass/charge value, and hence increases the analyser’s mass range. ESI is oftencoupled with LC/MS. Mixtures containing non-volatile molecules can also beanalysed with Fast Atom Bombardment (FAB) and Matrix Assisted LaserDesorption Ionisation (MALDI). MALDI is used to analyse extremely largemolecules, up to 200,000 Da, often coupled with time-of-flight (ToF) MS. SurfaceEnhanced Laser Desorption Ionization Mass Spectrometry (SELDI-MS) separatesprotein subsets fixed onto a surface according to specific biophysical properties,e.g. hydrophobicity. Thus, analysis of proteins, peptides and nucleotides can beperformed with ESI, SELDI, MALDI, and FAB [44].
Several types of analysers exist. In a quadrupole mass analyser (QMS) ions aredeflected by oscillating positive and negative electric fields. A triple-QMS con-tains three QMS one after the other where the first QMS enables the identificationof known compounds, the second its fragmentation, and the third the identificationof the fragments, thereby elucidating the compound structure. Other types ofanalysers include ion trap, ToF, Orbitrap, and Fourier Transform Ion CyclotronResonance (FT-ICR) with increasing mass resolution and accuracy. Orbitraps arecheaper, more robust and have a higher-throughput than FT-ICRs. Tandem-MSinvolves several steps of selection of compound using MS. MS methods mentionedabove vary in throughput, robustness, sensitivity, selectivity and ease of use [44].
1.2.3 Bioinformatics
Bioinformatics comprises mathematical approaches and algorithms applied tobiology and medicine using Information Technology tools, e.g. databases andmining software [45, 46]. Analysis of omics data typically follows four steps: (1)data processing and identification of molecules, (2) statistical data analysis, (3)pathway and network analysis, and (4) system modelling. Examples include denovo genome assembly, genome annotation, identification of co- or differentiallyexpressed genes at the level of transcripts or proteins and the inference of protein–protein interaction networks. Bioinformatics also enables integration of hetero-geneous high-throughput data sets produced by a given study and existing data setsusing knowledge management, annotation and text mining tools such as the twostructured vocabularies Gene Ontology (GO) for genes and associated biologicalprocesses, cellular components and molecular functions [47, 48] and MicroarrayGene Expression Data (MGED) ontology [49], the PRoteomics IDEntifications(PRIDE) database [50], Functional Genomics Experiment data model (FuGE) [51],the Systems Biology Markup Language [52], the Systems Biology GraphicalNotation [53], BioMART [54, 55], tranSMART [56], bioXM [57], GARUDA [58],Nexbio [59], and includes Systems Biology [23]. Identification of pathways, and
1 Functional Genomics, Proteomics, Metabolomics and Bioinformatics 11
network inference and analysis is covered in chapter ‘Network analysis for sys-tems biology’.
These efforts collectively aim at unraveling the molecular pathways under-pinning physiology and at identifying biomarkers to describe a system with acombination of environmental, clinical, physiological measures to improvedetection and monitoring of a phenomenon, such as diseases in medical research tofacilitate diagnosis and therapy. Biomarker discovery relies on two types ofstudies: unbiased, which only depend on the technique used, and targeted, whichfocus on pre-defined biomarkers measured by specific methods. Experimental andbioinformatics methods and tools mentioned in the following text are listed inTables 1.1 and 1.2.
1.3 Functional Genomics, Proteomics and Metabolomics
1.3.1 Epigenomics
Epigenomics is the genome-wide study of modifications of chromatin, i.e. DNAand associated proteins, which play an important role in gene regulation, gene-
Table 1.1 Examples of methods and tools for functional genomics, proteomics and metabolo-mics. This list is non exhaustive and only includes items mentioned in the text
Epigenomicsmethods
DNA methylation [61]: Endonucleases (MMASS, CHARM, Methyl-seq),bisulphite (BS) conversion (RRBS, MethylC-seq), and affinity (MeDIP-chip, MeDIP-seq, MDB-seq). Methylation levels can then be measuredwith microarrays and sequencing techniques;
Chromatin accessibility (DNAseI-seq, FAIRE–seq, Sono-seq, 3C, 4C, 5C,ChIA-PET);
Nucleosome positioning (CATCH-IT, MNase-se, haploChIP)Epigenomics tools Encyclopedia Of DNA elements (ENCODE) project [63], the NIH
Roadmap Epigenomics effort [64], the Human Epigenome Project [65]and recently BLUEPRINT [67]
Transcriptomicsmethods
DNA microarray, SAGE, RNA-seq, ChIP-seq, CLIP-seq [108, 113, 114,117]
Transcriptomicstools
ArrayExpress [104], GEO [106], MIAME [107], MINSEQE [119]. See [26,120] for reviews on downstream analysis.
Proteomicsmethods
ELISA, 2D gel electrophoresis, NMR, MS, iTRAQ, SILAC, SRM, SELDI-ToF [126–131]
Proteomics tools MIAPE [134], TransProteomic pipeline, protein atlas, neXProt [139–141]Metabolomics
methodsNMR [143], MS [44], IMS [144, 147]
Metabolomics tools MetabolomeExpress [150], metaP [151], KEGG [145], human metabolomeproject [142]
Lipidomicsmethods
MS [44, 161], orbitraps [160], IMS [144, 147]
Lipidomics tools LIPID MAPS [165], XCMS [162], MZmine2 [163]
12 S. Ballereau et al.
environment interactions, development and in diseases such as inflammation andcancer [60, 61]. Such modifications involve the DNA itself but not its sequence,i.e. a methylated cytosine (mC) adjacent to a guanine (CpG dinucleotides inmammals), and of chromatin proteins, i.e. methylation, acetylation and phos-phorylation of histones. Epigenomics also covers chromatin accessibility, nucle-osome remodelling, long-range chromatin interactions and allele-specificchromatin signatures. Technological advances are now enabling Epigenome-WideAssociation Studies or EWAS, akin to Genome-Wide Association Studies orGWAS [62], and large scale studies in different cell types and tissues, as in thehuman ENCyclopedia Of DNA Elements (ENCODE) project [63], the NIHRoadmap Epigenomics effort [64], the Human Epigenome Project [65], [66] andrecently BLUEPRINT that aims to determine the epigenome of 100 different bloodcell types [67].
DNA methylation at CpG is widely studied as it mediates gene repression in acell-specific manner by preventing the transcriptional machinery from accessingDNA. Methylated DNA can be detected with three types of DNA treatments, i.e.endonucleases, bisulphite (BS) conversion, and affinity. Methylation levels canthen be measured with microarrays and sequencing techniques.
Endonucleases cleave DNA at specific sites, are sensitive to methylation andenable several DNA analyses techniques. Recent methods enable analysis of asingle sample, e.g. microarray-based methylation assessment of single samples(MMASS), better statistical analyses and methods for array design, e.g. compre-hensive high-throughput array for relative methylation (CHARM) [68] and the
Table 1.2 Examples of methods and tools for bioinformatics. This list is non exhaustive andonly includes items mentioned in the text
Bioinformatics Microarray gene expression data (MGED) ontology [49], the proteomicsidentifications (PRIDE) database [50], functional genomics experimentdata model (FuGE) [51], the systems biology markup language [52], thesystems biology graphical notation [53], BioMART [54, 55],tranSMART [56], bioXM [57], GARUDA [58], nexbio [59]
Clustering Babelomics [176], BASE [177], MCAM [178]Feature selection Unsupervised [187], supervised [186]; filters (student’s t test, Wilcoxon
rank sum test, CFS, EFS, Markov blanket filtering) [188], wrappers(kNN [203], Naive Bayes [204], sequential forward search [205]),hybrid methods [202], mathematical programming [209], signalprocessing approaches [210]
Prediction analysis Unsupervised (clustering, feature selection, dimension reduction, densityestimation, and model structure learning, nonlinear dimension reductionmethods) [211–213]; supervised (SVM [215], random forest [216]);semi-supervised [217]; time series (HMM [218])
Networks fromliterature
NER [225], iHOP [232], FActa ? [221], AliBaba [233], IntAct [234],CoPub [235]
Pathway analysis Differential expression filtering, overrepresentation statistics [236], GSEA[240], PAGE [241], GAGE [242], ontologizer [243], GeneCodis [244],elementary flux analysis [245], extreme pathways [246]
1 Functional Genomics, Proteomics, Metabolomics and Bioinformatics 13
widely used NGS sequencing of DNA enriched for CpG containing regions(Methyl-seq) [61].
BS conversion modifies unmethylated cytosine in CpGs into a uracil and thustransforms an epigenetic difference into a genetic one detectable by methylationspecific DNA microarrays with single-nucleotide resolution [69, 70]. Except formC, BS treated DNA comprises only three base types and hence has reducedsequence complexity and hybridization specificity. This is overcome by enrichingfor CpG-containing segments as in Reduced Representation Bisulphite Sequencing(RRBS) with BS treatment and NGS. Alternatives include whole-genome BSsequencing, although that is expensive, and the widely used MethylC-seq, i.e. NGSof BS treated DNA. Throughput and coverage may increase with nanoporesequencing which can sequence mC directly, without BS treatment [71].
Genome-wide identification of DNA binding-sites and corresponding bindingproteins is mainly achieved with the affinity-based approach chromatin immuno-precipitation (ChIP) whereby DNA-binding proteins, e.g. histones and transcriptionfactors, are cross-linked in vivo in cells that are then lysed. DNA is fragmented bysonification, recovered by heating DNA–protein complexes and detected withmicroarray (ChIP-chip) or NGS (ChIP-seq) [72, 73]. Methylated DNA Immuno-precipitation (MeDIP-chip and MeDIP-seq) uses monoclonal antibody againstmethylated cytosine to enrich single-strand methylated DNA. Some alternativesrely instead on high affinity binding of a Methyl-CpG Binding Domain (MBD)protein complex for double-strand methylated DNA (e.g. MDB-seq) [60, 74].Transcription factor binding sites are then predicted in the sequences identified[75]. ChIP is also widely used to study patterns of histone modifications andchromatin modifiers [63, 76]. It can be integrated to other data sets, as with Segway[77], helping development of chromatin model [78]. ChIP coupled with quantitativereal-time PCR allows the study of the dynamics of DNA and proteins interactions inliving cells for up to several minutes, and has now been adapted to microfluidicstechnology reducing the number of cells and time required [79].
Across the three types of treatment, at least 13 array- and 10 seq-based ana-lytical methods exist, the choice of which depends on their features, the requiredcoverage and resolution, types of bias, accuracy and reproducibility, and also onthe number of samples, available DNA quality (high for affinity techniques) andquantity (high for nuclease techniques), and in particular for array-based methods:the organism. The most widely used NGS-based methods rely on BS (RRBS andMethylC-seq) or affinity (MeDIP-seq and MBD-seq) approaches [61, 80, 81].
Microarray data processing addresses imaging and scanning artefacts, back-ground correction, batch and array normalization, and correction for GC contentand CpG density. The ratio of methylated to unmethylated molecules for a givenlocus is a widely used metric. It is analysed with tools developed for geneexpression data, potentially wrongly since they rely on assumptions violated byDNA-methylation data, e.g. independence of the number of methylated and un-methylated sites, and similarity of signal strength across samples [61, 82–84].Processing sequencing reads involves mapping of reads to the reference genome,counting and/or analysis of bisulphite data [85, 86].
14 S. Ballereau et al.
Genomic regions of chromatin accessibility, i.e. low nucleosomal content andopen chromatin structure, potentially harbour regulatory sequences and can beidentified with high-throughput DNAse I hypersensitivity assay (DNAseI-seq akaDHS-seq) [87], formaldehyde-assisted isolation of regulatory elements followedby sequencing (FAIRE–seq) [88] and Sono-seq [89]. And long range chromosomalinteraction are identified with chromosomal conformation capture (3C) [90, 91],3C on chip (4C) [92], 3C carbon copy (5C) [93] and coupled with NGS as in usingHi-C [94] and ChIA-PET [95]. Nucleosome positioning and remodelling is studiedwith CATCH-IT [96] and MNase-seq [97] while haploChIP identifies allele-spe-cific chromatin profiles [98, 99], including SNPS that affect gene expression [100].
Methods to integrate epigenomics data are recent and currently being devel-oped. Examples include integration with gene expression data, using an empiricalBayes model [101] and clustering of DNA methylation data followed with non-linear regression analyses [102]. Visualisation tools can display raw data genome-wide as with Circos [103] or analysis output in a similar manner to that used forGWAS, using log10 p-value, but on two axes: test of difference in methylationstatus and test of difference in gene expression [83].
1.3.2 Transcriptomics
Transcriptomics is the genome-wide identification and quantification of RNAspecies such as mRNAs, non-coding RNAs and small RNAs, in health and disease,and in response to external stimuli. With DNA microarrays, gene expression levelsare measured as the amount of RNA in the sample that matches the set of probesfixed on the array; RNA molecules are fluorescently labelled and hybridised ontothe array where the intensity of the signal measured for a given probe is assumedto be proportional to the quantity of RNA bound to it. Changes in expression levelsbetween experimental conditions or samples with or without disease on one handand similarity of expression pattern with a gene with known function on the otherhand indicate the most likely functions of the genes. Two main public repositoriesfor gene expression data sets exist: ArrayExpress [104, 105] and Gene ExpressionOmnibus (GEO) [106], both compliant with the ‘Minimum information about amicroarray experiment’ (MIAME) guidelines [107]. Although microarrays are anestablished and very widely used technology [108], data processing and analysismethods are still being developed. For example, recent studies claim that modelsfor background noise based on Gaussian distribution for computational efficiencymay not be appropriate and non-parametric methods may harbour a lower falsepositive rate [109], while weighted average difference seems to be the best methodto identify differentially expressed genes [110]. Two main sequencing-basedalternatives exist which, unlike microarrays, do not rely on a set of pre-definedprobes and are therefore considered unbiased: Serial Analysis of Gene Expression(SAGE) and genome-wide transcriptome NGS (RNA-seq).
1 Functional Genomics, Proteomics, Metabolomics and Bioinformatics 15
SAGE entails sequencing tags that are unique to each gene and not defined apriori. SAGE was for example used to build expression profiles of long non-coding RNAs for 26 normal tissues and 19 cancers in human [111], shedding lighton their poorly understood function [112]. The more recent RNA-seq provideswhole transcript sequences, has very low background noise, offers a very largedynamic range, is highly accurate and reproducible, enables the discovery of novelexons, isoforms and transcripts. RNA-seq has already proved very promising but isnot as mature as microarrays yet [113–115]. Rare and transient transcripts so farundetected by current methods were recently identified with targeted transcripto-mics by capture on tiling array followed by NGS [116]. Currently, some experi-mental protocols may introduce bias due to amplification, fragmentation andligation processes [117, 118]. Development of robust quality control standards andguidelines for microarrays occurred over a decade but should be faster for RNA-seq. Methods are being developed to describe experiments using MIAME-like‘Minimum Information about a high-throughput SeQuencing Experiment’(MINSEQE) guidelines [119], map the vast amount of short read sequences [26],assess expression levels and detect differentially expressed transcripts [120].
Estimates of expression levels of transcripts of interest must be validated byRT-qPCR and emerging techniques such as direct visualization and counting ofRNA molecules [121]. These must however be standardised and applied acrossplatforms [21]. Microarrays are still relatively cheaper than RNA-seq, their biasesare known and analysis workflows are mature. They are therefore still preferred indrug discovery, though RNA-seq methods will probably replace them over thenext years. Because gene expression profiles obtained with both methods correlatewell, the vast amount of data acquired with microarrays is complementary to newdata produced by RNA-seq [108].
Other techniques such as ChIP are also used to identify proteins binding DNA(ChIP-seq) [73] and RNA (CLIP-seq aka HITS-CLIP) [122]. These fast evolvinghigh throughput methods are greatly improving our understanding of geneexpression regulation [123, 124], at the transcriptional and post-transcriptionallevels [125].
1.3.3 Proteomics
Correlation between levels of transcripts and proteins is incomplete due to vari-ation in speed and efficiency of translation and of mRNA degradation. Manyproteins undergo posttranslational modifications, e.g. phosphorylation and ubiq-uitination, which modulate their activity and mediate signal transduction. Proteinsalso play their role as part of complexes with other proteins or nucleic acids. Arecent study of a human cell line identified over 10,000 proteins, with concen-trations ranging over seven orders of magnitude. The human proteome has beenestimated to comprise several millions distinct species which cannot currently beamplified and reflect concentrations with a very wide dynamic range [126].
16 S. Ballereau et al.
Proteins can be identified using low-throughput antibody methods, Enzyme-Linked ImmunoSorbent Assays (ELISAs) and 2D gel electrophoresis. Proteomicsaims at defining all of the proteins present in a cell, a tissue, or an organism (or anyother biological compartment) and employs large-scale, high-throughput studies ofprotein content, modifications, function, structure, localisation, and interactionsusing high-throughput techniques. Protein microarrays capture proteins usingagents fixed on their surface, which can be antibodies but also peptides, receptors,antigens, nucleic acids. Detection and quantification are often fluorescence-basedand identify interactions between proteins, kinase substrates, activators of tran-scription factors [127]. Nanoproteomics has the potential to provide fast, high-throughput and sensitive methods using only minute amount of samples [128].However, MS is currently the main technique for large-scale whole-proteomestudy with precise measurements [129, 130].
Shotgun proteomics, i.e. shotgun LC coupled with tandem MS (LC–MS/MS) isthe most widely used approach. The sample of peptides resulting from the trypsin(or other enzyme) digestion of proteins is separated by High Performance LiquidChromatography (HPLC) and peptides are identified using tandem MS: peptidesare ionised and separated, producing mass spectra with peaks corresponding topeptides (first MS), which are then identified using further fragmentation andseparation of resulting peptide fragments (second MS). Inclusion of labelledsynthetic peptides as spike-in or labelling samples chemically (iTRAQ) or meta-bolically (SILAC) improves quantification [131]. Mixture complexity is addressedby fractioning the mixture. Targeted proteomics allows one to identify 100-200proteins in a complex mixture by previously identifying the ‘‘transition peptidefragments’’ through the use of a triple quadrupole mass spectrometer which sep-arates the trypsin peptide fragments, then fragments these further into ‘‘transi-tions’’ that can be quantified in the third quadrupole. One attempts to choosetransitions that are unique to individual proteins and spiking in isotopicallylabelled transition peptides greatly improves quantification. Targeted mass spec-trometry is termed Selected Reaction Monitoring (SRM) or Multiple ReactionMonitoring (MRM). SRM assays for the entire human proteome (more than 20,000proteins) have recently been developed (R. Mortiz, personal communication).
HPLC–MS is highly sensitive, specific and fast, and thus used for bioanalysis,in particular pharmacokinetics to measure speed of drug clearance by the body,and in urine sample analysis. Drawbacks however include a bias towards identi-fication of most abundant peptides. SELDI-ToF is more accurate than shotgunapproach and is thus better suited to biomarker quantification, but may not beaccurate enough for clinical diagnostics [132].
Recent techniques produce data sets of approximately one million spectra, up to100 Gb in size, where up to 8,000 proteins can be identified [133]. Pre-processingof raw spectra entails noise filtering, baseline subtraction, peak detection, andcalibration and alignment of LC/MS maps. Analysis follows four steps: (1)identification of amino-acid sequences, peptides and proteins in Peptide-SpectrumMatch (PSM), and detection, quantification, annotation and alignment of features,(2) peptide and protein significance analysis, (3) class discovery and prediction,
1 Functional Genomics, Proteomics, Metabolomics and Bioinformatics 17
and (4) data integration and pathway analysis. Identification of amino-acidsequences mainly involves searching databases of spectra obtained experimentallyor of spectra predicted from genomic sequences using in silico digestion, andreporting PSMs with the best scores. Statistical strength of predictions is indicatedusing the False Discovery Rate (FDR) computed using decoy databases, or modelsincluding the proportions of true and false identifications. Because many spectramap to many peptides and many peptides map to many proteins, identification ofpeptides and proteins is cumbersome and not completely solved. The issue isfurther complicated by post translational modifications and single amino-acidpolymorphisms. Current methods identify approximately two thirds of tandem MSspectra. Proteins are reported on the basis of single-peptide match, or morestringently of match to protease specific peptides [133, 134]. Experiments aredescribed using MIAME-like Minimum Information About a Proteomics Experi-ment (MIAPE) guidelines [135].
Difference in protein abundance is assessed with protein quantification (con-centration estimate) and class comparison (change in abundance between condi-tions). The principle is to summarise all quantitative data relating to the protein by(1) spectral counting, where the number of spectra is assumed to reflect abundancewith LC MS–MS, and is limited to large change for abundant proteins in low-complexity mixtures, or (2) probabilistic models incorporating all features of aprotein and their variation. These models aim to address important issues, such asrepresentation of the experimental design, treatment of missing data and control ofFDR [134, 136]. Recent studies have shown convincing examples of quantitativeproteomics efforts ran across different laboratories and using several experimentalplatforms. Currently, about two-third of human proteins predicted to exist havebeen detected with MS, hence the need to improve sensitivity, reproducibility ofidentification, and sensitivity and accuracy of quantification [133, 134, 136].Protein–protein interactions and cell signalling cascades are mainly studied withthe following approaches: yeast two-hybrid complementation, protein microarray,immunoaffinity chromatography and MS [137], and with a lower throughput byimmunoprecipitation and mass spectrometry in Mammals [138, 139]. Attempts tointegrate proteomics with other omics data are hindered by current drawbacks ofproteomics analysis: proteome not completely sampled, uncertain identification ofprotein, difficulties in mapping identifiers across the different omics sources, hencethe need for protein-centric knowledge bases such as TransProteomic Pipeline[140], Protein Atlas [141] and neXProt [142].
1.3.4 Metabolomics and Lipidomics
1.3.4.1 Metabolomics
Metabolomics is the high-throughput characterisation of the mixture of allmetabolites in a biological system, i.e. endogenous and exogenous small
18 S. Ballereau et al.
molecules [143]. Metabolites are lipids, peptides, and amino, nucleic and organicacids. Metabolomics is now widely used in microbiology, nutrition, agricultureand environmental sciences, and clinical and pharmaceutical fields. Metabolitesare the product of enzymatic reactions mediating complex biological processes andmay therefore help understand phenotypes. They can be analysed using NMRspectroscopy although it lacks sensitivity [144] and MS (GC and LC) is usuallypreferred and used in targeted and untargeted approaches. Targeted strategies arespecific and sensitive, allow absolute quantification and thus widely used inclinical diagnostics and drug development. Targeted approaches based on stableisotopes and models of metabolic networks allow estimation of the flux throughbiochemical pathways [145]. In contrast, untargeted approaches harbour a highcoverage, though any metabolite identification is less specific and sensitive, andrequires more intensive computational analysis. Features to use for identificationare detected using univariate and multivariate analyses and then used to searchdatabases such as Kyoto Encyclopedia of Genes and Genomes (KEGG) [146, 147].Further experiments to distinguish isomers and characterise unidentified metabo-lites using tandem MS or NMR are often required. Metabolomics also includeidentification of substrate in in vitro assays of three types: (1) the protein is fixedonto a surface and ligands screened, (2) the metabolite is fixed and serve as bait forinteracting proteins, or (3) activity-based protein profiling using chemical probesand beads. Last but not least, location of metabolites within cells, tissues or bodiescan be studied by coupling MALDI or matrix-free MS and imaging techniques(imaging mass spectrometry, IMS) to obtain spectra by scanning the biologicalsample with the laser and then compiling a map of metabolite content across thatsample [145, 148].
Standards for experiment description and tools for processing and analysis ofmetabolomics data are actively being developed [149, 150]. For example, Me-tabolomeExpress [151] and metaP [152] both combine tools from raw data pro-cessing, i.e. MS peak detection, to multivariate analysis.
Development of biomarkers with metabolomics and comparison between datasets depend on: (1) the characterisation of technical MS artefacts and differences incompounds discriminating samples between analysers and (2) sample type andbiological variability [153]. The Human Metabolome Project quantified over 4,000metabolites in up to 70 samples [143] out of 6,826 identified by Wishart andcolleagues [154]. Another recent large-scale targeted metabolomics study quan-tified 122 metabolites in 377 individuals, including type 2 diabetes patients andcontrols, and identified 25 metabolites in plasma and 15 more in serum withdifferent concentrations in the two groups [155].
1.3.4.2 Lipidomics
Lipids play important roles in the signalling involved in metabolism, energystorage, and cell proliferation, migration and apoptosis [156]. They are also themain components of cellular membranes, together with membrane proteins.
1 Functional Genomics, Proteomics, Metabolomics and Bioinformatics 19
They thereby maintain cellular architecture and mediate membrane trafficking byenabling protein machinery assembly, as for example in dynamic clusters gath-ering specific proteins in lipids rafts [157]. Lipids are very diverse in theirstructure, physical properties and quantity. For example, signalling and structurallipids are respectively found in low and high abundance. Lipidomes, the lipidspresent in biological structures, are currently poorly understood [158]. The Humanlipidome may contain thousands of species [159] while only 20 % of all lipids mayhave been detectable with existing technologies, as in 2009 [154]. Lipidomicsstudies aim to characterise lipids content, localisation and activity in cells andtissues [160]. The vast majority of lipids are extracted from lysed cells and tissues,and analysed with MS either directly in the shotgun method, i.e. ‘top-down’ lip-idomics with high resolution analysers such as Orbitraps, or with LC–MS/MS‘bottom-up’ lipidomics to distinguish lipids with identical charge to mass ratio[161]. Lipids have also been analysed with MALDI IMS [162]. Lipidomics MSraw data can be analysed with tools used for metabolomics, such as XCMS [163]and MZmine 2 [164].
Lipids are identified and quantified using raw data processing and statisticalanalysis, followed by pathway analysis and modelling [165]. Major lipidomicsintiatives include the ‘Lipid Metabolites And Pathways Strategy’ (LIPID MAPS)which has established standards and enabled absolute rather than relative quanti-fication [166], and the Mouse Macrophage Lipidome [167]. Absolute quantities forproteomics and lipidomics will help characterise complexes comprising bothproteins and lipids [145].
Future technical advances should aim for higher accuracy better consistency,and harmonisation of protocols. Analytical developments should include: (1)automated data processing and lipid identification and mining, (2) statistical dataanalysis to address high-dimensionality and platform-independent computation oflipid identification false discovery rate, (3) pathway analysis to identify bio-chemical, signalling and regulatory processes that involve the lipids of interestcharacterised in a sample set, and (4) modelling in time and space within thecontext of physiology and systems [168].
1.4 Methods and Tools
Current high-throughput technologies produce very large data sets and haveshifted the bottleneck from data production to data analysis. Knowledge man-agement tools are thus very valuable to organise, store and analyse data eitherdirectly with embedded software or indirectly by exporting the data in the requiredformat. Recent data sets also harbour very high dimensionality. Data integrationaims at combining such high-dimensionality, large data sets differing in the type ofdata collected. Unsupervised integration aims to reduce the dimensionality of largedata sets, without introducing a bias inherent to prior knowledge and hypotheses. Ithelps detect patterns within and amongst data sets and complements standard
20 S. Ballereau et al.
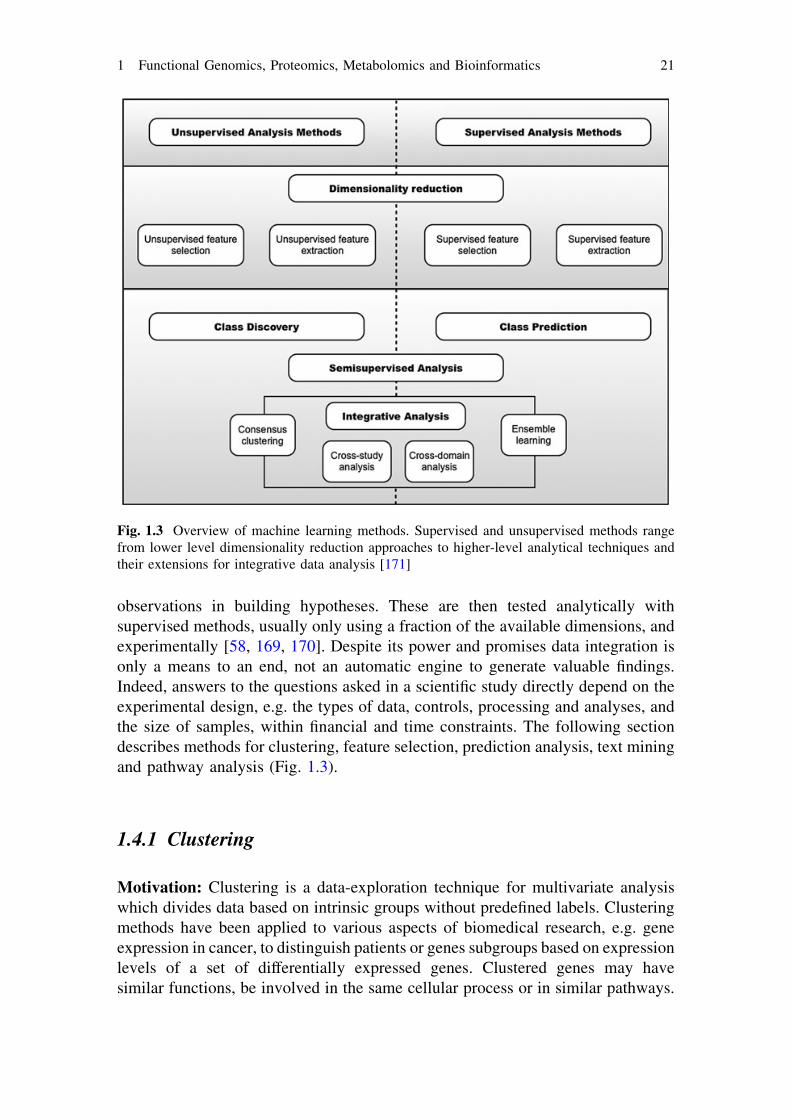
observations in building hypotheses. These are then tested analytically withsupervised methods, usually only using a fraction of the available dimensions, andexperimentally [58, 169, 170]. Despite its power and promises data integration isonly a means to an end, not an automatic engine to generate valuable findings.Indeed, answers to the questions asked in a scientific study directly depend on theexperimental design, e.g. the types of data, controls, processing and analyses, andthe size of samples, within financial and time constraints. The following sectiondescribes methods for clustering, feature selection, prediction analysis, text miningand pathway analysis (Fig. 1.3).
1.4.1 Clustering
Motivation: Clustering is a data-exploration technique for multivariate analysiswhich divides data based on intrinsic groups without predefined labels. Clusteringmethods have been applied to various aspects of biomedical research, e.g. geneexpression in cancer, to distinguish patients or genes subgroups based on expressionlevels of a set of differentially expressed genes. Clustered genes may havesimilar functions, be involved in the same cellular process or in similar pathways.
Fig. 1.3 Overview of machine learning methods. Supervised and unsupervised methods rangefrom lower level dimensionality reduction approaches to higher-level analytical techniques andtheir extensions for integrative data analysis [171]
1 Functional Genomics, Proteomics, Metabolomics and Bioinformatics 21
Such knowledge would improve our understanding of gene function and biologicalprocesses. Clustering methods can be used for visualization, hypothesis generationand selection of genes for further analysis.
Pre-processing: Clustering requires standard normalization methods for omicsdata [172–174]. Clustering specifically requires a prior dimensionality reductionand data standardization, e.g. filtering out genes or proteins with low varianceacross the samples, methods based on the maximization of a function of covari-ances as in the ‘sum of covariances’ (SUMCOV) method [175], and standardi-zation of the data, e.g. mean absolute deviation standardization.
State-of-the-art: Numerous clustering tools have been developed. Severalwell-known clustering algorithms are: hierarchical clustering, partition and den-sity-based clustering and fuzzy clustering. More recently developed clusteringalgorithms include: subspace or bi-clustering methods that cluster both genes andsamples [176]. Automatic acquisition, pre-processing and clustering analysis viaweb-based tools is possible for several high-throughput technologies, e.g. Babel-omics [177], BioArray Software Environment (BASE) [178] and Multiple Clus-tering Analysis Methodology (MCAM) [179]. Efficient cluster validationprocedures are crucial for decision making with large number of genes in theabsence of large amount of samples and will therefore be extremely useful tounderstand genetic interactions and design drug targets.
Use cases: Clustering is widely used in microarray data analysis and a widechoice of tools exists. Clustering of genes may identify a group of genes withsimilar functions while clustering of samples can suggest patient subgroups forstratification, response to treatments and disease subtypes or grade, e.g. childhoodleukemia [180], breast cancer [181] and asthma [182, 183]. Clusters can also beintegrated with pathway analysis [184].
1.4.2 Feature Selection
Motivation: Feature or attribute selection methods have a wide range of appli-cations in Systems Biology. They enable an experimenter to identify which genesor proteins are significantly differentially expressed across different biologicalconditions in a cell type of interest, and which subsets of genes or proteins providethe most promising combined set of biomarkers for discriminating between theseconditions (see also the section on prediction analysis). Moreover, feature selec-tion approaches are often used to reduce the dimension of the input data beforeapplying other higher-level statistical analysis methods. This alleviates a variety ofstatistical problems referred to as the curse of dimensionality in the literature[185]. However, in contrast to feature transformation based dimension reductionmethods [186], the original features of the data are preserved, which facilitatesdata interpretation in subsequent analyses.
Feature selection algorithms can be grouped into supervised [187] and unsu-pervised approaches [188], depending on whether they incorporate information
22 S. Ballereau et al.
from class labels for the biological conditions. Moreover, feature selection algo-rithms employing prediction methods to score the informativeness of a featuresubset are known as wrappers, whereas other univariate and combinatorialapproaches to filter attributes are called filters [189].
Pre-processing: For most experimental platforms used in Systems Biology,several low-level pre-processing steps are required before applying featureselection methods. These include image processing [190, 191], normalisation[192] and summarisation approaches [193, 194], for microarray gene expressiondata [195], and raw data filtering [196], peak detection [197], peak alignment [198]and retention time normalisation methods for proteomics and metabolomics massspectrometry data [199]. Moreover, some feature selection methods require a priordiscretization of the data, e.g. if special association measures are used, such asmutual information [200].
State-of-the-art: The choice of the feature selection method depends both onthe analysis goal (e.g. identifying individual biomarkers, or building a combina-torial predictive model for sample classification) and on the desired trade-offbetween efficiency (the run-time complexity of the algorithm) and accuracy (thepredictive power of the selected features).
Among the filter approaches, simple univariate statistics like the parametricStudent’s t test and the non-parametric Wilcoxon rank sum test are still widelyused, due to their advantages in terms of speed and the difficulty of estimatingfeature dependencies from noisy, high-dimensional data. More complex combi-natorial methods such as CFS [201], EFS [202] and Markov blanket filtering [203]have recently gained influence.
Wrapper methods are becoming increasingly popular. They score feature sub-sets using prediction methods in combination with a search space explorationapproach and their selections reach state-of-the art predictive performance inbiological classification problems. Examples include combinations of fast andsimple prediction methods, e.g. kNN [204] and Naïve Bayes [205], and searchspace exploration methods, e.g. sequential forward search [206]. These approachesare gradually being replaced by more complex algorithm combinations, includingevolutionary algorithms [207] and kernel-based machine learning methods [208].
Finally, several recent techniques have improved the trade-off between speedand accuracy: (1) combination of filters [209], (2) combination of filters andwrappers into hybrid methods [203], (3) mathematical programming [210] and (4)signal processing approaches [211].
Use cases: Identification and prioritisation of gene, protein or metabolite bio-markers via feature selection techniques have three main aims: (1) distinguishbiological conditions, e.g. presence of cancer, of viral infection, or tumor grades,(2) mediate early diagnostic, patient-tailored therapy, disease progression moni-toring, and (3) help study treatment in a cell culture or animal model. However,feature selection methods are also used to filter datasets prior to the application ofother higher-level data analysis methods, e.g. other machine learning methods,pathway overrepresentation analysis and network analysis. Finally, feature
1 Functional Genomics, Proteomics, Metabolomics and Bioinformatics 23
selection is often integrated with classification and regression techniques todecrease the complexity of machine learning models and maximize their predic-tive accuracy.
1.4.3 Prediction Analysis
Motivation: Prediction analysis refers to a family of methods that attempt tocapture statistical dependencies and extract patterns from a set of measured data, tomake predictions about future data. Such methods hold great promise in functionalgenomics, proteomics, metabolomics and bioinformatics, where the recent tech-nologies provide a wealth of data such as gene and protein expression measure-ments, DNA and RNA sequence reads. The rate at which such data are producedmakes automatic prediction analysis an indispensable tool for the biologist.Methods for prediction analysis can be unsupervised, semi-supervised, orsupervised.
State-of-the-art: Unsupervised methods find regularities and hidden structurein the data. Typical approaches include clustering, feature selection, dimensionreduction, density estimation, and model structure learning [212]. Classical lineardimension reduction methods are principal component analysis and independentcomponent analysis, but recently some very powerful nonlinear dimensionreduction methods have appeared [213, 214].
Supervised methods use data in the form of pairs (x, y) and estimate a functionthat predicts the value of y from a given input x. When y is a discrete quantity (forexample a label of a number of distinct biological conditions) the method is calledclassification and when y is continuous the method is called regression. The keychallenge is to ensure that the estimated function can generalize well to unseensituations [215]. Two methods are popular: (1) support vector machine (SVM) thatestimates a discriminative function by maximizing class separation margin [216]and (2) random forest, based on tree ensembles and voting [217].
Semi-supervised methods combine ideas from supervised and unsupervisedmethods, to capture unsupervised structure in the data in order to boost classifi-cation performance [218].
Time series methods use data measured at different times to model and predictfuture values of the data, by capturing its structure and regularities and accountingfor stochastic effects, e.g. with hidden Markov models (HMM) [219].
Use cases: A typical example is the classification of biological data such asgene expression data into different biological classes, e.g. disease and healthy,mostly using SVM and random forests. Prediction methods are also applied topathway analysis, network decomposition and sequence annotation. They are oftencombined with a feature selection to extract the most relevant dimensions in theinput data space [220].
24 S. Ballereau et al.
1.4.4 Building Networks and Pathways from Literature
Motivation: Text mining joints efforts with the experimental sciences to helpmultifaceted disease-related research. Networks and connectivity maps are derivedfrom text in an attempt to find connections and causal relations between compo-nents of complex biomedical systems, in order to elucidate disease mechanismsand detect co-morbidities [221, 222].
Pre-processing: Preparation of textual data consists of tokenization, removal ofpunctuation marks, part-of-speech tagging and sometimes syntactic parsing. Next,names of proteins, genes, chemicals, phenotypes and diseases are identified in thetext. Management of biomedical terminology addresses several issues, such asappearance of new terms [221], heavy use of acronyms, abbreviations and general-purpose words that designate genes [223]. Synonymy and homonymy imposespecial challenges on the recognition process and complicate linking of a genename to its unique identifier in the database [224, 225]. State-of-the-art named-entity recognition (NER) systems achieve F-measure of about 86 % [226] onbiomedical corpus as opposed to 93 % on general purpose English texts [227].
State-of-the-art: Reconstruction of biological pathways from literature hasevolved from undirected pairwise protein–protein co-occurrences [228] to com-plex biomedical events of typed and therefore directed interactions spanningmultiple proteins [229–232]. The latter rely to a large extent on the richly anno-tated corpora, deep syntactic parsing and supervised machine learning techniques.Due to complexity of the natural language, accurate extraction of biomedicalevents remains a challenge. F-measure achieved by state-of-the-art systems variesfrom roughly 70–48 % depending largely on the event type being recognized.
Use cases: Many biomedical text-mining tools assist users at different stages oftext processing, in particular for networks and pathways construction. Co-occur-rence model has been successfully implemented in iHop, a hyperlinked network ofgenes and proteins mentioned in PubMed abstracts [233]. Facta ? extends thepairwise co-occurrence model with event extraction and discovery of indirectassociations between the biomedical concepts [222]. Based on PubMed abstracts,AliBaba builds networks of interacting proteins, genes—disease associations andsubcellular location of proteins [234]. Networks extracted from text can be com-plemented with experimental data using IntAct [235] and CoPub [236].
1.4.5 Pathway Analysis
Motivation: Pathway analysis aims at identifying pathway deregulations toimprove the understanding of complex phenotypes by leveraging information onknown biomolecular interactions in pathways to guide the search through the spaceof possible functional associations. A wide range of methods exists, includingenrichment analysis statistics, pathway-based disease gene prioritization methods,
1 Functional Genomics, Proteomics, Metabolomics and Bioinformatics 25
convex metabolic pathway analysis and in silico pathway prediction/reconstruc-tion methods [237].
Pre-processing: Because experimental measurement platforms and pathwaydatabases tend to use different identifier formats, pathway analysis usually startswith the conversion of gene/protein names into a standard format [238–240],followed by normalisation and pre-processing of the experimental data.
State-of-the-art: Several novel approaches have recently been developed toinfer changes in pathway activity from high-throughput data more accurately thanby the classical combination of differential expression filtering with overrepre-sentation statistics like the Fisher exact test (for unordered datasets) or the Kol-mogorov–Smirnov test (for ranked datasets). These include parametric and non-parametric approaches that take into account unfiltered gene expression levelmeasurements, e.g. GSEA [241], PaGE [242], GAGE [243] or exploit informationfrom ontology graphs, e.g. Ontologizer [244] and GeneCodis [245]. For the studyof metabolic pathways, two related approaches using convex analysis have becomeincreasingly important: Elementary flux modes [246] and extreme pathways [247].Finally, as opposed to the classical human expert-based definition of pathways,various methods for pathway prediction/reconstruction using experimental datahave been proposed recently [248, 249].
Use cases: Genome-wide pathway analyses have provided new insights on theaetiology of complex diseases that cannot be obtained from classical single-locusanalyses [250]. Such analyses have indeed shown that different disruptions in apathway can cause the same disease, as in colorectal cancer [251]. Metabolicpathway analysis is used in biomedical and biotechnological applications, e.g. toincrease the production yield of microorganisms by metabolic engineering, i.e. themodification of selected pathways via recombinant DNA technologies [252].Pathway analysis can also be integrated with network analysis to identify dereg-ulated network modules in complex diseases [253].
1.5 Conclusions
Study of individual genes and their products in model systems has shifted to high-throughput studies in laboratories and often generated by large consortia. Eachtype of omic data is proving very valuable and their integration promises evengreater rewards. Current techniques are very diverse and can analyse complexbiological samples. They harbour high sensitivity and specificity, albeit not alwayssufficient, as in proteomics. Ongoing developments will increase accuracy,robustness, and flexibility while reducing cost. Current technical innovationscontinue shifting the bottleneck from data production to data analysis. Ourunderstanding of biology will indeed increasingly rely on data and knowledgemanagement, and informatics infrastructure to complement advances in mathe-matical and computational modelling for temporal and spatial analytical tech-niques, which are crucial to Systems Biology.
26 S. Ballereau et al.
Acknowledgments This work was supported by the CNRS, the University of Luxembourg andthe ISB, and in part by the EU grants to CA in the context of the MeDALL consortium(Mechanisms of the Development of Allergy, Grant Agreement FP7 N!264357) and theU-BIOPRED consortium (Unbiased Biomarkers for the PREDiction of respiratory disease out-comes, Grant Agreement IMI 115010).
References
1. Gayon J, Malaterre C, Morange M, Raulin-Cerceau F, Tirard S (2010) Defining life:conference proceedings. Orig Life Evol Biosph 40(2):119–120
2. Westerhoff H, Hofmeyr J-H (2005) What is systems biology? From genes to function andback. In: Alberghina L, Westerhoff HV (eds) systems biology, vol 13. Springer, Berlin,pp 163–185
3. Kell DB (2006) Systems biology, metabolic modelling and metabolomics in drug discoveryand development. Drug Discov Today 11(23–24):1085–1092
4. Lowe JA, Jones P, Wilson DM (2010) Network biology as a new approach to drugdiscovery. Curr Opin Drug Discov Devel 13(5):524–526
5. Pujol A, Mosca R, Farrés J, Aloy P (2010) Unveiling the role of network and systemsbiology in drug discovery. Trends Pharmacol Sci 31(3):115–123
6. Kitano H (2002) Looking beyond the details: a rise in system-oriented approaches ingenetics and molecular biology. Curr Genet 41(1):1–10
7. Auffray C, Imbeaud S, Roux-Rouquié M, Hood L (2003) From functional genomics tosystems biology: concepts and practices. C R Biol 326(10–11):879–892
8. Van Regenmortel MHV (2004) Reductionism and complexity in molecular biology.Scientists now have the tools to unravel biological and overcome the limitations ofreductionism. EMBO Rep 5(11):1016–1020
9. Boogerd FC (2007) Systems biology: philosophical foundations. Elsevier, London, p 34210. Wolkenhauer O (2001) Systems biology: the reincarnation of systems theory applied in
biology? Brief Bioinf 2(3):258–27011. Auffray C, Nottale L (2008) Scale relativity theory and integrative systems biology:
1. Founding principles and scale laws. Prog Biophys Mol Biol 97(1):79–11412. Auffray C, Noble D (2009) Origins of systems biology in William Harvey’s masterpiece on
the movement of the heart and the blood in animals. Int J Mol Sci 10(4):1658–166913. Kohl P, Noble D (2009) Systems biology and the virtual physiological human. Mol Syst
Biol 5:29214. Westerhoff HV, Kolodkin A, Conradie R, Wilkinson SJ, Bruggeman FJ, Krab K, van
Schuppen JH, Hardin H, Bakker BM, Moné MJ, Rybakova KN, Eijken M, van LeeuwenHJP, Snoep JL (2009) Systems biology towards life in silico: mathematics of the control ofliving cells. J Math Biol 58(1–2):7–34
15. Hornberg JJ, Bruggeman FJ, Westerhoff HV, Lankelma J (2006) Cancer: a systems biologydisease. BioSystems 83(2–3):81–90
16. del Sol A, Balling R, Hood L, Galas D (2010) Diseases as network perturbations. Curr OpinBiotechnol 21(4):566–571
17. Westerhoff HV (2001) The silicon cell, not dead but live! Metab Eng 3(3):207–21018. Kohl P, Crampin EJ, Quinn TA, Noble D (2010) Systems biology: an approach. Clin
Pharmacol Ther 88(1):25–3319. Hunter PJ, Borg TK (2003) Integration from proteins to organs: the physiome project. Nat
Rev Mol Cell Biol 4(3):237–24320. Hunter PJ, Crampin EJ, Nielsen PMF (2008) Bioinformatics, multiscale modeling and the
IUPS physiome project. Brief Bioinf 9(4):333–343
1 Functional Genomics, Proteomics, Metabolomics and Bioinformatics 27
21. Auffray C, Chen Z, Hood L (2009) Systems medicine: the future of medical genomics andhealthcare. Genome Med 1(1):2
22. Hood L, Flores M (2012) A personal view on systems medicine and the emergence ofproactive P4 medicine: predictive, preventive, personalized and participatory. NewBiotechnol 29:613
23. Horner DS, Pavesi G, Castrignanò T, De Meo PD, Liuni S, Sammeth M, Picardi E, Pesole G(2010) Bioinformatics approaches for genomics and post genomics applications of next-generation sequencing. Brief Bioinf 11(2):181–197
24. Metzker ML (2010) Sequencing technologies—the next generation. Nat Rev Genet11(1):31–46
25. Zhang J, Chiodini R, Badr A, Zhang G (2011) The impact of next-generation sequencing ongenomics. J Genet Genomics 38(3):95–109
26. Martin JA, Wang Z (2011) Next-generation transcriptome assembly. Nat Rev Genet12(10):671–682
27. Dreszer TR, Karolchik D, Zweig AS, Hinrichs AS, Raney BJ, Kuhn RM, Meyer LR, WongM, Sloan CA, Rosenbloom KR, Roe G, Rhead B, Pohl A, Malladi VS, Li CH, Learned K,Kirkup V, Hsu F, Harte RA, Guruvadoo L, Goldman M, Giardine BM, Fujita PA, DiekhansM, Cline MS, Clawson H, Barber GP, Haussler D, James Kent W (2012) The UCSCGenome Browser database: extensions and updates 2011. Nucleic Acids Res 40(Databaseissue):D918–D923
28. Flicek P, Amode MR, Barrell D, Beal K, Brent S, Carvalho-Silva D, Clapham P, Coates G,Fairley S, Fitzgerald S, Gil L, Gordon L, Hendrix M, Hourlier T, Johnson N, Kähäri AK,Keefe D, Keenan S, Kinsella R, Komorowska M, Koscielny G, Kulesha E, Larsson P,Longden I, McLaren W, Muffato M, Overduin B, Pignatelli M, Pritchard B, Riat HS,Ritchie GRS, Ruffier M, Schuster M, Sobral D, Tang YA, Taylor K, Trevanion S,Vandrovcova J, White S, Wilson M, Wilder SP, Aken BL, Birney E, Cunningham F,Dunham L, Durbin R, Fernández-Suarez XM, Harrow J, Herrero J, Hubbard TJP, Parker A,Proctor G, Spudich G, Vogel J, Yates A, Zadissa A, Searle SMJ (2012) Ensembl 2012.Nucleic Acids Res 40(Database issue):D84–D90
29. Cirulli ET, Goldstein DB (2010) Uncovering the roles of rare variants in common diseasethrough whole-genome sequencing. Nat Rev Genet 11(6):415–425
30. DePristo MA, Banks E, Poplin R, Garimella KV, Maguire JR, Hartl C, Philippakis AA, delAngel G, Rivas MA, Hanna M, McKenna A, Fennell TJ, Kernytsky AM, Sivachenko AY,Cibulskis K, Gabriel SB, Altshuler D, Daly MJ (2011) A framework for variation discoveryand genotyping using next-generation DNA sequencing data. Nat Genet 43(5):491–498
31. The 1000 Genomes Project Consortium (2010) A map of human genome variation frompopulation-scale sequencing. Nature 467(7319):1061–1073
32. Hudson TJ, Anderson W, Artez A, Barker AD, Bell C, Bernabé RR, Bhan MK, Calvo F,Eerola I, Gerhard DS, Guttmacher A, Guyer M, Hemsley FM, Jennings JL, Kerr D, Klatt P,Kolar P, Kusada J, Lane DP, Laplace F, Youyong L, Nettekoven G, Ozenberger B, PetersonJ, Rao TS, Remacle J, Schafer AJ, Shibata T, Stratton MR, Vockley JG, Watanabe K, YangH, Yuen MMF, Knoppers BM, Bobrow M, Cambon-Thomsen A, Dressler LG, Dyke SOM,Joly Y, Kato K, Kennedy KL, Nicolás P, Parker MJ, Rial-Sebbag E, Romeo-Casabona CM,Shaw KM, Wallace S, Wiesner GL, !!!Zeps N, Lichter P, Biankin AV, Chabannon C, ChinL, Clément B, de Alava E, Degos F, Ferguson ML, Geary P, Hayes DN, Hudson TJ, JohnsAL, Kasprzyk A, Nakagawa H, Penny R, Piris MA, Sarin R, Scarpa A, Shibata T, van deVijver M, Futreal PA, Aburatani H, Bayés M, Botwell DDL, Campbell PJ, Estivill X,Gerhard DS, Grimmond SM, Gut I, Hirst M, López-Otín C, Majumder P, Marra M,McPherson JD, Nakagawa H, Ning Z, Puente XS, Ruan Y, Shibata T, Stratton MR,Stunnenberg HG, Swerdlow H, Velculescu VE, Wilson RK, Xue HH, Yang L, Spellman PT,Bader GD, Boutros PC, Campbell PJ, Flicek P, Getz G, Guigó R, Guo G, Haussler D, HeathS, Hubbard TJ, Jiang T, Jones SM, Li Q, López-Bigas N, Luo R, Muthuswamy L, OuelletteBFF, Pearson JV, Puente XS, Quesada V, Raphael BJ, Sander C, Shibata T, Speed TP, SteinLD, Stuart JM, Teague TW, Totoki Y, Tsunoda T, Valencia A, Wheeler DA, Wu H, Zhao S,
28 S. Ballereau et al.
Zhou G, Stein LD, Guigó R, Hubbard TJ, Joly Y, Jones SM, Kasprzyk A, Lathrop M,López-Bigas N, Ouellette BFF, Spellman PT, Teague JW, Thomas G, Valencia A, YoshidaT, Kennedy KL, Axton M, Dyke SOM, Futreal PA, Gerhard DS, Gunter C, Guyer M,Hudson TJ, McPherson JD, Miller LJ, Ozenberger B, Shaw KM, Kasprzyk A, Stein LD,Zhang J, Haider SA, Wang J, Yung CK, Cros A, Cross A, Liang Y, Gnaneshan S, GubermanJ, Hsu J, Bobrow M, Chalmers DRC, Hasel KW, Joly Y, Kaan TSH, Kennedy KL,Knoppers BM, Lowrance WW, Masui T, Nicolás P, Rial-Sebbag E, Rodriguez LL, VergelyC, Yoshida T, Grimmond SM, Biankin AV, Bowtell DDL, Cloonan N, deFazio A,Eshleman JR, Etemadmoghadam D, Gardiner BB, Gardiner BA, Kench JG, Scarpa A,Sutherland RL, Tempero MA, Waddell NJ, Wilson PJ, McPherson JD, Gallinger S, TsaoMS, Shaw PA, Petersen GM, Mukhopadhyay D, Chin L, DePinho RA, Thayer S,Muthuswamy L, Shazand K, Beck T, Sam M, Timms L, Ballin V, Lu Y, Ji J, Zhang X, ChenF, Hu X, Zhou G, Yang Q, Tian G, Zhang L, Xing X, Li X, Zhu Z, Yu Y, Yu J, Yang H,Lathrop M, Tost J, Brennan P, Holcatova I, Zaridze D, Brazma A, Egevard L,Prokhortchouk E, Banks RE, Uhlén M, Cambon-Thomsen A, Viksna J, Ponten F,Skryabin K, Stratton MR, Futreal PA, Birney E, Borg A, Børresen-Dale AL, Caldas C,Foekens JA, Martin S, Reis-Filho JS, Richardson AL, Sotiriou C, Stunnenberg HG, ThomsG, van de Vijver M, van’t Veer L, Calvo F, Birnbaum D, Blanche H, Boucher P, Boyault S,Chabannon C, Gut I, Masson-Jacquemier JD, Lathrop M, Pauporté L, Pivot X, Vincent-Salomon A, Tabone E, Theillet C, Thomas G, Tost J, Treilleux I, Calvo F, Bioulac-Sage P,Clément B, Decaens T, Degos F, Franco D, Gut I, Gut M, Heath S, Lathrop M, Samuel D,Thomas G, Zucman-Rossi J, Lichter P, Eils R, Brors B, Korbel JO, Korshunov A, LandgrafP, Lehrach H, Pfister S, Radlwimmer B, Reifenberger G, Taylor MD, von Kalle C,Majumder PP, Sarin R, Rao TS, Bhan MK, Scarpa A, Pederzoli P, Lawlor RA, DelledonneM, Bardelli A, Biankin AV, Grimmond SM, Gress T, Klimstra D, Zamboni G, Shibata T,Nakamura Y, Nakagawa H, Kusada J, Tsunoda T, Miyano S, Aburatani H, Kato K,Fujimoto A, Yoshida T, Campo E, López-Otín C, Estivill X, Guigó R, de Sanjosé S, PirisMA, Montserrat E, González-Díaz M, Puente XS, Jares P, Valencia A, Himmelbauer H,Himmelbaue H, Quesada V, Bea S, Stratton MR, Futreal PA, Campbell PJ, Vincent-Salomon A, Richardson AL, Reis-Filho JS, van de Vijver M, Thomas G, Masson-Jacquemier JD, Aparicio S, Borg A, Børresen-Dale AL, Caldas C, Foekens JA, StunnenbergHG, van’t Veer L, Easton DF, Spellman PT, Martin S, Barker AD, Chin L, Collins FS,Compton CC, Ferguson ML, Gerhard DS, Getz G, Gunter C, Guttmacher A, Guyer M,Hayes DN, Lander ES, Ozenberger B, Penny R, Peterson J, Sander C, Shaw KM, Speed TP,Spellman PT, Vockley JG, Wheeler DA, Wilson RK, Hudson TJ, Chin L, Knoppers BM,Lander ES, Lichter P, Stein LD, Stratton MR, Anderson W, Barker AD, Bell C, Bobrow M,Burke W, Collins FS, Compton CC, DePinho RA, Easton DF, Futreal PA, Gerhard DS,Green AR, Guyer M, Hamilton SR, Hubbard TJ, Kallioniemi OP, Kennedy KL, Ley TJ, LiuET, Lu Y, Majumder P, Marra M, Ozenberger B, Peterson J, Schafer AJ, Spellman PT,Stunnenberg HG, Wainwright BJ, Wilson RK, Yang H (2010) International network ofcancer genome projects. Nature 464(7291):993–998
33. Meyerson M, Gabriel S, Getz G (2010) Advances in understanding cancer genomes throughsecond-generation sequencing. Nat Rev Genet 11(10):685–696
34. Pastinen T (2010) Genome-wide allele-specific analysis: insights into regulatory variationNat Rev Genet 11(8):533–538
35. Thomas T, Gilbert J, Meyer F (2012) Metagenomics—a guide from sampling to dataanalysis. Microb Inf Exp 2(1):1–12
36. Virgin HW, Todd JA (2011) Metagenomics and personalized medicine. Cell 147(1):44–5637. Desai N, Antonopoulos D, Gilbert JA, Glass EM, Meyer F (2012) From genomics to
metagenomics. Curr Opin Biotechnol 23(1):72–7638. Langmead B, Hansen KD, Leek JT (2010) Cloud-scale RNA-sequencing differential
expression analysis with Myrna. Genome Biol 11(8):R8339. Stein LD (2010) The case for cloud computing in genome informatics. Genome Biol
11(5):207
1 Functional Genomics, Proteomics, Metabolomics and Bioinformatics 29
40. Krampis K, Booth T, Chapman B, Tiwari B, Bicak M, Field D, Nelson K (2012) CloudBioLinux: pre-configured and on-demand bioinformatics computing for the genomicscommunity. BMC Bioinf 13(1):42
41. Field D, Sansone S-A, Collis A, Booth T, Dukes P, Gregurick SK, Kennedy K, Kolar P,Kolker E, Maxon M, Millard S, Mugabushaka A-M, Perrin N, Remacle JE, Remington K,Rocca-Serra P, Taylor CF, Thorley M, Tiwari B, Wilbanks J (2009) Megascience omicsdata sharing. Science 326(5950):234–236
42. Sayers EW, Barrett T, Benson DA, Bolton E, Bryant SH, Canese K, Chetvernin V, ChurchDM, DiCuccio M, Federhen S, Feolo M, Fingerman LM, Geer LY, Helmberg W, KapustinY, Landsman D, Lipman DJ, Lu Z, Madden TL, Madej T, Maglott DR, Marchler-Bauer A,Miller V, Mizrachi I, Ostell J, Panchenko A, Phan L, Pruitt KD, Schuler GD, Sequeira E,Sherry ST, Shumway M, Sirotkin K, Slotta D, Souvorov A, Starchenko G, Tatusova TA,Wagner L, Wang Y, Wilbur WJ, Yaschenko E, Ye J (2011) Database resources of theNational Center for Biotechnology Information. Nucleic Acids Res 39(Databaseissue):D38–D51
43. Kent WJ, Sugnet CW, Furey TS, Roskin KM, Pringle TH, Zahler AM, Haussler D (2002)The human genome browser at UCSC. Genome Res 12(6):996–1006
44. Dunn WB (2011) Mass spectrometry in systems biology an introduction. Meth Enzymol500:15–35
45. Hagen JB (2000) The origins of bioinformatics. Nat Rev Genet 1(3):231–23646. Mount DR (2004) Bioinformatics: sequence and genome analysis. Cold Spring Harbor
Laboratory Press, Second47. Ashburner M, Ball CA, Blake JA, Botstein D, Butler H, Cherry JM, Davis AP, Dolinski K,
Dwight SS, Eppig JT, Harris MA, Hill DP, Issel-Tarver L, Kasarskis A, Lewis S, Matese JC,Richardson JE, Ringwald M, Rubin GM, Sherlock G (2000) Gene ontology: tool for theunification of biology. The gene ontology consortium. Nat Genet 25(1):25–29
48. Gene Ontology Consortium (2001) Creating the gene ontology resource: design andimplementation. Genome Res 11(8):425–1433
49. Whetzel PL, Parkinson H, Causton HC, Fan L, Fostel J, Fragoso G, Game L, Heiskanen M,Morrison N, Rocca-Serra P, Sansone S-A, Taylor C, White J, Stoeckert CJ Jr (2006) TheMGED ontology: a resource for semantics-based description of microarray experiments.Bioinformatics 22(7):866–873
50. Csordas A, Ovelleiro D, Wang R, Foster JM, Ríos D, Vizcaíno JA, Hermjakob H (2012)PRIDE: quality control in a proteomics data repository. Database (Oxford) 2012:bas004
51. Jones AR, Miller M, Aebersold R, Apweiler R, Ball CA, Brazma A, Degreef J, Hardy N,Hermjakob H, Hubbard SJ, Hussey P, Igra M, Jenkins H, Julian RK Jr, Laursen K, OliverSG, Paton NW, Sansone S-A, Sarkans U, Stoeckert CJ Jr, Taylor CF, Whetzel PL, WhiteJA, Spellman P, Pizarro A (2007) The functional genomics experiment model (FuGE): anextensible framework for standards in functional genomics. Nat Biotechnol25(10):1127–1133
52. Hucka M, Finney A, Sauro HM, Bolouri H, Doyle JC, Kitano H, Arkin AP, Bornstein BJ,Bray D, Cornish-Bowden A, Cuellar AA, Dronov S, Gilles ED, Ginkel M, Gor V, GoryaninII, Hedley WJ, Hodgman TC, Hofmeyr J-H, Hunter PJ, Juty NS, Kasberger JL, Kremling A,Kummer U, Le Novère N, Loew LM, Lucio D, Mendes P, Minch E, Mjolsness ED,Nakayama Y, Nelson MR, Nielsen PF, Sakurada T, Schaff JC, Shapiro BE, Shimizu TS,Spence HD, Stelling J, Takahashi K, Tomita M, Wagner J, Wang J (2003) The systemsbiology markup language (SBML): a medium for representation and exchange ofbiochemical network models. Bioinformatics 19(4):524–531
53. Novere NL, Hucka M, Mi H, Moodie S, Schreiber F, Sorokin A, Demir E, Wegner K,Aladjem MI, Wimalaratne SM, Bergman FT, Gauges R, Ghazal P, Kawaji H, Li L,Matsuoka Y, Villeger A, Boyd SE, Calzone L, Courtot M, Dogrusoz U, Freeman TC,Funahashi A, Ghosh S, Jouraku A, Kim S, Kolpakov F, Luna A, Sahle S, Schmidt E,Watterson S, Wu G, Goryanin I, Kell DB, Sander C, Sauro H, Snoep JL, Kohn K, Kitano H(2009) The systems biology graphical notation. Nat Biotech 27(8):735–741
30 S. Ballereau et al.
54. Guberman JM, Ai J, Arnaiz O, Baran J, Blake A, Baldock R, Chelala C, Croft D, Cros A,Cutts RJ, Di Genova A, Forbes S, Fujisawa T, Gadaleta E, Goodstein DM, Gundem G,Haggarty B, Haider S, Hall M, Harris T, Haw R, Hu S, Hubbard S, Hsu J, Iyer V, Jones P,Katayama T, Kinsella R, Kong L, Lawson D, Liang Y, Lopez-Bigas N, Luo J, Lush M,Mason J, Moreews F, Ndegwa N, Oakley D, Perez-Llamas C, Primig M, Rivkin E, RosanoffS, Shepherd R, Simon R, Skarnes B, Smedley D, Sperling L, Spooner W, Stevenson P,Stone K, Teague J, Wang J, Wang J, Whitty B, Wong DT, Wong-Erasmus M, Yao L,Youens-Clark K, Yung C, Zhang J, Kasprzyk A (2011) BioMart central portal: an opendatabase network for the biological community. Database 2011:bar041
55. Zhang J, Haider S, Baran J, Cros A, Guberman JM, Hsu J, Liang Y, Yao L, Kasprzyk A(2011) BioMart: a data federation framework for large collaborative projects. Database(Oxford) 2011:bar038
56. Perakslis ED, Van Dam J, Szalma S (2010) How informatics can potentiate precompetitiveopen-source collaboration to jump-start drug discovery and development. Clin PharmacolTher 87(5):614–616
57. Maier D, Kalus W, Wolff M, Kalko SG, Roca J, Marin de Mas I, Turan N, Cascante M,Falciani F, Hernandez M, Villà-Freixa J, Losko S (2011) Knowledge management forsystems biology a general and visually driven framework applied to translational medicine.BMC Syst Biol 5:38
58. Ghosh S, Matsuoka Y, Asai Y, Hsin K-Y, Kitano H (2011) Software for systems biology:from tools to integrated platforms. Nat Rev Genet 12(12):821–832
59. Kupershmidt I, Su QJ, Grewal A, Sundaresh S, Halperin I, Flynn J, Shekar M, Wang H,Park J, Cui W, Wall GD, Wisotzkey R, Alag S, Akhtari S, Ronaghi M (2010) Ontology-based meta-analysis of global collections of high-throughput public data. PLoS ONE5(9):e13066
60. Huang Y-W, Huang TH-M, Wang L-S (2010) Profiling DNA methylomes from microarrayto genome-scale sequencing. Technol Cancer Res Treat 9(2):139–147
61. Laird PW (2010) Principles and challenges of genome-wide DNA methylation analysis. NatRev Genet 11(3):191–203
62. Rakyan VK, Down TA, Balding DJ, Beck S (2011) Epigenome-wide association studies forcommon human diseases. Nat Rev Genet 12(8):529–541
63. Birney E, Stamatoyannopoulos JA, Dutta A, Guigó R, Gingeras TR, Margulies EH, WengZ, Snyder M, Dermitzakis ET, Thurman RE, Kuehn MS, Taylor CM, Neph S, Koch CM,Asthana S, Malhotra A, Adzhubei I, Greenbaum JA, Andrews RM, Flicek P, Boyle PJ, CaoH, Carter NP, Clelland GK, Davis S, Day N, Dhami P, Dillon SC, Dorschner MO, FieglerH, Giresi PG, Goldy J, Hawrylycz M, Haydock A, Humbert R, James KD, Johnson BE,Johnson EM, Frum TT, Rosenzweig ER, Karnani N, Lee K, Lefebvre GC, Navas PA, NeriF, Parker SCJ, Sabo PJ, Sandstrom R, Shafer A, Vetrie D, Weaver M, Wilcox S, Yu M,Collins FS, Dekker J, Lieb JD, Tullius TD, Crawford GE, Sunyaev S, Noble WS, Dunham I,Denoeud F, Reymond A, Kapranov P, Rozowsky J, Zheng D, Castelo R, Frankish A,Harrow J, Ghosh S, Sandelin A, Hofacker IL, Baertsch R, Keefe D, Dike S, Cheng J, HirschHA, Sekinger EA, Lagarde J, Abril JF, Shahab A, Flamm C, Fried C, Hackermüller J, HertelJ, Lindemeyer M, Missal K, Tanzer A, Washietl S, Korbel J, Emanuelsson O, Pedersen JS,Holroyd N, Taylor R, Swarbreck D, Matthews N, Dickson MC, Thomas DJ, Weirauch MT,Gilbert J, Drenkow J, Bell I, Zhao X, Srinivasan KG, Sung W-K, Ooi HS, Chiu KP, FoissacS, Alioto T, Brent M, Pachter L, Tress ML, Valencia A, Choo SW, Choo CY, Ucla C,Manzano C, Wyss C, Cheung E, Clark TG, Brown JB, Ganesh M, Patel S, Tammana H,Chrast J, Henrichsen CN, Kai C, Kawai J, Nagalakshmi U, Wu J, Lian Z, Lian J, NewburgerP, Zhang X, Bickel P, Mattick JS, Carninci P, Hayashizaki Y, Weissman S, Hubbard T,Myers RM, Rogers J, Stadler PF, Lowe TM, Wei C-L, Ruan Y, Struhl K, Gerstein M,Antonarakis SE, Fu Y, Green ED, Karaöz U, Siepel A, Taylor J, Liefer LA, WetterstrandKA, Good PJ, Feingold EA, Guyer MS, Cooper GM, Asimenos G, Dewey CN, Hou M,Nikolaev S, Montoya-Burgos JI, Löytynoja A, Whelan S, Pardi F, Massingham T, Huang H,Zhang NR, Holmes I, Mullikin JC, Ureta-Vidal A, Paten B, Seringhaus M, Church D,
1 Functional Genomics, Proteomics, Metabolomics and Bioinformatics 31
Rosenbloom K, Kent WJ, Stone EA, Batzoglou S, Goldman N, Hardison RC, Haussler D,Miller W, Sidow A, Trinklein ND, Zhang ZD, Barrera L, Stuart R, King DC, Ameur A,Enroth S, Bieda MC, Kim J, Bhinge AA, Jiang N, Liu J, Yao F, Vega VB, Lee CWH, Ng P,Shahab A, Yang A, Moqtaderi Z, Zhu Z, Xu X, Squazzo S, Oberley MJ, Inman D, SingerMA, Richmond TA, Munn KJ, Rada-Iglesias A, Wallerman O, Komorowski J, Fowler JC,Couttet P, Bruce AW, Dovey OM, Ellis PD, Langford CF, Nix DA, Euskirchen G, HartmanS, Urban AE, Kraus P, Van Calcar S, Heintzman N, Kim TH, Wang K, Qu C, Hon G, LunaR, Glass CK, Rosenfeld MG, Aldred SF, Cooper SJ, Halees A, Lin JM, Shulha HP, ZhangX, Xu M, Haidar JNS, Yu Y, Ruan Y, Iyer VR, Green RD, Wadelius C, Farnham PJ, Ren B,Harte RA, Hinrichs AS, Trumbower H, Clawson H, Hillman-Jackson J, Zweig AS, Smith K,Thakkapallayil A, Barber G, Kuhn RM, Karolchik D, Armengol L, Bird CP, de BakkerPIW, Kern AD, Lopez-Bigas N, Martin JD, Stranger BE, Woodroffe A, Davydov E, DimasA, Eyras E, Hallgrímsdóttir IB, Huppert J, Zody MC, Abecasis GR, Estivill X, BouffardGG, Guan X, Hansen NF, Idol JR, Maduro VVB, Maskeri B, McDowell JC, Park M,Thomas PJ, Young AC, Blakesley RW, Muzny DM, Sodergren E, Wheeler DA, WorleyKC, Jiang H, Weinstock GM, Gibbs RA, Graves T, Fulton R, Mardis ER, Wilson RK,Clamp M, Cuff J, Gnerre S, Jaffe DB, Chang JL, Lindblad-Toh K, Lander ES, Koriabine M,Nefedov M, Osoegawa K, Yoshinaga Y, Zhu B, de Jong PJ (2007) Identification andanalysis of functional elements in 1% of the human genome by the ENCODE pilot project.Nature 447(7146):799–816
64. Bernstein BE, Stamatoyannopoulos JA, Costello JF, Ren B, Milosavljevic A, Meissner A,Kellis M, Marra MA, Beaudet AL, Ecker JR, Farnham PJ, Hirst M, Lander ES, MikkelsenTS, Thomson JA (2010) The NIH roadmap epigenomics mapping consortium. NatBiotechnol 28(10):1045–1048
65. Bradbury J (2003) Human epigenome project–up and running. PLoS Biol 1(3):E8266. Rakyan VK, Hildmann T, Novik KL, Lewin J, Tost J, Cox AV, Andrews TD, Howe KL,
Otto T, Olek A, Fischer J, Gut IG, Berlin K, Beck S (2004) DNA methylation profiling ofthe human major histocompatibility complex: a pilot study for the human epigenomeproject. PLoS Biol 2(12):e405
67. Adams D, Altucci L, Antonarakis SE, Ballesteros J, Beck S, Bird A, Bock C, Boehm B,Campo E, Caricasole A, Dahl F, Dermitzakis ET, Enver T, Esteller M, Estivill X, Ferguson-Smith A, Fitzgibbon J, Flicek P, Giehl C, Graf T, Grosveld F, Guigo R, Gut I, Helin K,Jarvius J, Kuppers R, Lehrach H, Lengauer T, Lernmark A, Leslie D, Loeffler M, MacintyreE, Mai A, Martens JH, Minucci S, Ouwehand WH, Pelicci PG, Pendeville H, Porse B,Rakyan V, Reik W, Schrappe M, Schubeler D, Seifert M, Siebert R, Simmons D, SoranzoN, Spicuglia S, Stratton M, Stunnenberg HG, Tanay A, Torrents D, Valencia A, Vellenga E,Vingron M, Walter J, Willcocks S (2012) BLUEPRINT to decode the epigenetic signaturewritten in blood. Nat Biotech 30(3):224–226
68. Irizarry RA, Ladd-Acosta C, Carvalho B, Wu H, Brandenburg SA, Jeddeloh JA, Wen B,Feinberg AP (2008) Comprehensive high-throughput arrays for relative methylation(CHARM). Genome Res 18(5):780–790
69. Fernandez AF, Assenov Y, Martin-Subero JI, Balint B, Siebert R, Taniguchi H, YamamotoH, Hidalgo M, Tan A-C, Galm O, Ferrer I, Sanchez-Cespedes M, Villanueva A, Carmona J,Sanchez-Mut JV, Berdasco M, Moreno V, Capella G, Monk D, Ballestar E, Ropero S,Martinez R, Sanchez-Carbayo M, Prosper F, Agirre X, Fraga MF, Graña O, Perez-Jurado L,Mora J, Puig S, Prat J, Badimon L, Puca AA, Meltzer SJ, Lengauer T, Bridgewater J, BockC, Esteller M (2011) A DNA methylation fingerprint of 1628 human samples. Genome Res22:407
70. Sandoval J, Heyn H, Moran S, Serra-Musach J, Pujana MA, Bibikova M, Esteller M (2011)Validation of a DNA methylation microarray for 450,000 CpG sites in the human genome.Epigenetics 6(6):692–702
71. Branton D, Deamer DW, Marziali A, Bayley H, Benner SA, Butler T, Di Ventra M, Garaj S,Hibbs A, Huang X, Jovanovich SB, Krstic PS, Lindsay S, Ling XS, Mastrangelo CH, MellerA, Oliver JS, Pershin YV, Ramsey JM, Riehn R, Soni GV, Tabard-Cossa V, Wanunu M,
32 S. Ballereau et al.
Wiggin M, Schloss JA (2008) The potential and challenges of nanopore sequencing. NatBiotechnol 26(10):1146–1153
72. Farnham PJ (2009) Insights from genomic profiling of transcription factors. Nat Rev Genet10(9):605–616
73. Park PJ (2009) ChIP-seq: advantages and challenges of a maturing technology. Nat RevGenet 10(10):669–680
74. Serre D, Lee BH, Ting AH (2010) MBD-isolated genome sequencing provides a high-throughput and comprehensive survey of DNA methylation in the human genome. NucleicAcids Res 38(2):391–399
75. Macisaac KD, Fraenkel E (2010) Sequence analysis of chromatin immunoprecipitation datafor transcription factors. Methods Mol Biol 674:179–193
76. Zhou VW, Goren A, Bernstein BE (2011) Charting histone modifications and the functionalorganization of mammalian genomes. Nat Rev Genet 12(1):7–18
77. Hoffman MM, Buske OJ, Wang J, Weng Z, Bilmes JA, Noble WS (2012) Unsupervisedpattern discovery in human chromatin structure through genomic segmentation. NatureMethods 9:473
78. Korolev N, Fan Y, Lyubartsev AP, Nordenskiöld L (2012) Modelling chromatin structureand dynamics: status and prospects. Curr Opin Struct Biol 22(2):151–159
79. Geng T, Bao N, Litt MD, Glaros TG, Li L, Lu C (2011) Histone modification analysis bychromatin immunoprecipitation from a low number of cells on a microfluidic platform. LabChip 11(17):2842–2848
80. Bock C, Tomazou EM, Brinkman AB, Müller F, Simmer F, Gu H, Jäger N, Gnirke A,Stunnenberg HG, Meissner A (2010) Quantitative comparison of genome-wide DNAmethylation mapping technologies. Nat Biotechnol 28(10):1106–1114
81. Rhee HS, Pugh BF (2011) Comprehensive genome-wide protein-DNA interactions detectedat single-nucleotide resolution. Cell 147(6):1408–1419
82. Muro EM, McCann JA, Rudnicki MA, Andrade-Navarro MA (2009) Use of SNP-arrays forChIP assays: computational aspects. Methods Mol Biol 567:145–154
83. Siegmund KD (2011) Statistical approaches for the analysis of DNA methylationmicroarray data. Hum Genet 129(6):585–595
84. Sun S, Huang Y-W, Yan PS, Huang TH, Lin S (2011) Preprocessing differentialmethylation hybridization microarray data. BioData Min 4:13
85. Huss M (2010) Introduction into the analysis of high-throughput-sequencing basedepigenome data. Brief Bioinf 11(5):512–523
86. Massie CE, Mills IG (2012) Mapping protein-DNA interactions using ChIP-sequencing.Methods Mol Biol 809:157–173
87. Boyle AP, Song L, Lee B-K, London D, Keefe D, Birney E, Iyer VR, Crawford GE, FureyTS (2011) High-resolution genome-wide in vivo footprinting of diverse transcription factorsin human cells. Genome Res 21(3):456–464
88. Giresi PG, Kim J, McDaniell RM, Iyer VR, Lieb JD (2007) FAIRE (formaldehyde-assistedisolation of regulatory elements) isolates active regulatory elements from human chromatin.Genome Res 17(6):877–885
89. Auerbach RK, Euskirchen G, Rozowsky J, Lamarre-Vincent N, Moqtaderi Z, Lefrançois P,Struhl K, Gerstein M, Snyder M (2009) Mapping accessible chromatin regions using sono-seq. Proc Natl Acad Sci USA 106(35):14926–14931
90. Dekker J, Rippe K, Dekker M, Kleckner N (2002) Capturing chromosome conformation.Science 295(5558):1306–1311
91. Dean A (2011) In the loop: long range chromatin interactions and gene regulation. BriefFunct Genomics 10(1):3–10
92. Simonis M, Klous P, Splinter E, Moshkin Y, Willemsen R, de Wit E, van Steensel B, deLaat W (2006) Nuclear organization of active and inactive chromatin domains uncovered bychromosome conformation capture-on-chip (4C). Nat Genet 38(11):1348–1354
93. Dostie J, Richmond TA, Arnaout RA, Selzer RR, Lee WL, Honan TA, Rubio ED, KrummA, Lamb J, Nusbaum C, Green RD, Dekker J (2006) Chromosome conformation capture
1 Functional Genomics, Proteomics, Metabolomics and Bioinformatics 33
carbon copy (5C): a massively parallel solution for mapping interactions between genomicelements. Genome Res 16(10):1299–1309
94. Lieberman-Aiden E, van Berkum NL, Williams L, Imakaev M, Ragoczy T, Telling A, AmitI, Lajoie BR, Sabo PJ, Dorschner MO, Sandstrom R, Bernstein B, Bender MA, Groudine M,Gnirke A, Stamatoyannopoulos J, Mirny LA, Lander ES, Dekker J (2009) Comprehensivemapping of long-range interactions reveals folding principles of the human genome.Science 326(5950):289–293
95. Fullwood MJ, Liu MH, Pan YF, Liu J, Xu H, Mohamed YB, Orlov YL, Velkov S, Ho A,Mei PH, Chew EGY, Huang PYH, Welboren W-J, Han Y, Ooi HS, Ariyaratne PN, VegaVB, Luo Y, Tan PY, Choy PY, Wansa KDSA, Zhao B, Lim KS, Leow SC, Yow JS, JosephR, Li H, Desai KV, Thomsen JS, Lee YK, Karuturi RKM, Herve T, Bourque G,Stunnenberg HG, Ruan X, Cacheux-Rataboul V, Sung W-K, Liu ET, Wei C-L, Cheung E,Ruan Y (2009) An oestrogen-receptor-alpha-bound human chromatin interactome. Nature462(7269):58–64
96. Deal RB, Henikoff JG, Henikoff S (2010) Genome-wide kinetics of nucleosome turnoverdetermined by metabolic labeling of histones. Science 328(5982):1161–1164
97. Schones DE, Cui K, Cuddapah S, Roh T-Y, Barski A, Wang Z, Wei G, Zhao K (2008)Dynamic regulation of nucleosome positioning in the human genome. Cell 132(5):887–898
98. Knight JC, Keating BJ, Rockett KA, Kwiatkowski DP (2003) In vivo characterization ofregulatory polymorphisms by allele-specific quantification of RNA polymerase loading. NatGenet 33(4):469–475
99. McDaniell R, Lee B-K, Song L, Liu Z, Boyle AP, Erdos MR, Scott LJ, Morken MA, KuceraKS, Battenhouse A, Keefe D, Collins FS, Willard HF, Lieb JD, Furey TS, Crawford GE,Iyer VR, Birney E (2010) Heritable individual-specific and allele-specific chromatinsignatures in humans. Science 328(5975):235–239
100. Kasowski M, Grubert F, Heffelfinger C, Hariharan M, Asabere A, Waszak SM, Habegger L,Rozowsky J, Shi M, Urban AE, Hong M-Y, Karczewski KJ, Huber W, Weissman SM,Gerstein MB, Korbel JO, Snyder M (2010) Variation in transcription factor binding amonghumans. Science 328(5975):232–235
101. Jeong J, Li L, Liu Y, Nephew KP, Huang TH-M, Shen C (2010) An empirical Bayes modelfor gene expression and methylation profiles in antiestrogen resistant breast cancer. BMCMed Genomics 3:55
102. Loss LA, Sadanandam A, Durinck S, Nautiyal S, Flaucher D, Carlton VEH, Moorhead M,Lu Y, Gray JW, Faham M, Spellman P, Parvin B (2010) Prediction of epigeneticallyregulated genes in breast cancer cell lines. BMC Bioinf 11:305
103. Krzywinski M, Schein J, Birol I, Connors J, Gascoyne R, Horsman D, Jones SJ, Marra MA(2009) Circos: an information aesthetic for comparative genomics. Genome Res19(9):1639–1645
104. Brazma A, Parkinson H, Sarkans U, Shojatalab M, Vilo J, Abeygunawardena N, HollowayE, Kapushesky M, Kemmeren P, Lara GG, Oezcimen A, Rocca-Serra P, Sansone S-A(2003) ArrayExpress–a public repository for microarray gene expression data at the EBI.Nucleic Acids Res 31(1):68–71
105. Kapushesky M, Emam I, Holloway E, Kurnosov P, Zorin A, Malone J, Rustici G, WilliamsE, Parkinson H, Brazma A (2010) Gene expression atlas at the European BioinformaticsInstitute. Nucleic Acids Res 38(Database issue):D690–D698
106. Barrett T, Troup DB, Wilhite SE, Ledoux P, Evangelista C, Kim LF, Tomashevsky M,Marshall KA, Phillippy KH, Sherman PM, Muertter RN, Holko M, Ayanbule O, Yefanov A,Soboleva A (2011) NCBI GEO: archive for functional genomics data sets–10 years on.Nucleic Acids Res 39(Database issue):D1005–D1010
107. Brazma A, Hingamp P, Quackenbush J, Sherlock G, Spellman P, Stoeckert C, Aach J,Ansorge W, Ball CA, Causton HC, Gaasterland T, Glenisson P, Holstege FC, Kim IF,Markowitz V, Matese JC, Parkinson H, Robinson A, Sarkans U, Schulze-Kremer S, StewartJ, Taylor R, Vilo J, Vingron M (2001) Minimum information about a microarray experiment(MIAME)-toward standards for microarray data. Nat Genet 29(4):365–371
34 S. Ballereau et al.
108. Malone JH, Oliver B (2011) Microarrays, deep sequencing and the true measure of thetranscriptome. BMC Biol 9:34
109. Posekany A, Felsenstein K, Sykacek P (2011) Biological assessment of robust noise modelsin microarray data analysis. Bioinformatics 27(6):807–814
110. Kadota K, Shimizu K (2011) Evaluating methods for ranking differentially expressed genesapplied to microarray quality control data. BMC Bioinf 12:227
111. Gibb EA, Vucic EA, Enfield KSS, Stewart GL, Lonergan KM, Kennett JY, Becker-SantosDD, MacAulay CE, Lam S, Brown CJ, Lam WL (2011) Human cancer long non-codingRNA transcriptomes. PLoS ONE 6(10):e25915
112. Mercer TR, Dinger ME, Mattick JS (2009) Long non-coding RNAs: insights into functions.Nat Rev Genet 10(3):155–159
113. Wang Z, Gerstein M, Snyder M (2009) RNA-Seq: a revolutionary tool for transcriptomics.Nat Rev Genet 10(1):57–63
114. Pickrell JK, Marioni JC, Pai AA, Degner JF, Engelhardt BE, Nkadori E, Veyrieras J-B,Stephens M, Gilad Y, Pritchard JK (2010) Understanding mechanisms underlying humangene expression variation with RNA sequencing. Nature 464(7289):768–772
115. Hansen KD, Wu Z, Irizarry RA, Leek JT (2011) Sequencing technology does not eliminatebiological variability. Nat Biotechnol 29(7):572–573
116. Mercer TR, Gerhardt DJ, Dinger ME, Crawford J, Trapnell C, Jeddeloh JA, Mattick JS,Rinn JL (2012) Targeted RNA sequencing reveals the deep complexity of the humantranscriptome. Nat Biotechnol 30(1):99–104
117. Raz T, Kapranov P, Lipson D, Letovsky S, Milos PM, Thompson JF (2011) Protocoldependence of sequencing-based gene expression measurements. PLoS ONE 6(5):e19287
118. Schwartz S, Oren R, Ast G (2011) Detection and removal of biases in the analysis of next-generation sequencing reads. PLoS ONE 6(1):e16685
119. Brazma A (2009) Minimum information about a microarray experiment (MIAME)–successes, failures, challenges. Sci World J 9:420–423
120. Bullard JH, Purdom E, Hansen KD, Dudoit S (2010) Evaluation of statistical methods fornormalization and differential expression in mRNA-Seq experiments. BMC Bioinf 11:94
121. Geiss GK, Bumgarner RE, Birditt B, Dahl T, Dowidar N, Dunaway DL, Fell HP, Ferree S,George RD, Grogan T, James JJ, Maysuria M, Mitton JD, Oliveri P, Osborn JL, Peng T,Ratcliffe AL, Webster PJ, Davidson EH, Hood L, Dimitrov K (2008) Direct multiplexedmeasurement of gene expression with color-coded probe pairs. Nat Biotech 26(3):317–325
122. Chi SW, Zang JB, Mele A, Darnell RB (2009) Argonaute HITS-CLIP decodes microRNA-mRNA interaction maps. Nature 460(7254):479–486
123. Jacquier A (2009) The complex eukaryotic transcriptome: unexpected pervasivetranscription and novel small RNAs. Nat Rev Genet 10(12):833–844
124. Licatalosi DD, Darnell RB (2010) RNA processing and its regulation: global insights intobiological networks. Nat Rev Genet 11(1):75–87
125. Vogel C, Marcotte EM (2012) Insights into the regulation of protein abundance fromproteomic and transcriptomic analyses. Nat Rev Genet 13(4):227–232
126. Beck M, Schmidt A, Malmstroem A, Claassen M, Ori A, Szymborska A, Herzog F, RinnerO, Ellenberg J, Aebersold R (2011) The quantitative proteome of a human cell line. MolSyst Biol 7:549, ISSN:1744-4292. doi:10.1038/msb.2011.82, URL:http://www.ncbi.nlm.nih.gov/pubmed/22068332. Accessed 15 Apr 2012
127. DeLuca DS, Marina O, Ray S, Zhang GL, Wu CJ, Brusic V (2011) Data processing andanalysis for protein microarrays. Methods Mol Biol 723:337–347
128. Ray S, Reddy PJ, Choudhary S, Raghu D, Srivastava S (2011) Emerging nanoproteomicsapproaches for disease biomarker detection: a current perspective. J Proteomics74(12):2660–2681
129. Domon B, Aebersold R (2010) Options and considerations when selecting a quantitativeproteomics strategy. Nat Biotech 28(7):710–721
130. Mallick P, Kuster B (2010) Proteomics: a pragmatic perspective. Nat Biotechnol28(7):695–709
1 Functional Genomics, Proteomics, Metabolomics and Bioinformatics 35
131. Kito K, Ito T (2008) Mass spectrometry-based approaches toward absolute quantitativeproteomics. Curr Genomics 9(4):263–274
132. Diao L, Clarke CH, Coombes KR, Hamilton SR, Roth J, Mao L, Czerniak B, Baggerly KA,Morris JS, Fung ET, Bast RC Jr (2011) Reproducibility of SELDI spectra across time andlaboratories. Cancer Inform 10:45–64
133. Matthiesen R, Azevedo L, Amorim A, Carvalho AS (2011) Discussion on common dataanalysis strategies used in MS-based proteomics. Proteomics 11(4):604–619
134. Käll L, Vitek O (2011) Computational mass spectrometry-based proteomics. PLoS ComputBiol 7(12):e1002277
135. Taylor CF (2006) Minimum reporting requirements for proteomics: a MIAPE primer.Proteomics 6(Suppl 2):39–44
136. Jacob RJ (2010) Bioinformatics for LC-MS/MS-based proteomics. Methods Mol Biol658:61–91
137. Walhout AJ, Vidal M (2001) Protein interaction maps for model organisms. Nat Rev MolCell Biol 2(1):55–62
138. Rinner O, Mueller LN, Hubalek M, Muller M, Gstaiger M, Aebersold R (2007) Anintegrated mass spectrometric and computational framework for the analysis of proteininteraction networks. Nat Biotech 25(3):345–352
139. Hutchins JRA, Toyoda Y, Hegemann B, Poser I, Hériché J-K, Sykora MM, Augsburg M,Hudecz O, Buschhorn BA, Bulkescher J, Conrad C, Comartin D, Schleiffer A, Sarov M,Pozniakovsky A, Slabicki MM, Schloissnig S, Steinmacher I, Leuschner M, Ssykor A,Lawo S, Pelletier L, Stark H, Nasmyth K, Ellenberg J, Durbin R, Buchholz F, Mechtler K,Hyman AA, Peters J-M (2010) Systematic analysis of human protein complexes identifieschromosome segregation proteins. Science 328(5978):593–599
140. Deutsch EW, Shteynberg D, Lam H, Sun Z, Eng JK, Carapito C, von Haller PD, Tasman N,Mendoza L, Farrah T, Aebersold R (2010) Trans-Proteomic Pipeline supports and improvesanalysis of electron transfer dissociation data sets. Proteomics 10(6):1190–1195
141. Uhlen M, Oksvold P, Fagerberg L, Lundberg E, Jonasson K, Forsberg M, Zwahlen M,Kampf C, Wester K, Hober S, Wernerus H, Bjorling L, Ponten F (2010) Towards aknowledge-based human protein atlas. Nat Biotech 28(12):1248–1250
142. Lane L, Argoud-Puy G, Britan A, Cusin I, Duek PD, Evalet O, Gateau A, Gaudet P, GleizesA, Masselot A, Zwahlen C, Bairoch A (2012) neXtProt: a knowledge platform for humanproteins. Nucleic Acids Res 40(Database issue):D76–D83
143. Psychogios N, Hau DD, Peng J, Guo AC, Mandal R, Bouatra S, Sinelnikov I,Krishnamurthy R, Eisner R, Gautam B, Young N, Xia J, Knox C, Dong E, Huang P,Hollander Z, Pedersen TL, Smith SR, Bamforth F, Greiner R, McManus B, Newman JW,Goodfriend T, Wishart DS (2011) The human serum metabolome. PLoS ONE 6(2):e16957
144. Beckonert O, Keun HC, Ebbels TMD, Bundy J, Holmes E, Lindon JC, Nicholson JK (2007)Metabolic profiling, metabolomic and metabonomic procedures for NMR spectroscopy ofurine, plasma, serum and tissue extracts. Nat Protoc 2(11):2692–2703
145. Lee DY, Bowen BP, Northen TR (2010) Mass spectrometry-based metabolomics, analysisof metabolite-protein interactions, and imaging. Biotechniques 49(2):557–565
146. Kanehisa M, Goto S (2000) KEGG: kyoto encyclopedia of genes and genomes. NucleicAcids Res 28(1):27–30
147. Kotera M, Hirakawa M, Tokimatsu T, Goto S, Kanehisa M (2012) The KEGG databasesand tools facilitating omics analysis: latest developments involving human diseases andpharmaceuticals. Methods Mol Biol 802:19–39
148. Sinha TK, Khatib-Shahidi S, Yankeelov TE, Mapara K, Ehtesham M, Cornett DS, DawantBM, Caprioli RM, Gore JC (2008) Integrating spatially resolved three-dimensional MALDIIMS with in vivo magnetic resonance imaging. Nat Meth 5(1):57–59
149. Griffin JL, Steinbeck C (2010) ‘So what have data standards ever done for us? The viewfrom metabolomics. Genome Med 2(6):38
36 S. Ballereau et al.
150. Sugimoto M, Kawakami M, Robert M, Soga T, Tomita M (2012) Bioinformatics tools formass spectroscopy-based metabolomic data processing and analysis. Curr Bioinf7(1):96–108
151. Carroll AJ, Badger MR, Harvey Millar A (2010) The metabolomeexpress project: enablingweb-based processing, analysis and transparent dissemination of GC/MS metabolomicsdatasets. BMC Bioinf 11:376
152. Kastenmüller G, Römisch-Margl W, Wägele B, Altmaier E, Suhre K (2011) metaP-server: aweb-based metabolomics data analysis tool. J Biomed Biotechnol 2011
153. Gika HG, Theodoridis GA, Earll M, Snyder RW, Sumner SJ, Wilson ID (2010) Does themass spectrometer define the marker? A comparison of global metabolite profiling datagenerated simultaneously via UPLC-MS on two different mass spectrometers. Anal Chem82(19):8226–8234
154. Wishart DS, Knox C, Guo AC, Eisner R, Young N, Gautam B, Hau DD, Psychogios N,Dong E, Bouatra S, Mandal R, Sinelnikov I, Xia J, Jia L, Cruz JA, Lim E, Sobsey CA,Shrivastava S, Huang P, Liu P, Fang L, Peng J, Fradette R, Cheng D, Tzur D, Clements M,Lewis A, De Souza A, Zuniga A, Dawe M, Xiong Y, Clive D, Greiner R, Nazyrova A,Shaykhutdinov R, Li L, Vogel HJ, Forsythe I (2009) HMDB: a knowledgebase for thehuman metabolome. Nucleic Acids Res 37(Database issue):D603–D610
155. Yu Z, Kastenmüller G, He Y, Belcredi P, Möller G, Prehn C, Mendes J, Wahl S, Roemisch-Margl W, Ceglarek U, Polonikov A, Dahmen N, Prokisch H, Xie L, Li Y, Wichmann H-E,Peters A, Kronenberg F, Suhre K, Adamski J, Illig T, Wang-Sattler R (2011) Differencesbetween human plasma and serum metabolite profiles. PLoS ONE 6(7):e21230
156. Wymann MP, Schneiter R (2008) Lipid signalling in disease. Nat Rev Mol Cell Biol9(2):162–176
157. van Meer G, Voelker DR, Feigenson GW (2008) Membrane lipids: where they are and howthey behave. Nat Rev Mol Cell Biol 9(2):112–124
158. Shevchenko A. Simons K (2010) Lipidomics: coming to grips with lipid diversity. Nat RevMol Cell Biol 11(8):593–598
159. Quehenberger O, Armando AM, Brown AH, Milne SB, Myers DS, Merrill AH,Bandyopadhyay S, Jones KN, Kelly S, Shaner RL, Sullards CM, Wang E, Murphy RC,Barkley RM, Leiker TJ, Raetz CRH, Guan Z, Laird GM, Six DA, Russell DW, McDonaldJG, Subramaniam S, Fahy E, Dennis EA (2010) Lipidomics reveals a remarkable diversityof lipids in human plasma. J Lipid Res 51(11):3299–3305
160. Han X, Gross RW (2003) Global analyses of cellular lipidomes directly from crude extractsof biological samples by ESI mass spectrometry: a bridge to lipidomics. J Lipid Res44(6):1071–1079
161. Jung HR, Sylvänne T, Koistinen KM, Tarasov K, Kauhanen D, Ekroos K (2011) Highthroughput quantitative molecular lipidomics. Biochim Biophys Acta 1811(11):925–934
162. Chaurand P, Cornett DS, Angel PM, Caprioli RM (2011) From whole-body sections downto cellular level, multiscale imaging of phospholipids by MALDI mass spectrometry. MolCell Proteomics 10(2):O110.004259
163. Nordström A, O’Maille G, Qin C, Siuzdak G (2006) Nonlinear data alignment for UPLC-MS and HPLC-MS based metabolomics: quantitative analysis of endogenous andexogenous metabolites in human serum. Anal Chem 78(10):3289–3295
164. Pluskal T, Castillo S, Villar-Briones A, Oresic M (2010) MZmine 2: modular framework forprocessing, visualizing, and analyzing mass spectrometry-based molecular profile data.BMC Bioinf 11:395
165. Orešic M (2011) Informatics and computational strategies for the study of lipids. BiochimBiophys Acta 1811(11):991–999
166. Schmelzer K, Fahy E, Subramaniam S, Dennis EA (2007) The lipid maps initiative inlipidomics. Meth Enzymol 432:171–183
167. Dennis EA, Deems RA, Harkewicz R, Quehenberger O, Brown HA, Milne SB, Myers DS,Glass CK, Hardiman G, Reichart D, Merrill AH Jr, Sullards MC, Wang E, Murphy RC,Raetz CRH, Garrett TA, Guan Z, Ryan AC, Russell DW, McDonald JG, Thompson BM,
1 Functional Genomics, Proteomics, Metabolomics and Bioinformatics 37
Shaw WA, Sud M, Zhao Y, Gupta S, Maurya MR, Fahy E, Subramaniam S (2010) A mousemacrophage lipidome. J Biol Chem 285(51):39976–39985
168. Niemelä PS, Castillo S, Sysi-Aho M, Oresic M (2009) Bioinformatics and computationalmethods for lipidomics. J Chromatogr B Analyt Technol Biomed Life Sci877(26):2855–2862
169. Gehlenborg N, O’Donoghue SI, Baliga NS, Goesmann A, Hibbs MA, Kitano H, KohlbacherO, Neuweger H, Schneider R, Tenenbaum D, Gavin A-C (2010) Visualization of omics datafor systems biology. Nat Methods 7(3 Suppl):S56–S68
170. Hawkins RD, Hon GC, Ren B (2010) Next-generation genomics: an integrative approach.Nat Rev Genet 11(7):476–486
171. Glaab E (2011) Analysing functional genomics data using novel ensemble,consensus anddata fusion techniques. University of Nottingham, Nottingham
172. Irizarry RA, Hobbs B, Collin F, Beazer-Barclay YD, Antonellis KJ, Scherf U, Speed TP(2003) Exploration, normalization, and summaries of high density oligonucleotide arrayprobe level data. Biostatistics 4(2):249–264
173. Mueller LN, Brusniak M-Y, Mani DR, Aebersold R (2008) An assessment of softwaresolutions for the analysis of mass spectrometry based quantitative proteomics data.J Proteome Res 7(1):51–61
174. Castillo S, Gopalacharyulu P, Yetukuri L, Orešic M (2011) Algorithms and tools for thepreprocessing of LC–MS metabolomics data. Chemometrics Intell Lab Syst 108(1):23–32
175. Tritchler D, Parkhomenko E, Beyene J (2009) Filtering genes for cluster and networkanalysis. BMC Bioinf 10:193
176. Madeira SC, Oliveira AL (2004) Biclustering algorithms for biological data analysis: asurvey. IEEE/ACM Trans Comput Biol Bioinf 1(1):24–45
177. Medina I, Carbonell J, Pulido L, Madeira SC, Goetz S, Conesa A, Tarraga J, Pascual-Montano A, Nogales-Cadenas R, Santoyo J, Garcia F, Marba M, Montaner D, Dopazo J(2010) Babelomics: an integrative platform for the analysis of transcriptomics, proteomicsand genomic data with advanced functional profiling. Nucleic Acids Res 38(WebServer):W210–W213
178. Vallon-Christersson J, Nordborg N, Svensson M, Häkkinen J (2009) BASE—2ndgeneration software for microarray data management and analysis. BMC Bioinf 10:330
179. Naegle KM, Welsch RE, Yaffe MB, White FM, Lauffenburger DA (2011) MCAM: multipleclustering analysis methodology for deriving hypotheses and insights from high-throughputproteomic datasets. PLoS Comput Biol 7(7):e1002119
180. Chaiboonchoe A, Samarasinghe S, Kulasiri D (2009) Machine learning for childhood acutelymphoblastic leukaemia gene expression data analysis: a review. Curr Bioinform5(2):118–133
181. Schummer M, Green A, Beatty JD, Karlan BY, Karlan S, Gross J, Thornton S, McIntosh M,Urban N (2010) Comparison of breast cancer to healthy control tissue discovers novelmarkers with potential for prognosis and early detection. PLoS ONE 5(2):e9122
182. Moore WC, Meyers DA, Wenzel SE, Teague WG, Li H, Li X, D’Agostino R, Castro M,Curran-Everett D, Fitzpatrick AM, Gaston B, Jarjour NN, Sorkness R, Calhoun WJ, ChungKF, Comhair SAA, Dweik RA, Israel E, Peters SP, Busse WW, Erzurum SC, Bleecker ER(2010) Identification of asthma phenotypes using cluster analysis in the severe asthmaresearch program. Am J Respir Crit Care Med 181(4):315–323
183. Just J, Gouvis-Echraghi R, Rouve S, Wanin S, Moreau D, Annesi Maesano I (2012) Twonovel severe asthma phenotypes identified during childhood using a clustering approach.Official Journal of the European Society for Clinical Respiratory Physiology, The EuropeanRespiratory Journal
184. Bjornsdottir US, Holgate ST, Reddy PS, Hill AA, McKee CM, Csimma CI, Weaver AA,Legault HM, Small CG, Ramsey RC, Ellis DK, Burke CM, Thompson PJ, Howarth PH,Wardlaw AJ, Bardin PG, Bernstein DI, Irving LB, Chupp GL, Bensch GW, Bensch GW,Stahlman JE, Karetzky M, Baker JW, Miller RL, Goodman BH, Raible DG, Goldman SJ,Miller DK, Ryan JL, Dorner AJ, Immermann FW, O’Toole M (2011) Pathways activated
38 S. Ballereau et al.
during human asthma exacerbation as revealed by gene expression patterns in blood. PLoSONE 6(7):e21902
185. Bellman R (1961) Adaptive control processes. Princeston University Press, Princeston186. Kusiak A (2001) Feature transformation methods in data mining. IEEE Trans Electron
Packaging Manuf 24(3):214–221187. Guyon I, Elisseeff A (2003) An introduction to variable and feature selection. JMachine
Learn Res 3:1157–1182188. Dy JG (2008) Unsupervised feature selection. Comput Methods Feature Sel 2008:19–39189. Tsamardinos I, Aliferis CF (2003) Towards principled feature selection: relevancy, filters
and wrappers. In: Proceedings of the 9th international workshop on artificial intelligenceand statistics, 2003
190. Bozinov D, Rahnenführer J (2002) Unsupervised technique for robust target separation andanalysis of DNA microarray spots through adaptive pixel clustering. Bioinformatics18(5):747
191. Katzer M, Kummert F, Sagerer G (2003) Methods for automatic microarray imagesegmentation. IEEE Transactions on NanoBiosci 2(4):202–214
192. Bolstad BM, Irizarry RA, Astrand M, Speed TP (2003) A comparison of normalizationmethods for high density oligonucleotide array data based on variance and bias.Bioinformatics 19(2):185–193
193. Li C, Wong WH (2001) Model-based analysis of oligonucleotide arrays: expression indexcomputation and outlier detection. Proc Natl Acad Sci 98(1):31
194. Lazaridis EN, Sinibaldi D, Bloom G, Mane S, Jove R (2002) A simple method to improveprobe set estimates from oligonucleotide arrays. Math Biosci 176(1):53–58
195. Shakya K, Ruskin H, Kerr G, Crane M, Becker J (2010) Comparison of microarraypreprocessing methods. In: Arabina HR (ed) Advances in computational biology. Springer,New York, pp 139–147
196. Katajamaa M, Oresic M (2007) Data processing for mass spectrometry-basedmetabolomics. J Chromatogr A 1158(1–2):318–328
197. Hastings CA, Norton SM, Roy S (2002) New algorithms for processing and peak detectionin liquid chromatography/mass spectrometry data. Rapid Commun Mass Spectrom16(5):462–467
198. Smith CA, Elizabeth J, O’Maille G, Abagyan R, Siuzdak G (2006) XCMS: processing massspectrometry data for metabolite profiling using nonlinear peak alignment, matching, andidentification. Anal Chem 78(3):779–787
199. Bantscheff M, Schirle M, Sweetman G, Rick J, Kuster B (2007) Quantitative massspectrometry in proteomics: a critical review. Anal Bioanal Chem 389(4):1017–1031
200. Hu Q, Pan W, An S, Ma P, Wei J (2010) An efficient gene selection technique for cancerrecognition based on neighborhood mutual information. International Journal of MachineLearning and, Cybernetics, pp 1–12
201. Hall MA (1999) Correlation-based feature selection for machine learning. The University ofWaikato, Waikato
202. Wu Y, Zhang A (2004) Feature selection for classifying high-dimensional numerical data.In: Proceedings of the 2004 IEEE computer society conference on computer vision andpattern recognition (CVPR 2004), vol. 2, p 251
203. Xing EP, Jordan MI, Karp RM, et al. (2001) Feature selection for high-dimensionalgenomic microarray data. In: Machine learning-international workshop then conference,2001, pp 601–608
204. Li L, Pedersen LG, Darden TA, Weinberg CR (2002) Computational analysis of leukemiamicroarray expression data using the GA/KNN method. In: Methods of microarray dataanalysis: papers from CAMDA’00, pp 81–95
205. Blanco R, Larrañaga P, Inza I, Sierra B (2001) Selection of highly accurate genes for cancerclassification by estimation of distribution algorithms. In: Workshop of Bayesian models inmedicine. AIME 2001, pp 29–34
1 Functional Genomics, Proteomics, Metabolomics and Bioinformatics 39
206. Inza I, Sierra B, Blanco R, Larrañaga P (2002) Gene selection by sequential search wrapperapproaches in microarray cancer class prediction. J Intell Fuzzy Syst 12(1):25–33
207. Liu J, Iba H, Ishizuka M (2001) Selecting informative genes with parallel genetic algorithmsin tissue classification. Genome Inform 12:14–23
208. Chen YW, Lin CJ (2006) Combining SVMs with various feature selection strategies. In:Isabella G, Andre E (eds) Feature extraction, Springer, Berlin, pp 315–324
209. Bolón-Canedo V, Sánchez-Maroño N, Alonso-Betanzos A (2011) An ensemble of filtersand classifiers for microarray data classification. Pattern Recogn 45:531
210. Sun M, Xiong M (2003) A mathematical programming approach for gene selection andtissue classification. Bioinformatics 19(10):1243
211. Subramani P, Sahu R, Verma S (2006) Feature selection using haar wavelet powerspectrum. BMC Bioinf 7(1):432
212. Koller D, Friedman N (2009) Probabilistic graphical models principles and techniques. MITpress, Cambridge
213. Lee JA, Verleysen M (2007) Nonlinear dimensionality reduction, 1st edn. Springer, Berlin214. Maaten LVD, Hinton G (2008) Visualizing data using t-SNE. J Machine Learn Res
9(2579–2605):2579–2605215. Hastie T, Tibshirani R, Friedman J (2009) The elements of statistical learning. Data mining,
inference, and prediction. Springer, New York216. Ben-Hur A, Ong CS, Sonnenburg S, Schölkopf B, Rätsch G (2008) Support vector machines
and kernels for computational biology. PLoS Comput Biol 4(10):e1000173217. Breiman L, Schapire E (2001) Random forests. Machine Learn 45:5–32218. Chapelle O, Schölkopf B, Zien A (2010) Semi-supervised learning. MIT Press, Cambridge219. Koski T (2002) Hidden Markov models of bioinformatics, 1st ed. Springer, Berlin220. Bonneau R, Facciotti MT, Reiss DJ, Schmid AK, Pan M, Kaur A, Thorsson V, Shannon P,
Johnson MH, Bare JC, Longabaugh W, Vuthoori M, Whitehead K, Madar A, Suzuki L,Mori T, Chang D-E, DiRuggiero J, Johnson CH, Hood L, Baliga NS (2007) A predictivemodel for transcriptional control of physiology in a free living cell. Cell 131(7):1354–1365
221. Krallinger M, Valencia A, Hirschman L (2008) Linking genes to literature: text mininginformation extraction, and retrieval applications for biology. Genome Biol 9(Suppl 2):S8
222. Tsuruoka Y, Miwa M, Hamamoto K, Tsujii J, Ananiadou S (2011) Discovering andvisualizing indirect associations between biomedical concepts. Bioinformatics 27(13):i111
223. Roche M, Prince V (2010) A web-mining approach to disambiguate biomedical acronymexpansions. Informatica (Slovenia) 34(2):243–253
224. Hakenberg J, Plake C, Royer L, Strobelt H, Leser U, Schroeder M (2008) Genenormalization and interaction with context and sentence motifs. Genome Biol 9(Suppl2):S14
225. Seringhaus MB, Cayting PD, Gerstein MB (2008) Uncovering trends in gene naming.Genome Biol 9(1):401
226. Leaman R, Gonzalez G (2008) BANNER: an executable survey of advances in biomedicalnamed entity recognition. In: Pacific symposium on biocomputing, pp 652–663
227. Marsh E, Perzanowski D (1998) MUC-7 evaluation of IE technology: overview of results.In: Proceedings of the 7th message understanding conference (MUC-7)
228. Hoffmann R, Krallinger M, Andres E, Tamames J, Blaschke C, Valencia A (2005) Textmining for metabolic pathways, signaling cascades, and protein networks. Sci STKE2005(283):e21
229. Kim J-D, Ohta T, Pyysalo S, Kano Y, Tsujii J (2011) Extracting bio-molecular events fromliterature—the BioNLP’09 shared task. Comput Intell 27(4):513–540
230. Björne J, Ginter F, Pyysalo S, Tsujii J, Salakoski T (2010) Complex event extraction atPubMed scale. Bioinformatics [ISMB] 26(12):382–390
231. McClosky D, Surdeanu M, Manning CD (2011) Event extraction as dependency parsing. In:ACL 2011, pp 1626–1635
232. Riedel S, McCallum A (2011) Fast and robust joint models for biomedical event extraction.In: EMNLP 2011, pp 1–12
40 S. Ballereau et al.
233. Hoffmann R, Valencia A (2005) Implementing the iHOP concept for navigation ofbiomedical literature. In: ECCB/JBI 2005, p 258
234. Plake C, Schiemann T, Pankalla M, Hakenberg J, Leser U (2006) ALIBABA: PubMed as agraph. Bioinformatics 22(19):2444–2445
235. Hermjakob H, Montecchi-Palazzi L, Lewington C, Mudali S, Kerrien S, Orchard S, VingronM, Roechert B, Roepstorff P, Valencia A et al (2004) IntAct: an open source molecularinteraction database. Nucleic Acids Res 32(suppl 1):D452–D455
236. Fleuren WWM, Verhoeven S, Frijters R, Heupers B, Polman J, , van Schaik R, de Vlieg J,Alkema W (2011) CoPub update: CoPub 5.0 a text mining system to answer biologicalquestions. Nucleic Acids Res 39(Web Server):W450–W454
237. Ramanan VK, Shen L, Moore JH, Saykin AJ (2012) Pathway analysis of genomic data:concepts, methods and prospects for future development. Trends Genet 28(7): 323–332,ISSN:0168-9525. doi:10.1016/j.tig.2012.03.004
238. Dennis G Jr, Sherman BT, Hosack DA, Yang J, Gao W, Lane HC, Lempicki RA (2003)DAVID: database for annotation. Visualization, and integrated discovery. Genome Biol4(5):P3
239. Alibés A, Yankilevich P et al (2007) IDconverter and IDClight: conversion and annotationof gene and protein IDs’. BMC Bioinf 8(1):9
240. Durinck S, Spellman PT, Birney E, Huber W (2009) Mapping identifiers for the integrationof genomic datasets with the R/bioconductor package biomart. Nat Protoc 4(8):1184–1191
241. Subramanian A, Tamayo P, Mootha VK, Mukherjee S, Ebert BL, Gillette MA, Paulovich A,Pomeroy SL, Golub TR, Lander ES et al (2005) Gene set enrichment analysis: a knowledge-based approach for interpreting genome-wide expression profiles. Proc Natl Acad Sci USA102(43):15545
242. Kim SY, Volsky D (2005) PAGE: parametric analysis of gene set enrichment. BMC Bioinf6(1):144
243. Luo W, Friedman M, Shedden K, Hankenson K, Woolf P (2009) GAGE: generallyapplicable gene set enrichment for pathway analysis. BMC Bioinf 10(1):161
244. Bauer S, Grossmann S, Vingron M, Robinson PN (2008) Ontologizer 2.0—amultifunctional tool for GO term enrichment analysis and data exploration.Bioinformatics 24(14):1650
245. Carmona-Saez P, Chagoyen M, Tirado F, Carazo JM, Pascual-Montano A (2007)GENECODIS: a web-based tool for finding significant concurrent annotations in genelists. Genome Biol 8(1):R3
246. Schuster S, Hlgetag C (1994) On elementary flux modes in biochemical reaction systems atsteady state. J Biol Syst 2(2):165–182
247. Schilling CH, Letscher D, Palsson BO (2000) Theory for the systemic definition ofmetabolic pathways and their use in interpreting metabolic function from a pathway-oriented perspective. J Theoretical Biol 203(3):229–248
248. Kelley R, Ideker T (2005) Systematic interpretation of genetic interactions using proteinnetworks. Nat Biotechnol 23(5):561–566
249. Ma X, Tarone AM, Li W (2008) Mapping genetically compensatory pathways fromsynthetic lethal interactions in yeast. PLoS ONE 3(4):e1922
250. Elbers CC, van Eijk KR, Franke L, Mulder F, van der Schouw YT, Wijmenga C, Onland-Moret NC (2009) Using genome-wide pathway analysis to unravel the etiology of complexdiseases. Genet Epidemiol 33(5):419–431
251. Markowitz SD, Bertagnolli MM (2009) Molecular basis of colorectal cancer. N Engl J Med361(25):2449–2460
252. Xu X, Cao L, Chen X (2008) Elementary flux mode analysis for optimized ethanol yield inanaerobic fermentation of glucose with Saccharomyces cerevisiae. Chin J Chem Eng16(1):135–142
253. Cerami E, Demir E, Schultz N, Taylor BS, Sander C (2010) Automated network analysisidentifies core pathways in glioblastoma. PLoS ONE 5(2):e8918
1 Functional Genomics, Proteomics, Metabolomics and Bioinformatics 41