Embed Size (px)
Citation preview

1
CHAPTER 1
INTRODUCTION
1.1 General introduction
This thesis embraces six chapters. An overview for the subject and objectives of
the work is presented in Chapter 1. The literature review, background and current status
of mcl-PHA, PVC and plasticized PVC are presented in Chapter 2 of the thesis. Chapter
3 deals with the experimental methods and analytical techniques undertaken in order to
structurally, thermally and physically characterize the biopolyester, degradation products
(oligoesters), PVC and plasticized PVC compounds. The results and discussions for the
thermal degradation of mcl-PHA are presented in Chapter 4. Chapter 5 discusses the
results from the assessment of PHA and its oligoesters as environmentally friendly and
renewable plasticizers for PVC. Chapter 6 gives the overall summaries of the research
done and suggestions for future works.
1.2 Biodegradable polymer
Petroleum based plastics are considered one of the biggest environmental
pollutants, and this had led to intense research activities to develop alternative materials
which are more environmentally friendly. The alternative materials should be
biodegradable into harmless intermediates and end products. Poly(3-hydroxyalkanoates)
(PHA) are natural polyesters which are good alternative materials to petrochemical-
based polymers as PHA are non-toxic, biodegradable, biocompatible and possess
thermoplastic properties similar to conventional plastics. They are synthesized by several
groups of microorganisms, usually in response to unfavorable growth conditions e.g.
when an essential nutrient such as nitrogen, phosphorus, oxygen or sulfur becomes
limiting (Dawes & Senior, 1973; Du & Yu, 2002; Annuar et al., 2008). PHA are
accumulated as water-insoluble granules in the cells, and they are believed to be the

2
carbon and energy storage compounds (Dawes & Senior, 1973; Wang & Bakken, 1998;
Madison & Huisman, 1999). In these microbial polyesters, the carboxyl group of one
monomer forms an ester bond with the hydroxyl group of the neighboring monomer.
Each monomer contains the chiral carbon and has the (R) stereochemical configuration,
thus PHA are optically active and isotactic (Lee et al., 1999; Ballistreri et al., 2001).
Medium-chain-length poly(3-hydroxyalkanoates) (mcl-PHA) are microbial
polyesters comprised of six to fourteen carbon-chain-length 3-hydroxyalkanoic acids as
monomers. This class of PHA is primarily produced by the fluorescent pseudomonades
belonging to rRNA homology group I (Huisman et al., 1989; Timm & Steinbuchel, 1990;
Kiska & Gilligan, 1999) and the monomeric composition of mcl-PHA is closely related
to the structure of the carbon substrate that was fed to the bacteria (Brandl et al., 1988;
Lageveen et al., 1988; Huisman et al., 1989; Eggink et al., 1992). Mcl-PHA have low
crystallinity and glass transition temperature and are elastic, less stiff and brittle
(Huisman et al., 1989; Preusting et al., 1990; Timm & Steinbuchel, 1990; Madison &
Huisman, 1999). Different combinations of monomers yield polymers with a wide
variety of chemical and physical properties, and thus broaden the potential applications
of mcl-PHA.
1.3 Thermodegradation of mcl-PHA
Low molecular weight oligoesters can be produced from medium-chain-length
polyhydroxyalkanoates by thermal degradation process. These oligomeric
hydroxyalkanoic acids possess favorable end groups, and such fragments could be served
as precursors or intermediates for the synthesis of biodegradable polymeric materials and
optically active compounds. For example, they could be used as biodegradable carriers
for medicines, drugs and hormones, biodegradable additives, coatings and plasticizers, or
being used as blending materials in a co-polymerization process (Reeve et al., 1993; Hiki

3
et al., 2000; Nguyen et al., 2002). As the thermal degradation process takes place in the
absence of organic solvents and other chemicals, this justified the method of producing
low molecular weight oligoesters as green chemistry.
In this study, mcl-PHA were produced by Pseudomonas putida PGA1 via
fermentation using oleic acid (OA) and saponified palm kernel oil (SPKO) as carbon
substrate. Subsequently, they were thermally degraded at moderately high temperatures.
The changes in thermal, physical and structural properties of the control and thermally-
degraded oligoesters were analyzed and the chain scission mechanism of the biopolymer
during thermal degradation process was proposed.
1.4 Mcl-PHA and its oligoesters as natural based plasticizer for PVC
Poly(vinyl chloride) (PVC) constitutes one of the largest global consumption of
commodity plastics, approximately 16 million tonnes per annum (PVC Information
Council, 1995). PVC compounds in the plasticized form are widely used in the industry
for various flexible applications such as packaging, toys, medical and household
products. Conventional petrochemical-based plasticizers for PVC, particularly phthalates,
e.g. diethylhexyl phthalates (DEHP) and diisonyl phthalates (DINP) are the most
commonly used PVC plasticizers (Marcilla et al., 2004). Nevertheless, these phthalate-
based plasticizers are found to be detrimental to the environment and human health
(Third National Report on Human Exposure to Environmental Chemicals, 2005), as they
might migrate out from the PVC compound during end-use applications, into the human
body or the environment. In 1995, European Community had banned for the usage of
phthalates in the applications intended for children usage under the age of 3 years
("Official Journal of the European Communities", 1999). Recently in the 2011 Taiwan
Food Scandal, DEHP and DINP were reported as the carcinogenic plasticizer agents,
implicated in human infertility problem and developmental problems in children as these

4
plasticizers mimic human hormones and could served as the endocrine disruptors
(National Toxicology Program, 1982).
Recent research activities have been carried out to seek for alternative greener
materials which impart low toxicity, total or partial biodegradability and are economical
and technical viable to substitute those conventional petrochemical-based plasticizers.
Mcl-PHA which have the biodegradable, biocompatible and non-toxic properties fulfill
all the desired traits of an alternative eco-friendly plasticizer material and have the great
potential to function as compatible plasticizer for PVC.
In this work, the OA and SPKO-derived mcl-PHA and their low molecular
weight oligoesters were mixed with PVC at the compositions of 2.5 and 5 parts per
hundred parts (phr) of PVC through solution blending. The lightly plasticized PVC films
were solvent casted and characterized to study the PVC-PHA interactions,
microstructures, polymer film morphology, miscibility between the two polymers,
viscoelastic properties, thermal behavior, thermal stability and thermo-kinetic parameters
of the PVC/PHA polymer blends.
5
1.5 Objectives of study:
1.5.1 In the study of thermodegradation of mcl-PHA
1. To produce mcl-PHA via bacterial fermentation using oleic acid and saponified
palm kernel oil as renewable carbon feedstock;
2. To produce oligomeric materials with useful end groups and desirable structures
via thermal degradation of mcl-PHA;
3. To characterize the degradation products and study the possible chain scission
mechanism during the thermal degradation of the mcl-PHA.
1.5.2 In the study of assessment of biopolyesters and oligoesters as natural based
plasticizer for PVC
1. To investigate the ability of mcl-PHA and their low molecular weight oligoesters
to act as a compatible, biodegradable plasticizer for poly(vinyl chloride) (PVC);
2. To structurally, thermally and mechanically characterize the lightly plasticized
PVC films;
3. To investigate the thermal stability and thermo-kinetics parameters of the
polymer blends.
6
CHAPTER 2
LITERATURE REVIEW
2.1. Poly(3-hroydroxyalkanoates) as biodegradable polymer
Since the non-degradable plastics were introduced in our daily lives, the
postconsumer plastic waste disposal has created a pressing global environmental issue.
Nevertheless, researchers from all over the world are aware of the intricate link between
xenobiotics, petrochemicals and sustainable environment, and intense research activities
have been carried out to develop alternative biopolymers from renewable resources such
as plant oils, fatty acids and organic wastes.
Poly(3-hydroxyalkanoates) (PHA) are a new generation of polymers which are
completely biodegradable, biocompatible, non-toxic and can be synthesized from natural
renewable resources (Tan et al., 1997; Braunegg et al., 1998; Reddy et al., 2003; Annuar
et al., 2007). PHA have the potential to replace the conventional plastic due to their
structural diversity and the close similarites to petrochemical thermoplastics, and the
ability to degrade in the environment. These biopolymers can be broken down into
carbon dioxide, water and biomass in aerobic conditions or to methanol in anaerobic
conditions such as soil, sea, stagnant water or sewage water (Lee, 1996). Besides being
biodegradable, PHA are recyclable just like the conventional petrochemical plastics.
PHA are biological polyesters of various hydroxyl acids which are synthesized by
a wide range of microorganisms. PHA are accumulated in response to nutrient limiting
environment e.g. when an essential nutrient such as nitrogen, phosphorous, oxygen or
sulfur is in deficiency (Dawes & Senior, 1973; Doi, 1995; Du & Yu, 2002; Verlinden et
al., 2007; Annuar et al., 2008), but in the presence of excess carbon source. These
polyesters serve as carbon and energy reserve materials which are osmotically inert and
occurred as hydrophobic intracellular granules in the cell (Dawes & Senior, 1973; Tan et

7
al., 1997; Wang & Bakken, 1998; Madison & Huisman, 1999). Fig. 2.1 shows the
electron microscopy of a bacterium harbouring PHA granules.
Fig. 2.1 Electron microscopy of Pseudomonas aeruginosa harbouring PHA granules
(Rehm, 2003)
By polymerizing water-soluble intermediates into hydrophobic compounds, the
cell does not undergo osmotic shock and at the same time leakage of these valuable
compounds out of the cell is prevented (Madison & Huisman, 1999). Under starved
conditions, these natural products can be catabolized by the cell itself and subsequently
consumed by enzymatic depolymerization reactions (Dawes & Senior, 1973; Sudesh et
al., 2000).
Since PHA are produced by naturally occurring microorganisms, this makes these
polyesters a natural material and thus they can be degraded upon subsequent exposure to
soil, compost, sewage, river or marine sediment (Lee, 1996; Ho et al., 2002; Lim et al.,
2005). The biodegradation of PHA is dependent upon a number of factors such as the
microbial activity of the environment and the exposed surface area. In addition,

8
temperature, pH, molecular weight are also important factors (Boopathy, 2000; Reddy et
al., 2003) for the degradation process. Biodegradation starts when microorganisms begin
growing on the surface of the polymers and secrete enzymes like PHA hydrolases and
PHA depolymerases that break down the polymer into its monomer building blocks,
called hydroxyacids. The hydroxyacids are then taken up by the microorganisms and
used as carbon sources for growth. Their biodegradability property distinguishes PHA
from petroleum-based polymers. Despite their biodegradability the PHA have good
resistance to water and moisture vapor, and thus they are stable during use and under
normal storage conditions (Reddy et al., 2003; Ojumu et al., 2004).
2.1.1 Chemical structure of PHA
Poly(3-hydroxyalkanoates) are natural polyesters which composed of repeating
units of 3-hydroxyalkanoic acids, each of which carries an aliphatic alkyl side chain (R)
as shown in Fig. 2.2.
Fig. 2.2 Chemical structure of PHA (Madison & Huisman, 1999)
Carbon, oxygen and hydrogen are the main components in the structure formation
of PHA. In these polymers, the carboxyl group of one monomer forms an ester bond with
the hydroxyl group of the adjacent monomer (Madison & Huisman, 1999). Each
monomer contains the chiral carbon atom and has the (R) stereochemical configuration
on the hydroxyl-substituted carbon, thus PHA are optically active and isotactic (Lee et al.,

9
1999; Ballistreri et al., 2001; Nguyen et al., 2002). To date, many different PHA that
have been identified are primarily linear, head-to-tail polyesters composed of 2- to 6-
hydroxy fatty acid monomers. They can have various monomer compositions and
functional groups in the side chains, depending on the carbon substrate that is fed to the
bacteria (Brandl et al., 1988; Lageveen et al., 1988; Huisman et al., 1989; Eggink et al.,
1992) as well as the metabolic pathways involved in the utilization of the carbon source
(Steinbüchel & Valentin, 1995). Variation in the length and composition of the side
chains is the basis for the diversity of the PHA polymer family (Madison & Huisman,
1999). The alkyl side chain is not necessarily saturated (Abe et al., 1990); unsaturated
(Tan et al., 1997), halogenated (Kim et al., 1992), aromatic (Fritzsche et al., 1990b), and
branched alkyl (Fritzsche et al., 1990a) groups have been reported in PHA as side chain
as well. These polymer structures can be manipulated to have wide range of chemical
and mechanical properties through the modifications of their monomers and the side
chains. For instance, reactive substituents in the polymer side chains can be modified
chemically by cross-linking of unsaturated bonds (de Koning et al., 1994).
2.1.2 Medium-chain-length poly(3-hydroxyalkanoates)
PHA are classified into two broad groups based on their monomer chain length,
that is, short-chain-length poly(3-hydroxyalkanoates) (scl-PHA) and medium-chain-
length poly(3-hydroxyalkanoates) (mcl-PHA). Scl-PHA contain monomers with the
carbon atom length ranging from 3 to 5. Typical examples of the scl-PHA are poly(3-
hydroxybutyrate) (PHB) and poly(3-hydroxybutyrate-co-valerate) (PHBV). A well
known producer of scl-PHA is Alcaligenus eutrophus. For mcl-PHA, they are comprised
of monomers having 6 to 14 carbon atoms. Medium-chain-length PHA are always
heteropolymers, having monomers like 3-hydroxyhexanoate (3HHx), 3-
hydroxyoctanoate (3HO), 3-hydroxydecanoate (3HD), 3-hydroxydodecanoate (3HDD),

10
3-hydroxytetradecanoate (3HTD). Fig. 2.3 shows the structure of the mcl-PHA with
various types of monomers.
Fig. 2.3 Medium-chain-length PHA with different types of monomers
(Chen et al., 2009)
This class of PHA is primarily synthesized by the fluorescent pseudomonads
belonging to rRNA homology group I (Huisman et al., 1989; Timm & Steinbuchel, 1990;
Kiska & Gilligan, 1999). For example, Pseudomonas putida, Pseudomonas oleovorans
and Pseudomonas aeruginosa are well-known mcl-PHA producers which have the
ability to use variety of carbon substrates such as alkanes, alkanols, medium- and long-
chain fatty acids for growing and accumulating PHA (Brandl et al., 1988; Lageveen et al.,
1988; Khanna & Srivastava, 2005; Chen et al., 2009).
2.1.3 Physical properties of mcl-PHA
The family of PHA exhibits a wide variety of physical and mechanical properties,
ranging from hard crystalline to elastic, depending on the monomer compositions of the
polymer. Compared to scl-PHA, mcl-PHA have lower level of crystallinity and lower

11
glass transition temperature. They are more elastic, less stiff and less brittle (Huisman et
al., 1989; Preusting et al., 1990; Timm & Steinbuchel, 1990; Madison & Huisman, 1999).
Hence mcl-PHA are easier to process and have potentially wider applications. For
instance, mcl-PHA being the amorphous elastomers, have low melting temperature, low
tensile strength and high elongation to break and they can be used as biodegradable
rubber after cross-linking (Khanna & Srivastava, 2005).
Medium-chain-length poly(3-hydroxyalkanoates) are partially crystalline
polymers in which within the bacterial cell they exist as amorphous and water-soluble
inclusions (Barnard & Sanders, 1989; Sudesh et al., 2000). Upon disruption of cells
where the polymers are extracted, rapid crystallization occurs. These bacterially
produced polymers have sufficiently high molecular weight in the range of 50,000 to
300,000 Dalton, making them to possess polymer characteristics that are similar to
conventional plastics (Marchessault, 1996).
2.1.4 Thermal degradation and stability of mcl-PHA
Most high molecular weight organic polymers tend to decompose when heated to
moderate high temperature. The thermal instability of these polymers can be due to the
fact that degradation of a polymer to a low-molecular-weight compound is favored at
high temperature by entropy effects. In practice, depolymerization is often favored at
high temperature and this is the main reason for the thermal instability of most polymers
at high temperature. When processing biopolymers, it is important to know the point of
thermal degradation for the polymer.
The thermal stability of mcl-PHA is one of the important factors to determine the
processing and application of the biopolymer. Owing to their thermal instability and high
susceptibility to a rapid thermal degradation at processing temperature, broad application

12
of mcl-PHA as a thermoplastic is sterically hindered currently. Therefore the thermal
properties and thermal stability of mcl-PHA have to be well studied in order to develop
desired modifications for the application of the biopolymer as a thermoplastic. There are
many thermoanalytical techniques to study the thermo-kinetics of mcl-PHA thermal
degradation and one of them could be dynamic thermogravimetric analysis (TGA),
which is a fast and simple method to evaluate the kinetic parameters of thermal
degradation.
PHA can be thermally depolymerized at moderate high temperature into chiral
oligomers with favorable end groups. These oligomeric hydroxyl acids could serve as
precursors for the synthesis of optically active compounds, which are useful as
biodegradable carriers for medicines, drugs and hormones (Williams, 1996),
biodegradable coatings, additives and plasticizers (van der Walle et al., 2001), or being
used as blending materials in a polymerization process (Hiki et al., 2000; Chen & Wu,
2005). However, decomposition of these biopolymers at moderate high temperature is a
complex phenomenon as the observed decomposition products could be formed as a
result of primary, secondary or a mixture of both decomposition processes (Liggat et al.,
1999). For PHA which consists of a long chain of carbon, hydrogen and oxygen atoms,
the ester skeletal bonds could be served as the weak points for the hydrolytic chain
cleavage during the thermal polyester breakdown process. Consequently, a complex
spectrum of (R)-hydroxyacid fragments would be generated and these fragments are not
easy to characterize in detail. Moreover abnormal structure such as terminal unsaturated
fragments could be formed during subsequent decomposition which could affect the
product functionalities, especially for the usage particularly in relation to the hydroxyl
and carboxyl end groups. Therefore the degradation products of mcl-PHA generated at
certain temperature range need to be studied before drastic decomposition of the
biopolymer occurs.

13
2.1.5 Industrial and medical applications of mcl-PHA
Medium-chain-length polyhydroxyalkanoates (mcl-PHA) have wide range of
applications owing to the unique properties of biodegradability, biocompatibility,
isotacticity, stereochemistry, light weight, water and air proof. They are natural
thermoplastic polyesters, and hence the majority of their applications are as replacements
for petrochemical based polymers in the use of packaging applications.
The mcl-PHA
which possess low melting temperature and high elasticity could be used in the paint
formulations and biodegradable coatings (Gagnon et al., 1992; van der Walle et al.,
2001).
Polyhydroxyalkanoates can serve as chiral precursors for the chemical synthesis
of optically active compounds (Oeding and Schlegel, 1973), which are particularly useful
as biodegradable carriers for long-term dosage of drugs, medicines, hormones,
insecticides and herbicides. Besides that, PHA promise to be new source of small
molecules as they can be depolymerized into chiral monomers and oligomers. The
monomers can be converted to commercially attractive molecules such as -hydroxy acids,
-alkenoic acids, -hydroxyalkanols, -acyllactones, -amino acids, and -hydroxyacid esters
(Williams, 1996). Hydroxyacid esters are currently receiving attention because of the
potential applications as biodegradable
solvents. These monomeric, dimeric, trimeric and
oligomeric hydroxyacids can be prepared through various methods. For example, by
degradation of high molecular weight PHA via thermal degradation (Morikawa &
Marchessault, 1981; Grassie et al., 1984; Kunioka & Doi, 1990; Lehrle & Williams,
1994; Williams, 1996) or acid-catalyzed methanolysis (Reeve et al., 1993) or acid/base
hydrolysis (Lauzier et al., 1994).
Thermal degradation of PHA is a promising method to produce low molecular
weight hydroxyacids as no chemical and organic solvents are used in the process and
hence this method of producing hydroxyacids can be considered as green chemistry.

14
These hydroxyl acids possess functional end groups e.g. hydroxyl and carboxyl group,
and such fragments could be used as desirable building blocks or intermediates for
synthesis of useful biomaterials. For example, they could be polymerized together with
other monomers in the synthesis of biodegradable coatings, additives and plasticizers, as
well as the blending materials in a co-polymerization process (Morikawa & Marchessault,
1981; Reeve et al., 1993; Hiki et al., 2000; Nguyen et al., 2002).
2.1.6 Carbon feedstock for PHA production
Carbon substrate is one of the determining factors in optimizing the production,
structural and material properties of PHA (Huijberts & Eggink, 1996; Salehizadeh &
Van Loosdrecht, 2004). Besides that, using economical substrates such as plant oil and
fatty acids to produce PHA can effectively reduce the cost of production of these
biopolymers. Palm oil and palm kernel oil are inexpensive and renewable carbon
resources which are readily available in Malaysia. These oils are good growth substrates
for PHA producing bacteria and the high energy content of vegetable oil results in high
biomass yields.
2.1.6.1 Oleic acid as a sole carbon source
Oleic acid is a monounsaturated omega-9 fatty acid (cis-Δ9-octadecenoic acid,
C18:1) which is derived from vegetable oil, e.g. palm oil. In local palm oil industry, fatty
acid substrates could be produced at lower cost than a single purified fatty acid as the oil
palm (Elaeis guineensis Jacq.) produce more oil per hectare than any other oil-bearing
plant (Tan et al., 1997). In addition, using this long chain fatty acid which contains the
unsaturated functional group as carbon source can result in synthesis of PHA with
unsaturated monomers. This makes the PHA amenable to modifications as the
unsaturated double bonds in the PHA side chain provide sites for chemical modifications
(Madison & Huisman, 1999).

15
2.1.6.2 Palm kernel oil as a sole carbon source
Palm kernel oil is the extract from the nut kernel of the palm oil fruit. It is a
highly saturated vegetable oil with almost 82% of major fatty acids are saturated, thus it
exist as semi-solid at room temperature. The oil consists of a mixture of C6 to C18:2 fatty
acids with lauric acid (C12) as the main composition. Table 2.1 shows the fatty acid
compositions in palm kernel oil (Elson, 1992). Furthermore, palm kernel oil which is the
side product from palm oil industry is an economical carbon source for PHA production.
As it is non-edible oil, production of PHA using palm kernel oil will also reduce the
competition of oil in food industry.
Table 2.1 Fatty acid compositions in palm kernel oil (Adapted from Elson, 1992).
Fatty acids Percentage (%)
C6:0 (Caproic acid)
C8:0 (Caprylic acid)
C10:0 (Capric acid)
C12:0 (Lauric acid)
C14:0 (Myristic acid)
C16:0 (Palmitic acid)
C18:0 (Stearic acid)
C18:1 (Oleic acid)
C18:2 (Linoleic acid)
C20:0 (Arachinoic acid)
0.2
3.0
4.0
48.0
16.0
8.0
3.0
15.4
2.4
0.1
2.2 Poly(vinyl chloride)
Poly(vinyl chloride) (PVC) is an amorphous thermoplastic. Due to the presence
of chlorine atoms, it has a significant polarity within the polymer molecule structure.

16
PVC usually comes in the form of white powder with countless micro voids present
within the particles, each with the average particle size of 100 to 150 μm and apparent
density of 0.4 to 0.7 g cm-1
(PVC Fact Book, 2008).
Generally, additives such as plasticizers, thermal stabilizers, lubricants, pigments
and fillers are added to the PVC resin during processing to improve the overall
performance of the product. Plasticizers in particular are added to change the moldability
of PVC and provide desired flexibility to the end products. By adding in different levels
of plasticizers, the PVC products could be formulated with physical properties ranging
from rigid to flexible. PVC without any plasticizers are called rigid PVC, while PVC that
include plasticizers are called flexible PVC (PVC Fact Book, 2008).
2.2.1 Chemical structure
PVC has a unique chemical structure with the chlorine atoms bound to the carbon
atoms. Fig. 2.4 illustrates the general structure of a PVC monomer unit. The letter ‘n’
showing the repeating unit of vinyl chloride monomer and α-hydrogen is the hydrogen
that attached to the electropositive carbon atom.
Fig. 2.4 General structure of PVC monomer
Generally, PVC can exhibit three basic structures. Firstly, isotactic in which all
the chlorine (Cl) atoms are on the same side of a polymer chain. Secondly, atactic in

17
which Cl atoms are randomly distributed within the chain. The last one is syndiotactic
where the Cl atoms are regularly distributed on both sides of the chain in an alternate
arrangement.
Chlorine is one of the most active halogen in the world. Owing to the
electronegative property of chlorine atom, formation of hydrogen bonds within and
between PVC polymer chains is theoretically possible. This is shown in Fig. 2.5:
Fig. 2.5 (a) Formation of intramolecular hydrogen bonding within polymer and
(b) Formation of intermolecular hydrogen bonding between polymers (Wypych, 2008)
The C-Cl bond has a pronounced electron-withdrawing effect upon other bonds
joined with the same carbon atom. Thus the hydrogen atom bonded to the carbon atom
may become sufficiently acidic to act as an electron-acceptor atom in a hydrogen bond.
Nevertheless when the proton-donor and proton acceptor atoms are collinear, as
illustrated in structure (a), the most stable forms of hydrogen bond would occur.
Structure (b) suggests the formation of an intermolecular hydrogen bond between two
PVC chains (Wypych, 2008).

18
2.2.2 PVC Morphology
PVC, being a polymer with low degree of crystallinity, cannot be studied
effectively by the conventional methods applied to crystalline materials. It is difficult to
interpret the morphology of PVC due to the fact that the morphology is a not a parameter,
but a desciptive feature which is influenced by variables like chain length or molecular
weight of polymer, configuration and conformation, chain folds and chain thickness,
entanglements, crystalline structure and grain morphology (Wypych, 2008).
The morphology of PVC is generally determined by the size of the molecule,
structure or chain segments, chain spatial distribution and interaction, as well as structure
of particles. The particle size distribution of suspension PVC is difficult to determine due
to the very complex morphology. For PVC grains obtained from suspension
polymerization, it exhibits a hierarchical morphology (Diego et. al., 2004) which is
illustrated in the schematic diagram in Fig. 2.6.
Fig. 2.6 Model of PVC grain (Adapted from Saeki, 2000)

19
As depicted in the figure, the PVC grains are composed of agglomerates trapped
inside a skin made of hydrosoluble polymers. The agglomerates are made up of primary
particles. Inside the primary particles, domains are visible (Diego et al., 2004). The
details of the morphology of PVC are discussed in Table 2.2.
Table 2.2 Nomenclature for the morphology of suspension PVC grain (Adapted from
(Allsopp, 1981; Geil, 1977; Saeki, 2000)
Structural
element
Size range,
μm
Description
Skin - Formed on the surface of the PVC grain. Inside of the
skin layer are the subparticles and interconnected pores
Grain 50-250 Visible constituent of free flowing powder
Agglomerate 1-10 Formed by coalescence of primary particles
Primary particle 0.5-1 Grown droplet of monomer
Domain 0.1-0.2 Formed inside of primary particle
Microdomain 0.01-0.02 Smallest visible particle made out of approximately
50 chains
2.2.3 Molecular weight
A measure of the molecular weight of PVC is classified by K-value and it is
based upon a viscosity measurement of a PVC solution. According to (Lorenz, 1971), the
term “K-value” refers to the empirical molecular weight value of the polymer. For PVC,
the K-value can range from 55 to 80.
Low K-value implies low molecular weight and high K-value implies high
molecular weight (Dynisco Corporate, 2011). Medium molecular weight PVC ranging
from K-value of 60 to 67 is more widely used compared to low molecular weight and
high molecular weight PVC. Low molecular weight PVC grades are easy to process but

20
have inferior properties. They are usually used for rigid products. High molecular weight
PVC grades are difficult to process but they have outstanding properties. Normally they
are used to obtain special properties like matt surface finish or better toughness
(Plastermart, October 2010). Table 2.3 illustrates the relationship between viscosity
index, K-value and general applications for different types of PVC.

21
Table 2.3 Relationship between the viscosity index, K-value and general uses for different types of PVC
(Adapted from “PVC SPEC”, quality standard: GB/T 5761-93)
Type of PVC
Viscosity index 136-144 143-136 135-127 126-119 118-107 106-96 95-87 86-73
K-value 77-75 77-73 72-71 70-69 68-66 65-63 62-60 59-55
Applications High grade
insulator
Insulator,
film, soft
plastic
Insulator,
agricultural
film and
tube, normal
tube,
leatheroid,
plastic shoes,
normal soft
plastic
Industrial
and
agricultural
film, tube,
leatheroid,
high
strength
pipe
Film, pipe,
building
material
Disc,
transparent
hard film,
PVC board,
welding rod
Bottle,
transparent
hard film,
PVC pipe
connector
Bottle,
transparent
hard film,
PVC pipe
connector

22
2.2.4 Thermal degradation of PVC
Thermal degradation of poly(vinyl chloride) is a complex phenomenon. Two
different types of degradation products are usually generated as a result of two stage
degradation processes (Radhakrishnan Nair et al., 2007). They are volatile small
molecules which are readily separated as well as the larger molecules that represent the
remaining fragments of the chain. These fragments are particularly formed upon the
internal rearrangements of the polymer backbone, i.e. the intramolecular cyclisation of
the conjugated sequences (Wypych, 1985).
A two-stage degradation pattern as shown in Fig. 2.7 is commonly seen in the
PVC decomposition, where the first stage of degradation is due to the
dehydrochlorination process, whereby elimination of HCl occurred leaving behind the
unsaturated hydrocarbons. Second degradation is attributed to the cracking of –C=C–
hydrocarbon backbone, yielding volatile saturated and unsaturated, aliphatic and
aromatic hydrocarbons, where benzene and toluene will be the major products in high
yield (Wypych, 1985; Marcilla & Beltran, 1996a).

23
Fig. 2.7 Two-stage degradation occurred during thermal decomposition of PVC. Stage 1:
Hydrogen chloride elimination of PVC and Stage 2: Decomposition of unsaturated
hydrocarbon structures followed by intramolecular cyclization of conjugated sequences
and benzene formation (Adapted from Wypych, 1985)
2.2.5 Chemical and physical properties of PVC
PVC has the molecular structure with polar chlorine atoms bound to the carbon
atoms. Since the polymer is comprised of single bonds of carbon atoms with little change
in molecular structure, PVC is chemically stable and has excellent chemical resistance. It
is resistant to acid, alkali and almost all inorganic chemicals. Besides that, PVC is a polar

24
polymer and so its mechanical properties are excellent owing to the strong interaction
among the molecular chains (PVC Fact Book, 2008).
PVC has inherently superior fire retarding properties due to its chlorine content.
When PVC products are burned, hydrogen chloride gas resulting from thermal cracking
stops the continuous combustion reaction and prevents further burning by warding off
the PVC product surface from oxygen (PVC Fact Book, 2008).
Having the values of solubility parameter lie in the range of 9.48 to 9.7 (Mark,
1971), a wide range of organic solvents could be used to dissolve PVC. As such,
tetrahydrofuran, cyclohexane, ethyl methyl ketone were found to be best solvents for
PVC (Koleske, 1969), while halogenated hydrocarbons, ketones and aromatic
compounds could also be used as solvents for PVC.
In overall, PVC shows excellent chemical and physical properties such as
chemical stability, fire retarding properties, toughness, durability and resistance to
oxidative reaction.
2.2.6 General applications
PVC constitutes one of the largest globally consumed commodity plastics,
approximately 16 million tonnes per annum (PVC Information Council, March 1995).
About 70% of world consumption of PVC is for the usage like pipes, fittings, siding,
windows, fencing etc. It could be seen that the current global demand for PVC majority
originates from building construction, civil engineering applications and automotive
production, as to replace for the traditional construction materials like wood and metals
(Ebner, November 2008). Since the electrical insulating properties of PVC are excellent,
PVC is also widely used as telecommunications and electrical cables, vehicles and

25
household electrical appliances, cable coverings and protecting tubes for power,
insulating tapes and switch boxes (PVC Fact Book, 2008).
According to the technical articles and reports on plastic industry reported by
Plastermart in year 2010, PVC demand is high for the usage of piping and fittings in
telecommunications and natural gas in industrialized countries. Meanwhile, the demand
of PVC pipe is high in developing world, especially for infrastructure for drinking water,
sewage and drainage. Fig. 2.8 shows the projected growth for regional PVC consumption
from year 1990 to 2025.
Fig. 2.8 Regional growth of PVC consumption from year 1990 and
projected up to year 2025
PVC possesses rigidity property in nature and has the applications as profiles,
house siding, hollow parts, etc in the rigid form. A lot of researches have been done on
improving the properties of PVC for various applications as the high Tg of rigid PVC will

26
still restrict the wide application as a result of heat deformation temperatures. Some
additives were added to the PVC, resulting in new compositions that are commonly
known as PVC compounds. Plasticized PVC compounds are the most well-known PVC
compounds which present high flexibility and are commonly used in films and
packaging, toys and household products, medical products such as intravenous drip lines
and transfusion bags, food wear and clothing, flooring and wall-covering, etc.
2.2.7 Miscibility of PVC
PVC is well known for its efficiency to form miscible systems with various
structurally different polymers (Varughese et al., 1988). This is due to the presence of α-
hydrogen in PVC which is capable of forming hydrogen bonding (Lieberman, 1962).
Many of the polymers exhibiting miscibility with PVC have as a common entity, the
carbonyl unit. The interaction allowed a large variation in the composition of the
polymer with retention of miscibility with PVC.
Hydrogen bonding-type interactions have been proposed as the key to achieving
miscibility in many of the blends cited in this treatise. PVC which is a hydrogen bond
donor exhibits miscibility with many polymers containing H+ acceptor units. The
chlorine atoms of the PVC appear to render the polymer capable of interaction with
polyesters, possibly by enabling hydrogen bonding to occur with the carbonyl groups of
the polyester.
2.3 Polymer miscibility
Polymer miscibility delineates the polymer-polymer blends with behavior
expected to be similar to a single-phase system. It not necessary connotes the ideal
molecular mixing, but at least the level of molecular mixing is adequate to yield
macroscopic properties, for example, showing a single-phase behavior (Olabisi et al.,
27
1979). Usually a polymer blend with a single glass transition will be classified as
miscible. For the investigator interested in macroscopic properties useful in industrial
application, the miscibility connotes the homogeneity of the polymer mixture in which
the dimension is similar to the segmental size responsible for the major glass transition.
Mechanical compatibility with a property compromise between the components is also
assured for a miscible polymer mixture. Under microscopic inspection, a miscible
polymer blend consists of a single phase; on a molecular level, two different polymer
molecules may intermingle with each other (Olabisi et al., 1979).
Usually polar polymers are compatible only with some polar plasticizers.
Interaction of polar polymers and plasticizers depends on the presence and arrangement
of groups capable of donor-acceptor interactions. Polar plasticizers with a proton-
acceptor character (esters, ethers, and nitriles) are most useful for polymers having
average polarity (e.g., PVC, PC and butadiene-acrylonitrile copolymers).
Similar polarity, hydrogen-bonding and other strong intermolecular attraction are
the optimum requirements for two polymers to be completely miscible. Types of
molecular forces of attraction normally found in miscible polymer system are random
dipole-induced dipole, dipole-induced dipole and hydrogen bonding. It should be noted
that intermolecular forces contributed by hydrogen bonding are stronger than the dipole-
dipole forces.
For random dipole-induced dipole, this type of interaction is possible between
any two molecules regardless of the structure, because the only requirement is the
ground-state oscillation of charge in the molecule (Scott, 1949; Hinshelwood, 1951;
Olabisi et al., 1979). The result of such oscillation is a temporary dipole moment, which
immediately induces dipoles in all other neighboring molecules. These dipoles can then
interact. Polarizability, the susceptibility of a molecule to charge separation, is the key

28
parameter in this type of interaction. Halogen substitution and unsaturation tend to
increase polarizability. If one component of the polymer system has a permanent dipole
moment, it will induce a dipole in neighboring symmetrical molecules, leading to an
interaction which is called dipole-induced dipole.
The prerequisites for a hydrogen bond of significant strength are as following:
firstly, a hydrogen atom must be covalently bound to an electron-withdrawing atom;
secondly, a structure with donatable electrons as the acceptor must locate at about 180°
with respect to the first bond. This geometric consideration is quite important as the
energy falling off rapidly with angle. In fact, hydrogen bonding is perhaps responsible
for more miscible system than any other types of interactions. For example, the large
number of miscible system in which PVC is a component can probably be ascribed to the
donating character of the Cl-C-H groups in an interacting situation with polyester as
shown in Fig. 2.9.
CH2 C O
O
H
C
Cl
CH2
n
Fig. 2.9 Hydrogen bonding between the hydrogen acceptor of carbonyl group and
hydrogen donator of C-Cl-H group
The hydrogen bond involves the establishment of electron-containing molecular
orbitals but the proton is not transfer. If the proton is transferred, an organic salt is
formed and the interaction is classified as acid-base.

29
Burrell (1955) and Lieberman (1962) have qualitatively classified the hydrogen
bonding capability of polar units. Hydrogen bonding interactions between polymer
chains provide necessary driving force for miscibility. This classification is illustrated in
Table 2.4. Many miscible polymer blends can be hypothetically rationalized to exhibit
miscibility based on the specific interactions chosen from this list.
Table 2.4 Classification of hydrogen bonding for various functional groups1
H-bond strength2
Electron donors
(H+ acceptors)
Electron acceptors
(H+ donors)
Electron/H+
donors-acceptors
Strong Pyridine - Water, alcohols,
carboxylic acids
Moderate Ketones, ethers,
esters
- -
Weak Nitriles, nitros,
olefins, aromatic
hydrocarbons
Halogenated
hydrocarbons
-
Unclassified Aldehydes, tertiary
amines, sulfones,
sulfoxides
- Primary and
secondary amines
1Adapted from Burrell, 1955; Lieberman, 1962 and Olabisi et al., 1979;
2Mixtures of
strong acceptors and donors may result in proton transfer, giving an acid-base
(electrostatic) interaction, rather than a resonance interaction.

30
2.3.1 Analytical techniques for determining polymer-polymer miscibility
2.3.1.1 Glass transition temperature
Glass transition temperature (Tg) is the most important property for a polymer
where the position of the Tg determines the physical state of the polymer, affecting the
properties like mechanical stiffness and toughness (Tobolsky, 1960). The Tg represents
the temperature at which the polymeric chains have a combination of energies from the
vibrational, translational and rotational forces, and these energies equal to the forces of
attractions in the polymer (Olabisi et al., 1979).
Below Tg, the polymer chains are locked into a network with motion of the small
units restricted to vibrational, rotational and translational movement. As temperature
approaches Tg, the configurational structures become more and more compact. At Tg, the
polymer segments are so densely packed that the internal mobility is negligible (Marcilla
& Beltran, 2004). Above Tg, the molecules have enough energy to move or rotate and the
translational movement of the entire polymer chain is possible. Besides that, dramatic
changes in modulus also occur at Tg.
The level of miscibility is qualitatively assessed by the features of the Tg behavior.
Existence of a single and distinctive, single and broad, shifted, or separate individual
transition for a polymer blend actually reveals the macroscopic property characteristics
of the blend. Broadening of transition will occur in the case of borderline miscibility.
With cases of limited miscibility, two separate transitions between those of the
components may result. In cases where strong specific interactions occur, the Tg may go
through a maximum as a function of the composition (Olabisi et al., 1979). Experimental
evidence of miscibility is often found when a single Tg is observed (Thomas & George,
1992) in between the Tgs of the individual components.
Nevertheless, Tg versus composition of a miscible polymer blend may not be a
predictable relationship, indeed it has many variations over the entire composition range,

31
i.e., the linear relationship, minimum and maximum deviations from linearity (Olabisi et
al., 1979). These three generalized curves pattern are depicted in Fig. 2.10. It should be
noted that if the Tg of the polymer blends is higher than the expected, the Tg of the
system could be probably elevated as a result of intermolecular interaction between the
electron donating and accepting functional groups on separate component of the blend
(Slark, 1997).
Fig. 2.10 Generalized behavior of Tg relationships for miscible polymer blends
Deviations from linearity in Tg-composition are quite common in miscible
polymer blends. In these cases, data may fit relationships, the Fox equation (Fox, 1956)
as shown in Equation (2.1) and the Gordon-Taylor equation (Gordon & Taylor, 1952) as
shown in Equation (2.2) are commonly adopted to describe the Tg relationship for
polymer-diluent blends, particularly plasticized PVC.

32
1/Tg = (Wa/ Tga ) + (Wb / Tgb ) (2.1)
Tg = (Wa Tg a + k (1-Wa) Tg b) / [Wa + k (1-Wa)] (2.2)
where Tga and Tgb represent the glass transitions of the individual polymer components;
Wa and Wb are the weight fractions of the blend; and k is the ratio of the thermal
expansion coefficients between the rubber and glass states of the component polymers.
Successful applications of the Fox expression to miscible blends include
poly(vinyl chloride)-butadiene/acrylonitrile copolymers (Zakrzewski, 1973) and
poly(vinyl chloride)-poly(ethylene/vinyl acetate/sulfur dioxide) (Hickman & Ikeda,
1973). Examples of miscible polymer blends in which the Tg-composition data are
satisfied by the Gordon-Taylor equation include freeze-dried poly(methyl methacrylate)-
poly(vinyl acetate) and styrene/butadiene copolymer with polybutadiene (Zlatkevich,
1973).
2.3.1.1.1 Calorimetric methods
Differential scanning calorimetry (DSC) is the most common technique used in
calorimetric method for determination of Tg. DSC measures the change in heat capacity
as a function of temperature. Under normal condition, the heat capacity will change
gradually with temperature. However it exhibits a drastic change when passing through
the glass transition (Olabisi et al., 1979), as the sample may undergo a change in physical
state. At this point, the polymer blend experiences enthalpies of relaxation which appear
as a positive deviation from the baseline (Sin, 1998).
Generally the Tg is defined as the onset or midpoint of the steep change in energy,
depending on certain circumstances. Fig. 2.11 shows the Tg of a sample which could be
exhibited as either the onset or midpoint of the steep change in energy. Usually

33
immiscible blends will exhibit distinctly two different Tg’s as opposed to a miscible
blend which has a single Tg.
Fig. 2.11 Tg , as exhibited as the onset or midpoint of the steep change in energy in the
DSC endothermic curve (Adapted from Mazurin, 2007)
2.3.1.1.2 Mechanical methods
Dynamic mechanical analysis (DMA) is another method commonly employed to
provide a direct quantitative measurement of modulus, phase transition, as a function of
temperatures occurring on the molecular scale (Olabisi et al., 1979; Sin, 1998). Data
obtained over a broad temperature range can be used to study the molecular response of a
polymer with other polymer.
The difference between homogeneous and heterogeneous blends is easily
detected in the mechanical loss and modulus-temperature data. The generalized data are
usually shear modulus (G’), loss modulus (G”) and mechanical loss (tan δ, defined as
G”/G’). For example, the shear modulus and mechanical loss for polymer-polymer
blends versus temperature are illustrated in Fig. 2.12, for behavior expected of two-phase
blend. This figure illustrates the highly phase-separated polymer blend, where the

34
transitional behavior of the individual constituents will be unchanged. On the other hand,
a miscible polymer with a single and unique transition is shown in Fig. 2.13.
Fig. 2.12 Generalized behavior of the dynamic mechanical properties of a two-phase
blend. Solid line: pure component A; Hyphenated line: mixture; Dashed line: pure
component B (Adapted from Perkin Elmer)
Fig. 2.13 Generalized behavior of the dynamic mechanical properties of a miscible blend.
Solid line: pure component A; Hyphenated line: mixture; Dashed line: pure component B
(Adapted from Perkin Elmer)

35
2.3.1.2 Microscopy
Direct visual validation of the presence of inhomogeneous phase has been used as
a preliminary indication of the degree of miscibility in a polymer-polymer system. Many
researchers have turned to microscopy to aid in determining not only the presence but the
connectivities of the phases (Olabisi et al., 1979). For instance, Fig. 2.14 and Fig. 2.15
show the scanning electron micrographs of the PVC and PVC-plasticizer. It could be
seen from the images in Fig. 2.14 for the presence of voids in PVC and Fig. 2.15 for the
swollen voids in which the PVC had interacted with the miscible plasticizer.
Fig. 2.14 SEM photograph of a PVC film (Adapted from Stephan et al., 2000)
Fig. 2.15 SEM photograph of a plasticized PVC film (Adapted from Stephan et al., 2000)

36
However, this technique is not suitable to be used to identify certain components
of the polymer blends (Fang, 2000).
2.3.1.3 Spectroscopic techniques
Spectroscopy can also be used to investigate the interaction of the polymer
molecule with its environment (Dyer, 1965). Polymer systems of high miscibility will
generate spectra showing strong deviations from an average of the spectra of the two
components in the blend. The degree of deviation as a function of miscibility cannot be
satisfactorily predicted but it can only verify the findings from other analysis for
demonstrating miscibility. Nevertheless this technique does provide valuable insight into
the nature of the specific interactions between the macromolecules (Olabisi et al., 1979).
2.4 Plasticizer for PVC
PVC is unique in its acceptance of plasticizers. The polarity and balance of
amorphous and crystalline regions in its molecular geometry provide compatibility for a
variety of plasticizer structures over relatively wide concentration and temperature
ranges (Graham, 1973). The most commonly used plasticizers for PVC are phthalates
(Tai, 1999), phosphate (Ferm & Shen, 1997), adipate (Audic et al., 2001) and polyester
(Eapen, 1994) based which give the PVC various desired flexibility.
Plasticizers were added to the PVC resin to allow movement between the PVC
molecules. They are interfused with polymers to increase flexibility, extensibility and
workability, making the polymer changed from a hard, glasslike solid to a flexible, tough
elastomer. They have a strong affinity for PVC polymers, but they do not undergo a
chemical reaction with PVC that causes bonding or crafting to the polymer (Krauskopf &
Godwin, 2005).

37
2.4.1 Types of plasticizers
Plasticizers could be classified as either monomeric or polymeric plasticizers. It
is preferred to categorize plasticizers on the basis of their chemical structure and
associated performance when employed in PVC. Three subgroups which are related to
the performance characteristics in PVC are classified as General Purpose Plasticizers
(GP), Performance Plasticizers (PP) and Specialty Plasticizers (SP).
2.4.1.1 General Purpose Plasticizers
These types of plasticizers provide desired flexibility to PVC at the lowest cost,
with an overall balance of optimum properties. They are dialkyl phthalates ranging from
diisoheptyl (DIHP) to diisodecyl (DIDP) (Krauskopf & Godwin, 2005).
2.4.1.2 Performance Plasticizers
These types of plasticizers contribute secondary performance properties desired
in flexible PVC beyond the GP type, but they impose higher costs than GP type. These
include specific phthalates and other types of plasticizers. For example, high molecular
weight plasticizers e.g. trimellitates and polymeric polyesters which were used in low
volatility performance (Krauskopf & Godwin, 2005).
2.4.1.3 Specialty Plasticizers
These types of plasticizers provide specialty characteristics and properties beyond
those designed for general purpose. Only a few phthalates meet these special
requirements. Examples of specialty plasticizers are polyester plasticizers which provide
low volatility and low diffusivity under fire conditions; epoxy plasticizers provide
adjuvant thermal stability to PVC; phosphates and halogenated plasticizers provide fire

38
retardant properties. These types of plasticizers impose even higher costs than PP grade
plasticizers (Krauskopf & Godwin, 2005).
2.4.2 Phthalate-based plasticizer
Phthalic acid esters, generally known as phthalate plasticizers are the
predominant type of PVC plasticizer produced in the world and accounted for almost 86%
of world consumption of plasticizers in year 2008 (Bizzari, 2009). Phthalate plasticizers
are colourless, odourless liquids which are produced by a simple chemical reaction
between alcohol and phthalic anhydride. The most commonly used phthalates are di-2-
ethyl hexyl phthalate (DEHP, also called dioctyl phthalate (DOP)), diisodecyl phthalate
(DIDP), diisononyl phthalate (DINP), benzyl butyl phthalate (BBP) and dibutyl phthalate
(DBP) (Plastermart, April 2008).
However, several issues regarding the use of phthalates were raised recently,
concerning about the effects of phthalates on the environment, human hormones and
reproductive system as well as their exposures to children via breast milk, toys and baby
care products. Based on a study in Norway, the bronchial obstruction in children was
directly related to the amount of plasticizer-releasing materials present in the indoor
environment (Plastermart, April 2008). According to Bornehag et al. (2005), plasticizers
that present in the dust are the main elements causing allergy, asthma and inducing
puberty among the children since they spent most of the time in indoor. There was a
study conducted in the same year showing that phthalates actually mimicked female
hormones and could serve as the endocrine disruptors in human body, resulting in
feminization of boys (Third National Report on Human Exposure to Environmental
Chemicals, July 2005).
39
Research showed that phthalates were shown to be responsible of cancer
proliferation in mice and rats (National Toxicology Program, 1982). These phthalate-
based plasticizers are found to be harmful to human beings when direct contact with skin
and tissues. They have the risk of leaching out from PVC compounds during end-used
applications, to the environment or human body. As a result of these concerns, the
European Commission in year 1999 temporarily banned the usage of six phthalates
(DEHP, DINP, DNOP, DIDP, DBP and BBP) in toys which were used in oral
applications designed for children under the age of three years and the permanent ban
was adapted in year 2005. Current regulation is more restrictive regarding their use in
application related to food contact, medical devices and toys (Shea, 2003). In July 2005,
the European Union permanently banned the use of DEHP, DBP and BBP in all
children's items and additionally banned the use of DINP, DIDP, and DNOP in children's
items which can be put in the mouth. This ban became effective on January 16, 2007.
Taiwan took a similar approach and banned the use of six phthalate plasticizers (DEHP,
DINP, DNOP, DIDP, DBP and BBP) after the ban in Europe. Furthermore, large
cosmetic companies in the USA such as L'Oreal and Revlon, have taken the action of
banning the use of DBP in their cosmetic products (Plastermart, April 2008).
2.4.3 Polymeric plasticizer
Polymeric plasticizers are regularly polyester-type, with molecular weights
ranging from 1,000 to 8,000 Mn. The greater is the plasticizer molecular weight, the
greater is its permanence property. Examples of polymeric plasticizers are polyethylene
copolymers and terpolymers which can range up to >500,000 Mn (Krauskopf & Godwin,
2005). Nevertheless aliphatic polyesters with molecular weight less than 4000 Mn have
also been used to improve the permanence of plasticized PVC for applications requiring
intermediate performance (Olabisi et al., 1979).

40
Polymeric plasticizers comprised of branched structures are more resistant to
migration loss than those linear structures. The polarity also influences the extraction
resistance of the polymeric plasticizers. For example, lower polarity plasticizers exhibit
better extraction resistance towards polar extraction fluids such as soapy water
(Krauskopf & Godwin, 2005).
Recent concern in the potential toxicity as a result of leaching of phthalate based
plasticizers into food and medical products has catalyzed interest in permanent high
molecular weight polymeric plasticizers for PVC.
2.4.4 Functions of plasticizers
The main functions performed by plasticizers are to make products more flexible,
affect packing density and free volume (Borek & Osoba, 1996), affect chain mobility
(Elicegui et al., 1997), lower glass transition and processing temperature (Vilics et al.,
1997; Biju, 2007), affect thermal degradation of PVC (Minsker, 1996; Marcilla &
Beltran, 1996b) and make products of varying rigidity.
Plasticizers work by embedding themselves between the polymer chains, spacing
them further apart to increase the free volume in the system, thus significantly lowering
the glass transition temperature for the polymer and making it softer. In order to have a
good compatibility, plasticizers should have a minimal degree of branching. This is
because branching in the plasticizer structure always worsens compatibility with
polymers due to the steric restrictions effect (Senichev, 2004).
Part of PVC can be more easily solvated by plasticizer due to its characteristics of
lower molecular weight (Nakajima & Ward, 1983) and lower crystalline content
(Wypych, 1985), while other parts of the resin reveal higher resistance to the plasticizer

41
action. Nevertheless, only a certain fraction of the plasticizer is involved in the
interaction and remaining plasticizer behaves just like the pure component.
2.4.5 Performance of plasticizers
The key performance properties of a PVC compounds are influenced by the
chemical type of plasticizer as well as the plasticizer level (part per hundred of PVC).
Various types of plasticizers give various plasticization effects due to the differences in
the strengths of plasticizer-plasticizer and plasticizer-polymer interactions. At low
plasticizer levels, the plasticizer-PVC interactions are the dominant interactions, while at
high plasticizer concentrations, plasticizer-plasticizer interactions become more
significant (Krauskopf & Godwin, 2005). In formulations at higher level of plasticizers,
some leaching out of excess plasticizers to the polymer surface would be occurred. This
is because plasticizing effect will ultimately reach constant once the critical point of
plasticizer concentration is passed, where further addition of the plasticizer may lead to
an inhomogeneous mixture of the PVC compound.
In the selection of a suitable plasticizer for a given application, the first
consideration would be compatibility. Other criteria relating to processing, performance
and permanence properties would be obtained, depending on the specific application. For
each application, the desirable balance of properties should be achieved within a
prescribed cost framework. It should be noted that no single plasticizer exhibits the
perfect balance of properties for every application. Each end use will demand certain
essential properties and thus some properties of lower importance need to be sacrificed to
some extent (Graham, 1973).

42
2.5 Plasticization Steps
Sears and Darby (1982) identified six steps of plasticization of PVC. During the
first step, plasticizer molecules penetrate the porous structure of PVC in an irreversible
way. Adsorption of plasticizer takes place. Subsequently, there is an induction period
where the plasticizer slowly solvates the resin surface. During the third step, the
absorption of plasticizer takes place. During this step the PVC particles swell while the
total volume of the material decreases. A diffusion process takes place with low
activation energy. In the fourth step, drastic changes take place that transcur with high
activation energy. The plasticizer forms clusters among the polymer segments and
penetrates into the molecular segments of polymer, solvating hydrogen bonding and
polar groups available. During this step the PVC particles lose their identity, and the
mixture can be seen as a melted homogeneous material. If heating progresses the
material behaves like a fluid melt. The clusters of polymer or plasticizer molecules
disappear and a homogeneous material is formed. The last step takes place during
cooling. The polymer hardens due to crystallization and creation of weak van der Waals
forces and hydrogen bonding between the plasticizer molecules and the polymer
segments.
2.5.1 Mechanism of plasticizers action
For a plasticizer to be effective, it must be thoroughly mixed and incorporated
into the PVC polymer matrix. This is typically obtained by heating and mixing until
either the resin dissolves in the plasticizer or the plasticizer dissolves in the resin.
Several theories have been developed to account for the observed characteristics
of the plasticization process. A significant review of the theoretical treatment of
plasticization is described by Sears and Darby (1982). In this treatment, plasticization is
43
described by three primary theories: Lubricity Theory, Gel Theory and Free Volume.
Lubricity and Gel Theory describe the action of plasticizer in the polymer. Free volume
is a measure of the internal space available within a polymer and the theory describes the
effect of increasing free volume to the molecule or polymer chain movement.
2.5.1.1 Lubricity theory
In Lubricity theory, the function of plasticizer is to reduce the intermolecular
frictions between polymer molecules and prevent the formation of a rigid network. The
plasticizer acts by lubricating the movement of the polymer molecules and reducing their
internal resistance to sliding where the polymer molecules can slip over each other.
According to Clark (1941) (as cited in Marcilla & Beltran, 2004), plasticizing involves
the filling of the large voids in the molecular space lattice, thus leading to the formation
of planes of easy glide. This supports the Lubricity theory that the plasticizer acts as a
lubricant to fill the voids between the gliding planes to reduce polymer-polymer
interactive forces. As a consequence, Tg of PVC is lowered and the polymer chains are
allowed to move rapidly, resulting in increased softness and flexibility.
2.5.1.2 Gel theory
The Gel theory describes the polymer structure is sustained by an internal
tridimensional honeycomb or gel structure, maintained by loose attachment of the
macromolecules along their chains. The rigidity of an unplasticized resin is due to the
resistance of this tridimensional network (Marcilla & Beltran, 2004). The principal
resistance to distortion in a polymer is viewed as the elastic resistance of interlocked
segments of the resin to slip. Plasticization reduces the relative number of polymer-
polymer unions, letting the polymer to be deformed without breaking. Thereby reducing

44
the aggregation of polymer molecules which eventually reducing the rigidity of polymers
(Doolittle, 1954; Doolittle, 1965).
In plasticized polymers, there exists a dynamic equilibrium involving solvation-
desolvation of the polymer by the plasticizer and aggregation-disaggregation of the
polymer chains themselves. In these systems, the plasticizer and resin molecules engage
in continuous solvation-desolvation equilibrium while the resin macromolecules are
joining and separating from each other in a continuous aggregation-disaggregation.
Aiken et al. (1947) tried some correlations between plasticizer effectiveness and
softening, compatibility and molecular structure. They concluded that polar groups in
plasticizer and polymer could be arranged in a manner as to form solvating dipoles on
the PVC chains. The non-polar tails, being incompatible with PVC would tend to cluster
together, leaving a large amount of unshielded polar polymer chains. According to Aiken,
plasticizer facilitates micro-Brownian motion of polymer chain segments, thus
permitting elasticity to develop. They proposed that in the dynamic equilibrium of the
solvation-desolvation process, the plasticizer diffuses through the polymer structure,
opening up polymer-polymer contacts temporarily and wandering about, allowing the
structure to close behind it in a different position. The solvation-desolvation process
described by Aiken to explain plasticization effect matches the basic ideas of the gel
theory.
2.5.1.3 Free Volume theory
Free volume is considered as the remaining space between atoms and molecules
when no movement is allowed in a polymer. Free volume is low in the glassy state with
the molecules packed tightly and cannot move past each other very easily, resulting the
polymer appear to be rigid and hard. When the polymer is heated above its glass

45
transition temperature (Tg), additional free volume was created as a result of the
molecular vibrations, allowing the polymer molecules to move past each other rapidly
(Krauskopf & Godwin, 2005). This has the effect of making the polymer system to be
more flexible and rubbery.
Incorporation of plasticizer into PVC mass is expected to lead to a change in free
volume. Free volume can be decreased by: increase the molecular weight of polymer or
plasticizers; decrease in chain hydrodynamic volume in the system (e.g. presence of
numerous long side chains); decrease in chain mobility (e.g. less end groups present) and
higher interaction between chains (e.g. high polarity, increased hydrogen bonding). As
plasticizers are added to the polymer system, the Tg of the polymer is lowered by
increasing the free volume and molecules are separated further in the system, making the
PVC soft and rubbery. With that the PVC molecules can then be able to move past each
other rapidly (Krauskopf & Godwin, 2005).
Generally the amorphous areas in polymer are associated with more free volume
and tend to be more flexible since conformational changes are permitted in these areas
(Marcilla & Beltran, 2004). Plasticizers preferentially position themselves in the
amorphous areas. As the free volume theory predicts, the introduction of plasticizers into
the polymer involves addition of more free volume and thus, imparting more flexibility
and ease of movement to the polymer molecules.
2.5.2 Prerequisites for plasticization
According to Krauskopf and Godwin (2005), the plasticizer molecules are not
permanently bound to the PVC resin molecules but are free to self-associate and
associate with the resins at certain sites like amorphous sites. As these interactions are
weak, there is a dynamic exchange process whereby plasticizer molecule is readily

46
dislodged and replaced by one another. Therefore, the plasticizer must be selective in
entering the amorphous PVC part but not enter and destroy the crystalline part of PVC.
Moorshead (1962) analyzed requirements for a polymer to be plasticized. Firstly,
the polymer chains must be sufficiently long to have some strength although the
plasticizer forces them apart. Secondly, in highly crystalline polymers the chains are held
together by primary bonds and crystalline forces where both forces are too strong to
permit plasticizer to penetrate into the polymer. Hence crystallinity of the polymers
should not be too high.
On the other hand, the structure of the plasticizer also has a significant effect on
plasticization. Both polar and non-polar groups are required in a plasticizer if good
compatibility and flexibility is to be achieved. Polar and polarizable groups in a
plasticizer improve tensile strength of a polymer, but flexibility is only moderately
improved since there are many points of high cohesion along the chain. If the plasticizer
also contains non-polar and non-polarizable groups, these groups separate the polymer
dipoles without introducing intermediate links, thereby providing high flexibility in
plasticized compounds (Marcilla & Beltran, 2004).
The polarities of polymer and plasticizer were useful in assisting the choices of
plasticizers. Polar groups in a plasticizer are essential for good compatibility as it is the
case of like dissolving like. When plasticizer molecules are introduced into the polymer
mass, polymer chains are separated by the plasticizer molecules, which are able to line
up their dipoles with the polymer dipoles. Polymer chains separated in this way are more
easily moved relative to the one that are bonded very closely. Besides that it should be
pointed out that branching of aliphatic chain and high molecular weight of a plasticizer
reduces its ability to shield polymer dipoles, this subsequently reducing the mobility

47
among the polymer chain, and accordingly reducing its softening properties (Marcilla &
Beltran, 2004).
2.6 Market of PVC plasticizer
In general, the demand for plasticizer markets is greatly influenced by general
economic conditions and thus it largely follows the patterns of the leading world
economies. Fig. 2.16 shows the pie chart of world consumption of plasticizers in year
2008.
Fig. 2.16 World consumption of plasticizers in year 2008
(Adapted from Bizzari et al., 2009)
In recent years, the price of plasticizers (per Ib) has hiked up the price of PVC
resin than before. This cost relationship between PVC resin and plasticizer has urged
PVC formulator to find solutions to lower the overall cost of plasticizers used. Therefore
the formulator needs to be knowledgeable about the exact type and amount of plasticizer
needed to meet product specifications and to produce a satisfactory product with overall
lower cost (Rugen et al., 1981).

48
CHAPTER THREE
MATERIALS AND METHODS
The study in the thesis comprised of two parts; the first part studies the thermal
degradation of medium-chain-length poly(3-hydroxyalkanoates) (mcl-PHA) synthesized
via bacterial fermentation process; and the second part investigates the ability of the mcl-
PHA and its low molecular weight oligoesters to serve as a compatible plasticizer for
poly(vinyl chloride) (PVC).
3.1 Thermodegradation of medium-chain-length poly(3-hydroxyalkanotes)
3.1.1 Materials
3.1.1.1 Renewable fermentation carbon substrates
Oleic acid and palm kernel oil were kind gifts from Southern Acids (M) Ltd.,
Klang, Malaysia. Oleic acid (C18H34O2, Mw 282.46 g mol-1
, = 0.90 g ml-1
) was the
refined mono unsaturated fatty acid from palm oil. Palm kernel oil (Mw 217 g mol-1
) is
the extract from the nut kernel of oil palm (Elaeis guineensis Jacq.) fruit. It is highly
saturated oil, consists of a mixture of C6 to C18:2 fatty acids with almost 82% saturated
fatty acids and 18% unsaturated fractions (Elson, 1992). The major fatty acid
compositions are: lauric acid (C12, 48%), myristic acid (C14, 16%), oleic acid (C18:1,
15.4%), palmitic acid (C16, 8%), capric acid (C10, 4%), caprylic acid (C8, 3%), stearic
acid (C18, 3%), linoleic acid (C18:2, 2.4%), caproic acid (C6, 0.2%) and arachinoic acid
(C20, 0.1%). Same batch of oleic acid and palm kernel oil were utilized throughout the
study without further purification in order to minimize the compositional variations.
3.1.1.2 Bacterial strain
Pseudomonas putida PGA1 was used throughout the study. It was the culture
collection of Prof. Dr. Irene Tan Kit Ping in Biotechnology Laboratory, University of
49
Malaya, which was a kind gift from Prof. Dr. Gerrit Eggink, from the Agrotechnological
Research Institute, Wageningen, The Netherlands. The bacterial strain was maintained at
4˚C on nutrient agar plate and agar slant, and periodically subcultured.
3.1.1.3 Media
3.1.1.3.1 Stock culture medium
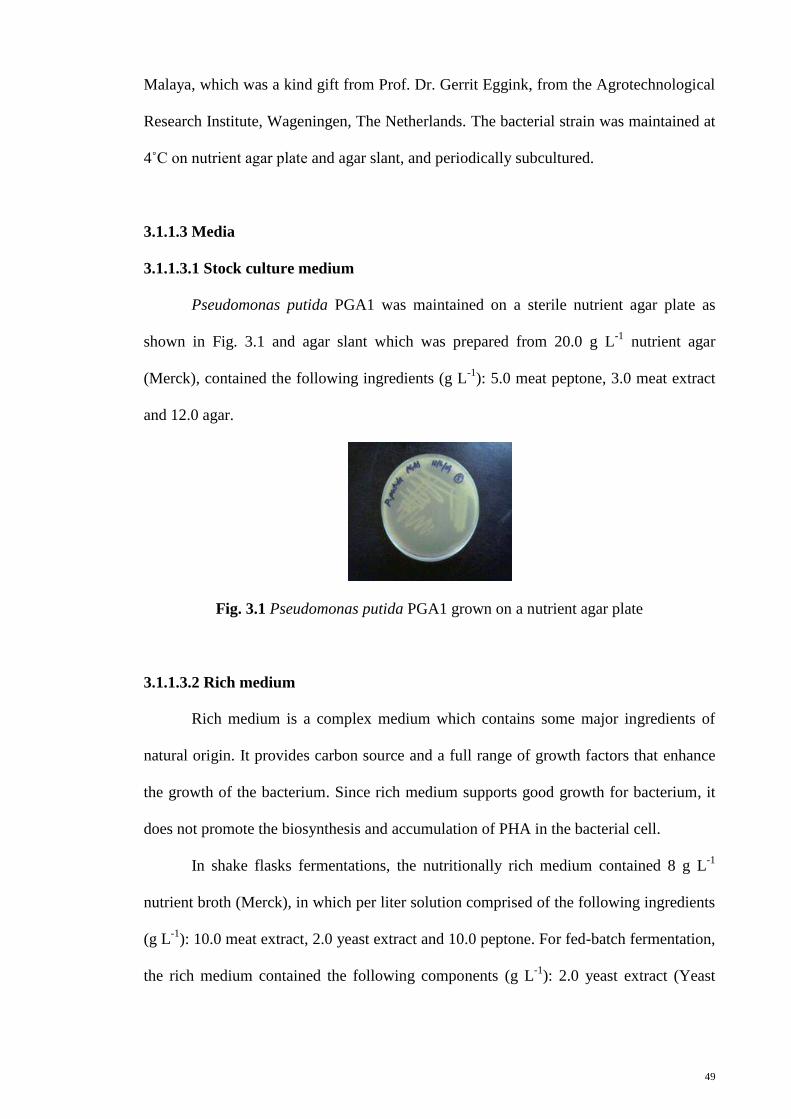
Pseudomonas putida PGA1 was maintained on a sterile nutrient agar plate as
shown in Fig. 3.1 and agar slant which was prepared from 20.0 g L-1
nutrient agar
(Merck), contained the following ingredients (g L-1
): 5.0 meat peptone, 3.0 meat extract
and 12.0 agar.
Fig. 3.1 Pseudomonas putida PGA1 grown on a nutrient agar plate
3.1.1.3.2 Rich medium
Rich medium is a complex medium which contains some major ingredients of
natural origin. It provides carbon source and a full range of growth factors that enhance
the growth of the bacterium. Since rich medium supports good growth for bacterium, it
does not promote the biosynthesis and accumulation of PHA in the bacterial cell.
In shake flasks fermentations, the nutritionally rich medium contained 8 g L-1
nutrient broth (Merck), in which per liter solution comprised of the following ingredients
(g L-1
): 10.0 meat extract, 2.0 yeast extract and 10.0 peptone. For fed-batch fermentation,
the rich medium contained the following components (g L-1
): 2.0 yeast extract (Yeast
50
extract granulated, Merck), 10.0 meat extract (Extract of meat dry, Merck), 10.0
bacteriological peptone (Merck).
3.1.1.3.3 PHA production medium used in shake flasks fermentation
The minimal salt medium used in the oleic acid derived mcl-PHA production was
modified M9 medium (Maniatis et al., 1982). It is a nitrogen-limiting medium which was
used to induce PHA accumulation in bacteria. It contained the following ingredients (g
L-1
): 12.8 di-sodium hydrogen phosphate heptahydrate (Na2HPO4.7H2O, Mw 268.06 g
mol-1
, ChemAR), 3.0 potassium di-hydrogen phosphate anhydrous (KH2PO4, Mw 136.09
g mol-1
, ChemAR), 0.5 ammonium chloride (NH4Cl, Mw 53.49 g mol-1
, ChemAR) and
0.5 sodium chloride (NaCl, Mw 58.44 g mol-1
, J.T. Baker); trace elements which
consisted of 2.0 ml of 1.0 M magnesium sulfate heptahydrate (MgSO4.7 H2O, Mw 246.47
g mol-1
, Merck) stock solution and 1ml of 0.1 M calcium chloride (CaCl2, Mw 74.10 g
mol-1
, ChemAR) stock solution. The medium is designed in a way that the essential
nutrient, in this case nitrogen, is limiting. Ammonium chloride was the sole nitrogen
source for the bacterium in the PHA production medium and limited concentration of it
promoted the accumulation of PHA. Generally, nitrogen, phosphorus, oxygen and sulfur
are the essential nutrients for bacterial cell growth, and if one of them is in limiting
concentration, the cells will be in stress condition and start to reserve the carbon and
energy source in the form of PHA.
Nitrogen limitation could be exploited in the PHA production medium since it is
relatively easier to make the bacterial culture ammonium-limited than other mineral ions.
In addition, the growth of microorganism is more dependent on nitrogen (Suzuki et al.,
1986). On the other hand, phosphorous amount is not easy to limit as it was an important
component in the medium’s buffering system. The amount of dissolved oxygen also
could not be easily manipulated in this study as P. putida PGA1 is an aerobic

51
microorganism. Sulfur is just part of the trace element ingredients present in the M9
medium so the sulfur concentration could not be exploited.
3.1.1.3.4 PHA production medium used in fed-batch fermentation
E2 medium (Marsudi et al., 2007) is a defined formulation of major and minor
elements and minerals. Modified E2 formulation was used as the palm kernel oil derived
PHA production medium in the fed-batch fermentation. It composed of (g L-1
): 1.2
potassium di-hydrogen phosphate anhydrous (KH2PO4, Mw 136.09 g mol-1
, ChemAR),
11.0 di-sodium hydrogen phosphate heptahydrate (Na2HPO4.7H2O, Mw 268.06 g mol-1
,
ChemAR), 16.0 ammonium chloride (NH4Cl, Mw 53.49 g mol-1
, ChemAR), 170.0 ml
100.0 mM magnesium sulfate heptahydrate (MgSO4.7 H2O, Mw 246.47 g mol
-1, Merck)
and 1.0 ml trace element solution having the following components (g L-1
) in 0.1 M HCl:
0.22 cobalt (II) chloride hexahydrate (CoCl2.6H2O, Mw 237.93 g mol-1
, Merck), 9.70 iron
(III) chloride hexahydrate (FeCl3.6H2O, Mw 270.33 g mol-1
, Merck), 7.80 calcium
chloride (CaCl2, Mw 74.10 g mol-1
, ChemAR), 0.12 nickel chloride hexahydrate
(NiCl3.6H2O, Mw 237.70 g mol-1
, Sigma), 0.11 chromium (III) chloride hexahydrate
(CrCl3.6H2O, Mw 266.40 g mol-1
, Sigma) and 0.16 cupric sulfate pentahydrate (CuSO4.5
H2O, Mw 249.68 g mol-1
, BDH).
3.1.1.4 Chemicals and test reagents
3.1.1.4.1 Preparation of 100.0 mM and 1.0 M magnesium sulfate heptahydrate stock
solution
A stock solution of 100.0 mM magnesium sulfate heptahydrate (MgSO4.7 H2O,
Mw 246.47 g mol-1
, Merck) was prepared by adding 24.65 g MgSO4.7 H2O into 1.0 L
volumetric flask and the volume was made up to 1.0 L with distilled water. For the stock

52
solution of 1.0 M magnesium sulphate heptahydrate, 246.47 g MgSO4.7 H2O was
prepared in 1.0 L distilled water.
3.1.1.4.2 Preparation of 0.1 M calcium chloride stock solution
A stock solution of 0.1 M calcium chloride (CaCl2, Mw 74.10 g mol-1
, ChemAR)
was prepared by adding 7.41 g CaCl2 into 1.0 L volumetric flask and made up to 1.0 L
with distilled water.
3.1.1.4.3 Preparation of 0.85% saline solution
A stock solution of 0.85% saline was prepared by dissolving 8.50 g sodium
chloride (NaCl, Mw 58.44 g mol-1
, J.T. Baker) in 1.0 L distilled water.
3.1.1.4.4 Preparation of 10% antifoam stock solution
A stock solution of 10% Antifoam A (30% aqueous emulsion of silicon polymer,
Fluka Chemical) was prepared by adding 10.0 ml of Antifoam A in 990.0 ml distilled
water.
3.1.1.4.5 Preparation of 1.0 M hydrochloric acid solution
1.0 M hydrochloric acid (37% HCl, Mw 36.36 g mol-1
, 1.19 g ml-1
, Fisher
Scientific) was prepared by adding 82.81 ml of 37% HCl into 1.0 L volumetric flaks and
made up to 1.0 L with distilled water.
3.1.1.4.6 Preparation of 3.0 M potassium hydroxide solution
3.0 M potassium hydroxide solution (KOH, Mw 56.11 g mol-1
, Merck) was
prepared by adding 168.33 g KOH into 1.0 L volumetric flask and made up to 1.0 L with
distilled water.

53
3.1.1.4.7 Preparation of phenolphthalein indicator solution
1% phenolphthalein indicator solution was prepared by dissolving 1.0 g
phenolphthalein (C20H14O4, Mw 318.33 g mol-1
, Merck) in 100 ml of 95% denatured
ethanol (C2H5OH, Mw 46.07 g mol-1
, HmbG Chemicals).
3.1.1.4.8 Preparation of standardized potassium hydroxide solution
Potassium hydroxide (KOH, Mw 56.11 g mol-1
, Merck) solution was standardized
with potassium hydrogen phthalate (KHP) first prior to the determination of acid number
in end group analysis. About 0.02 M concentration of KOH solution was prepared by
dissolving 1.18 g of KOH in 1.0 L of 95% denatured ethanol (C2H5OH, Mw 46.07 g mol-1
,
HmbG Chemicals). A small amount of potassium hydrogen phthalate (C8H5KO4, Mw
204.23 g mol-1
, R&M Chemicals) was dried in oven at 110°C for at least 2 hours and
allowed to cool in a desiccator before use to remove moisture. About 0.1 g of KHP was
weighed and dissolved in 50.0 mL of distilled water and added with 2 drops of 1%
phenolphthalein indicator. The mixture was swirled gently until the salt had completely
dissolved and titrated with 0.02 M ethanolic KOH solution to the first appearance of a
permanent pink colour. The molarity (M) of standardized potassium hydroxide (KOH)
solution was calculated using Equation (3.1):
(3.1)
where WKHP is weight of potassium hydrogen phthalate (KHP) in g; VKOH is volume of
KOH solution used for sample titration in ml.
3.1.1.4.9 Methyl ester standards for gas chromatography analysis
3-hydroxyalkanoaic acid methyl ester standards were used as reference for
identification of the monomers present in the mcl-PHA. The standards used were mainly
saturated even carbon methyl esters, i.e. methyl 3-hydroxybutanoate (C5H10O3, Mw

54
118.13 g mol-1
, Sigma Chemical), methyl 3-hydroxyhexanoate (C7H14O3, Mw 146.19 g
mol-1
, SAFC), methyl 3-hydroxyoctanoate (C9H18O3, Mw 174.24 g mol-1
, Larodan),
methyl 3-hydroxydecanoate (C11H22O3, Mw 202.29 g mol-1
, Larodan), methyl 3-
hydroxydodecanoate (C13H26O3, Mw 230.34 g mol-1
, Larodan), methyl 3-
hydroxytetradecanoate (C15H30O3, Mw 258.40 g mol-1
, Larodan), methyl 3-
hydroxyhexadecanoate (C17H34O3, Mw 286.45 g mol-1
, Larodan). By comparing with the
retention times of the standards in the chromatogram, the C-even monomers present in
the polymer could be identified.
3.1.1.5 Shaker incubator set-up
Shake flask fermentation was carried out in the orbital shaker incubator
(HOTECH, Model 718, Taiwan) as shown in Fig. 3.2. The incubation temperature and
agitation speed for the incubator was set at 30 °C and 200 rpm throughout the
experiments.
Fig 3.2 Orbital shaker incubator used in the shake flasks fermentation

55
3.1.1.6 Bioreactor set-up
The fed-batch fermentation was performed in a 5.0 L fermenter (Biostat○R B, B.
Braun International, Germany), a culture vessel made of borosilicate glass equipped with
an outer thermostat jacket. The pH, temperature and partial pressure of oxygen (pO2) of
the culture media were measured and regulated by a digital system.
All the sampling bottles which contained the carbon substrate, magnesium sulfate,
antifoam, acid and base solutions were connected to the bioreactor with autoclavable
peroxide-cured silicone tubings. Before autoclaving, all the tubes and filters were
clamped except the exhaust pump filter. The filters were wrapped with non-absorbant
wool and aluminium foil to prevent water vapor from entering into the filters. The
temperature sensor, pH probe (Mettler-Toledo) and pO2 probe (Mettler-Toledo) were
checked and calibrated prior to the experiments. The pH probe and temperature sensors
were connected to the bioreactor and calibration of pH probe was carried out using pH 4
and pH 7 buffer solutions at 25°C before autoclaving. After the whole system was
autoclaved at 121°C for 15 min using the large capacity autoclave machine (P.
SELECTA, Spain), the pO2 electrode was connected to the digital system to polarize the
pO2 probe for at least 6 hours. Upon polarization, the pO2 probe was calibrated using
industrial grade nitrogen gas followed by industrial grade oxygen gas. The peristaltic
pumps on the machine were also calibrated. After the temperature of the whole system
had cooled down to room temperature, the cooling jacket machine was switched on. Cool
circulating water was allowed to fill in the thermostat to remove trapped air inside the
machine and bioreactor. The motor was then fitted to the reactor and the pH regulation
and temperature of the medium was set at pH 7 and 30°C, respectively. The impeller
speed was set at 600 rpm throughout the fermentation. The setup of the bioreactor during
fed batch fermentation is shown in Fig. 3.3.

56
Fig. 3.3 Setup of 5-L bioreactor for fed batch fermentation system
3.1.2 Methods
3.1.2.1 Saponification of palm kernel oil
According to Tan et al. (1997), Pseudomonas putida PGA1 cannot utilize palm
kernel oil (PKO) directly due to the absence of lipase gene. Therefore it is necessary to
saponify the PKO with sodium hydroxide to produce sodium salts of free fatty acids to
be used as the feedstock for bacterial growth and PHA production. PKO at room
temperature is in semi-solid form therefore it was first warmed in the oven at 40oC until
it melted completely. An ethanolic sodium hydroxide solution was prepared by
dissolving 28.0 g of sodium hydroxide (NaOH, Mw 40.00 g mol-1
, Merck) in 1.0 L of
absolute 99.5% ethanol (C2H5OH, Mw 46.07 g mol-1
, ChemAR); 80.0 g of PKO was then
weighed and added to the round bottom flask containing the ethanol/NaOH solution. The
mixture was refluxed gently at 70˚C for 1 hour. Upon completion, the reaction mixture
was poured into a glass petri dish and dried in an oven to evaporate off the excess
ethanol, leaving behind the sodium salt of the fatty acids.

57
3.1.2.2 Sterilization
All medium and solutions used in the shake flasks fermentation were sterilized at
121˚C, 1 atm for 15 min using autoclave machine (TOMY Model SS-325, Japan). The
carbon substrate was sterilized separately from the nutrient-limiting medium to avoid
possible reactions with other medium’s components where possibly toxic and
inaccessible compounds for growth may be formed. To avoid precipitation during
autoclaving, the trace element solutions of modified M9 medium were heat sterilized
separately before adding to the rest of the formulation.
The 5 L bioreactor containing the nutrient-limiting medium and the sampling
bottles which contained the carbon substrate, magnesium sulfate, antifoam, acid and base
solutions were sterilized at 121˚C, 1 atm for 15 minutes using large capacity autoclave
machine (P. SELECTA, Spain). The trace element solution of the modified E2 medium
was filter sterilized separately before adding to the rest of the medium.
3.1.2.3 Production of oleic acid derived mcl-PHA through shake flasks fermentation
In shake flasks fermentation, 0.5% (v/v) oleic acid was utilized by Pseudomonas
putida as the sole carbon and energy source. The bacterium was cultured at 30°C and
agitated at 200 rpm in the HOTECH orbital shaker incubator under aerobic condition.
PHA production was performed in a two-stage culture system which consists of
cell-growth phase and PHA-accumulation phase. In the first phase, the bacteria were
grown in nutrient broth (8.0 g L-1
), a nutritionally rich medium, to produce high
concentration cell cultures. After 20 hours of incubation, the cells were harvested by
centrifugation, washed with 0.85% saline, and transferred to the modified nitrogen-
limiting M9 medium to induce PHA biosynthesis by the cells. The bacteria were further
cultivated in PHA production medium for 72 hours at 200 rpm and 30oC.

58
3.1.2.4 Production of palm kernel oil derived mcl-PHA through fed-batch
fermentation
For fed-batch fermentation, bacterial cells were pre-cultured overnight in the
orbital shaker orbital at 30˚C and agitated at 200 rpm for 15 hours in a rich medium. The
resulting culture was used to inoculate the inoculum medium containing the same
composition as the rich medium but supplemented with additional 5.0 g L-1
SPKO. This
was used as the inoculum for the PHA production medium in the 5 L bioreactor. SPKO
was added to the inoculum medium so that the bacterial cells will be more easily adapted
to the new environment in the PHA production medium with similar carbon source, and
therefore reduced the period of lag phase for cell growth.
Fed-batch cultures were cultivated at 30˚C in the 5 L bioreactor (Biostat○R B, B.
Braun International, Germany) with 5.0 g L-1
SPKO as the sole carbon substrate in the
initial feed and 3 g L-1
in the subsequent fed-batch feeding. 10% inoculum (v/v) was
used to inoculate 3.0 L PHA production medium in the bioreactor. The carbon substrate
was added at intermittent intervals at a constant flow rate via bottom feeding. The SPKO
solution was kept warm in the hot water bath (Memmert, Germany) throughout the
experiments so that homogeneous feeding to the culture medium will be achieved. 100.0
mM MgSO4.7H2O solution was also intermittently fed into the bioreactor in order to
minimize precipitation in the culture medium. Stirrer speed was kept constant at 600
rpm in all experiments. The partial pressure of dissolved oxygen was maintained around
80% of oxygen saturation during the cell growth phase and 50% of oxygen saturation
during PHA accumulation phase by feeding oxygen-enriched gas. The pH of the culture
was maintained at 7.0 by addition of acid (1.0 M HCl) and base (25% NH3 at initial
growth and 3.0 M KOH after 48 hours of cultivation). The NH3 feed simultaneously
served as the nitrogen source for bacterial growth during exponential phase and as a
basic solution for pH control. Under the specific cultivation conditions, PHA

59
accumulation phase began after 48 hours of fed-batch cultivation. To maintain nitrogen-
limiting condition after 48 hours of cultivation, the pH was regulated by the addition of
3.0 M KOH instead of 25% NH3. Foaming was likely to occur when the SPKO solution
was pumped into the culture medium. To control the foaming problem, 10% antifoam
was added to the medium to suppress the foam formation. Foaming could also be
controlled by the installation of two mechanical foam breakers on the central shaft and
above the surface of the liquid, adjustment of the impeller speed and aeration.
Automatically regulated gas-mix mode was chosen to supply oxygen to the culture
alternative to constant airflow method.
After 60 hours of fermentation, the culture medium was pumped out from the
bioreactor by increasing the air pressure in the bioreactor. The bacterial culture was
subsequently harvested by centrifugation.
3.1.2.5 Cell harvesting
The bacterial cells were aseptically harvested by centrifugation (CONTINENT R
large capacity refrigerated centrifuge, Korea) at 8000 rpm for 30 minutes at 4°C after
bacterial cultivation. The cells were washed twice with sterile 0.85% saline and dried at
70˚C in a hot air oven (Memmert, Germany) to constant weight.
3.1.2.6 Removal of oily remnants from the cells by biomass pretreatment
The dried cells were washed with polar solvent to remove remnants from the
carbon substrates and metabolic wastes from the biomass by suspending them in 95%
analytical grade ethanol (C2H5OH, Mw 46.07, HmbG Chemicals) and shaking for 30
minutes at 22+1°C and 160 rpm in the orbital shaker incubator (HOTECH Model 718).
Oily residues and other polar lipids attached to the cells would dissolve in the alcohol
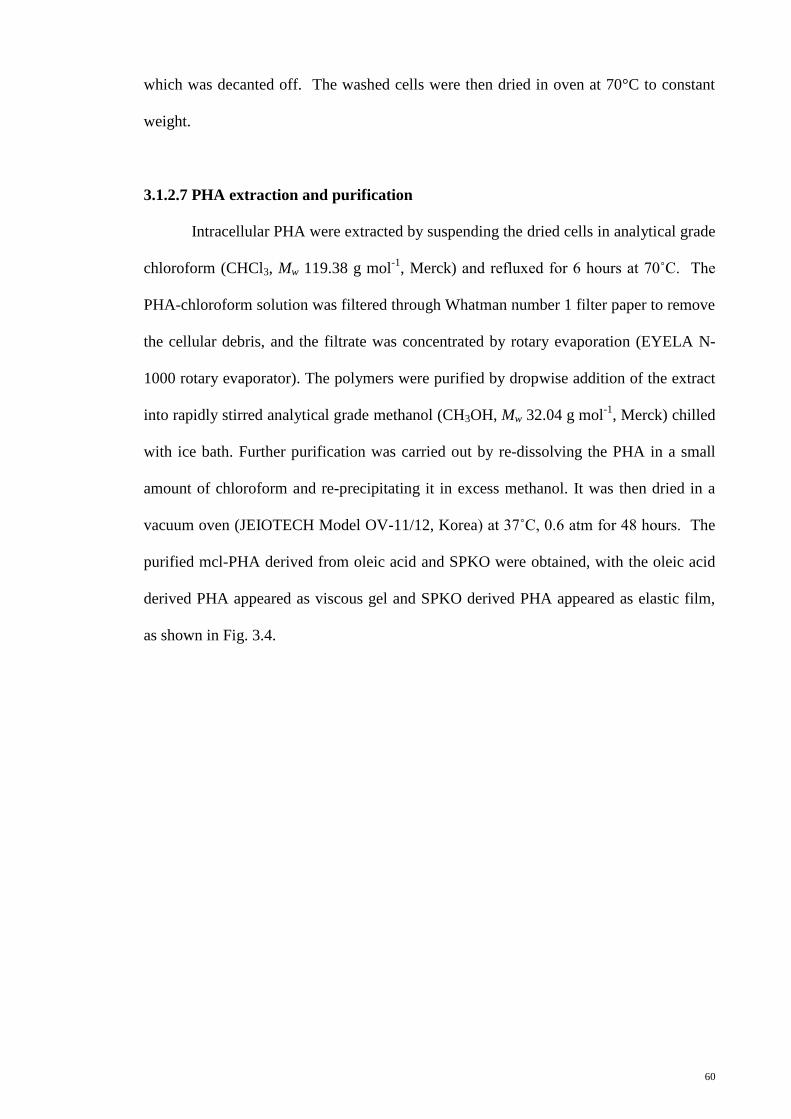
60
which was decanted off. The washed cells were then dried in oven at 70°C to constant
weight.
3.1.2.7 PHA extraction and purification
Intracellular PHA were extracted by suspending the dried cells in analytical grade
chloroform (CHCl3, Mw 119.38 g mol-1
, Merck) and refluxed for 6 hours at 70˚C. The
PHA-chloroform solution was filtered through Whatman number 1 filter paper to remove
the cellular debris, and the filtrate was concentrated by rotary evaporation (EYELA N-
1000 rotary evaporator). The polymers were purified by dropwise addition of the extract
into rapidly stirred analytical grade methanol (CH3OH, Mw 32.04 g mol-1
, Merck) chilled
with ice bath. Further purification was carried out by re-dissolving the PHA in a small
amount of chloroform and re-precipitating it in excess methanol. It was then dried in a
vacuum oven (JEIOTECH Model OV-11/12, Korea) at 37˚C, 0.6 atm for 48 hours. The
purified mcl-PHA derived from oleic acid and SPKO were obtained, with the oleic acid
derived PHA appeared as viscous gel and SPKO derived PHA appeared as elastic film,
as shown in Fig. 3.4.
61
Fig. 3.4 Morphology of mcl-PHA derived from two different substrates: (a) mcl-PHA
derived from SPKO and (b) mcl-PHA derived from oleic acid
3.1.2.8 Thermal degradation of mcl-PHA
Thermal degradation was carried out at three temperatures: 160+2°C, 170+2°C
and 180+2°C for mcl-PHA derived from oleic acid; and at four temperatures: 160+2°C,
170+2°C, 180+2°C and 190+2°C for mcl-PHA derived from palm kernel oil. The
thermal degradation of oleic acid derived PHA was conducted in the temperature range
of 160-180°C as the initial degradation temperature for this polymer was around 183°C.
Meanwhile the initial degradation temperature of SPKO derived PHA was around 195°C,
hence, the thermal degradation was conducted in the temperature range of 160-190°C.
The PHA samples were pre-dried for 48 hours in vacuo to remove moisture.
Approximately 5.0 g of sample was placed in a 250 ml conical flask with socket, which
was connected to a Leibig condenser, as shown in Fig. 3.5. The reaction flask was placed
in thermostated silicon oil (Polydimethylsiloxane, for melting point and boiling point
apparatus, ACROS organics) bath and heated from ambient temperature to the desired
degradation temperatures. The level of the oil bath was kept at approximately 2 cm
above the sample in the reaction flask and the oil bath apparatus was covered with

62
aluminium foil to allow uniform heat transfer during thermal degradation. The sample
was then kept isothermal for 30 minutes. The reactor was removed from the oil bath after
the reaction was completed and allowed to cool down to room temperature. A small
volume of chloroform was added to dissolve the degradation products. The solution was
poured into a glass petri dish followed by complete evaporation in fume hood at room
temperature and subsequently dried in vacuum oven to remove moisture.
Fig. 3.5 The set-up of thermodegradation process
3.1.3 Characterizations of un-degraded and heat-treated mcl-PHA
3.1.3.1 End-group analysis
End group analysis was performed in accordance with ASTM D 1980-87
Standard Test Method and PORIM Test Method (PORIM p2.5 Acidity) to measure the
amount of free acids present in the sample. Acid number titration was carried out to
determine the concentration of carboxylic acid end groups in the PHA polymer. The
PHA samples (non-degraded control and heat-treated ones) were dissolved in a 2:1

63
mixture of toluene and ethanol. The acid values were determined by titrating the polymer
solutions with standardized ethanolic potassium hydroxide solution. Each titration was
added with two drops of 1% phenolphthalein indicator as titration end-point visual
indicator. All experiments were performed in duplicate. As acid number is the number of
mg of KOH used to neutralize the free fatty acids in 1.0 g of PHA, the number average
molecular weight and concentration of terminal carboxyl groups of the polymer could
therefore be determined.
3.1.3.2 Determination of acid number for PHA sample
3.1.3.2.1 Blank and sample titration
A stock solution of a solvent mixture consisted of analytical grade toluene
(C6H5CH3, Mw 92.14, Fisher Scientific) and analytical grade 95% denatured ethanol
(C2H5OH, Mw 46.07, HmbG Chemicals) in a ratio of 2:1 was prepared. The blank
solution was prepared by adding 50.0 mL of the solvent mixture and 2 drops of
phenolphthalein indicator into a conical flask. The solution was then titrated with
standardized KOH solution until the first appearance of a permanent pink color and the
volume of KOH used in the blank titration was recorded.
About 1 g of PHA sample was weighed into a conical flask followed by addition
of 50.0 mL of the solvent mixture (toluene/ethanol) and 2 drops of phenolphthalein
indicator. The mixture was swirled gently until the polymer was completely dissolved.
The sample solution was then titrated with the standardized KOH solution until the first
appearance of a permanent pink color and the volume of KOH used in the sample
titration was recorded. Both the blank and sample titrations were performed in duplicates.

64
3.1.3.2.2 Theoretical calculation of acid number
The acid number (AN) of the PHA sample was calculated using the following
formula:
(3.2)
where MKOH is molarity of the potassium hydroxide solution in M; WPHA is weight of
PHA sample in g; V is volume of the potassium hydroxide solution used for the sample
titration in ml; Vblank is volume of the potassium hydroxide solution used for the blank
titration in ml.
Duplicate results of acid values were obtained and the acid number was reported
by averaging the results. The acid values obtained from the two determinations should
not differ by more than 5% of the mean acid number.
3.1.3.3 Determination of thermal properties of control and heat-treating mcl-PHA
Thermal behavior of reference control (non-degraded) and heat-treated mcl-PHA
were characterized using Thermogravimetric Analysis (TGA) (Perkin-Elmer TGA6) and
Differential Scanning Calorimetry (DSC822e, Mettler Toledo).
3.1.3.3.1 Thermogravimetric Analysis
Thermogravimetric analysis (TGA) has been widely employed to characterize the
thermal behavior of a polymer and to estimate the thermo-kinetic parameters e.g.
activation energy, frequency factor, reaction order and rate of decomposition (Carrasco
et al., 2006).
Measurements from TGA are usually displayed as a thermogram in which the
weight/ weight percentage is plotted against temperature. The rate of weight changes is
derived from the TGA curve with respect to the temperature and is known as the

65
derivative thermogravimetric (DTG) curve. The tip of the DTG curve usually
corresponds to the maximum rate of decomposition.
For TGA, about 10.0 mg of PHA sample was loaded in the ceramic pan and
scanned at heating rate of 10˚C min-1
in the temperature range between 50˚C and 900˚C
under an atmospheric nitrogen flow of 20 mL min-1
. Thermal data were recorded on
Perkin-Elmer Pyris 1 TGA software.
3.1.3.3.2 Differential Scanning Calorimetry
Differential scanning calorimetry (DSC) is designed to determine the change of
enthalpy for a material as heat is absorbed or released when it undergoes a physical
transformation (Sin, 1998). The thermal transitions for the polymer are determined by
directly measuring the difference of the amount of heat supplied to the sample and the
reference.
DSC analysis was carried out in the temperature range of -100 to 180°C at a
heating rate of 20 ºC min-1
under a nitrogen gas flow. Cryospeed nitrogen was used to
achieve the sub-ambient temperature. Approximately 5.0 mg of samples were used and
encapsulated in aluminium pans. The sampling pan was placed aside with a blank
aluminium pan as a reference in the sample chamber. Tg of the sample was determined as
the onset of steep change in energy; Tm and enthalpy of fusion (∆Hm) were determined
from the DSC endothermic peak. All temperatures were recorded in degrees Celsius.
3.1.3.3.3 Determination of kinetic parameters for thermal degradation of mcl-PHA
Thermodegradation kinetics of mcl-PHA was studied using Kissinger’s method
through Thermogravimetric Analysis (Doyle, 1961). PHA samples were analyzed by
TGA non-isothermal procedures at multiple heating rates of 10, 15, 20, 25 and 30 K min-
1. The nitrogen flow rate was fixed at 20 ml min
-1. The degradation activation energy and

66
pre-exponential factor of the process were estimated using Kissinger expression as
shown in Equation (3.3):
(3.3)
where q is heating rate (K min-1
); Tp is maximum degradation temperature (K); R is
universal gas constant (8.3143 J K-1
mol-1
); Ed is degradation activation energy (kJ mol-1
);
A is pre-exponential factor (s-1
).
Kissinger’s method for calculating degradation activation energy uses the
temperature at maximum degradation rate. From the linear plot of –ln (q/Tp2) versus 1/Tp,
activation energy and pre-exponential factor could be calculated from the slope and the
intersection at y-axis respectively (Lee et al., 1997).
The entropy of activation (∆S) for PHA thermal degradation was also calculated
using the relationship as shown in Equation (3.4) (Radhakrishnan Nair et al., 2007):
(3.4)
where A is Arrhenius parameter (s-1
); k is Boltzman constant (1.3807x10⁻²³
J K-1
); Tp is
peak temperature (K); h is Planck constant (6.626x10⁻³⁴
J s); ∆S is entropy of activation
(J K-1
mol-1
); R is general gas constant (8.3143 J K-1
mol-1
).
3.1.3.4 Gel Permeation Chromatography
The relative molecular weight and molecular weight distribution of mcl-PHA
polymers were determined by using gel permeation chromatography (GPC). GPC could
not be used to determine the exact molecular weight of a polymer as it separates the
components on the basis of size only. The most common eluent used in the GPC analysis
is tetrahydrofuran (THF), which is a good solvent for the polymer at room temperature.
In this study, GPC was performed using a WatersTM
600-GPC (USA) instrument
equipped with Waters Styragel HR columns (7.8 mm internal diameter x 300 mm)

67
connected in series (HR1, HR2, HR5E and HR5E) and a Waters 2414 refractive index
detector. Approximately 100.0 μl of 2.0 mg ml-1
polymer sample was eluted by THF at a
flow rate of 1 mL min-1
at 40ºC. The instrument was calibrated using monodisperse
polystyrene standards.
3.1.3.5 Determination of acidity of degradation products
According to Material Safety Data Sheet (MSDS), solubility of hydroxyalkanoic
acids in water at 20˚C is about 59.2% and at 100˚C is 84%, indicating hydroxyalkanoic
acid is a weak acid in nature.
The aqueous acidity of oligomeric hydroxyalkanoic acids obtained from the
thermal degradation process can be determined by measuring the pH of the non-degraded
and the heat treated polymers in their respective boiled aqueous solutions, with boiled
distilled water (95°C) as the control, using pH meter (HANNA instrument pH 211
microprocessor). All experiments were performed in duplicate. Subsequently, acid
dissociation constant (Ka), pKa value and the degree of dissociation (α) of the
decomposition products could be determined. The spontaneity of the dissociation of
hydroxyalkanoic acids into thermodynamically stable conjugate base and hydrogen ions
in aqueous solution was determined from the changes in Gibbs free energy of the process.
The change in standard Gibbs free energy of the process can be calculated from the
following relationship:
(3.5)
where ∆G° is change in standard Gibbs free energy at 1 atm (kJ mol-1
); R is universal
gas constant (8.3143 J K-1
mol-1
); T is temperature of the aqueous solution (368K).

68
3.1.3.6 Gas Chromatography
Gas chromatography (GC) is a technique used to separate various components of
a polymer, to detect the individual monomers and to identify and quantify the monomers
using reference standards. The separation is carried out inside a column in an oven
programmed at certain temperature with the inert carrier gas flowing through the
stationary phase. The individual components are separated based on differential
migration rate of monomers in the polymer.
Analysis of PHA monomeric compositions before and after thermal treatment
was performed using a GC 2014 Shimadzu (Japan) equipped with a SGE forte GC
capillary column BP20 (30 m x 0.25 mm internal diameter x 0.25 μm) (Australia) and a
flame ionization detector (FID). Approximately 8.0 mg of purified PHA was subjected to
methanolysis by heating at 100˚C for 140 min in the mixture of 1.0 ml analytical grade
chloroform (CHCl3, Mw 119.38 g mol-1
, Merck), 0.85 ml analytical grade methanol
(CH3OH, Mw 32.04 g mol-1
, Merck), and 0.15 ml concentrated sulfuric acid (98% HCl,
Mw 98.08 g mol-1
, = 1.94 g ml-1
, Merck) in a screw-cap tube sealed with PTFE tape.
The mixture was shaken occasionally throughout the heating process and subsequently
cooled to room temperature. 1.0 mL of distilled water was added to the reaction mixture.
The mixture was then vortexed for 1 min and allowed to stand for 10 min to induce
phase separation. The organic phase at the bottom layer was recovered by glass Pasteur
pipette and analyzed by gas chromatography.
In the GC analysis, 1.0 μl of sample was injected by split injection with a split
ratio of 10:1 using a SGE 10.0 μl syringe. Nitrogen was used as the carrier gas at a flow
rate of 3 ml min-1
. The column oven temperature was programmed from 120˚C for 2 min
at the start, ramped up at a rate of 20˚C min-1
to 230˚C, and held at this temperature for
10 min. The temperatures of injector and detector were set at 225˚C and 230˚C
respectively. 3-hydroxyalkanoic acid methyl ester standards: 3-hydroxybutyric acid
69
(3HB; C4), 3-hydroxyhexanoic acid (3HHx; C6), 3-hydroxyoctanoic acid (3HO; C8), 3-
hydroxydecanoic acid (3HD; C10), 3-hydroxydodecanoic acid (3HDD; C12), 3-
hydroxytetradecanoic acid (3HTD; C14) and 3-hydroxyhexadecanoic acid (3HHxD; C16)
methyl esters (Larodan) were used to determine the respective retention times for
monomer identification.
3.1.3.7 Fourier Transform Infrared Spectroscopy
Infrared spectrometer is widely used in the qualitative and quantitative
determination of polymeric composition by identifying the structural and functional
groups, steric and geometric isomerism in the polymer (Teoh, 1998). The polymers can
be handled in many forms, e.g. solutions, powder and cast film. Fourier transform
infrared spectroscopy (FTIR) is a modern infrared spectrometer which is capable of
collecting spectral data in a wide spectral range (Griffiths & de Haseth, 2007), with
greater speed and sensitivity than a dispersive spectrometer.
In this study, FTIR analysis was conducted with a Perkin-Elmer FTIR RX
Spectrometer (USA). PHA sample was first dissolved in small amount of chloroform to
form a viscous solution, which was then spread onto a NaCl FTIR cell. The solvent was
removed by blowing with hot air so that a thin polymer film was deposited on the surface
of the NaCl cell. The spectrum was recorded after 16 scans and at a resolution of 4 cm-1
between 4000 and 650 cm-1
.
3.1.3.8 Proton Nuclear Magnetic Resonance Spectroscopy
Proton nuclear magnetic resonance (
1H-NMR) spectroscopy is a valuable
technique used to elucidate the molecular structure of a polymer as the signals of the
protons are very sensitive to the changes in molecular structure, producing narrow
chemical shift with sharp signals. Deuterated chloroform is the most common used

70
solvent in NMR analysis, and it could be served as the internal reference in the spectrum,
giving the signal of 7.27 ppm.
1H-NMR analysis of the control and heat-treated PHA samples was carried out on
a JEOL JNM-LA 400 FT-NMR spectrometer (Japan) operating at 400 MHz at ambient
temperature. About 20.0 mg of PHA sample was dissolved in 1 mL of deuterated
chloroform (CDCl3, 99.9 atom % D, 0.03% (v/v) TMS, Mw 120.38 g mol-1
, Sigma
Aldrich) and the 2% (w/v) PHA-CDCl3 solution was recorded on the 1H-NMR spectrum.
Chemical shifts in ppm were relative to the signals of CDCl3 as internal reference. The
integration value of terminal methyl protons in the side chain of PHA was chosen as the
reference and was assigned the value of 1.00.
3.2 Investigation of the ability of mcl-PHA and its oligoesters as compatible
plasticizer for poly(vinyl chloride)
3.2.1 Materials
3.2.1.1 Poly(vinyl chloride)
Poly(vinyl chloride) (PVC) with viscosity number 87, and low molecular weight
approximately 100,000 g mol-1
(BDH laboratory reagent) was used throughout the
experiments.
3.2.1.2 Medium-chain-length poly(3-hydroxyalkanoates)
Medium-chain-length poly(3-hydroxyalkanoates) (mcl-PHA) were synthesized
by Pseudomonas putida PGA1 from two different carbon substrates: oleic acid (OA) and
saponified palm kernel oil (SPKO) at the concentration of 0.5% (v/v and w/v) using
shake flasks fermentation. Similar culture media as shown in Section 3.1.1.3.2 and
3.1.1.3.3 were used for the bacterial cell growth and PHA production in the fermentation.

71
3.2.2 Methods
3.2.2.1 Heat treating of mcl-PHA at desired degradation temperature
The purified mcl-PHA samples were thermally degraded at temperatures of
170°C for OA derived mcl-PHA and 170°C for SPKO derived mcl-PHA. These
temperatures were chosen as the degradation temperatures as the heat-treated PHA
obtained were mainly composed of a mixture of oligomeric hydroxyacid fragments
without terminal unsaturated fragments. The thermal degradation process was performed
using similar procedure as detailed in section 3.1.2.8.
3.2.2.2 Characterizations of mcl-PHA and degradation products prior to solution
blending
3.2.2.2.1 Differential Scanning Calorimetry
Differential Scanning Calorimetry (DSC) analysis of the non-degraded and heat-
treated mcl-PHA used in the blending was performed using similar procedure as detailed
in Section 3.1.3.3.2.
3.2.2.2.2 Gel Permeation Chromatography
The number average molecular weight (Mn), weight average molecular weight
(Mw) and polydispersity index (PDI) of the control and heat-treated mcl-PHA used in the
blending were determined by gel permeation chromatography (GPC) analysis using
similar procedure as detailed in Section 3.1.3.4.
3.2.2.2.3 Gas Chromatography
The monomeric compositions of the non-degraded and heat-treated mcl-PHA
used in the blending were characterized by gas chromatography (GC) using similar
procedure as detailed in Section 3.1.3.6.

72
3.2.2.3 Solution blending of PVC and mcl-PHA
3.2.2.3.1 Preparation of PVC/mcl-PHA binary blends
A series of polymer blends comprised of poly(vinyl chloride) (PVC) and different
types of medium-chain-length poly(3-hydroxyalkanaotes) (mcl-PHA) (polymeric PHA
derived from OA; 170°C heat-treated PHA derived from OA; polymeric PHA derived
from SPKO; 170°C heat-treated PHA derived from SPKO) were prepared from the
common solvent. Chloroform (CHCl3, Mw 119.38 g mol-1
, Merck) of analytical grade
was used as the solvent for both polymers in the blending.
A 0.625% w/v of PHA solution (20.0 mL chloroform containing 0.125 g mcl-
PHA) and 1.25% w/v of PHA solution (20.0 mL chloroform containing 0.25 g mcl-PHA)
were prepared. These solutions were then added to the 5% w/v PVC solution (100.0 mL
chloroform containing 5.0 g of PVC) at two ratios, yielding 2.5 phr (parts per hundred
PVC resin) and 5 phr (parts per hundred PVC resin) of PVC/PHA binary blends,
respectively. The binary blends were designated as, for example PVC/PHAOA-2.5, the
abbreviation meaning a blend of 97.5 parts of PVC and 2.5 parts of PHA derived from
OA; PVC/PHASPKO-2.5, a blend of 97.5 parts of PVC and 2.5 parts PHA derived SPKO;
PVC/degPHAOA-2.5, a blend of 97.5 parts of PVC and 2.5 parts 170°C heat-treated PHA
derived from OA; PVC/degPHASPKO-2.5, a blend of 97.5 parts of PVC and 2.5 parts
170°C heat-treated PHA derived from SPKO; PVC/PHAOA-5, a blend of 95 parts of PVC
and 5 parts of PHA derived from OA; PVC/PHASPKO-5, a blend of 95 parts of PVC and 5
parts PHA derived from SPKO; PVC/degPHAOA-5, a blend of 95 parts of PVC and 5
parts 170°C heat-treated PHA derived from OA; PVC/degPHASPKO-5, a blend of 95 parts
of PVC and 5 parts 170°C heat-treated PHA derived from SPKO.
The designation and compositions of the binary blends prepared are summarized
in Table 3.1.

73
Table 3.1 Designations and compositions of PVC/PHA binary blends
Sample code Blend Composition
PVC (phr) PHA (phr)
PVC/PHAOA-2.5 97.5 2.5
PVC/degPHAOA-2.5 97.5 2.5
PVC/PHAOA-5 95 5
PVC/degPHAOA-5 95 5
PVC/PHASPKO-2.5 97.5 2.5
PVC/degPHASPKO-2.5 97.5 2.5
PVC/PHASPKO-5 95 5
PVC/degPHASPKO-5 95 5
The commercial code, method of preparation and molecular weight properties of
the PVC and different types of mcl-PHA used in the blending was summarized in the
Table 3.2.
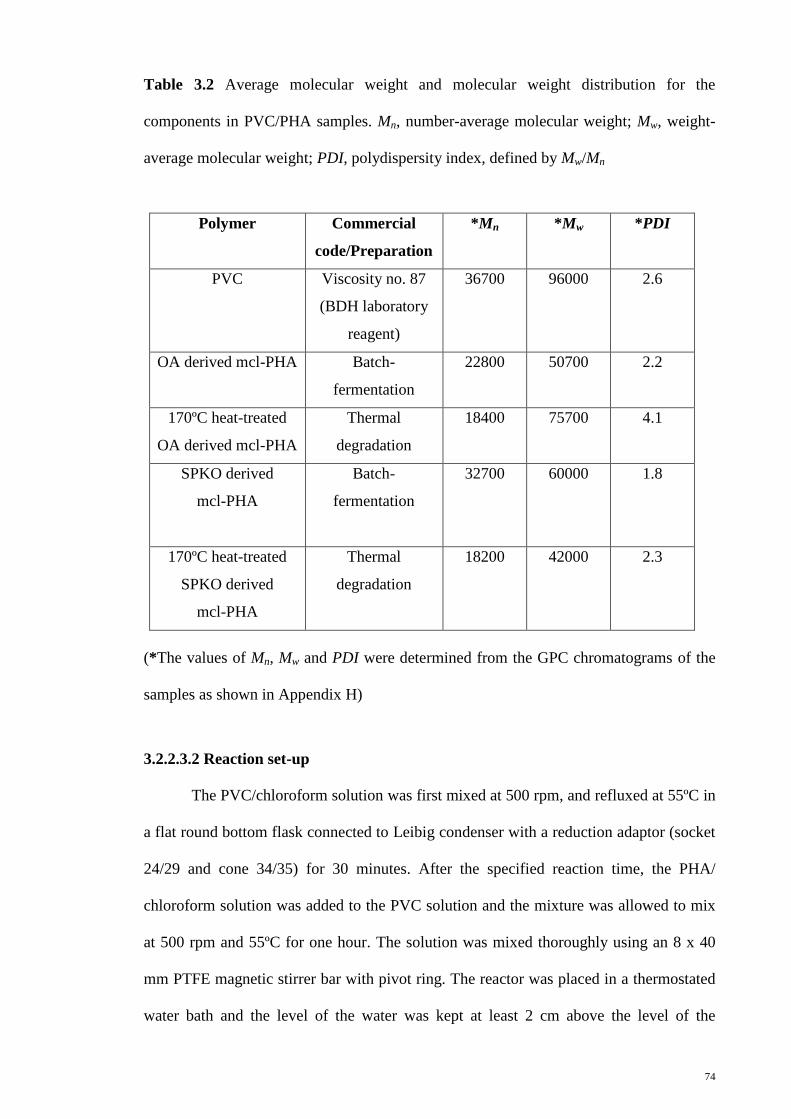
74
Table 3.2 Average molecular weight and molecular weight distribution for the
components in PVC/PHA samples. Mn, number-average molecular weight; Mw, weight-
average molecular weight; PDI, polydispersity index, defined by Mw/Mn
Polymer Commercial
code/Preparation
*Mn *Mw *PDI
PVC Viscosity no. 87
(BDH laboratory
reagent)
36700 96000 2.6
OA derived mcl-PHA Batch-
fermentation
22800 50700 2.2
170ºC heat-treated
OA derived mcl-PHA
Thermal
degradation
18400 75700 4.1
SPKO derived
mcl-PHA
Batch-
fermentation
32700 60000 1.8
170ºC heat-treated
SPKO derived
mcl-PHA
Thermal
degradation
18200 42000 2.3
(*The values of Mn, Mw and PDI were determined from the GPC chromatograms of the
samples as shown in Appendix H)
3.2.2.3.2 Reaction set-up
The PVC/chloroform solution was first mixed at 500 rpm, and refluxed at 55ºC in
a flat round bottom flask connected to Leibig condenser with a reduction adaptor (socket
24/29 and cone 34/35) for 30 minutes. After the specified reaction time, the PHA/
chloroform solution was added to the PVC solution and the mixture was allowed to mix
at 500 rpm and 55ºC for one hour. The solution was mixed thoroughly using an 8 x 40
mm PTFE magnetic stirrer bar with pivot ring. The reactor was placed in a thermostated
water bath and the level of the water was kept at least 2 cm above the level of the
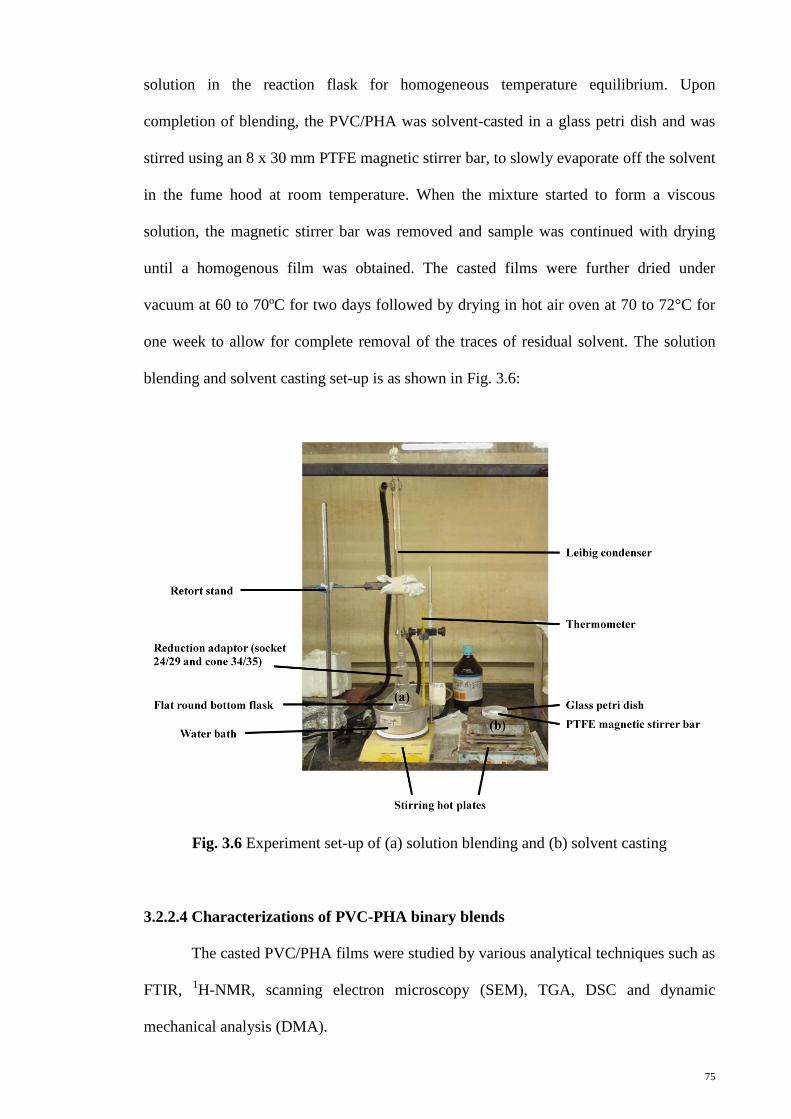
75
solution in the reaction flask for homogeneous temperature equilibrium. Upon
completion of blending, the PVC/PHA was solvent-casted in a glass petri dish and was
stirred using an 8 x 30 mm PTFE magnetic stirrer bar, to slowly evaporate off the solvent
in the fume hood at room temperature. When the mixture started to form a viscous
solution, the magnetic stirrer bar was removed and sample was continued with drying
until a homogenous film was obtained. The casted films were further dried under
vacuum at 60 to 70ºC for two days followed by drying in hot air oven at 70 to 72°C for
one week to allow for complete removal of the traces of residual solvent. The solution
blending and solvent casting set-up is as shown in Fig. 3.6:
Fig. 3.6 Experiment set-up of (a) solution blending and (b) solvent casting
3.2.2.4 Characterizations of PVC-PHA binary blends
The casted PVC/PHA films were studied by various analytical techniques such as
FTIR, 1H-NMR, scanning electron microscopy (SEM), TGA, DSC and dynamic
mechanical analysis (DMA).

76
3.2.2.4.1 Fourier Transform Infrared Spectroscopy
The structural and functional groups present in the PVC, PHA and PVC/PHA
samples were analyzed by Perkin-Elmer FTIR-ATR spectrometer. The IR spectra of the
thin films prepared were scanned at a wavelength of 4000 to 450 cm-1
, with a resolution
of 4 cm-1
and recorded after 4 scans.
3.2.2.4.2 Proton Nuclear Magnetic Resonance Spectroscopy
The chemical structures of PVC, PHA and the binary blends on molecular level
were characterized by proton nuclear magnetic resonance (1H-NMR) spectroscopy using
similar procedure as detailed in Section 3.1.3.8.
3.2.2.4.3 Scanning Electron Microscopy
The PVC/PHA sample films were examined by scanning electron microscopy
(SEM) to study the microstructure and surface morphology of the thin films. SEM
microscopy was performed using a SEM Zeiss Auriga (Germany) at operating voltage of
1 kV, under magnifications of 200 x and 500 x.
The use of SEM allows observation of morphological changes in PVC particles
during plasticization process. The evolution of the initial structure, the solvation of PVC
and plasticizer particles may offer valuable qualitative information. Thus SEM is a
reliable technique to monitor the plasticizing effect of mcl-PHA to PVC.
Uncoated samples were used in this SEM study, using low operating voltage
around 1 kV and LaB6, Field Emission as electron source. Samples were mounted onto
the specimen holder using conducting carbon-impregnated tape. At normal operating
voltages (10 to 30 kV), the contrast differences between phases with different
compositions are inherently lower in resolution in the backscattered (BS) image than the
secondary image (Hobbs & Watkins, 2000). By working at low operating voltages,
77
subtle variations in the chemical compositions of blend components are sufficient to
produce contrast in the secondary images and therefore high-quality images are possible
to be obtained.
3.2.2.4.4 Thermal analysis of PVC/mcl-PHA binary blends
3.2.2.4.4.1 Thermal profile and thermal stability of the blends studied by TGA
Before subjected to further analysis, the dried PVC/mcl-PHA films were
subjected to thermogravimetric analysis (TGA 6, Perkin Elmer, USA). The samples were
heated at a heating rate of 30 K min-1
with the scanning temperature ranging from 50 to
900 °C, under an atmospheric nitrogen flow at the flow rate of 20 ml min-1
, to check for
the presence of trapped solvent contained in the sample.
The thermal profile of the binary blends was then characterized using TGA by
scanning the samples in the similar temperature range at 10 K min-1
, under the similar
flow rate of nitrogen gas.
3.2.2.4.4.2 Thermo-kinetic analysis of PVC/mcl-PHA
Thermo-kinetics of PVC and the PVC/PHA binary blends were studied by using
the data from TGA measurements following similar procedure as detailed in Section
3.1.3.3.3.
3.2.2.4.4.3 Thermal behavior of PVC/mcl-PHA studied by DSC
Tg measurements for PVC and the binary blends were carried out using a Perkin
Elmer Pyris DSC 6 thermal analyzer (USA) at a programmed heating rate of 20 °C min-1
.
The experiments were carried out in the temperature range of 35 to 130ºC under dry
nitrogen atmosphere at a flow rate of 20 ml min-1
. For PVC, approximately 5.0 mg of
sample in the compact powder form was loaded in the aluminium pan while for the

78
PVC/mcl-PHA blends, 5.0 mg of sample films were cut into small pieces and were used
in the testing. The sample was scanned twice with the first scan heating from 35 to
120°C to remove the thermal history of the sample, subsequently cooled to 35°C and
scanned for the second time up to the temperature of 130°C. The Tg of the sample was
determined as the onset of steep change in enthalpy for the second scan. All temperatures
were recorded in degrees Celsius.
3.2.2.4.4.3.1 Theoretical calculation of Tg using Gordon-Taylor equation
Calculation of k-values for Gordon-Taylor equation using Polymath software:
The theoretical value of Tg for the binary blends can be calculated from the
Gordon-Taylor Equation whereby the k-fitting parameter was determined by solving
simultaneous equations using the Polymath○R software as well as experimental Tg
substitution approach. The Gordon-Taylor Equation is shown as:
(3.6)
where Tg is the glass transition temperature of the polymer blend; Tg PHA and Tg PVC is the
glass transition temperature of the respective polymer; W is the weight fraction of the
individual component; k is the model specific parameter
3.2.2.4.4.3.2 Theoretical calculation of Tg using Fox equation
The Tg of the binary blends can also be predicted from the Fox equation as shown
in the following equation:
(3.7)
where W1 and W2 represents the weight fractions of mcl-PHA and PVC; Tg, Tg1 and Tg2
are the glass transition temperatures of the binary blend, mcl-PHA and PVC.

79
The difference of the experimental Tg and that Tg from the Fox equation can be
used to correlate the polymer-plasticizer affinity as the intermolecular forces present in
the polymer system were not taken into consideration in the Fox equation.
3.2.2.4.5 Dynamic Mechanical Analysis
Miscibility between two polymers is usually characterized using dynamic
mechanical analysis (DMA). DMA is also an alternative method to study the viscoelastic
properties of a polymer blend e.g. storage modulus (E’), loss modulus (E”) and loss
angle tangent (tan δ) (Walsh et al., 1982). Generally for an immiscible blend, the loss
modulus curves show the presence of two damping peaks corresponding to the Tgs of
individual components (George et al., 1997). For a highly miscible blend, the curve
shows only a single peak, whereas broadening of the transition occurs in the case of
partially miscible systems (Varughese et al., 1988).
In this study, viscoelastic properties of PVC/PHA polymer blends were
characterized by TA DMA Q800 dynamic mechanical analyzer using a tension film
clamp. Before subjected to the mechanical testing, sample films were prepared using a
hot press (Carver Instrument, Model C, S/N 40000-715). Specimens were heated pressed
to a specific temperature at 4.5 psi applied load and held for 2 min, followed by cooling
to ambient temperature.
Strips of thin films with 30.0 mm fixed length were then mounted to the TA
DMA Instrument and the measurements were made under the temperature scan mode
ranging from -40 to 120 °C, under a heating rate of 5 °C min-1
and at a frequency of 1 Hz.
Liquid nitrogen was used in the Cryospeed, the cooling accessory, to achieve sub-
ambient temperature in this testing.
Mechanical properties of polymer show profound changes in the region of the
glass transitions. For example, the elastic modulus may decrease by a factor of over 1000

80
times as the temperature is raised through the glass transition region. For this reason, Tg
can be considered the most important material characteristic of a polymer as far as
mechanical properties are concerned. Besides that, Tg has important theoretical
implications for the understanding of the macromolecular mobility in the polymer. Tg can
be determined from the onset of the storage modulus (E’) drop, the onset or peak of loss
modulus (E”), and the onset or peak of the tan δ curve (Menard, 1999). In our analysis,
the Tg values were determined from the maximum peak of loss modulus curves. All
temperatures were recorded in degrees Celsius.
3.2.2.4.5.1 Study of elastic modulus of PVC/mcl-PHA blends
Elastic modulus is the mathematical description of a polymer’s tendency to be
deformed elastically when a force is applied to it. It is a measure of the stiffness of a
component. A stiff component, with a high elastic modulus, will show much smaller
changes in dimensions. In general, engineering applications view stiffness as a function
of both the elastic modulus and the geometry of a component.
The elastic modulus equation was adapted from the model equation in the TA
DMA Q800 Equation Guideline, with the relationship of the stiffness, elastic modulus
and sample’s geometry for the sample analyzed on a film tension clamp as shown below:
(3.8)
where K is stiffness (N m-1
); E is elastic modulus (G N m-2
); A is sample cross-sectional
area (cm2) and L is sample length (cm). As the sample has a very small area as compared
to its length, no end effects correction is needed, therefore the modulus equation is
derived as followed:

81
(3.9)
where E is elastic modulus (G N m-2
); A is sample cross-sectional area (cm2); L is sample
length (cm); Ks is measured stiffness (N m-1
)
3.2.2.4.5.2 Comparison of storage modulus for PVC and PVC/mcl-PHA blends
The storage modulus (E’) describes the ability of a polymer to absorb or store
energy. This parameter provides an indication of rigidity of the polymer and its ability to
resist deformation under an applied dynamic stress. High storage modulus indicates rigid
material (Sin, 1998). The decrease in E’ indicates a correlation between film stiffness
and the temperature at which the films become rubbery.
The compositions possess a high storage modulus below the onset of the Tg,
indicative of a rigid polymer. During the transition from glass to rubber, the modulus
falls precipitously. At the end of the glass transition region, the curves display a short
plateau which is followed by a drop in modulus due to viscous flow. This plateau defines
the temperature regime where the composition is soft, flexible and rubber-like (Nielsen
& Landel, 1994). A typical storage modulus versus temperature curve is shown in Fig.
3.7.

82
Fig. 3.7 Storage modulus values change with the temperature and transitions in polymers
can be seen as changes in the E’ curve (Perkin Elmer)
In this study, the storage moduli of the binary blends were compared with the
control PVC to investigate the effect of mcl-PHA on the rigidity of the polymer blends.

83
CHAPTER 4
THERMAL DEGRADATION OF MEDIUM-CHAIN-LENGTH
POLY(3-HYDROXYALKANOATES) (MCL-PHA)
4.1. Thermal properties of mcl-PHA before and after thermal treatment
4.1.1 Characterization by thermogravimetric analysis (TGA)
Thermogravimetric analysis (TGA) was employed to compare the thermal
stability of oleic acid and SPKO-derived mcl-PHA. Fig. 4.1 showed the TGA
thermogram of oleic acid-derived mcl-PHA, which appeared to proceed by one-step
decomposition between 183 to 528ºC, represented by a single peak in the corresponding
derivative thermogravimetric (DTG) curve. During the degradation step, drastic weight
loss of about 99.1% was observed with only traces of carbonaceous residues (carbon
black) remained.
Fig. 4.1 TGA thermogram of mcl-PHA derived from oleic acid

84
For SPKO-derived mcl-PHA, the thermal degradation proceeded in one-step
process between 196 to 555˚C as shown in Fig. 4.2, which was represented by a single
peak in the DTG curve. During the degradation step, weight loss of about 97.7% was
observed with only traces of residues remained.
Fig. 4.2 TGA thermogram of mcl-PHA derived from SPKO
TGA was also employed to compare the thermal stability of control and heat-
treated PHA. Fig. 4.3 showed the thermograms for mcl-PHA derived from oleic acid and
those that had been subjected to thermal treatments. All the curves had the similar shape
with one-stage of degradation. The control, 160˚C and 170˚C-treated PHA started to
decompose at around 200 to 250˚C, with the control PHA registering a lower initial
degradation temperature. The lowest initial degradation temperature was however
registered by the 180˚C-treated PHA which started to decompose at around 100°C. A
possible explanation could be that the 160˚C and 170˚C-treated PHA were slightly
partially degraded, leaving behind polymer chains which were more heat stable, thus

85
showing higher thermal stability. The 180˚C-treated PHA sample contained lower-
molecular weight species which could be more easily disintegrated by heating.
Fig. 4.3 Relative thermal stability of control and heat-treated mcl-PHA derived from
oleic acid, as indicated by different TG curves at 10˚C min-1
For mcl-PHA derived from SPKO, the weight loss curves (TG) for all heat
treated and control PHA were shown in Fig. 4.4. As can be seen in the figure, PHA heat
treated at 160C and 170C showed precipitous weight loss in the temperature range of
220 to 340C, with the onset temperatures shifted to a higher temperature than the
control PHA. However, the decomposition temperature for 180C-treated PHA was
shifted to lower temperature range of about 180 to 330C. TGA indicated that 190˚C-
treated PHA sample showed the lowest thermal stability. Heating mcl-PHA at 160C,
170C and 180ºC resulted in partially intact PHA with comparatively stable

86
decomposition products, whereas mcl-PHA was almost completely decomposed at
190C, thus accounting for the relative thermal stability of the former.
Fig. 4.4 Relative thermal stability of control and heat-treated PHA derived from SPKO
as indicated by different TG curves at 10˚C min-1
4.1.2 Kinetics of thermodegradation of mcl-PHA
Kinetics of mcl-PHA during thermal degradation was studied using Kissinger’s
method through TGA (Doyle, 1961; Erceg et al., 2005). PHA samples were analyzed by
TGA non-isothermal procedures at different heating rates of 10, 15, 20, 25 and 30 K min-
1. Fig. 4.5 (a) and (b) showed TGA and DTG thermograms for oleic acid-derived mcl-
PHA at multiple heating rates. All thermograms in Fig. 4.5 (A) showed only one-step
degradation process between 200 to 400˚C. Increasing heating rate shifted the onset

87
temperature higher. From Fig. 4.5 (B), temperature at the lowest point of the DTG curve
peak corresponded to the temperature where the rate of degradation was at maximum.
Fig. 4.5 (a) TGA and (b) DTG curves of oleic acid-derived mcl-PHA at multiple heating
rates
To obtain thermo-kinetic parameters for oleic acid-derived mcl-PHA through
Kissinger equation, the relationship between heating rates and temperature at maximum
degradation was shown in Table 4.1, and the plot of –ln (q/Tp2) vs. 1/Tp was displayed in
Fig. 4.6. The gradient of the plot was Ed/R, thus degradation activation energy, Ed could

88
be calculated. The intercept at y-axis was equal to –ln (AR/Ed), which then enabled the
pre-exponential factor, A, to be calculated. The calculations of Ed, A and ∆S for the
PHAOA samples were described in Appendix A.
Table 4.1 Data of thermo-kinetic parameters for thermal degradation of oleic acid-
derived mcl-PHA
Heating rate,
q / K min-1
Temperature at maximum
degradation, Tp / K
1/Tp
(x103
K)
-ln (q/ Tp2)
10
15
20
25
30
552
571
576
578
582
1.81
1.75
1.74
1.73
1.72
10.33
9.99
9.72
9.50
9.33
Fig. 4.6 Kissinger plot for determining the activation energy of thermal degradation, Ed,
of the PHA produced from (a) oleic acid and (b) palm kernel oil

89
The degradation activation energy, Ed and pre-exponential factor, A for mcl-PHA
derived from oleic acid were 85.3 kJ mol-1
and 6.07x10⁵
s-1
respectively. The change of
activation entropy (∆S) for the PHA degradation was -139.4 kJ K-1
mol-1
, and the
relatively high Ed indicated that thermal degradation can only occur at high temperatures.
For SPKO-derived mcl-PHA, the TGA and DTG thermograms at five different
heating rates were shown in Fig. 4.7 and Fig. 4.8, respectively. All the TGA
thermograms showed a smooth one-step weight loss curve between 200 to 500˚C.
Increasing heating rate shifted the TGA and DTG curves to higher temperature zone.
Fig. 4.7 TGA curves of SPKO-derived mcl-PHA measured at different heating rate
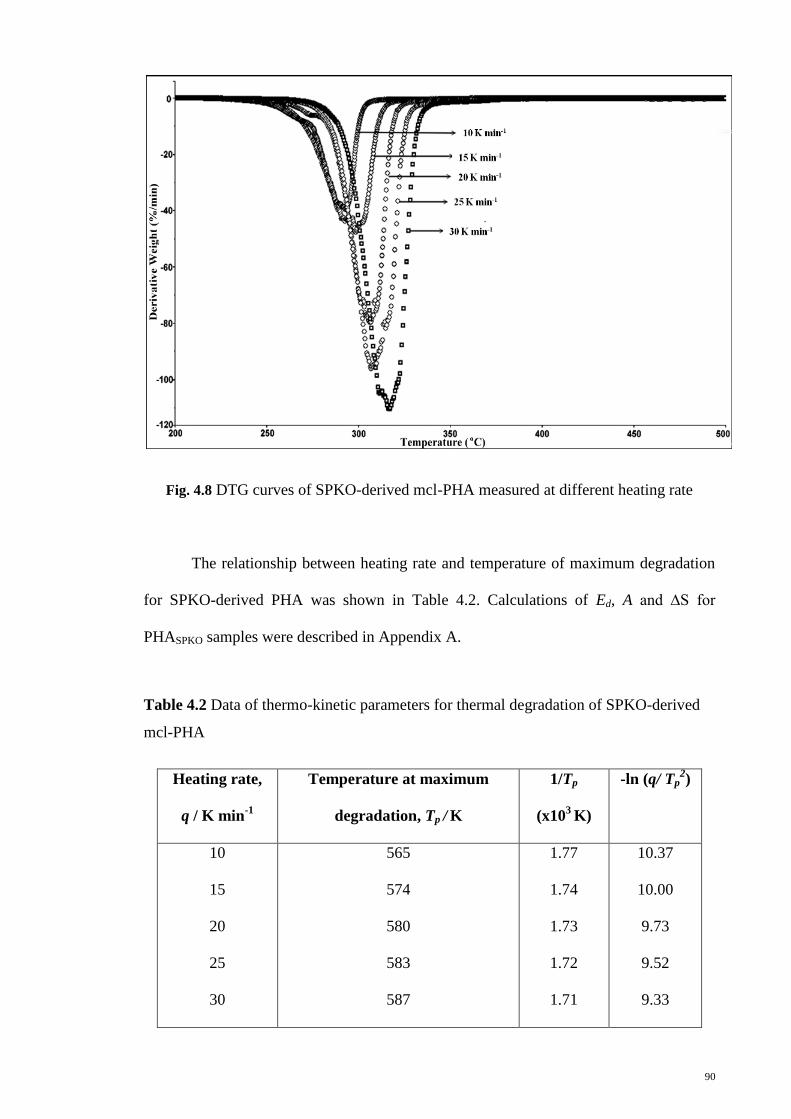
90
Fig. 4.8 DTG curves of SPKO-derived mcl-PHA measured at different heating rate
The relationship between heating rate and temperature of maximum degradation
for SPKO-derived PHA was shown in Table 4.2. Calculations of Ed, A and ∆S for
PHASPKO samples were described in Appendix A.
Table 4.2 Data of thermo-kinetic parameters for thermal degradation of SPKO-derived
mcl-PHA
Heating rate,
q / K min-1
Temperature at maximum
degradation, Tp / K
1/Tp
(x103
K)
-ln (q/ Tp2)
10
15
20
25
30
565
574
580
583
587
1.77
1.74
1.73
1.72
1.71
10.37
10.00
9.73
9.52
9.33

91
Ed and A for the SPKO-derived mcl-PHA were calculated to be 128.9 kJ mol-1
and 1.15x10¹⁰
s-1
, respectively. The change of activation entropy (∆S) estimated from
equation (3.4) had a value of -57.6 J K-1
mol-1
. The relatively small ∆S indicated that the
mcl-PHA may be thermally unstable at high temperatures.
The Ed for mcl-PHA made from oleic acid was much lower than mcl-PHA made
from SPKO. This indicated that mcl-PHA derived from SPKO was more thermal stable
than that derived from oleic acid. The difference in the thermal stability was due to the
fact that the mcl-PHA produced from SPKO consisted of a mixture of monomer units,
derived from the carbon substrate of a mixture of medium- and long-chain fatty acids,
whereas the oleic acid-derived mcl-PHA was produced from a single type of fatty acid.
4.1.3 Characterization by differential scanning calorimetry (DSC)
The thermal properties for both oleic acid and SPKO-derived mcl-PHA before
and after thermal treatments, studied by DSC analysis were shown in Table 4.3. The
DSC thermograms of PHA samples which indicated Tg, Tm and ∆Hm were shown in
Appendix B.

92
Table 4.3 Thermal properties of mcl-PHA derived from oleic acid and SPKO before and
after thermal treatments
Thermal
properties
Oleic acid derived PHA SPKO derived PHA
T g (˚C) Tm (˚C) ∆Hm (J g-1
) Tg (˚C) Tm (˚C) ∆Hm (J g-1
)
Control -44.1 n.d n.d -44 45
9.7
PHA heat treated
at 160˚C
-44.6 n.d n.d -44.2 40 8.6
PHA heat treated
at 170˚C
-45 n.d n.d -45 38 8.3
PHA heat treated
at 180˚C
-48.1 n.d n.d -48.2 n.d. n.d.
PHA heat treated
at 190˚C
- - - -53 n.d. n.d.
Tg: glass transition temperature; Tm: melting temperature; ∆Hm: enthalpy of fusion; n.d:
not detected
For mcl-PHA derived from oleic acid, a low Tg around -44.1˚C was observed
and there was a decrease in Tg from -44.6˚C to -48.1˚C when PHA were heat treated at
160˚C to 180˚C. The decrease was primarily due to the disruption in the tight
arrangement of polymer chains where the weak intermolecular forces were no longer
effective in holding the polymer chains together at high temperatures. However no
melting temperature (Tm) and enthalpy changes were observed in both control and heat-
treated mcl-PHA derived from oleic acid, indicating that this polyester was an
amorphous elastomer.
For mcl-PHA derived from palm kernel oil, low Tg around -44˚C was observed
and there was a shift of Tg from -44.2˚C to -53˚C when the PHA was heat treated at

93
160˚C to 190˚C. The decrease in Tg was attributed to the defects in arrangement of
polymer chains in an ordered manner as the intermolecular attractions weakened at high
temperatures. The melting temperature (Tm) and enthalpy of fusion (∆Hm) of the polymer
can be detected in control, 160ºC and 170ºC-treated PHA only and the crystallinity of the
polymer decreased as reflected in the decrease in ∆Hm. A loss in crystallinity in 180ºC
and 190ºC-treated PHA was mainly due to the increased mobility effect of the polymer
chains where they overlapped at high temperature of decomposition. The crystalline
portions of the polymer were destructed when thermal decomposition temperature
exceeds a certain threshold (Chen et al., 2009).
4.2 Morphological properties of mcl-PHA degradation products
The morphology of the oleic acid-derived mcl-PHA was observed to change
following the thermal treatment. During the heat-treatment at 160°C, 170°C and 180°C,
the color of the mcl-PHA changed from an initial yellow to brown and dark brown with
black precipitates, while viscosity of the sample decreased. PHA that had been heat-
treated at 160˚C and 170˚C produced compounds which did not vaporize. However,
when heated at 180ºC, evolution of gaseous products with pleasant odors accompanied
by bubbles formation in the sample was observed. According to Gonzalez et al. (2005)
when PHA was thermolyzed, monomeric and oligomeric (dimeric, trimeric or tetrameric)
volatile products might be generated. However, oligomers larger than tetramers were not
volatile enough and would remain within the sample. The vapors changed the color of
moist blue litmus paper to red almost immediately indicating an acidic property. It is
believed that the vapors were composed of low molecular weight esters and hydroxyl
acids.
For SPKO-derived mcl-PHA, PHA film started to melt when the temperature
reached 40˚C and formed a yellowish gel beyond 50ºC. As mcl-PHA derived from

94
SPKO had a melting point around 45ºC, heating the polymer above the melting
temperature will change the physical state from solid to gel through the weakening of
intermolecular forces that hold the polymer chains together. However, in 160˚C and
170˚C-treated PHA, the elastic film formed back when cooled to room temperature while
180˚C and 190˚C thermal treatments produced the PHA in the permanent viscous liquid
form. It is suggested that partial crystallinity remained in 160ºC and 170ºC-treated PHA,
which allowed them to form back the morphology resembling the original polymer. The
color of mcl-PHA was changed from yellow to brown/ dark brown followed by dark
brown with black carbon precipitates as the decomposition temperature increased from
160˚C to 190˚C. PHA heat treated at 160˚C and 170˚C produced species that did not
vaporize during thermal processing. However evolution of vapors with a pleasant odor
was detected when the PHA was heated at 180˚C and 190˚C. Vapors from the 190˚C
degrading sample turned moist blue litmus paper to red almost immediately while vapors
from the 180˚C degrading sample took a few minutes to change the color of moist litmus
paper. It is suggested that the vapors were composed of low molecular weight oligoesters
and acids.
4.3 Analysis of the changes in molecular weight and acidity of degradation products
4.3.1 End group analysis
A PHA polymer chain contains equimolar of hydroxyl end group and carboxyl
end group. Thus, the acid number of PHA can be determined by titrating the carboxylic
end groups with standardized potassium hydroxide solution. Number average molecular
weight (Mn) and concentration of carboxylic acid terminals in the PHA are related to acid
number and thus can be determined from the acid value of the polymer. The calculations
of acid number, Mn and concentrations of -COOH terminals for mcl-PHA before and
thermal treatments were shown in Appendix C.

95
The oleic acid-derived PHA had an acid number of 4.0 + 0.04 mg KOH g-1
. This
value increased following temperature treatment: 5.3 + 0.01 mg KOH g-1
(160ºC), 14.6 +
0.02 mg KOH g-1
(170ºC) and 33.1 + 0.3 mg KOH g-1
(180ºC). A PHA polymer chain
contains one unit of hydroxyl and one unit of carboxylic end group. Thus the number of
the carboxylic terminals is equal to the number of the polymer chain. The concentration
of carboxylic acid terminals and the number average molecular weight (Mn) were then
determined. The control mcl-PHA derived from oleic acid had the highest Mn of 13900 g
mol-1
, while the Mn of the heat-treated PHA decreased with increasing degradation
temperatures. The Mn of the 160°C, 170°C and 180°C-treated PHA was 77%, 28%, and
12% of the Mn of the control PHA, respectively. The observed progressive decrease in
Mn was proposed to proceed via the chain scission of the polymer during thermal
degradation. Concentration of carboxyl end groups also increased with higher
temperature, presumably due to faster rate of decomposition. The acid number,
concentration of terminal carboxylic acid and the number average molecular weight of
both control and heat-treated PHA were shown in Table 4.4. The data supported the view
that mcl-PHA were thermally decomposed at 160°C, 170°C and 180°C. However the Mn
results obtained were absolute values and were independent of the distribution of
molecular weights in the polymer.

96
Table 4.4 End group analysis of oleic acid-derived mcl-PHA before and after thermal
treatments
PHA samples Control Heat treated
at 160°C
Heat treated
at 170°C
Heat treated
at 180°C
Average acid
number (AN) /
mg KOH g-1
4.0 + 0.04
5.3 + 0.01
14.6 + 0.02
33. 1 + 0.3
Number average
molecular weight
(Mn) /g mol-1
13900 + 145
10600 + 28
3900 + 6
1700 + 14
-COOH terminal
concentration
/mol g-1
7.2 x 10⁻⁵
9.4 x 10⁻⁵
2.6 x 10⁻⁴
5.9 x 10⁻⁴
Table 4.5 summarized the acid number, number average molecular weight and –
COOH terminal concentration of the SPKO-derived PHA as well as the 160˚C, 170˚C,
180˚C and 190˚C-treated PHA. Mcl-PHA derived from SPKO contained an initial acid
number of 5.2 + 0.01 mg KOH g-1
. The acid number of PHA increased when they were
heat treated at temperatures of 160˚C, 170˚C, 180˚C and 190˚C. The heat-treated PHA
also showed higher concentration of carboxylic terminals than the control PHA. Control
mcl-PHA showed initial Mn of 10900 + 15 g mol-1
. Heating PHA polymer at 160˚C,
170˚C and 180˚C for 30 minutes resulted in the progressive reduction of Mn value,
producing a mixture of low molecular weight hydroxyl alkanoic acids with 77.3%, 64.8%
and 41.4% of initial Mn value, respectively. When PHA sample was heated at 190˚C
under the same condition, the Mn value of the degradation products was drastically

97
reduced to 14.6% of initial Mn value. The observed progressive decrease in Mn was
proposed to proceed via the chain scission of PHA at moderately high temperature
decomposition. The Mn results obtained from end group analysis were absolute values
and were independent of the distribution of molecular weights in the polymer.
Table 4.5 End group analysis of SPKO-derived mcl-PHA before and after thermal
treatments
PHA samples Control Heat
treated at
160°C
Heat
treated at
170°C
Heat
treated at
180°C
Heat
treated at
190ºC
Average acid
number (AN) /
mg KOH g-1
5.2 + 0.01
6.7 + 0.2
7.9 + 0.04
12.4 + 0.2
35.3 + 0.6
Number average
molecular
weight (Mn) /
g mol-1
10900 + 15
8400 + 197
7100 + 32
4500 + 64
1600 + 26
-COOH terminal
concentration
/mol g-1
9.2 x 10⁻⁵
1.2 x 10⁻⁴
1.4 x 10⁻⁴
2.2 x 10⁻⁴
6.3 x 10⁻⁴

98
4.3.2 Gel permeation chromatography (GPC) analysis
The average molecular weight and molecular weight distribution of both oleic
acid and SPKO-derived control and heat-treated polymers were determined by GPC
analysis. The GPC column was calibrated using polystyrene (PS) standards, and hence
the number-average molecular weight (Mn) and weight-average molecular weight (Mw)
values were relative to PS. The GPC chromatograms of PHA samples were shown in
Appendix D and the results were summarized in Table 4.6. Results showed that Mn of
oleic acid-derived PHA decreased with increase in polydispersity index (PDI) when the
polymers were heat treated from 160˚C to 180˚C. The decrease in Mn values followed the
similar trend as in the observed results of the end group analysis. Increased PDI in heat-
treated PHA indicated the polymers had broader molecular weight distribution with more
lower-molecular-weight species generated by the random scission of the ester linkages,
as a result of thermal decomposition at high temperature.

99
Table 4.6 Average molecular weight and molecular weight distributions of control and
heat-treated mcl-PHA derived from oleic acid and SPKO
GPC analysis
Oleic acid-derived mcl-PHA
SPKO-derived mcl-PHA
1Mn (Da)
2Mw (Da)
3PDI Mn (Da) Mw (Da) PDI
Control PHA 30600 60900 2.0
44000 92200 2.1
PHA heat treated
at 160˚C
29300 71400 2.4 41300 78700 1.9
PHA heat treated
at 170˚C
3500 16200 4.7 39100 74400 1.9
PHA heat treated
at 180˚C
2200 9000 4.0 13700 28500 2.1
PHA heat treated
at 190˚C
- - - 3100 13300 4.3
1Mn: number-average molecular weight;
2Mw: weight-average molecular weight;
3PDI: polydispersity index, defined by Mw/Mn
Table 4.7 also showed that Mn of SPKO-derive PHA decreased from 41300 g
mol-1
to 3100 g mol-1
when the polymers were heat treated from 160˚C to 190˚C. These
results corroborated well with the decrease in Mn values in end group analysis as well.
Increase in polydispersity index (PDI) in 180ºC and 190ºC-treated PHA was observed,
and this indicated that these polymers had broader molecular weight distribution, as
various lower-molecular-weight species were generated at high temperature of
degradation.

100
4.3.3 Acidity of degradation products: oligomeric hydroxyalkanoic acids
Low molecular weight hydroxyalkanoic acids are weak acids in nature and
dissociate partially in aqueous environment as shown in the equilibrium expression
below:
(4.1)
The acid dissociation constant, Ka of hydroxyl acid is given by the following equation:
(4.2)
where
Ionization of these weak acids in water is an endothermic process. An increase in
temperature would favor the formation of hydrogen ions and the conjugate base.
Therefore dissolving the decomposition products in distilled water at 95°C would results
in higher dissociation of the weak acids in the aqueous solution.
Hydroxyalkanoic acid is acidic in nature because the dissociation of the weak
acid gives a hydroxy-carboxylate ion and hydrogen ion in aqueous. Both the carboxyl
group and the carboxylate anion are stabilized by resonance. This stabilization of
conjugate base leads to an increased acidity of the carboxylic acid (R-COOH). This also
shifts the tendency of the equilibrium to the right hand side. The resonance effect
described here is the delocalization of the p-orbital π electron as shown in Fig. 4.9.
R’ R
’
l l
H(O-CH-CH2-CO)nOH (aq) H(O-CH-CH2-CO)nO-(aq)
+ H
+(aq)
Ka = [R-COO-][H
+]/[R-COOH]
R’
l R= HO-(CH-CH2)n

101
Fig. 4.9 Resonance structure of carboxyl group
Electronegative substituents increase the acidity of carboxylic acid by
withdrawing electrons from the carboxyl group and lower the negative charge on
carboxylate ion and therefore stabilize the ion. This is illustrated in Fig. 4.10.
Fig. 4.10 Electron withdrawal by Z, an electronegative substituent
In the case of hydroxyalkanoic acids, hydroxyl group is the electronegative
substituent which withdraw π electron from carboxyl group. The closer the substituent to
the carboxyl group, the greater is its effect and thus the stronger is the acid. However,
hydrogen and alkyl substituent on the α-carbon assist in inductive electron shift on the
carboxyl group, where electrons are being donated to the carbonyl group and thus
decreasing the acidity of carboxylic acid. This is illustrated in Fig. 4.11.
Fig. 4.11 Inductive effect of R, alkyl group

102
The influence of carbon chain length and structural features is significant for the
acidity of oligomeric hydroxyalkanoic acids. The larger the number of carbon atoms in
the acid, the stronger the electron donating effect of alky group and therefore the weaker
is the acid. Bulky alkyl substituent will also insulate the electronegativity of hydroxyl
group to the carboxyl group and thus reduce the acidity. This is the reason for the
insolubility of high molecular weight hydroxyl alkanoic acids in water.
For oleic acid-derived mcl-PHA, the acidity of 160˚C degradation products could
not be determined as they were partially degraded polymer with high Mn value of 10600
g mol-1
. These high molecular weight polyesters appeared to be insoluble in water and
thus unable to ionize in aqueous environment. Both 170˚C and 180˚C degradation
products were dissolved in distilled water at 95°C and gave pH values of 5.7 + 0.2 and
5.8 + 0.01, respectively. However, experimental pH values obtained were not the actual
pH values for the hydroxyl acids as hydrogen ions in the weak acid solution may
contributed by the dissociation of weak carbonic acid as well as water molecule itself.
Thus the actual pH values for both 170˚C and 180˚C degradation products were
determined through the calculation of acid dissociation constant (Ka) and pKa of
dissociable hydroxyl acids. The smaller the pKa value, the stronger is the acid.
The degree of dissociation (α) of the hydroxyl acids and the standard Gibbs free
energy change (∆G°) from the dissociation of PHA degradation product at 170˚C and
180˚C were also calculated using the Ka and pKa values. Determinations of pH, Ka, pKa,
α and ∆G° of PHA degradation products were described in Appendix E. The calculated
pH, Ka, pKa, α and ∆G° values were shown in Table 4.7. At 95°C, ∆G° > 0 for both
170°C and 180°C- treated PHA, showing that dissociation of the weak hydroxyalkanoic
acids into hydroxyl-carboxylate ion and hydrogen ion was not spontaneous, requiring
energy input into the system to occur. ∆G° was lower for 180°C-treated PHA compared

103
to 170°C-treated PHA, showing that dissociation of 180°C decomposition products in
aqueous solution occurred more readily in aqueous solution at 95°C compared to 170°C
decomposition products.
Table 4.7 Effective concentration of carboxyl end groups, acid dissociation constant (Ka),
pKa, pH, degree of dissociation (α) and standard Gibbs free energy change (∆G°) for
160ºC, 170ºC and 180ºC degradation products derived from oleic acid
Oleic acid derived PHA
Thermal degradation temperatures
160ºC 170ºC 180°C
-COOH terminal
concentration, mol g-1
n.d. 2.6 x 10⁻⁴
5.9 x 10⁻⁴
Acid dissociation constant
(Ka), mol dm-3
n.d. 4.2 x 10⁻¹²
1.3 x 10⁻¹⁰
pKa n.d.
11.5 + 0.3 9.9 + 0.01
Acidity (pH) n.d.
6.0 + 0.2 5.1 + 0.007
Degree of dissociation, α n.d. 3.9 x 10⁻⁶
1.5 x 10⁻⁵
Standard Gibbs free energy
change (∆G°), kJ mol-1
n.d 80.7 + 2.4 69.7 + 0.1
n.d.: not detected
For mcl-PHA derived from SPKO, the acidity of 160˚C and 170˚C
decomposition products could not be determined as they were partially decomposed
polymer with high Mn values. These high molecular weight polyesters were relatively
insoluble in water with almost negligible ionization in aqueous solution. Both 180˚C and

104
190˚C decomposition products dissolved in distilled water at 95°C and gave pH values of
5.7 + 0.09 and 4.7 + 0.01, respectively. However, experimental pH values obtained were
not the actual pH values for the hydroxyl acids as hydrogen ions in the weak acid
solution were contributed by the dissociation of weak carbonic acid as well as water
molecule itself. Thus the actual pH values for both 180˚C and 190˚C decomposition
products were determined through the calculation of Ka and pKa of dissociable hydroxyl
acids.
The degree of dissociation (α) of the hydroxyl acids and the standard Gibbs free
energy change (∆G°) from PHA decomposition at 180˚C and 190˚C were calculated
using the Ka and pKa, and the calculations were shown in Appendix E. The standard
Gibbs free energy change for both 180°C and 190°C heat treated PHA were positive,
showing that formation of hydroxyl-carboxylate and hydrogen ions from the dissociation
of weak hydroxyalkanoic acids in aqueous solution was not spontaneous. ∆G° was lower
for 190°C-treated PHA compared to 180°C-treated PHA. This showed that dissociation
of 190°C decomposition products in aqueous solution occurred more readily than the
180°C decomposition products at 95°C in aqueous solution.
The calculated acid dissociation constant (Ka), pKa, pH, degree of dissociation (α)
and standard Gibbs free energy change (∆G°) values were shown in Table 4.8.

105
Table 4.8 Effective concentration of carboxyl end groups, acid dissociation constant (Ka),
pKa, pH, degree of dissociation (α) and standard Gibbs free energy change (∆G°) for
160ºC, 170ºC, 180ºC and 190˚C-treated SPKO derived mcl-PHA degradation products
PHA sample
Thermal degradation temperatures
160ºC 170ºC 180°C 190°C
-COOH terminal
concentration, mol g-1
n.d.
n.d.
2.2 x 10⁻⁴
6.3 x 10⁻⁴
Acid dissociation constant
(Ka), mol dm-3
n.d.
n.d.
1.7 x 10⁻¹²
4.7 x 10⁻¹⁰
pKa
n.d.
n.d.
11.8 + 0.3
9.3 + 0.03
Acidity (pH)
n.d.
n.d.
6.3 + 0.2
4.8 + 0.01
Degree of dissociation (α)
n.d.
n.d.
2.6 x 10⁻⁶
2.7 x 10⁻⁵
Standard Gibbs free
energy change (∆G°), kJ
mol-1
n.d
n.d
83.4 + 2.2
65.8 + 0.1
n.d: not detected
4.4 Structural analysis of control and heat-treated mcl-PHA
4.4.1 Monomer composition analysis by gas chromatography (GC)
From the GC analysis, oleic acid-derived mcl-PHA contained four saturated
monomers: 3-hydroxyhexanoate (C6), 3-hydroxyoctanoate (C8), 3-hydroxydecanoate
(C10) and 3-hydroxydodecanoate (C12) and three unsaturated monomers: 3-
hydroxydodecenoate (C12:1), 3-hydroxytetradecenoate (C14:1) and 3-
hydroxytetradecenoate (C14:2). The polyester mainly consisted of the saturated units, C8
(42.3 wt %) and C10 (30 wt %), which seemed to be a common feature for homology

106
Group I Pseudomonads (Huisman et al., 1989; Madison & Huisman, 1999). The
unsaturated monomer content in control PHA was 13.6% of the total units. The changes
in monomeric composition of PHA before and after thermal treatments were shown in
Fig. 4.12 and the GC chromatograms of PHA samples were shown in Appendix F. The
trend of variation in monomeric compositions was almost similar in 160˚C and 170˚C-
treated PHA. The unsaturated monomer content of the polymer decreased when PHA
was heat treated at 160ºC (9.1 wt %) and 170ºC (8.9 wt %). A decrease in the number of
unsaturated monomers supported the idea that oxidative cleavage at unsaturated linkages
in the side chain could have occurred at high temperature. Indeed, the number of shorter
saturated monomers (C6, C8, C10 and C12) had increased in heat-treated PHA. However,
the unsaturated monomer content in 180˚C-treated PHA (12.7 wt %) was higher than
both 160˚C- and 170˚C- treated PHA. Besides that, small amounts of C4:1 (1 wt %) and
C6:1 (1 wt %) monomers were detected in 180˚C-treated PHA. It is postulated that at
180˚C, in the presence of excess terminal carboxylic acids, a small proportion of low-
molecular-weight fragments generated from the oxidative cleavage of unsaturated bond
in the side chain would be dehydrated, generating non-hydroxylated C4:1 and C6:1
fragments.

107
Fig. 4.12 Relative monomer compositions of control and partially degraded PHA derived
from oleic acid
GC analysis showed that the methanolyzed mcl-PHA produced from SPKO
composed of five saturated monomers: 3-hydroxyhexanoate (C6), 3-hydroxyoctanoate
(C8), 3-hydroxydecanoate (C10), 3-hydroxydodecanoate (C12), 3-hydroxytetradecanoate
(C14) and one unsaturated monomer, 3-hydroxy-5-tetradecenoate (C14:1∆5) with C8 as the
predominant monomer. Since palm kernel oil contains only 18% of unsaturated fatty
acids, the amount of unsaturated monomers present in the SPKO derived mcl-PHA will
be lower compared to the PHA derived from unsaturated fatty acids i.e. oleic acid. The
GC chromatograms of 160°C to 180˚C-treated PHA were almost identical to the
chromatogram obtained from the control PHA (see Appendix F). On the other hand, the
190°C-treated PHA showed 3 additional peaks with the retention time of 4.1, 5.5 and 6.8
min which presumably corresponded to C4:1, C6:1 and C8:1 monomers.

108
Fig. 4.13 showed the variation of monomer compositions for the control PHA
derived from SPKO and the thermally decomposed products. The relative monomer
compositions of the 160°C to 180°C decomposed products were almost similar to that of
the control PHA i.e. they were mainly comprised (in wt %) of 5.8 C6, 46.1 C8, 31.0 C10,
13.9 C12, 1.3 C14 monomers and 1.9 of unsaturated units. The unsaturated monomer
content increased to 8.1 wt % while the weight percentage of C8 (43.2 wt %), C10 (29.0
wt %) and C12 (12.8 wt %) monomers had decreased when the PHA was decomposed at
190ºC, with three new unsaturated monomers being detected: C4:1 (3 wt %), C6:1 (2.2
wt %) and C8:1 (1.3 wt %). These were most likely to be formed from the dehydration of
the terminal -OH and were consistent with the observations from FTIR and NMR
measurements discussed later.
Fig. 4.13 Relative monomer compositions of control and partially degraded PHA derived
from SPKO

109
When heat treated at 160°C to 180ºC, the palm kernel oil derived mcl-PHA
generated a mixture of hydroxyl acids from the hydrolysis of the ester linkages. At 190ºC,
a proportion of the hydroxyl acids could have undergone dehydration to produce
RCH=CH– terminals. These results supported the proposition that at high temperature
such as 190˚C, some side chain fragments in the PHA would undergo thermal cracking,
producing small proportions of volatile alkenes and thus shortened the side chain by
elimination of two to four-carbon chain length molecules. The terminal alcohol of these
shorter polymer chains would be dehydrated producing non-hydrated alkenoic acid with
shorter polymer side chains.
4.4.2 Fourier transform infrared spectroscopic (FTIR) analysis
The FTIR spectrum of oleic acid-derived mcl-PHA was shown in Fig. 4.14. The
presence of an ester structure was clearly indicated by the absorbance bands at frequency
of 1742, 1259 and 1168 cm−1
: the first corresponded to the stretching of ester C=O and
the latter two to the stretching of C-O in saturated aliphatic esters. The aliphatic nature
was also clearly shown by the bands from 2800 to 3000 cm−1
(CH3- and CH2-stretching),
bands at 1379 and 1459 cm−1
(C-CH3 and C-CH2 bending) and band at 724 cm-1
( (CH2)n
rocking). The C-O stretching of secondary alcohol structures contributed to the band at
1120 cm−1
. The weak absorption peak at 966 cm-1
indicated the presence of trans-
configuration double bond (=C-H bending) in the side chain of some monomers in mcl-
PHA.
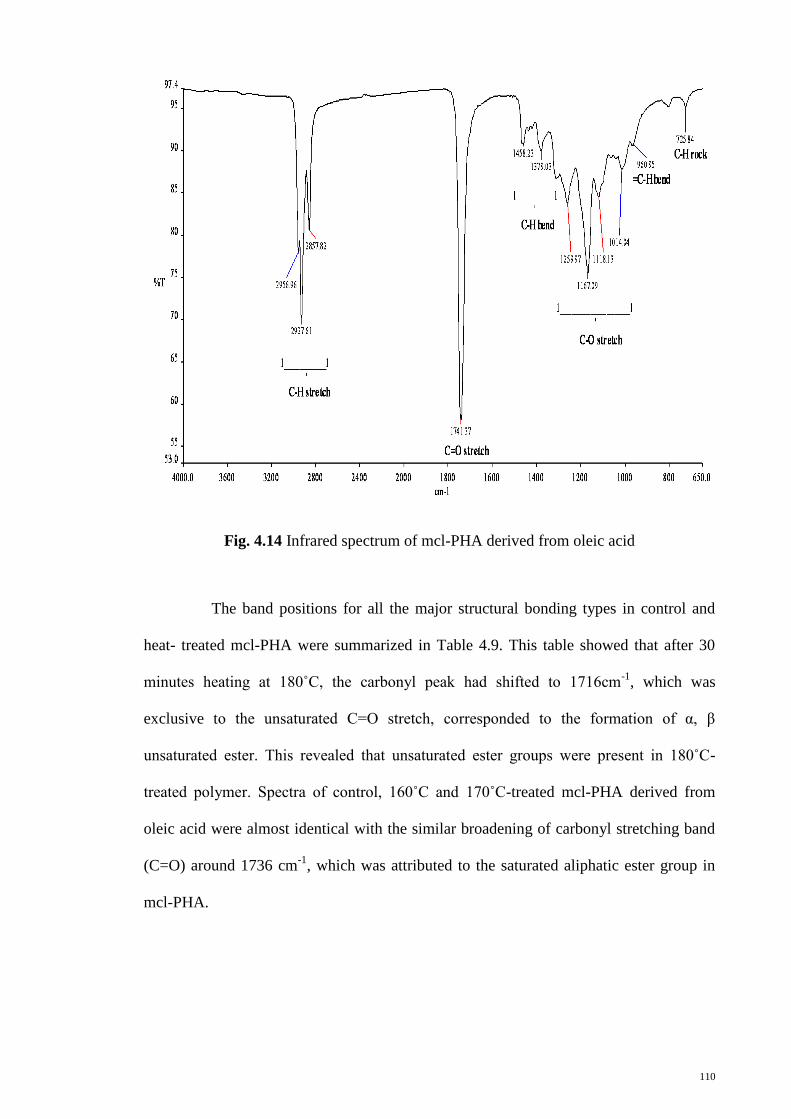
110
Fig. 4.14 Infrared spectrum of mcl-PHA derived from oleic acid
The band positions for all the major structural bonding types in control and
heat- treated mcl-PHA were summarized in Table 4.9. This table showed that after 30
minutes heating at 180˚C, the carbonyl peak had shifted to 1716cm-1
, which was
exclusive to the unsaturated C=O stretch, corresponded to the formation of α, β
unsaturated ester. This revealed that unsaturated ester groups were present in 180˚C-
treated polymer. Spectra of control, 160˚C and 170˚C-treated mcl-PHA derived from
oleic acid were almost identical with the similar broadening of carbonyl stretching band
(C=O) around 1736 cm-1
, which was attributed to the saturated aliphatic ester group in
mcl-PHA.

111
Table 4.9 FTIR correlations of various functional groups in control and heat-treated mcl-
PHA derived from oleic acid
Fig. 4.15 showed the FTIR spectra of the oleic acid-derived mcl-PHA and the
degradation products at 160˚C, 170˚C and 180˚C. The FTIR spectra of the control, 160˚C
and 170˚C-treated PHA (Fig. 4.15(a), (b) and (c)) were similar, with the carbonyl
stretching band (C=O) at around 1736 cm-1
, which was attributed to the saturated
aliphatic ester group in mcl-PHA. However the spectrum for the 180˚C-treated PHA (Fig.
4.15(d)) showed two additional absorption peaks, indicated by arrows at 1653 cm-1
and
Functional
group
Alkane Ester Alkene
Type of
vibration
/Bond
Wave
number/
cm-1
C-H stretch
(a) CH3 -
(b) -CH2 -
(c) -CH2 -
C-H bend
(a) -CH2-
(b) CH3-CH2
C-H rock
-(CH2)n -
C=O stretch
(a) saturated
aliphatic
(b) α, β
unsaturated
C-O
stretch
=C-H
bend
(out of
plane)
(a) -C=C-
Stretch
=C-H bend
(a) In plane
(b) Out of
plane
Control PHA
(a) 2956
(b) 2928
(c) 2858
(a) 1459
(b) 1379
724 (a) 1742 1000-
1320
966 -
PHA heat
treated at
160˚C
(a) 2956
(b) 2926
(c) 2857
(a) 1460
(b) 1379
724 (a) 1736 1000-
1320
966 -
PHA heat
treated at
170˚C
(a) 2951
(b) 2925
(c) 2857
(a) 1459
(b) 1379
723 (a) 1736 1000-
1320
964
756
-
PHA heat
treated at
180˚C
(a) -
(b) 2920
(c) 2852
(a) 1461
(b) 1374
724 (b) 1716 1000-
1320
- (a) 1653
(b) 1414
(c) 983

112
1414 cm-1
. The band centered at 1653 cm-1
was assignable to non-conjugated C=C
stretching vibration, and the one at 1414 cm-1
was due to =CH- bending. These signals
indicated the presence of terminal vinyl groups.
Fig. 4.15 FTIR spectra of oleic acid-derived mcl-PHA: (a) Control PHA, (b) PHA heat
treated at 160˚C, (c) PHA heat treated at 170˚C and (d) PHA heat treated at 180˚C. Two
distinct –C=C– peaks were observed in the 180˚C-treated PHA, corresponding to the
unsaturated terminal group
The infrared spectrum of SPKO-derived mcl-PHA in Fig. 4.16 showed the
following bands: 2800 to 3000 cm−1
corresponded to -CH3 and -CH2- stretching,
respectively; 1379 and 1458 cm−1
for -C-CH3 and -C-CH2- bending, and 725 cm-1

113
corresponded to -CH2- rocking. The presence of an ester structure was clearly indicated
by the bands at 1741, 1259 and 1167 cm−1
: the first corresponded to the stretching of
ester C=O and the rest were assigned to the stretching of C-O in saturated aliphatic esters.
The C-O stretching of secondary alcohol structures contributed to the band at 1118 cm−1
.
The weak absorption peak at 965 cm-1
indicated the presence of double bond (=C-H
bending) in the side chain of some monomers in the mcl-PHA.
Fig. 4.16 Infrared spectrum of mcl-PHA derived from SPKO
The band positions for all the major structural bonding types in the control and
heat-treated mcl-PHA derived from SPKO were summarized in Table 4.10.

114
Table 4.10 FTIR correlations of various functional groups in control and heat-treated
mcl-PHA derived from SPKO
Fig. 4.17 showed the overlay FTIR spectra of SPKO-derived mcl-PHA and those
which were heat-treated at 160°C, 170°C, 180°C and 190°C. For the infrared spectrum of
190˚C-treated PHA, an additional absorption peak was seen at 1654 cm-1
, which
indicated the presence of non-conjugated RCH=CH– terminal vinyl group.
Functional
group
Alkane Ester Alkene
Type of
vibration /
Bond
Wave
number/
cm-1
C-H stretch
(a) CH3 -
(b) -CH2 -
(c) -CH2 -
C-H bend
(a) -CH2-
(b) CH3-CH2
C-H rock
-(CH2)n -
C=O
stretch
( saturated
aliphatic)
C-O
stretch
=C-H
bend
(out of
plane)
-C=C-
stretch
Control PHA
(a) 2957
(b) 2928
(c) 2858
(a) 1458
(b) 1379
726 1741 1000-
1320
961 -
PHA heat
treated at
160˚C
(a) 2952
(b) 2928
(c) 2858
(a) 1464
(b) 1386
721 1742 1000-
1320
966 -
PHA heat
treated at
170˚C
(a) 2957
(b) 2928
(c) 2858
(a) 1466
(b) 1379
725 1743 1000-
1320
965 -
PHA heat
treated at
180˚C
(a) 2952
(b) 2928
(c) 2858
(a) 1465
(b) 1379
725 1740 1000-
1320
966 -
PHA heat
treated at
190˚C
(a) 2957
(b) 2929
(C) 2859
(a) 1459
(b) 1379
725 1740 1000-
1320
- 1654

115
Fig. 4.17 FTIR spectra of SPKO-derived mcl-PHA. (a) Control PHA, (b) PHA heat
treated at 160˚C, (c) PHA heat treated at 170˚C, (d) PHA heat treated at 180˚C and (e)
PHA heat treated at 190˚C. The arrow indicated a distinct –C=C– peak, corresponding to
the unsaturated terminal group in 190ºC-treated PHA
4.4.3 Proton nuclear magnetic resonance (1H-NMR) spectroscopic analysis
Fig. 4.18 showed the 1H-NMR spectrum for the oleic acid-derived mcl-PHA. The
peak e at 0.8 ppm and peak d at 1.2 ppm were assigned to the methyl and methylene
group in the side chain respectively. The two peaks b and a around 2.5 ppm and 5.1 ppm
represented the methylene group at the α-position and methine group at the β-position of
the ester respectively. The α-hydrogens in esters were deshielded by the adjacent
carbonyl group whereas β-hydrogens on the carbon attached to the single-bonded oxygen
were deshielded directly by the electronegative oxygen. While the peak shown at 3.7
ppm was assigned to the proton of the hydroxyl groups and peak shown at 2.1 ppm was

116
assigned to the proton attached to the carbon next to carboxyl groups. The signals for the
olefinic protons in the side chain appeared in the expected region between 5.2 and 5.3
ppm. Another characteristic signal was the one appeared at 1.9 and 2.4 ppm which
belonged to protons adjacent to the double bonds. Remaining signal at 7.27 ppm was due
to the CHCl3 in CDCl3.
Fig. 4.18 400–MHz 1H-NMR spectrum of oleic acid-derived mcl-PHA. The protons in
the mcl-PHA structure were denoted by the corresponding letters in the spectrum
The 1H-NMR spectrum of oleic acid-derived mcl-PHA produced by
Pseudomonas putida showed peaks at almost identical chemical shift in the spectrum
studied by Huijbert et al. (1992) and Tan et al. (1997). According to Huijbert et al., the
chemical shifts of peak j, k, g and h indicated the presence of unsaturated groups in some
of the monomers’ side chains. The peak f and l with chemical shift 1.9 ppm and 2.8 ppm

117
were assigned to allylic methylene group and diallylic methylene group. Chemical shift
of peak i was assigned to the methylene group between the double bond in the side chain
and the hydroxyl group of ester.
Fig. 4.19 compared the 1H-NMR spectra of oleic acid-derived mcl-PHA and
those which had been heat treated at 160˚C, 170˚C and 180˚C. The intensity ratio of
signal a (proton originated from β-methine group adjacent to esterified alcohol group) to
signal e (proton originated from side chain methyl group) decreased in proportion to
increasing temperature. This showed that hydrolysis of ester bond had occurred,
generating free alcohol end groups as the β-hydrogen was no longer deshielded by the
electronegative oxygen in the ester group. This corresponded to an increase of intensity
of the alcohol end groups, as shown by the proton resonance at 3.7 ppm.

118
Fig. 4.19 1H–NMR spectra of oleic acid-derived mcl-PHA: (a) control, (b) heat-treated at
160˚C, (c) heat-treated at 170˚C and (d) heat-treated at 180˚C. The ratio of proton a
(methine group) to proton e (methyl group) had decreased, as hydrolysis of ester linkages
would producing more hydroxyl acids with the –OH end group at 3.7 ppm
The 1H-NMR spectra of 160˚C and 170˚C-treated PHA were almost identical
to the spectrum of control PHA. Nevertheless, two extra multiplet peaks (m and n) were
observed at position between 5.0 to 7.0 ppm in the 180˚C-treated PHA as shown in Fig.
4.20. These could be attributed to the olefinic protons in the unsaturated end structure in
the degradation product. This observation agreed with the presence of monounsaturated

119
terminal structure of CH3-CH=CH-C(O)O-R in the thermally degraded short-chain-
length poly(3-hydroxyalkanoates) (scl-PHA) as reported by Kunioka and Doi (1989).
Fig. 4.20 Expanded 1H-NMR spectrum of oleic acid-derived PHA heat treated at 180˚C,
where the olefinic protons m and n were appeared at 5.8 and 6.9 ppm
The elucidation of intensity ratio of hydroxyl terminals to carboxyl terminals
in 160˚C, 170˚C and 180˚C-treated PHA were shown in Fig. 4.21. From the 1H-NMR
spectra of the heat-treated PHA samples, amount of OH terminal groups and COOH
terminal groups were almost similar in the 160˚C and 170˚C-treated PHA. These
observations suggested that hydrolysis at ester linkages had occurred, leading to the
production of a mixture of oligomeric hydroxyl acids methyl ester. However the
presence of more carboxylic terminals than hydroxyl terminals was observed in spectrum
of 180˚C-treated PHA. One plausible reason for this phenomenon was that the hydroxyl
acids tend to dehydrate at high temperature.

120
--CH*-COOH
l
R
--CH*OH
l
R
---CH*-COOH
l
R
----CH*-OH
l
R
--CH*-OH
l
R
[-OH]/[-COOH]
=0.082/0.094
[-OH]/[-COOH]
=0.18/0.19
[-OH]/[-COOH]
=0.11/1.23
--CH*-COOH
l
R
(b) (c)(a)
ppm ppm ppm
Fig. 4.21 1H-NMR spectra of the thermolyzed mcl-PHA samples derived from oleic acid:
(a) heat treated at 160˚C, (b) heat treated at 170˚C and (c) heat treated at 180˚C. A lower
level of -CH*-OH group than –CH*-COOH group was observed in the 180˚C-treated
PHA
The 1H-NMR spectrum for mcl-PHA derived from SPKO was shown in Fig. 4.22.
In the spectrum, peak e at 0.8 ppm and peak d at 1.2 ppm were assigned to –CH3 and –
CH2– in the alkyl pendant groups respectively. The two peaks a and b around 5.1 ppm
and 2.5 ppm represented the methine group at the β-position (~~COO-CHR~~) and
methylene group at the α-position of the ester (~~CH2-COO~~) respectively. Finally, the
peaks for the olefinic protons in the side chain appeared in between 5.3 and 5.5 ppm. The
peaks at 2.1 ppm and 3.7 ppm were assigned to the proton attached to carbon bonded to
carboxyl group (HOOC-CH2~~) and hydroxyl group (HO-CHR~~).

121
Fig. 4.22 The 400–MHz 1H-NMR spectrum of mcl-PHA derived from SPKO. The
protons in the mcl-PHA structure were denoted by the corresponding letters in the
spectrum
Fig. 4.23(a) to (e) showed the 1H-NMR spectra of the control and the PHA heat
treated at 160°C, 170°C, 180°C and 190°C respectively. The initial ratio of peaks a/e
was 0.32, and had decreased to 0.29 when the degradation temperature increased to
190ºC. This could be interpreted as the occurrence of hydrolysis of some of the ester
linkages generating -OH terminal group, when ~~COO-CHR~~ being hydrolyzed to
HO-CHR~~. The actual peak due to –OH was not clearly observable, presumably
because of the very low concentration and broadening due to hydrogen bonding.
CH3
(CH2)6
CH2
CH3 CH(CH2)x CHCH2 O CH2 O
[— O—CH – CH2 – C—O—CH– CH2– C—O—]n
x=1,3,5,7,9
5.5
pp
m5.
3pp
m
3.7p
pm
5.1
pp
m
2.5
pp
m
0.8
pp
m
1.2
pp
m
1.5
pp
m
1.9
pp
m
2.3
pp
m
e
b
eed
d
c
c
d
f
a
a
i
i
b
f
h
a b
g
gh
2.06.0 4.0 ppm

122
Fig. 4.23 1H–NMR spectra of mcl-PHA derived from SPKO: (a) Control PHA, (b) PHA
heat treated at 160˚C, (c) PHA heat treated at 170˚C, (d) PHA heat treated at 180˚C and
(e) PHA heat treated at 190˚C
While the spectra of 160°C to 180˚C treated mcl-PHA were very similar to the
spectrum of the control PHA (Fig. 4.23 (a)-(d)), the spectrum of 190°C-treated PHA
showed increased intensity of alcohol and carboxylic end groups, as shown by the peaks
at 3.7 and 2.1 ppm in Fig. 4.24(a) with relatively higher amount of –COOH groups. This
observation could be due to the dehydration of the HO-CHR-CH2~~ to RCH=CH~~ at
temperature around 190°C. Two extra multiplet peaks (m and n) between 5.0 to 7.0 ppm
were also observed (expanded spectrum in Fig. 4.24(b)). These could be attributed to the

123
vinyl protons in the unsaturated terminal of the product as a result of the dehydration
process.
Fig. 4.24 400-MHz 1H-NMR spectrum of mcl-PHA derived from SPKO: (a) the
decomposed product obtained at 190 ºC and (b) expanded region between 5.0 to 7.0 ppm
Both results from the degradation products of oleic acid and SPKO-derived mcl-
PHA suggested that the thermal degradation of mcl-PHA at moderate high temperature
involved a random chain scission which initiated at the ester linkages, producing
hydroxyacids with free –OH and –COOH end groups. The hydroxyl acids tend to
dehydrate in acidic and high temperature environment as the high amount of carboxylic
terminals in the degradation products acted as the catalyst for dehydration to occur.
These phenomena disagreed with the 6 membered-ring β-chain scission mechanism
expoused for short-chain-length poly(3-hydroxyalkanoates) (scl-PHA) such as poly(3-
hydroxybutyrate) (PHB) and poly(3-hydroxybutyrate-co-hydroxyvalerate) (PHBV), as
such mechanism would induce the formation of carboxylic terminal and a crotonate
structure instead of hydroxyl terminal. According to Morikawa and Marchessault (1981),
no signal was observed at the position of 3.7 ppm in the NMR spectra of PHB pyrolysate,
indicating that terminal OH group was absent from the oligomers. However, presence of
hydroxyl end groups was observed in the spectra of partially degraded mcl-PHA. This

124
indicated that the chain scission mechanism pathway in mcl-PHA during thermal
degradation could be different from scl-PHA.
4.5 Thermal degradation mechanism of mcl-PHA
The results obtained from GC, FTIR and 1H-NMR analyses were simultaneously
used as complementary techniques to determine the molecular structure of the partially
degraded mcl-PHA, and with that to elucidate the mechanism of thermal degradation of
the mcl-PHA.
The thermal degradation process appeared to involve α-chain scission of the mcl-
PHA polymer chains via hydrolytic ester bond cleavage. The primary degradation
products were a mixture of low molecular weight oligomeric hydroxyalkanoic acids
which resulted from the hydrolysis of the ester linkages. A proportion of the degradation
products could have undergone dehydration of the hydroxyl end groups, giving rise to
alkenoic acid as secondary products. Fig. 4.25 showed the plausible chain cleavage
mechanism in mcl-PHA polymers during the thermal degradation process.

125
Fig. 4.25 A plausible chain cleavage mechanism in mcl-PHA during thermal degradation
process. Stage I: Hydrolysis at the ester bond; Stage II: Dehydration of hydroxyl end
group in the acidic environment
The above-mentioned mechanism does not agree with the β-chain cleavage
mechanism in the thermal degradation of scl-PHA. For example, for PHB thermal
decomposition, the mechanism pathway involved the 6-membered ring ester transition
followed by synchronous breakage of the β-C-O and α-C-H bonds, producing oligomers
with carboxyl and crotonyl terminals (Morikawa & Marchessault, 1981; Grassie et al.,
1984; Kopinke et al., 1996; Erceg et al., 2005; Ariffin et al., 2008) as shown in Fig. 4.26.
Formation of a stable intramolecular 6-membered ring ester intermediate is possible
during the thermal degradation of scl-PHA as the R substituent consists of a methyl or

126
ethyl group. However, mcl-PHA contains bulky alkyl substituents with 3, 5, 7, 9 or 11
carbon atoms. These bulky R substituents could hinder the formation of a stable cyclic
transition during the β-chain scission mechanism. Thus compared to the β-chain cleavage
mechanism espoused for scl-PHA, hydrolysis of ester linkages might occur more readily
in mcl-PHA during thermal degradation.
Fig. 4.26 A typical β-chain cleavage mechanism during PHB thermal decomposition. A
6-membered ring ester transition state (I) is involved followed by synchronous breakage
of the β-C-O and α-C-H bonds

127
CHAPTER FIVE
PHA AS PLASTICIZER FOR POLY(VINYL CHLORIDE)
5.1 Mcl-PHA as natural-based plasticizer for PVC
Mcl-PHA, the polyester of bacterial origin has potential to act as a natural-based
plasticizer for vinyl resins such as PVC. Both mcl-PHA in the original undegraded and
degraded forms are considered to be compatible with PVC as they may have reasonable
affinity to the PVC resin due to the dipole-dipole and hydrogen bonding interactions.
They could be dispersed in the PVC polymer matrix on a molecular level and do not
easily migrate out from the PVC compound as a result of entanglement. This is different
from the conventional petrochemical-based plasticizers which are small molecules that
intercalates into PVC and thus may have limited permanence in the PVC compound.
Besides that, owing to its biocompatible and biodegradable properties, even if mcl-PHA
diffused out from PVC, they would not be hazardous to human health and the
environment.
5.1.1 Monomer compositions of the SPKO- and OA- derived polymeric and
oligomeric mcl-PHA used in solution blending
Fig. 5.1 and Fig. 5.2 showed the molecular structure of the monomer units for the
saponified palm kernel oil (SPKO) and oleic acid (OA)-derived mcl-PHA respectively,
as analysed from the GC and 1H-NMR spectra as discussed in Sections 4.4.1 and 4.4.3.

128
Fig. 5.1 Molecular structure of monomer units of PHASPKO (SPKO-derived PHA); x: 1, 3,
5, 7 and 9
Fig 5.2 Molecular structure of monomer units of PHAOA (OA-derived mcl-PHA); x: 1, 3,
5, 7 and 9
Table 5.1 showed the relative monomer compositions of the non-degraded and
170ºC-treated mcl-PHA derived from SPKO and OA, which were used in the PVC

129
blending. The oligomeric PHA (170ºC-treated PHA) contained higher amount of shorter
side chain monomers (C6 and C8), compared to the polymeric PHA (non-degraded PHA).
For example, the amount of shorter side chain monomers for 170ºC-treated PHASPKO was
52.1 wt %, which was higher than those shorter side chain monomers present in
polymeric PHASPKO (50.8 wt %). The amount of shorter side chain monomers for
polymeric PHAOA accounted for 43.7 wt %, and the amount was increased to 47.4 wt %
after the heat treatment of PHAOA at 170ºC, with an additional C6:1 monomer detected in
the heat-treated sample.
Overall PHAOA contained higher unsaturated monomers compared to PHASPKO.
Both polymeric and oligomeric PHAOA contained 17.4 wt % (C12:1, C12:2, C14:1 and C14:2)
and 7.5 wt % (C6:1, C12:1 and C14:1) unsaturated monomer contents, respectively. In the
PHASPKO, the total unsaturated monomers content was much lower, with only 1.6 wt %
for polymeric PHASPKO and 1.2 wt % for oligomeric PHASPKO. The GC chromatograms
of the PHA samples were shown in Appendix G.

130
Table 5.1 Monomer compositions of the non-degraded and heat-treated SPKO- and OA-
derived PHA determined by GC analysis
PHA sample
Compound 1ID
Monomer composition (wt %)
2PHASPKO 170°C treated
PHASPKO
3PHAOA 170°C treated
PHAOA
C6 4.51 4.86 4.26 5.03
C6:1 - - - 0.58
C8 46.29 47.21 39.42 41.81
C10 32.59 32.36 29.70 33.62
C12 13.42 12.59 9.21 11.53
C12:1 - - 2.16 0.75
C12:2 - - 2.92 -
C14 1.60 1.74 - 0.55
C14:1 1.59 1.24 10.01 6.13
C14:2 - 2.32 -
1ID: Identity;
2PHASPKO: Mcl-PHA derived from saponified palm kernel oil;
3PHAOA:
mcl-PHA derived from oleic acid; C6: 3-hydroxyhexanoic acid;
C6:1: 3-hydroxyhexenoic acid; C8: 3-hydroxyoctanoic acid;
C10: 3-hydroxydecanoic acid; C12: 3-hydroxydodecanoic acid;
C12:1: 3-hydroxydodecenoic acid; C12:2: 3-hydroxydodecadienoic acid;
C14: 3-hydroxytetradecanoic acid; C14:1:3-hydroxytetradecenoic acid; and
C14:2: 3-hydroxytetradecadienoic acid

131
5.2 Miscibility of PVC and mcl-PHA
Specific interactions such as dipole-dipole interaction, hydrogen bonding, polar
interaction or proton donor-proton acceptor interactions are important for achieving
miscibility in polymer blends (Olabisi et al., 1979; Choe et al., 1995). Therefore the
multiplicity of miscible systems containing poly(vinyl chloride) and polyester is possibly
the result of specific interactions.
5.2.1 Solution blending and solvent casting
Mixing process has a pronounced effect on plasticizer distribution and
homogeneity of the plasticized materials. More intimate dispersion could be achieved by
mixing the two polymer solutions in a common solvent, in this case, chloroform.
Mcl-PHA has higher solubility in chloroform than PVC. Hence, PVC has higher
tendency to precipitate out compared to PHA during the solution casting process.
Therefore removal of the solvent during preparation of the polymer blend, the mixtures
were stirred continuously to ensure uniform distribution of PHA into PVC
5.2.2 FTIR analysis of PVC-PHA system
Fourier transform infrared (FTIR) spectroscopy is often used in the analysis of
polymer mixtures. In this study, FTIR spectroscopy was used to investigate whether
specific interaction between the PHA and PVC had taken place, which could be observed
from the shift of certain peaks in the spectrum.
The characteristic bands of PVC can be classified into three regions: (i) the C-Cl
stretching region in the range from 600 to 700 cm-1
; (ii) the C-C stretching in the range
from 900-1200 cm-1
and (iii) 1250 to 2970 cm-1
, attributed to numerous C-H modes in
PVC (Rajendran et al., 2008). Table 5.2 showed the characteristic vibrational modes and
wave numbers exhibited by PVC.

132
Table 5.2 Vibrational modes and wave numbers exhibited by PVC (adapted from
Beltran & Marcilla (1997) and Pavia et al. (2009) )
Vibrational mode Wave numbers (cm-1
)
Stretching C-H of CHCl 2970
Stretching C-H of CH2 2912
C=C stretching of vinyl chloride 1645
Deformation (wagging) CH2 1435, 1427
Deformation C-H of CHCl 1331, 1255
Stretching C-C 1099
Rocking CH2 966
Stretching C-Cl 692, 637, 616
On the other hand, the mcl-PHA polyesters had characteristic strong absorbance
band at around 1726 cm-1
for PHASPKO and 1735 cm-1
for PHAOA, which were attributed
to the C=O stretching. Therefore it is conveniently to differentiate the PHA from PVC by
the carbonyl band.
Fig. 5.3 to Fig. 5.6 showed the FTIR absorption spectra of PVC/PHASPKO,
PVC/degPHASPKO, PVC/PHAOA and PVC/degPHAOA polymer blends. The FTIR spectra
of all the blends showed the characteristic peaks of both PVC and PHA components, i.e.
the C=O stretching band at around 1737 to 1741 cm-1
and C-Cl stretching around 607 to
611 cm-1
. This showed that both polar functional groups of mcl-PHA and PVC were
present in the PHA-PVC blends.

133
Fig. 5.3 FTIR absorption spectra of PVC, polymeric PHASPKO and the polymer blends:
PVC/PHASPKO-2.5 and PVC/PHASPKO-5
Fig. 5.4 FTIR absorption spectra of PVC, oligomeric PHASPKO (degPHASPKO) and the
polymer blends: PVC/degPHASPKO-2.5 and PVC/degPHASPKO-5

134
Fig. 5.5 FTIR absorption spectra of PVC, polymeric PHAOA and the polymer blends:
PVC/PHAOA-2.5 and PVC/PHAOA-5
Fig. 5.6 FTIR absorption spectra of PVC, oligomeric PHAOA (degPHAOA) and the
polymer blends: PVC/degPHAOA-2.5 and PVC/degPHAOA-5

135
Table 5.3 showed the relative intensity ratio of the absorbance value at C=O
stretching present in mcl-PHA to the absorbance value of CH bending in PVC.
Table 5.3 Relative intensity ratio between absorbance value for C=O stretching in PHA
and CH bending in PVC
PVC/PHA binary
blends
5Intensity ratio, A1739/A1426
(C=O group of PHA to non-reactive CH2 group of PVC)
2.5 phr 5 phr
1PVC/PHASPKO 0.465 0.759
2PVC/degPHASPKO 0.394 0.631
3PVC/PHAOA 0.392 0.728
4PVC/deg PHAOA 0.282 0.563
1PVC/PHASPKO: PVC blend consisted of 2.5 or 5 phr polymeric PHA derived from
SPKO; 2PVC/degPHASPKO: PVC blend consisted of 2.5 or 5 phr oligomeric PHA derived
from SPKO. 3PVC/PHAOA: PVC blend consisted of 2.5 or 5 phr polymeric PHA derived
from oleic acid; 4PVC/degPHAOA: PVC blend consisted of 2.5 or 5 phr oligomeric PHA
derived from oleic acid; 5Intensity ratio, A1739/A1426: Height ratio of absorbance band at
C=O stretching (A1739= Base 1: 2776 cm-1
; Base 2: 1489 cm-1
) to CH bending (A1426=
Base 1: 1489 cm-1
; Base 2: 1392 cm
-1)
PVC plasticized with polymeric PHA had higher relative ratio of A1739/A1426 than
with those plasticized with PHA oligoesters. Higher molecular weight and longer
polyester chain has more ester C=O carbonyl group. Thus the polymeric PHA may have
increased level of interaction with the PVC.

136
PVC plasticized with 5 phr PHA had higher relative ratio of A1739/A1426 than with
2.5 phr PHA. As higher amount of PHA present in the polymer mixture, higher amount
of polar groups in the polymer are available for possible interaction with PVC.
PVC plasticized with SPKO-derived PHA had higher relative ratio of A1739/A1426
than with OA-derived PHA. SPKO-derived PHA had higher molecular weight and
possessed a longer polymer chain compared to OA-derived PHA (referred to Table 3.2
and Appendix H). Thus SPKO-derived PHA was likely to have more interaction with
PVC.
Fig. 5.7 to Fig. 5.10 showed the FTIR absorption spectra in the ester carbonyl
(C=O) stretching region of PHA and PVC/PHA blends.
Fig. 5.7 FTIR absorption of PVC, PHASPKO and PVC/PHASPKO polymer blends in the
region 1650 to 1800 cm-1

137
The C=O stretching frequency for PHASPKO was observed at 1726 cm-1
, as shown
in Fig. 5.7. After mixing the PVC with 2.5 and 5 phr of PHASPKO, the peak maximum
position was shifted to higher frequency, i.e. 1737 cm-1
for PVC/PHASPKO-5 and 1740
cm-1
for PVC/PHASPKO-2.5.
Fig. 5.8 FTIR absorption spectra of PVC, degPHASPKO and PVC/degPHASPKO polymer
blends in the region 1650 to 1800 cm-1
From Fig. 5.8, the ester carbonyl stretching frequency for oligomeric PHASPKO
(degPHASPKO) was observed at 1727 cm-1
. After mixing the PVC with 2.5 and 5 phr of
degPHASPKO, the peak maximum position was shifted to 1738 cm-1
for
PVC/degPHASPKO-5 and 1739 cm-1
for PVC/degPHASPKO-2.5.

138
Fig. 5.9 FTIR absorption spectra of PVC, PHAOA and PVC/PHAOA polymer blends in
the region 1650 to 1800 cm-1
For PHAOA, the ester carbonyl stretching frequency was observed at 1735 cm-1
,
as shown in Fig. 5.9. The peak maximum position was shifted to higher frequency after
the PVC was mixed with PHAOA at different compositions, e.g. 1739 cm-1
for
PVC/PHASPKO-5 and 1740 cm-1
for PVC/PHASPKO-2.5.

139
Fig. 5.10 FTIR absorption spectra of PVC, degPHAOA and PVC/degPHAOA polymer
blends in the region 1650 to 1800 cm-1
Similarly, the ester carbonyl stretching frequency for oligomeric PHAOA
(degPHAOA) was observed at 1735 cm-1
, as shown in Fig. 5.10. After mixing the PVC
with degPHAOA, the peak maximum position was shifted to 1739 cm-1
for both
PVC/degPHASPKO-5 and PVC/degPHASPKO-2.5 binary blends.
From the observations for the shift of ester carbonyl stretching band in all
polymer blends, it is believed that the C=O group in PHA could be responsible for the
miscibility with the PVC, due to polar interactions in the system.

140
Fig. 5.11 to Fig. 5.14 showed the FTIR absorption spectra in the C-O-C and CH-
Cl stretching region of PVC/PHA polymer blends. The CH-Cl deformation of PVC was
assigned at 1328 cm-1
, whereas the C-O-C stretching vibration band for respective PHA
was assigned at 1161 to 1164 cm-1
.
Fig. 5.11 FTIR absorption spectra of PVC, PHASPKO and PVC/PHASPKO polymer blends
in the region 1135 to 1350 cm-1

141
Fig. 5.12 FTIR absorption spectra of PVC, degPHASPKO and PVC/degPHASPKO polymer
blends in the region 1135 to 1350 cm-1

142
Fig. 5.13 FTIR absorption spectra of PVC, PHAOA and PVC/PHAOA polymer blends in
the region 1135 to 1350 cm-1

143
Fig. 5.14 FTIR absorption spectra of PVC, degPHAOA and PVC/degPHAOA polymer
blends in the region 1135 to 1350 cm-1
As shown in Fig. 5.11 to Fig. 5.14, the C-O-C stretching vibration of PHA and
CH-Cl deformation of PVC for all the polymer blends were shifted. These showed the
existence of specific interactions such as dipole-dipole and polar interactions between the
two polymers.

144
5.2.3 1H-NMR analysis of PVC-PHA system
Nuclear magnetic resonance (NMR) spectroscopy is one of the techniques which
could provide information on a molecular dimension scale (Havens & Koenig, 1983).
The general molecular structure of the repeating unit for PVC and mcl-PHA is shown in
Fig. 5.15 (a) and (b), respectively.
Fig 5.15 Structural formula of (a) PVC and (b) mcl-PHA monomer units
Fig. 5.16 and Fig. 5.17 showed the proton NMR spectra for PVC and the PHA (in
this case, PHAOA) used in the polymer blending.

145
Fig. 5.16 1H-NMR spectrum of PVC. Chemical shift from 1.9 to 2.3 ppm was assigned
to Hβ of –CH2– ; chemical shift from 4.3 to 4.6 ppm was assigned to Hα of –CHCl–
In Fig. 5.16, the peaks around 4.3 to 4.6 ppm were assigned to the α-methine
proton (–CHCl–) which attached to the electropositive carbon atom, and peaks around
1.9 to 2.3 ppm was assigned to the β-methylene proton (–CH2–) in PVC. The relative
intensity ratio of αH (α-methine proton) to
βH (β-methylene proton) was 1:2, in
agreement to the structure of the repeating unit. The peak at 1.5 ppm was due to the
moisture in the D-chloroform. This could be due to the relatively low solubility of PVC
in the chloroform and therefore small amount of water in the solvent could be detected in
the spectrum.
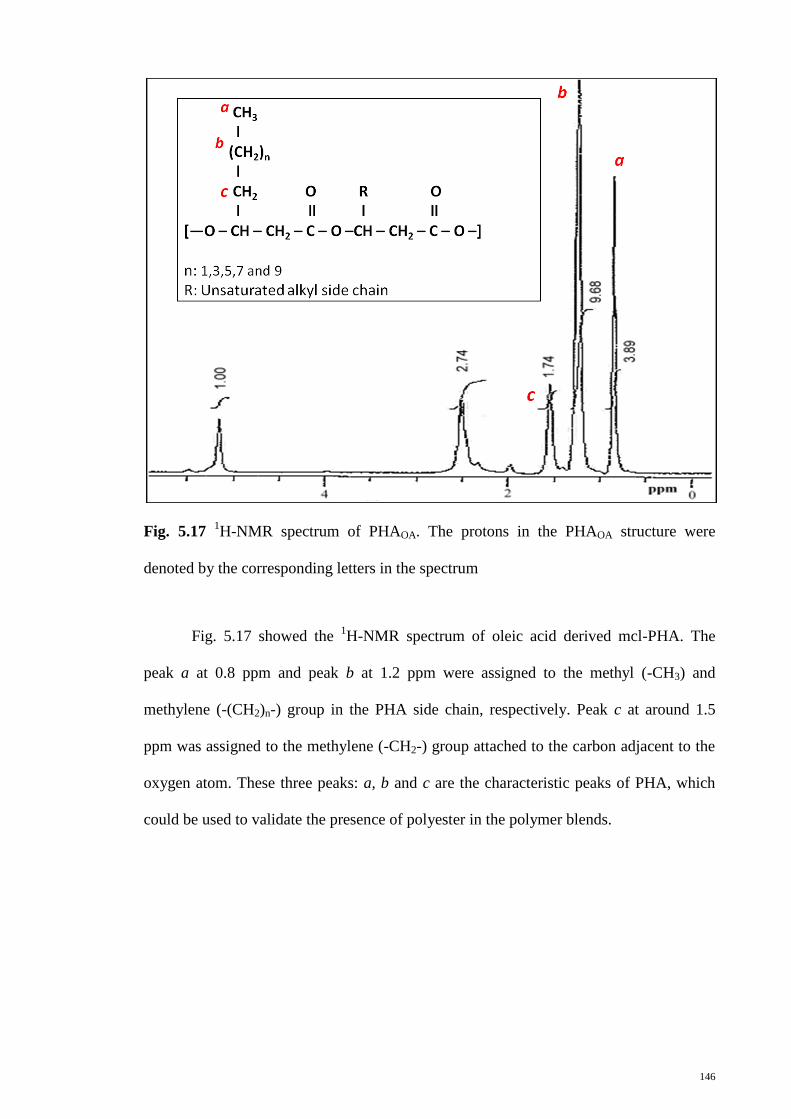
146
Fig. 5.17 1H-NMR spectrum of PHAOA. The protons in the PHAOA structure were
denoted by the corresponding letters in the spectrum
Fig. 5.17 showed the 1H-NMR spectrum of oleic acid derived mcl-PHA. The
peak a at 0.8 ppm and peak b at 1.2 ppm were assigned to the methyl (-CH3) and
methylene (-(CH2)n-) group in the PHA side chain, respectively. Peak c at around 1.5
ppm was assigned to the methylene (-CH2-) group attached to the carbon adjacent to the
oxygen atom. These three peaks: a, b and c are the characteristic peaks of PHA, which
could be used to validate the presence of polyester in the polymer blends.

147
Fig. 5.18 1H-NMR spectra of (a) PVC, (b) PHAOA and (c) PVC/PHAOA-5 polymer blends

148
Fig. 5.18 compared the 1H-NMR spectra of (a) PVC and (b) PHAOA with the
polymer blend, (c) PVC/PHAOA-5. As could be seen from Fig. 5.18 (c), the spectrum of
PVC/PHAOA-5 polymer blend showed almost identical peaks as PVC, with three
additional peaks being detected: 0.8 ppm, 1.2 ppm and 1.5 ppm which assignable to
–CH3, -(CH2)n- and –CH2- groups in PHA, respectively. This showed that both PVC and
PHA were present in the polymer. On the other hand, the relative intensity ratio of αH/
βH in PVC/PHAOA-5 was reduced to 1.69, compared to PVC.
The 1H-NMR spectra for the other polymer blends showed similar spectrum as
PVC/PHAOA-5 and the relative intensity ratio of αH to
βH in the polymer blends were
summarized in Table 5.4.
Table 5.4 Relative intensity ratio between αH (α-methine proton) to
βH (β-methylene
proton) in polymer blends
PVC/PHA
binary blends
Relative intensity ratio of αH to
βH
2.5 phr
5 phr
PVC/ PHASPKO 1/1.70
1/1.77
PVC/deg PHASPKO 1/1.57
1/1.66
PVC/ PHAOA 1/1.77
1/1.69
PVC/degPHAOA 1/1.64
1/1.69
From Table 5.4, the ratio of αH/
βH in polymer blends varied with the
compositions and types of PHA present in the polymer blends. All the blends showed a
reduced ratio of αH/
βH, compared to the PVC, indicating that the α-methine proton
or/and β-methylene proton in the PVC could be interacted with the PHA, giving rise to
the specific intermolecular interactions within the polymer mixture. These inter-polymer
interactions could be probably attributed to the interactions of α-hydrogen as well as the
149
local dipole-dipole interaction between chlorines of PVC with the PHA, in which the two
polymers may intermingle with each other on a molecular level.
5.3 Scanning electron microscopy (SEM) of PVC and plasticized PVC films
In order to understand how the surface morphology of the PVC film changes with
the introduction of plasticizers, the SEM micrographs of the pure PVC and PHA-
plasticized PVC films were taken. The simplest polymer blends are typically a two-phase
system consisting of a rubbery impact modifier dispersed in a thermoplastic matrix such
as PVC.
5.3.1 Morphology of PVC and PHA films by SEM
As shown in Fig. 5.19, cavities were present in the individual PVC film. The
pores were distributed throughout the surface with the pore size in the range of 1 to 20
μm. These observations were similar to the findings reported by Stephan et al. (2000).
Fig. 5.20 showed the surface morphology of PHASPKO film. PHASPKO physically and
morphologically existed as softer and amorphous material and thus appeared as a smooth
film, without any cavity, under the electron microscope.

150
Fig. 5.19 SEM micrograph showing surface morphology of PVC. Voids and cavities
were present in the PVC film (500 x magnification)
Fig. 5.20 SEM micrograph showing surface morphology of PHASPKO film (500 x
magnification)
151
5.3.2 Qualitative comparisons of PVC/PHA binary blend morphologies by SEM
SEM is used to examine the surface variations of polymer blends and provide
qualitative comparisons for blend morphology (Hobbs & Watkins, 2000). A basic
function for the plasticizer is to act as a lubricant (Clark, 1941), embedding themselves
between the polymer chains, reducing the internal resistance to sliding and thus allowing
the polymer chains to move past each other rapidly.
Fig. 5.21 to Fig. 5.28 showed the SEM micrographs of PVC/PHA blend films
prepared by solution casting.

152
Fig. 5.21 SEM micrograph showing surface morphology of PVC/PHASPKO-2.5 film:
(a)200 x; (b)500 x magnification

153
Fig. 5.22 SEM micrograph showing surface morphology of PVC/PHASPKO-5 film:
(a)200 x; (b)500 x magnification

154
Fig. 5.23 SEM micrograph showing surface morphology of PVC/degPHASPKO-2.5 film:
(a)200 x; (b)500 x magnification

155
Fig. 5.24 SEM micrograph showing surface morphology of PVC/degPHASPKO-5 film:
(a)200 x; (b)500 x magnification

156
Fig. 5.25 SEM micrograph showing surface morphology of PVC/PHAOA-2.5 film:
(a)200 x; (b)500 x magnification
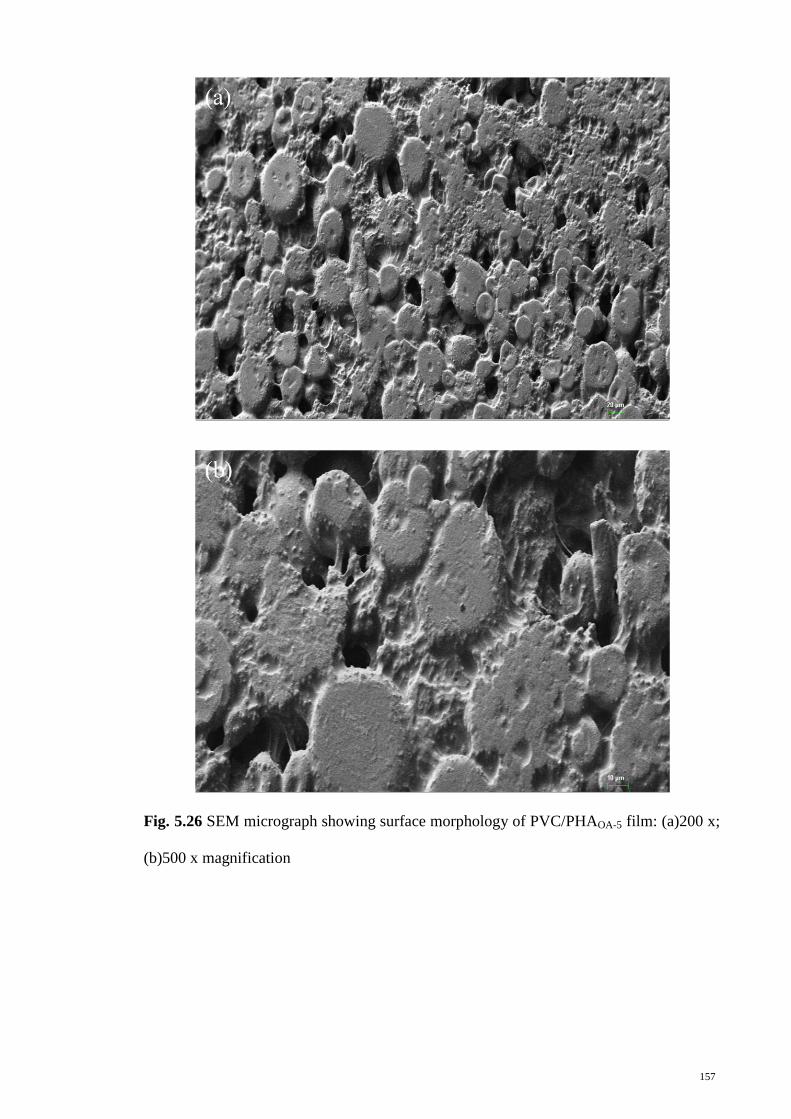
157
Fig. 5.26 SEM micrograph showing surface morphology of PVC/PHAOA-5 film: (a)200 x;
(b)500 x magnification

158
Fig. 5.27 SEM micrograph showing surface morphology of PVC/degPHAOA-2.5 film:
(a)200 x; (b)500 x magnification

159
Fig. 5.28 SEM micrograph showing surface morphology of PVC/degPHAOA-5 film:
(a)200 x; (b)500 x magnification
As shown in the SEM micrographs of the polymer blends, after mixing the PVC
with PHA, the cavities were not as clearly observed as in pure PVC. The PHA penetrated
to some of the porous structures of PVC and interfused with the PVC polymer segments.

160
The dispersion of the PHA into the PVC matrix presumably increased the
distance between PVC chains, by placing themselves in between the PVC polymers and
separating the PVC chains further apart, therefore promoted higher degree of freedom of
polymer conformation. The effectiveness in the dispersion of plasticizers in PVC matrix
could be attributed to the molecular weight of the PHA and polar interactions between
PVC and PHA phases. Low molecular weight oligoesters would have greater diffusion
into the PVC matrix compared to polymeric PHA, leading to greater flexibility and
polymer chain movements.
5.4 Thermal studies of PVC and PVC/PHA binary blends
The thermal stability of polymer blend is a vital parameter to characterize the
plasticizing effect of the PHA on PVC. In this study, thermogravimetric analysis (TGA)
was used to study the thermal stability of PVC and a series of PVC/PHA polymer blends
consisting of PVC and different types of mcl-PHA as plasticizers. The derivative
thermogravimetry (DTG) which is defined as the first derivative of the weight change of
sample as a function of temperature was used to analyze overlapping decompositions
where different components of the polymer blends could be separated and subsequently
determined the thermal stability of each component.
Fig. 5.29 to Fig. 5.37 showed the respective TG and DTG curves of PVC and
PVC/PHA polymer blends.

161
Fig. 5.29 TGA thermogram of PVC
Fig. 5.29 showed the TGA thermogram of PVC, which exhibited two distinct
stages of thermal decomposition. The first decomposition started from 216ºC to 367ºC
with a peak decomposition temperature at 278ºC. This corresponded to the elimination of
mainly hydrogen chloride. The second decomposition started from 367ºC to 530ºC with
a maximum rate at 449ºC, which presumably corresponded to the degradation of the
resulting unsaturated hydrocarbons. There was a remaining 7.8% of residual carbon
black since the heating was carried out under nitrogen atmosphere.

162
Fig. 5.30 TGA thermogram of PVC/PHASPKO-2.5
About 0.1% of weight loss was observed in PVC/PHASPKO-2.5 before 202ºC,
which was attributed to volatile components in the sample, as shown in Fig. 5.30. The
first stage of decomposition started at 202ºC and ended at 375ºC, with a maximum
decomposition rate at 292ºC. This weight loss could be attributed to the decomposition
of PHA and evolution of chlorinated fragments comprising mainly HCl. The second
stage of decomposition began from 375ºC to 526ºC with a maximum decomposition rate
at 440ºC. It was characterized by the decomposition of the unsaturated hydrocarbon
structures which made up of 23.2% by weight. There was a remaining 6.2% of carbon
black residue.

163
Fig. 5.31 TGA thermogram of PVC/PHASPKO-5
For PVC/PHASPKO-5 as shown in Fig. 5.31, there was an initial weight loss of 0.1%
prior to 205ºC. The first stage of decomposition began at 205ºC and ended at 378ºC with
a peak decomposition temperature at 291ºC. The total weight loss at this stage was
64.3%. The second stage of decomposition commenced at 378ºC and ended at 541ºC
with a peak decomposition temperature at 438ºC. This corresponded to a weight loss of
23.5%. The remaining weight loss of 7.2% was attributed to the carbon black.

164
Fig. 5.32 TGA thermogram of PVC/degPHASPKO-2.5
From Fig. 5.32, around 0.1% of weight loss was observed in the
PVC/degPHASPKO-2.5 before 203ºC. The 62.5% of the blend decomposed at 203ºC to
371ºC during the first stage of decomposition, with a peak decomposition temperature at
289ºC. The second stage of decomposition began from 371ºC to 562ºC, with a peak
decomposition temperature at 440ºC and this accounted for 23.4% of weight loss. The
remaining 7.4% of total weight was attributed to the carbon residues.
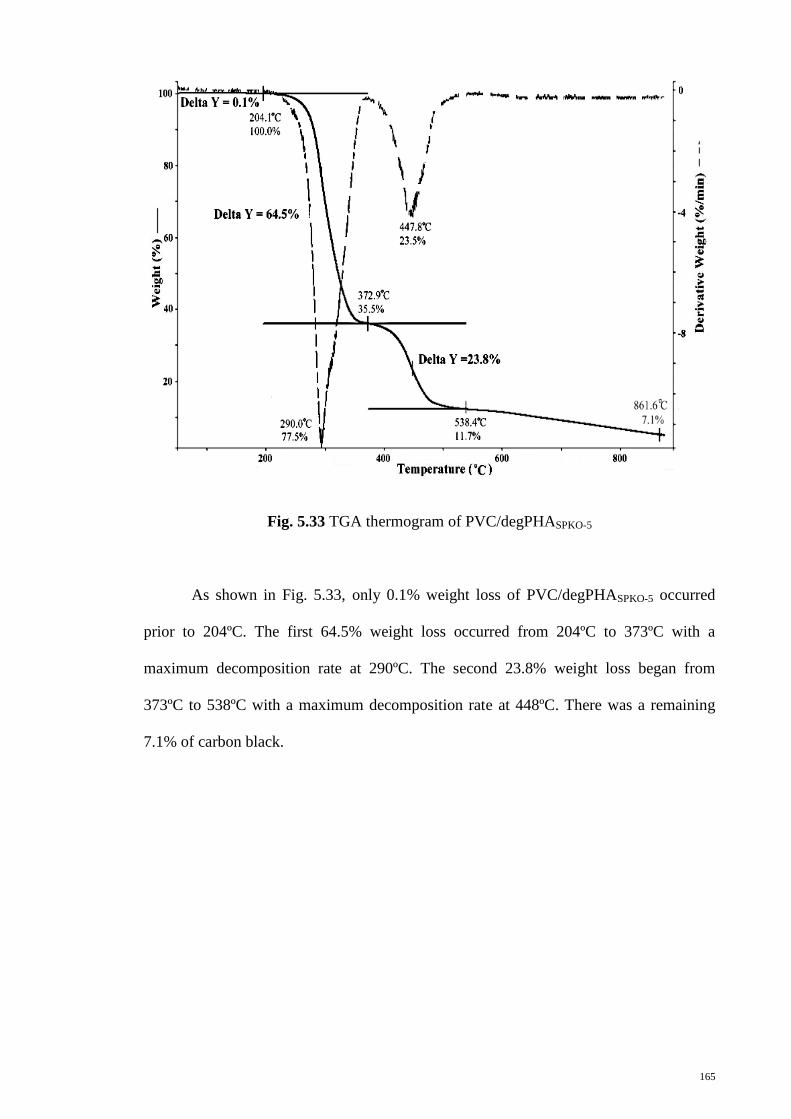
165
Fig. 5.33 TGA thermogram of PVC/degPHASPKO-5
As shown in Fig. 5.33, only 0.1% weight loss of PVC/degPHASPKO-5 occurred
prior to 204ºC. The first 64.5% weight loss occurred from 204ºC to 373ºC with a
maximum decomposition rate at 290ºC. The second 23.8% weight loss began from
373ºC to 538ºC with a maximum decomposition rate at 448ºC. There was a remaining
7.1% of carbon black.

166
Fig. 5.34 TGA thermogram of PVC/PHAOA-2.5
Fig. 5.34 showed the TGA result of PVC/PHAOA-2.5. The first 62.8% of weight
loss was observed from 192ºC to 373ºC, with a peak decomposition temperature at
293°C. The second 23.5% of weight loss began from 373ºC and ended at 554ºC, with a
peak decomposition temperature at 440ºC. There was a remaining 7.4% of carbon black.

167
Fig. 5.35 TGA thermogram of PVC/PHAOA-5
Slight weight loss of 0.3% was observed in the PVC/PHAOA-5 around 199ºC, as
shown in Fig. 5.35. The blend started to decompose at 199ºC and ended at 376ºC during
the first stage of decomposition with a peak decomposition temperature at 285ºC. This
made up around 64.3% of the blend. The second stage of decomposition commenced
from 376ºC to 537ºC with a peak decomposition temperature at 441ºC and this made up
of 23.7% of total weight. The remaining 7.6% of total weight was attributed to the
carbon black.

168
Fig. 5.36 TGA thermogram of PVC/degPHAOA-2.5
The thermogram for PVC/degPHAOA-2.5 was shown in Fig. 5.36. The first stage
of decomposition began at 192ºC and ended at 379ºC with a peak decomposition
temperature at 292ºC. The total weight loss at this stage was 62.7%. The second stage of
decomposition began at 379ºC and ended at 542ºC with a peak decomposition
temperature at 448ºC. This corresponded to a weight loss of 23.4%. The remaining 7.0%
was attributed to the carbon black.
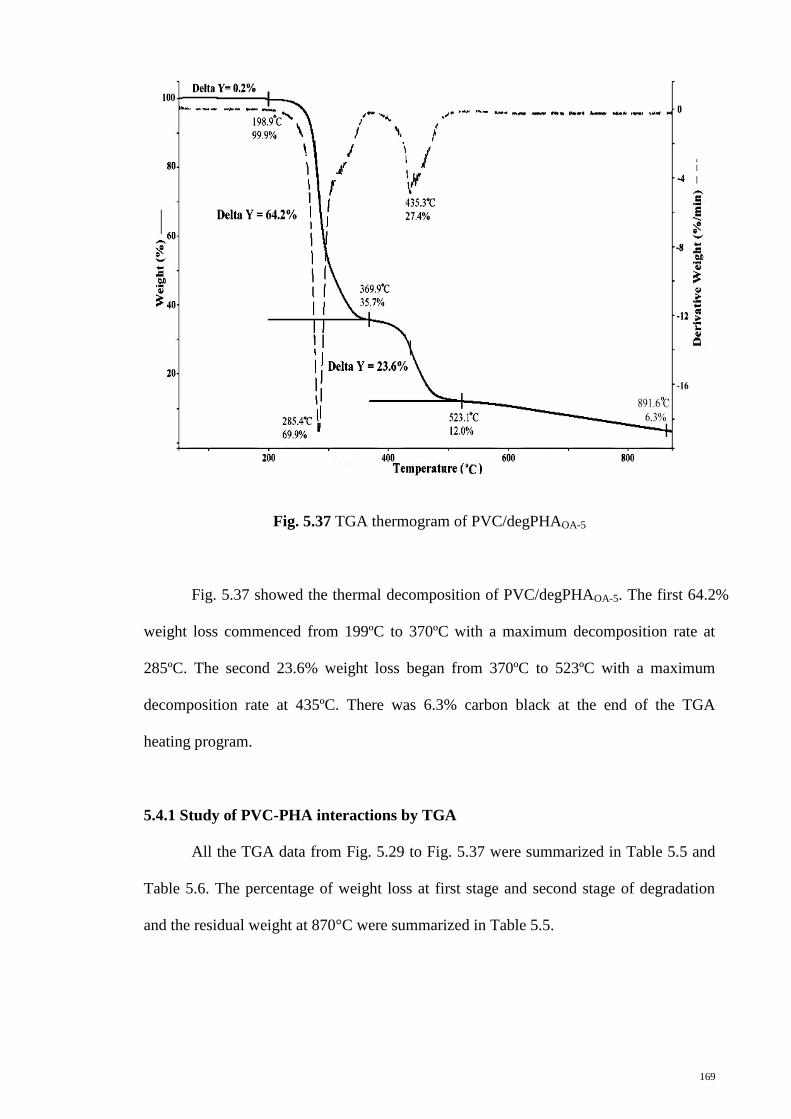
169
Fig. 5.37 TGA thermogram of PVC/degPHAOA-5
Fig. 5.37 showed the thermal decomposition of PVC/degPHAOA-5. The first 64.2%
weight loss commenced from 199ºC to 370ºC with a maximum decomposition rate at
285ºC. The second 23.6% weight loss began from 370ºC to 523ºC with a maximum
decomposition rate at 435ºC. There was 6.3% carbon black at the end of the TGA
heating program.
5.4.1 Study of PVC-PHA interactions by TGA
All the TGA data from Fig. 5.29 to Fig. 5.37 were summarized in Table 5.5 and
Table 5.6. The percentage of weight loss at first stage and second stage of degradation
and the residual weight at 870°C were summarized in Table 5.5.

170
Table 5.5 Weight loss of PVC, PHA and their blends at different stage of degradation at
10 ˚C min-1
heating rate under nitrogen atmosphere
Sample Weight loss (%) Total
weight loss
(%)
Residual weight
at 870°C
(%) Stage 1 Stage 2
PVC 60.8 22.3 83.1 7.8
PHASPKO 97.9 - 97.9 -
PHAOA 99.0 - 99.0 -
PVC/PHASPKO-5 64.3 23.5 87.8 7.2
PVC/degPHASPKO-5 64.5 23.8 88.3 7.1
PVC/PHAOA-5 64.3 23.7 88.0 7.6
PVC/degPHAOA-5 64.2 23.6 87.8 6.3
PVC/PHASPKO-2.5 63.1 23.2 86.3 6.2
PVC/degPHASPKO-2.5 62.5 23.4 85.9 7.4
PVC/PHAOA-2.5 62.8 23.5 86.3 7.4
PVC/degPHAOA-2.5 62.7 23.4 86.1 7.0
As shown in Fig. 5.29 and Table 5.5, apparent two-stage degradation pattern was
seen in the PVC decomposition, where the first stage of degradation was ascribed to
mainly the dehydrochlorination process, leaving behind the unsaturated hydrocarbon
structures and the second degradation was attributed to the decomposition of the
resulting hydrocarbons.
Similarly, the thermal decomposition of all the polymer blends was found to
occur through two stages as observed in PVC. From Fig. 5.30 to Fig. 5.37, two
distinctive DTG peaks could be observed, with the first peak being ascribed to the
decomposition of PVC and its plasticizer, as shown by the higher weight loss due to the
added PHA in the PVC/PHA compared to the individual PVC (Table 5.5). There was no

171
significant change in weight loss at the second stage of decomposition as this stage of
decomposition was mainly ascribed to the decomposition of fraction of resin with no
plasticizer, since any PHA would have completely degraded at temperature above 400C.
The temperature range of decomposition, temperature of onset of decomposition
(Tonset) and temperature of fastest decomposition (Tp) during first stage and second stage
of decomposition were summarized in Table 5.6.
Table 5.6 Thermogravimetric data of PVC blends and blend components at 10 ˚C min-1
heating rate
Sample First Stage (˚C) Second Stage(˚C)
Temp.
range
1Tonset
2Tp
Temp.
range
Tonset Tp
PVC 219-367 271 278 367-530 426 449
PHASPKO 196-555 276 293 - - -
PHAOA 187-520 269 282 - - -
PVC/PHASPKO-2.5 202-375 273 292 375-526 427 440
PVC/PHASPKO-5 205-378 272 291 378-541 432 438
PVC/degPHASPKO- 2.5 203-371 274 289 371-562 429 440
PVC/degPHASPKO-5 204-373 275 290 373-538 424 448
PVC/PHAOA-2.5 192-373 275 293 373-554 429 440
PVC/PHAOA-5 199-376 262 285 376-537 430 441
PVC/degPHAOA-2.5 192-379 275 292 379-542 430 448
PVC/degPHAOA-5 199-370 270 285 370-523 424 435
1Tonset: Temperature at onset of decomposition;
2Tp: Temperature at fastest decomposition
The temperature scale of TGA instrument is calibrated by Curie-Points of certain
metals and alloys, and the accuracy is in the order of ± 4ºC. As shown in Table 5.6, there

172
was no significant difference in the Tonset between the pure PVC and those plasticized
with PHA during the first stage of degradation, presumably the amounts of plasticizer at
2.5 and 5.0 phr were insufficient to produce any significant change to the onset of
decomposition for PVC. However, the decomposition temperature range for the first
stage of degradation showed a noticeable difference, whereby the plasticized samples
degraded over a broader range, starting at a lower temperature. This effect could be due
to the molecular interactions between the PVC and PHA plasticizer whereby the
presence of PHA plasticizer fractions might influence the degradation of the PVC. Thus
the plasticized samples would decompose earlier compared to the unplasticized PVC.
On the other hand, during the first stage of degradation, PVC/PHA blend
revealed a higher temperature of fastest decomposition (Tp) than the pure PVC. This
showed that the evolution of HCl during thermal degradation could be delayed as the
fusion of PVC-PHA layers may act as a barrier and delay the diffusion of the volatile
decomposition products.
There was no significant difference in the temperature range of decomposition,
Tonset and Tp between PVC and PVC/PHA polymer blends at the second stage of
decomposition. As almost no PHA plasticizer present in the blend at this stage of
decomposition, the rate of degradation of the remaining hydrocarbon structures was
about the same in the PVC and PVC/PHA polymer blends. Therefore it could be
concluded that PVC decomposition was influenced by the presence of plasticizer mainly
at the first stage of decomposition only.
5.4.2 Thermo-kinetic analysis of PVC/PHA binary blends
The kinetic parameters of the degradation studies of PVC/PHA blends and the
blend components during first stage and second stage of decomposition were

173
summarized in Table 5.7 and Table 5.8. The descriptions of calculations of Ed, A and ∆S
for the PVC and PVC/PHA blends were shown in Appendix I.
As could be seen from the tables, two degradation processes with different
activation energies were observed in both PVC and the polymer blends.
Table 5.7 Thermo-kinetic parameters of PVC blends and blend components at first stage
of decomposition
Samples Degradation
activation
energy, Ed
(kJ mol-1
)
Pre-
exponential
factor, A
(s-1
)
Entropy of
activation, ∆S
(J K-1
mol-1
)
Correlation
of coefficient,
R2
PVC 138.2 1.18x10¹¹
-38.1 0.9726
PHASPKO 128.9 1.15x 10¹⁰
-57.6 0.9931
PHAOA 85.3 6.07x10⁵
-139.4 0.9019
PVC/PHASPKO-2.5 131.2 1.31x10¹⁰
-56.5 0.9940
PVC/PHASPKO-5 125.1 2.81x10⁹
-69.3 0.9784
PVC/degPHASPKO-2.5 122.5 1.83x10⁹
-72.9 0.9946
PVC/degPHASPKO-5 117.7 5.62x10⁸
-82.7 0.9938
PVC/PHAOA-2.5 132.2 1.37x10¹⁰
-56.2 0.9877
PVC/PHAOA-5 128.1 8.21x10⁹
-60.3 0.9932
PVC/degPHAOA-2.5 125.2 2.97x10⁹
-68.9 0.9871
PVC/degPHAOA-5 119.0 1.06x10⁹
-77.3 0.9722
For the first stage of decomposition, all the polymer blends showed a lower Ed
and ∆S compared to the unblended PVC, with Ed and ∆S of PVC/PHA5 blends lower

174
than PVC/PHA2.5 blends; Ed and ∆S of PVC/PHASPKO blends lower than PVC/PHAOA
blends; Ed and ∆S of PVC/oligoesters blends lower than PVC/polyesters blends. These
phenomena showed that thermal decomposition of plasticized PVC could depend on the
type and concentration of the plasticizer used.
Table 5.8 Kinetic parameters of PVC blends and blend components at second stage of
decomposition
Samples Degradation
activation
energy, Ed
(kJ mol-1
)
Pre-
exponential
factor, A (s-1
)
Entropy of
activation,
∆S (J K-1
mol-1
)
Correlation
of coefficient,
R2
PVC k-60 360.0 7.89x10²³
205.1 0.9600
PHAOA - - - -
PHASPKO - - - -
PVC/PHASPKO-2.5 337.7 8.08x10²²
186.4 0.9612
PVC/PHASPKO-5 211.4 2.74x10¹³
5.1 0.9722
PVC/degPHASPKO-2.5 286.9 1.35x10¹⁹
114.1 0.9416
PVC/degPHASPKO-5 368.6 7.87x1024
222.4 0.9712
PVC/PHAOA-2.5 255.7 5.36x10¹⁶
68.1 0.9801
PVC/PHAOA-5 302.2 1.66x10²⁰
134.9 0.9668
PVC/degPHAOA-2.5 221.1 8.53x10¹³
14.4 0.9817
PVC/degPHAOA-5 208.2 1.67x10¹³
1.0 0.9914
Similar with Tonset and Tp, there was no a clear trend of variation between the Ed,
A and ∆S of PVC and PVC/PHA blends for the second stage of decomposition as this

175
stage of decomposition mainly consisted of the decomposition of unsaturated
hydrocarbon structures.
Ed of second stage degradation was higher than the Ed of first stage of
degradation for the PVC and all PVC/PHA binary blends. The possible reason for the
higher Ed value of second stage degradation is explained by the stable C=C distribution
in the unsaturated hydrocarbons remained in the PVC and PVC/PHA. The bond energies
of the alkylene and aromatic chains are much higher than a single C-Cl and C-H bond
where these weaker bonds were dissociated during the dehydrochlorination process.
Therefore higher energy was required for the chain breaking during second stage of
decomposition.
5.4.3 Thermal stability of PVC/PHA2.5 and PVC/PHA5 binary blends
Fig. 5.38 to Fig. 5.41 showed the DTG curves of PVC/PHA2.5 and PVC/PHA5
binary blends, composed of polymeric oleic acid-derived mcl-PHA (PHAOA), oligomeric
oleic acid-derived mcl-PHA (degPHAOA), polymeric saponified palm kernel oil-derived
mcl-PHA (PHASPKO) and oligomeric saponified palm kernel oil-derived mcl-PHA
(degPHASPKO) as plasticizers for PVC, respectively.

176
Fig. 5.38 DTG thermograms of PVC/ PHASPKO and PVC/PHASPKO-5 binary blends.
Black dots: PVC/PHASPKO-5; Blue dots: PVC/PHASPKO-2.5
By comparing the thermal stability of PVC/PHASPKO-2.5 and PVC/PHASPKO-5
binary blend, PVC/PHASPKO-5 showed an earlier decomposition in both first and second
stage of decomposition. PVC/PHASPKO-2.5 was more thermo-stable by having DTG peaks
of both stage of decomposition shifted to higher temperatures as shown in Fig. 5.38.
These observations were supported by the magnitude of degradation activation energies
of both binary blends where in the first and second stage of degradation: Ed of
PVC/PHASPKO-2.5 > Ed of PVC/PHASPKO-5.

177
Fig. 5.39 DTG thermograms of PVC/degSPKO2.5 and PVC/degSPKO5 binary blends.
Black dots: PVC/degPHASPKO-5; Blue dots: PVC/degPHASPKO-2.5
For PVC/degPHASPKO-2.5 and PVC/degPHASPKO-5 binary blends, the
PVC/degPHASPKO-5 showed a lower thermal stability at first stage of decomposition.
However, PVC/PHASPKO-2.5 appeared to be less thermo-stable in the second stage of
decomposition as shown in Fig. 5.39. These observations were consistent with the
magnitude of degradation activation energies for both binary blends where in the first
stage of degradation: Ed of PVC/degPHASPKO-2.5 > Ed of PVC/degPHASPKO-5; in second
stage of decomposition: Ed of PVC/degPHASPKO-2.5 < Ed of PVC/degPHASPKO-5.
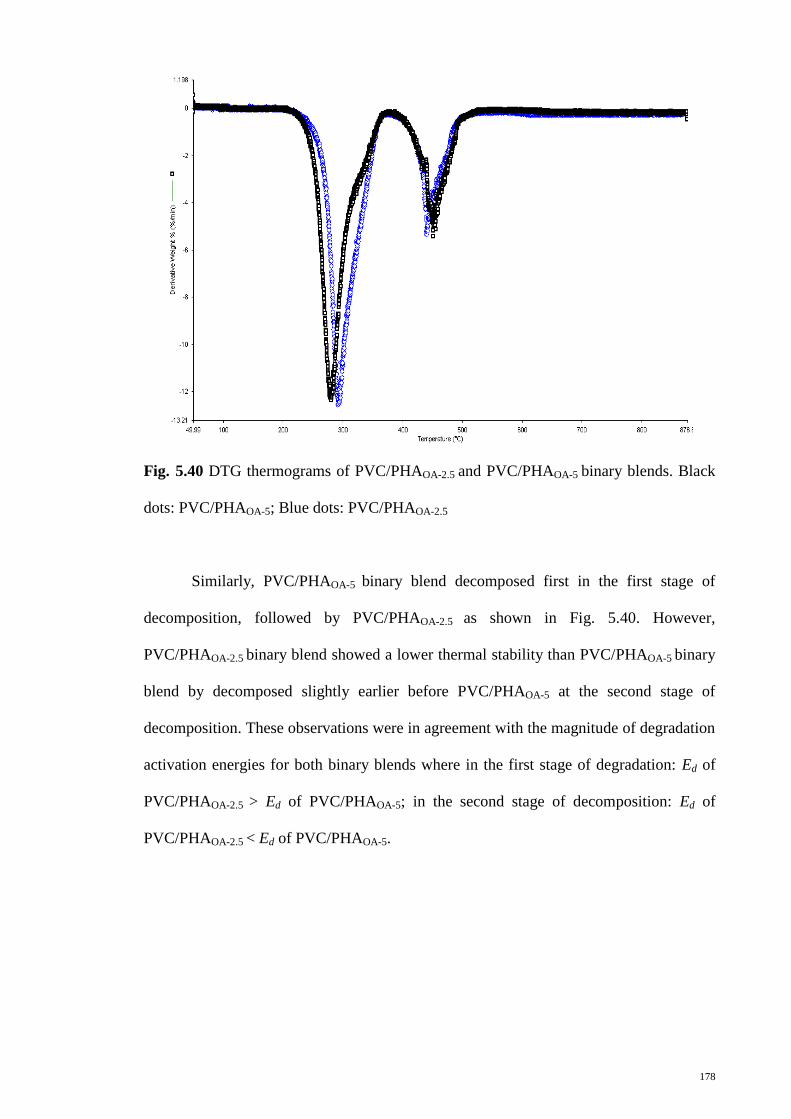
178
Fig. 5.40 DTG thermograms of PVC/PHAOA-2.5 and PVC/PHAOA-5 binary blends. Black
dots: PVC/PHAOA-5; Blue dots: PVC/PHAOA-2.5
Similarly, PVC/PHAOA-5 binary blend decomposed first in the first stage of
decomposition, followed by PVC/PHAOA-2.5 as shown in Fig. 5.40. However,
PVC/PHAOA-2.5 binary blend showed a lower thermal stability than PVC/PHAOA-5 binary
blend by decomposed slightly earlier before PVC/PHAOA-5 at the second stage of
decomposition. These observations were in agreement with the magnitude of degradation
activation energies for both binary blends where in the first stage of degradation: Ed of
PVC/PHAOA-2.5 > Ed of PVC/PHAOA-5; in the second stage of decomposition: Ed of
PVC/PHAOA-2.5 < Ed of PVC/PHAOA-5.

179
Fig. 5.41 DTG thermograms of PVC/degPHAOA-2.5 and PVC/degPHAOA-5 binary blends.
Black dots: PVC/degPHAOA-5; Blue dots: PVC/degPHAOA-2.5
Comparing the thermal stability of PVC/degPHAOA-2.5 and PVC/degPHAOA-5
binary blend, PVC/degPHAOA-5 showed an earlier decomposition at both first and second
stage of decomposition as shown in Fig. 5.41. These observations were consistent with
the magnitude of degradation activation energies of both binary blends where in the first
and second stage of degradation: Ed of PVC/degPHAOA-2.5 > Ed of PVC/degPHAOA-5.
Judging from these observations, the PVC/PHA blends were less thermal stable
than the unplasticized PVC. One possible explanation for these phenomena is plasticizer
can induce the degrading effects to the polymer as a consequence of the fusion of
plasticizer-PVC chains (Minsker et al., 1988). The effect was more pronounced when the
amount of plasticizer was increased. This could be seen by the decrease in thermal
stability and activation energy of the polymer blends in the first stage of degradation
when the amount of PHA plasticizer was increased.

180
According to Tawfik et al. (2006), the decrease of thermal stability for the PVC
mixture when PVC is mixed with any polyesters could be attributed to the partial
hydrolysis of the polyesters with HCl gas evolved during first stage of decomposition.
This would lead to the formation of acid chlorides which possess a catalytic effect on the
further dehydrochlorination process, therefore accelerating the rate of decomposition and
subsequently lower the initial temperature of decomposition.
5.5 Determination of Tg of PVC/PHA polymer blends by DSC analysis
The Tg values of PVC, PHA and PVC/PHA binary blends obtained from the DSC
measurements were listed in Table 5.9 and 5.10. DSC thermograms of PVC, PHA and
PVC/PHA samples which indicated Tg were shown in Appendix J.
Table 5.9 Glass transition temperatures of the polymer constituents in ºC and ºK
Polymer Glass transition temperature, Tg
°C °K
PVC 78.6 351.6
PHASPKO -44.4 228.6
170 °C-treated PHASPKO -47.5 225.5
PHAOA -44.1 228.9
170 °C-treated PHAOA -47.3 225.7
From Table 5.9, Tg of PVC was 78.6ºC. The corresponding values of polymeric
and 170ºC heat-treated PHASPKO were -44.4 and -47.5ºC; polymeric and 170ºC heat-
treated PHAOA were -44.1 and -47.3 ºC, respectively.

181
Table 5.10 Glass transition temperatures of PVC/PHA polymer blends in ºC and ºK
PVC/PHA binary blends 1Tg of blend
°C °K
PVC/PHASPKO-2.5 73.7 346.7
PVC/degPHASPKO-2.5 73.0 346.0
PVC/PHASPKO-5 71.9 344.9
PVC/degPHASPKO-5 71.1 344.1
PVC/PHAOA-2.5 74.5 347.5
PVC/degPHAOA-2.5 74.2 347.2
PVC/PHAOA-5 72.6 345.6
PVC/degPHAOA-5 72.4 345.4
All PVC/PHA binary blends showed a Tg lower than that of PVC (Table 5.10).
Besides, the Tg was intermediate to those of the component polymers, indicating a good
miscibility and compatibility within the system. The molecular basis of miscibility could
be attributed to the polar and hydrogen bonding interactions between PHA and PVC.
Several factors are known to affect the Tg of the polymer blend. The most
important factor is chain flexibility of the polymer. Tg will be lowered if flexibility is
built into the polymer, for example, by a lubricant effect. A second factor in determining
Tg value is the molecular polarity of the polymer. Increasing the polarity of a polymer
increases its Tg. Some equations fail to correctly predict Tg of plasticizer-polymer
mixture because it neglects specific PVC-plasticizer interactions (Nielsen & Landel,
1994).
In this study, reduction of the Tg for the polymer blends was observed when the
proportion of PHA increased. The marked decrease in Tg values for the higher PHA
182
composition in the binary blends were in agreement with the observation of decreased Ed
and ∆S values when the PHA content increased in the blend.
The reduction of Tg was lesser when polymeric PHA was used as the plasticizer
instead of the oligomeric PHA. In other words, PVC plasticized with oligomeric PHA
had lower Tg than PVC plasticized with polymeric PHA. Plasticization of PVC by
oligomeric PHA greatly enhanced the segmental mobility of the polymers system
compared to polymeric PHA, which in turn modified the glass transition temperatures
and material properties of the polymer blend in a greater extent. This is because shorter
plasticizer fragments could greatly increase the free volume in the polymer system
compared to longer, less mobile chains. Therefore the presence of oligomeric PHA as
plasticizer would contribute to better mobility and therefore lower Tg for the polymer
mixture.
Polymeric PHA had longer polymer chain than the oligomeric PHA and so had
more carbonyl group for hydrogen bonding and thus higher interacting surfaces and
segments with the PVC, leading to a decrease of segmental flexibility of the polymer
chains. Oligomeric PHA had lower molecular weight and more end groups. Although it
had overall higher amount of terminal COOH and OH groups which could contribute to
the dipole-induced dipole interactions with neighboring PVC polymer molecules, but it
had less carbonyl group for hydrogen bonding and thus had weaker interaction and lesser
entanglement with PVC. It should be noted that the short-range intermolecular forces
contributed by the dipole-dipole interactions are not that strong as compared to the
hydrogen bonding.
The reduction of Tg of PVC by PHAOA was lesser compared to PHASPKO,
indicating a lower extent of mobility of the molecular chain segments in the PVC
plasticized with PHAOA. Branching of plasticizer tend to hinder the movement of
plasticizer within the polymer matrix (Marcilla et al., 2004). PHAOA consisted of higher

183
amount of bulky alkyl side chains (C14 and C14:1) which may decrease the molecular
flexibility in the polymer blend whereby the highly branched PHA polymer chains were
slightly hindered from sliding past each other in the polymer system.
Besides that, PHAOA contained more long unsaturated side chains in which high
electron density in the double bond of unsaturated pendant group would act as electron
donating group to the electropositive carbon atom in C-Cl of PVC, leading to a strong
specific interaction with the PVC segments which could subsequently decrease the
segmental mobility and increase the Tg of the polymer blend.
5.5.1 Correlation of polymer-plasticizer interaction with Tg derived from Gordon-
Taylor equation
Generally, the compositional dependence Tg of a compatible polymer blend lies
between the Tg of the constituents and it can be expressed by Gordon-Taylor equation.
According to An et al. (1997), Gordon-Taylor equation should be applicable to
determine the Tg of blends with not very strong specific interactions within the mixture.
It should be pointed out here that the constant k in the Gordon-Taylor equation is
the model fitting parameter which includes all the possible interactions within the
polymer mixture. These interactions were actually difficult to be determined precisely by
conventional empirical and mechanistic approach. Thus the k-variable is usually
determined via data fitting.
DSC measurements yielded experimental Tg and the values were compared with
the Tg determined from the Gordon-Taylor equation. The calculations of Tg of PVC/PHA
blends using Gordon-Taylor equation via data substitution and simultaneous equation
solution approaches were described in Appendix K and the data were tabulated in Table
5.11.

184
Table 5.11 Tg of PVC/PHA binary blends determined from DSC analysis and Gordon-Taylor Equation via data substitution and simultaneous
equation solution approaches
PVC/PHA
blend
2.5 PHR
5 PHR
1Tg exp
/°C
2Tg calc /°C
3l∆ Tgl /ºC k-factor Tg exp /°C Tg calc /°C
l∆ Tg l /ºC k-factor
PVC/ PHAOA 74.5 Software 75.4 0.9 0.91 72.6
Software
72.2 0.4 0.91
Substitution 75.1
0.6 0.85
Substitution 71.7 0.9 0.85
PVC/degPHAOA 74.2
Software 75.3 1.1 0.90 72.4
Software 71.9 0.5 0.90
Substitution 75.0
0.8 0.83 Substitution 71.4 1.0 0.83
PVC/PHASPKO 73.7 Software 74.9 1.2 0.80 71.9
Software 71.3 0.6 0.80
Substitution 74.6
0.9 0.74 Substitution 70.9 1.0 0.74
PVC/degPHASPKO 73.0 Software 74.4 1.4 0.72 71.1
Software 70.3 0.8 0.72
Substitution 74.1
1.1 0.67 Substitution 69.8 1.3 0.67
1
Tg exp: experimental Tg from DSC measurement; 2Tg calc: calculated Tg from Gordon-Taylor equation;
3l∆Tgl: lTg exp - Tg calcl

185
It was found that the experimental Tg data for all the binary blends gave an
excellent fit with those obtained from the Gordon-Taylor equation. From Table 5.11, the
absolute values of ∆Tg (l∆Tgl) lied in the range of 0.4ºC and 1.4ºC. These results were in
satisfactory agreement with the Gordon-Taylor fitting approach, with the differences
between the respective Tg values lied within experimental error (< 2 ºC) (Penzel et al.,
1997).
The value of k-variable obtained from solving the simultaneous equations for
PVC/SPKO blend was 0.80 and the k-variable obtained from the experimental data
substitution approach was 0.74, which showed a small difference. For PVC/degSPKO
blend, the value of k-variable obtained from the simultaneous equations solution was
0.72 and it differed with the k-variable (0.67) obtained from the substitution approach by
a small margin.
For PVC/OA blend, the value of k-variable obtained from the simultaneous linear
equations solution was 0.91. This value was close to the k-variable (0.85) obtained from
the data substitution approach. For PVC/degOA blend, the k-variable obtained from the
simultaneous linear equations solution was 0.90, which differed from the k-variable (0.83)
obtained from the Tg substitution approach by 0.07.
The differences of the two estimates of k-variable were quite small with
variations ranged from 0.05 to 0.07. This showed that there was insignificant difference
between the Tg values obtained using the two different determination methods
(simultaneous equations solution and substitution method) as the k-specific parameters
were not likely to deviate greatly.
From Table 5.11, PVC/polyester and PVC/PHASPKO blends exhibited smaller
variations between the experimental Tg data and the Tg calculated via Gordon-Taylor
expression compared to PVC/oligoester and PVC/PHAOA blends. On the other hand,
compared to PVC/PHA2.5 blends, PVC/PHA5 blends showed a closer experimental Tg

186
value with the predicted Tg value as shown by the small l∆Tgl value. This is due to the
fact that by increasing the mass composition of PHA, the predictive power of the
equation increased as the k-factor becomes more reliable variable component within the
predictor.
5.5.2 Correlation of polymer-plasticizer affinity with Tg derived from Fox equation
Fox equation was adapted to correlate the PVC-plasticizer system by comparing
the experimental Tg data obtained from DSC measurement with the Tg calculated from
Fox equation. Based on the classical theory stated by Sears and Darby (1982), the
compatibility of the polymer and plasticizer is related to the PVC-plasticizer interaction
forces.
The good miscibility within PVC-PHA blends is believed to be the result of
specific intermolecular attractions between the electron donating and electron accepting
functional groups of the two polymers. This apparent affinity between the polymer and
plasticizer resulted in the values of Tg for the blends from experimental measurement to
be higher than expected.
A simplified model as shown in Fig. 5.42 was established to describe the factors
influencing the Tg of polymer-plasticizer blend, where this model was previously
established by Slark (1997) and tested with the solute-polymer Tg values for a
combination of a solute in various polymers.

187
Fig. 5.42 Simplified model of factors affecting the Tg of polymer-plasticizer blends
(Adapted from Slark, 1997)
Generally, the Tg in the absence of intermolecular interactions could be calculated
using Fox Equation (3.9), as this equation does not take into account the relevant
intermolecular forces. Hence two parameters: δTg and ∆Tg were defined relating to the
difference between the experimental Tg and calculated Tg as shown in the following
relationships:
–
(5.2)
–
–
(5.3)
where Tg exp: experimental Tg from DSC measurement; Tg calc: calculated Tg from Fox
equation; Tg pol: Tg of polymer.
Equation (5.3) was derived in the attempt to normalize for the differences in the
Tg pol, in this case, the Tg of PVC since the magnitude of δTg depends on the Tg of
polymer (Slark 1997). The calculations of Tg calc, δTg and ∆Tg for all the PVC/PHA binary
blends were described in Appendix L and the values were summarized in Table 5.12.

188
Table 5.12 Tg exp, Tg calc, δTg and ∆Tg of PVC/PHA binary blends determined from DSC
analysis and Fox equation
PVC/PHA
binary blend
2.5 phr
5 phr
1Tg exp
/°C
2Tg calc
/°C
δTg
/°C
∆Tg
/%
Tg exp
/°C
Tg calc
/°C
δTg
/°C
∆Tg
/%
PVC/PHAOA
74.5 74.1
0.4 8.9 72.6
69.8
2.8 31.8
PVC/degPHAOA 74.2
74.0
0.2 4.3 72.4
69.6
2.8 31.1
PVC/PHASPKO 73.7 74.1
-0.4 -8.9 71.9
69.7
2.2 24.7
PVC/degPHASPKO 73.0 73.9
-0.9 -19.1 71.1
69.4
1.7 18.5
1Tg exp: experimental Tg from DSC measurement;
2Tg calc: calculated Tg from Fox equation
The deviations of experimental Tg from that predicted by Fox equation would
often be observed in systems with specific interactions (Zhang et al., 1997). From Table
5.12, most of the binary blends exhibited significantly higher Tg than the expected values.
The Tg was elevated as a result of the presence of interactions between electron donating
and electron accepting functional groups of the blend components as mentioned earlier.
A good plasticizer should have low affinity between plasticizer and polymer in
order to have effective plasticization, which results in a higher chain mobility and lower
Tg for the polymer blend. When the apparent affinity between plasticizer and polymer
increased due to significant molecular interactions, the reduction of Tg of the polymer
mixture would be lesser as the plasticizing effect to the polymer decreased.
∆Tg was higher in the case of PVC/polyesters binary blend compared to
PVC/oligoesters binary blends. The higher Tg exp value in PVC/polyesters blends could
be attributed to the presence of intermolecular forces i.e. hydrogen bonding existing in
between polymeric PHA and PVC polymer chains in the PVC/PHA system. Polymeric

189
PHA had longer polymer chain than oligomeric PHA, and thus had more spatially
aligned polar C=O groups to be contributed for the hydrogen bonding.
∆Tg was higher in PVC/PHAOA binary blend compared to PVC/PHASPKO blend.
This was due to the higher intermolecular interactions present in the polymer mixture,
which could be contributed to the probable π-electrons interaction in the electron
acceptor, PVC with the electron donor, the double bond of the PHAOA’s unsaturated side
chains. The π-electrons in the double bond may interact with the electropositive carbon
atom in the C-Cl bond of PVC, which may result in a relatively higher apparent affinity
between the PHAOA plasticizer and PVC polymer chains.
∆Tg was very low for the PVC/PHASPKO-2.5 and PVC/degPHASPKO-2.5 binary
blends, which exhibited a negative value for the difference as both oligomeric and
polymeric SPKO-PHA may have considerably weaker interactions with PVC.
∆Tg was lower for PVC/PHA2.5 binary blend compared to PVC/PHA5 binary
blend. This indicates that there was a relatively lower molecular interaction in terms of
attractive forces between the two polymers as a result of lesser PHA plasticizer present
in the polymer blend, and therefore lesser specific interactions within the system.
The maximum deviations of the experimental Tg-composition data from the Tg
obtained from Fox equation strongly implied the existence (although limited to some
extent) of intermolecular interactions between the constituents of the blend. This was due
to the results of intermolecular forces between the PHA and PVC, which have more
influence on the co-operative motions of polymer backbone associated with the Tg.
It is postulated that the extent of interactions between PHA and PVC may
depends on the PVC tacticity, i.e. the arrangement of Cl atom along the PVC chain. The
tacticity has a significant effect on the free volume within the polymer blends (Wypych,
2008). PVC with isotactic or syndiotactic segments may give different level of
190
interactions with PHA, either by having a closer chain interactions e.g. increased
hydrogen bonding and lower mobility in the system, or vice versa.
5.5.3 Summary of DSC analysis
The glass transition temperature of pure PVC obtained in this work agreed well
with reported values in the literature. The addition of mcl-PHA plasticizers to the PVC
decreased the glass transition temperature of the polymer blend. A single transition was
observed for all the polymer blends and the temperature shift pattern was that expected
for a miscible blend. These results suggested that the polymeric and oligomeric SPKO-
and OA-derived mcl-PHA were compatible and miscible with PVC when these
biopolyesters as well as their oligoesters were used as plasticizers for PVC. However, the
glass transition temperatures of the PVC/PHASPKO blends were found to be lower than
the PVC/PHAOA blends. On the other hand, PVC plasticized with oligomeric PHA
showed lower Tg than those PVC plasticized with polymeric PHA.
In this study, two empirical formula suggested by Gordon-Taylor and Fox were
used in the theoretical prediction of the Tg for the compatible polymer blends. The
experimental Tg values from DSC were compared with theoretical Tg values predicted by
the Gordon-Taylor and Fox equations. It was found that the experimental Tg results from
DSC analysis fitted well with the Gordon-Taylor equation. However, the experimental Tg
was generally higher than the values calculated from the Fox equation, as the
intermolecular forces present in the polymer system were not taken into consideration in
the equation. This study showed the existence of interpolymer interactions, to some
limited extent, between PVC and mcl-PHA.
191
5.6 Dynamic mechanical analysis of PVC/PHA blends
Dynamic mechanical analysis (DMA) or viscoelastic measurement is an
alternative method to study the polymers miscibility as well as the mechanical properties
of the polymeric materials (Walsh et al., 1982).
5.6.1 Viscoelastic measurements of PVC, PHA & PVC/PHA binary blend
When there are specific polymer-polymer interactions in the mixture of two
polymers, they form a miscible system. The mechanical properties of these compatible
blends will show a single Tg value and a single modulus transition zone, which varies
regularly with composition (Nielsen & Landel, 1994).
In this study, Tg was determined from the maximum peak of loss modulus (E”)
curve as E” was shown to be more consistent compared with other determinations of Tg
e.g. onset of storage modulus or maximum of tan δ curve. The loss modulus values
change with the temperatures and transitions in the polymer blends. These transitions
indicate subtler changes in the blend and the temperature peak of loss modulus is mainly
affected by fusion of PVC crystallites (Menard, 2008).
For all PVC and PVC/PHA systems studied, the values of the Tg were obtained
from the plots of loss modulus versus temperature and were evaluated from 40 to 140°C
for PVC; PHA from -60 to 30°C and PVC/PHA blends from 40 to 120°C. The loss
modulus curve of PHASPKO showed a peak at -36.8°C which corresponded to the glass
transition temperature (Tg) of PHA. PVC showed E” maximum at 91.9°C, as shown in
the loss modulus versus temperature curve. Table 5.13 summarized the Tgs of the binary
blends obtained from loss modulus peak versus temperature.

192
Table 5.13 Tg of PVC/PHA binary blends measured from loss modulus peak maxima in
DMA
Tg /°C (Loss modulus peak maxima) 2.5 phr 5 phr
PVC/PHASPKO 83.4 82.7
PVC/degPHASPKO 80.9 79.7
PVC/PHAOA 84.6 83.6
PVC/degPHAOA 81.7 80.2
The Tg values obtained from the loss modulus maximum displayed similar trends
to those Tg values obtained from DSC analysis. Both measurements of DMA and DSC
gave consistent Tg results and showed a single Tg for all the PVC/PHA blends compared
to the individual polymers, indicating that the mcl-PHA were highly miscible with PVC.
Overall the Tg of all the binary blends were lower than the PVC, with Tg of PVC/PHA5
lower than PVC/PHA2.5; Tg of PVC/PHASPKO lower than PVC/PHAOA and Tg of
PVC/oligoesters lower than PVC/polyesters.
It should be noted that exact Tg values from DMA measurement usually were not
similar with the values reported from DSC as the glass transition is a range of behavior
where scientists have agreed to accept a single temperature as the indicator per certain
standards. Nevertheless different industries use different points from the same data set
that can vary as much as 15°C. DSC and DMA measure different processes and thus, the
numerical value can vary quite a bit (Turi, 1997).
The loss modulus curves of PVC, PVC/PHA2.5 and PVC/PHA5 binary blends
which consisted of polymeric PHA (PHASPKO and PHAOA) and oligomeric PHA
(degPHASPKO and degPHAOA) as plasticizers were compared in Fig. 5.43, Fig. 5.44, Fig.
5.45 and Fig. 5.46.

193
Fig. 5.43 Tg values obtained from the peak of loss modulus vs. temperature curves of
(a) PVC, (b) PVC/PHASPKO-2.5; and (c) PVC/PHASPKO-5
Fig. 5.44 Tg values obtained from the peak of loss modulus vs. temperature curves of
(a) PVC, (b) PVC/degPHASPKO-2.5; and (c) PVC/degPHASPKO-5

194
Fig. 5.45 Tg values obtained from the peak of loss modulus vs. temperature curves of
(a) PVC, (b) PVC/PHAOA-2.5; and (c) PVC/PHAOA-5
Fig. 5.46 Tg values obtained from the peak of loss modulus vs. temperature curves of
(a) PVC, (b) PVC/degPHAOA-2.5; and (c) PVC/degPHAOA-5

195
Fig. 5.43 to Fig. 5.46 clearly showed that the glass transition temperature was
shifted to lower temperature when PVC was mixed with PHA. The order of magnitude of
lowering the Tg value gets higher when the PHA content gets higher in the blend. This
means that the plasticization of PVC by higher amounts of mcl-PHA reduced the Tg of
the polymer blends more effectively. A higher PHA content imparted better
plasticization to the PVC due to more PHA plasticizer embedding themselves between
the PVC chains, thus spacing them further apart to increase the free volume and polymer
chain mobility. This in turn lowered the Tg of the polymer blend more significantly.
Besides that, the loss modulus value of pure PVC as seen in Fig. 5.35 to Fig. 5.38
had been reduced with the increase in the PHA content. The loss modulus (E”) is related
to the energy dissipated as heat upon deformation. It describes the ability of a material to
dissipate energy and provides an indication of the damping capacity of the material. Low
loss modulus indicates low damping properties and hence elastic behavior. Therefore by
increasing the PHA content in the polymer blend, the blended material is transforming to
a more elastic behaviour. This agrees with Ahmad et al. (2007) where low value of loss
modulus shows an elastic polymeric behaviour.
5.6.2 Stiffness of PVC/PHA blends
The extent of decrease in stiffness and changes in the softness of the plasticized
PVC depend on both the level of plasticization and the nature of the plasticizer
(Hernandez et al., 2000). As discussed earlier, introduction of the plasticizer into the
polymer system greatly increased the mobility among the polymer chain, and this
subsequently increased the softening properties of the polymer. Fig 5.47 to Fig. 5.50
revealed the temperature variation of film’s stiffness for the PVC/PHASPKO,
PVC/degPHASPKO, PVC/PHAOA and PVC/degPHAOA polymer blends.

196
Fig. 5.47 Temperature variation of film’s stiffness for (a) PVC, (b) PVC/PHASPKO-2.5;
and (c) PVC/PHASPKO-5
Fig. 5.48 Temperature variation of film’s stiffness for (a) PVC, (b) PVC/degPHASPKO-2.5;
and (c) PVC/degPHASPKO-5

197
Fig 5.49 Temperature variation of film’s stiffness for (a) PVC, (b) PVC/PHAOA-2.5; and
(c) PVC/PHAOA-5
Fig. 5.50 Temperature variation of film’s stiffness for (a) PVC, (b) PVC/degPHAOA-2.5;
and (c) PVC/degPHAOA-5

198
As shown from Fig. 5.47 to Fig. 5.50, the stiffness of the polymer blends
decreased when the proportion of PHA increased. According to Wypych (2004), when
larger quantities of PHA plasticizers were added into the PVC, more amorphous areas of
the polymer became swollen. This would lead to increased ease of movement of the
macromolecules, thus making the PVC-PHA blends to be more flexible.
On the other hand, by comparing the film’s stiffness of the PVC/PHA with
PVC/degPHA blends at 40°C, it could be seen that addition of oligomeric PHA could
provide greater flexibility to the rigid PVC compared to the polymeric PHA, by
introducing greater internal lubrication effect. The effectiveness in the lubrication effect
could be attributed to the widespread specific interactions between the shorter chain
fragments of oligomeric PHA with PVC, promoted by the increased hydroxyl and
carboxyl end groups.
5.6.3 Comparison of elastic modulus of PVC and PVC/PHA binary blends
As elaborated in Section 3.2.2.4.5.1, the elastic modulus (E) is a measure of the
stiffness of a component and its tendency to be deformed elastically when a force is
applied to it.
For rigid PVC, typical elastic modulus lies between 2.4 to 4.1 GPa. In this study,
the calculated elastic modulus for the unplasticized PVC was around 3.92 GPa.
Subsequent elastic modulus values for the binary blends were summarized in Table 5.14.

199
Table 5.14 Elastic modulus values for PVC/PHA binary blends
Elastic Modulus (GPa) 2.5 phr 5 phr
PVC/PHASPKO 3.26 1.72
PVC/degPHASPKO 1.94 1.49
PVC/PHAOA 3.67 2.61
PVC/degPHAOA 2.85 2.1
As shown from Table 5.14, it can be seen that PVC plasticized with mcl-PHA
showed a considerable lower elastic modulus than individual PVC, with the elastic
modulus of both SPKO- and OA-derived PHA decreasing in the following order: PVC >
PVC/PHA2.5 > PVC/degPHA2.5 > PVC/PHA5 > PVC/degPHA5. These results were in
agreement with the decrease in the stiffness of the binary blends.
Overall, the effectiveness of reducing the elastic modulus of the polymer was
found to be better in PVC/PHA5 binary blends as compared to PVC/PHA2.5 binary blends;
better in PVC/PHASPKO binary blends as compared to PVC/PHAOA binary blends; and
better in PVC/oligoesters binary blends as compared to PVC/polyesters binary blends.
5.6.4 Comparison of storage modulus between binary blends
As elaborated in Section 3.2.2.4.5.2, storage modulus (E’) provides an indication
of rigidity of the material and its ability to resist deformation under an applied dynamic
stress. The decrease in E’ indicates a decrease in rigidity as well as the film stiffness.
The overall variation of storage modulus with temperature for PVC, PVC/PHA2.5
and PVC/PHA5 binary blends which consisted of polymeric PHA (PHASPKO and PHAOA)
and oligomeric PHA (degPHASPKO and degPHAOA) as plasticizers are compared in Fig.
5.51, Fig. 5.52, Fig. 5.53 and Fig. 5.54.
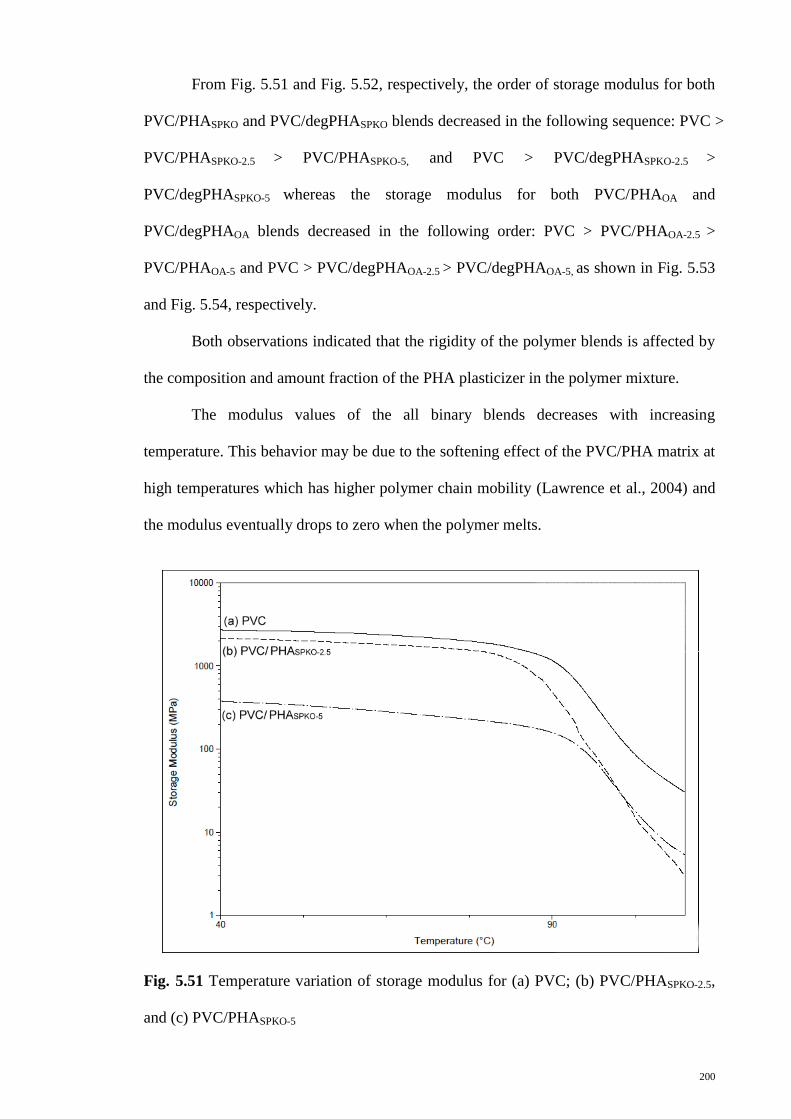
200
From Fig. 5.51 and Fig. 5.52, respectively, the order of storage modulus for both
PVC/PHASPKO and PVC/degPHASPKO blends decreased in the following sequence: PVC >
PVC/PHASPKO-2.5 > PVC/PHASPKO-5, and PVC > PVC/degPHASPKO-2.5 >
PVC/degPHASPKO-5 whereas the storage modulus for both PVC/PHAOA and
PVC/degPHAOA blends decreased in the following order: PVC > PVC/PHAOA-2.5 >
PVC/PHAOA-5 and PVC > PVC/degPHAOA-2.5 > PVC/degPHAOA-5, as shown in Fig. 5.53
and Fig. 5.54, respectively.
Both observations indicated that the rigidity of the polymer blends is affected by
the composition and amount fraction of the PHA plasticizer in the polymer mixture.
The modulus values of the all binary blends decreases with increasing
temperature. This behavior may be due to the softening effect of the PVC/PHA matrix at
high temperatures which has higher polymer chain mobility (Lawrence et al., 2004) and
the modulus eventually drops to zero when the polymer melts.
Fig. 5.51 Temperature variation of storage modulus for (a) PVC; (b) PVC/PHASPKO-2.5,
and (c) PVC/PHASPKO-5

201
Fig. 5.52 Temperature variation of storage modulus for (a) PVC; (b) PVC/degPHASPKO-
2.5, and (c) PVC/degPHASPKO-5
Fig. 5.53 Temperature variation of storage modulus for (a) PVC; (b) PVC/PHAOA-2.5,
and (c) PVC/PHAOA-5

202
Fig. 5.54 Temperature variation of storage modulus for (a) PVC; (b) PVC/degPHAOA-2.5,
and (c) PVC/degPHAOA-5
5.7 Summary
Results from FTIR and 1H-NMR spectroscopic analyses showed that PVC-PHA
miscibility was possibly due to the presence of specific interactions existed between the
two polymers. These inter-polymer attractions were probably attributed to the
interactions of α-hydrogen as well as the local dipoles between chlorines of PVC with
the C=O and C-O-C groups of PHA. Under the SEM examination, most of the observed
areas of the blends were composed of a dispersed phase, in which the individual PVC
particles had been swollen as a consequence of plasticizer absorption.
Thermal analytical techniques such as TGA, DSC and DMA had been applied to
the characterization of polymer blends as such techniques are particularly relevant to the
characterization of polymer material. Since PVC and PHA are viscoelastic, their
properties are temperature dependent and thus the thermal history of these polymeric

203
materials is an important variable. TGA study showed that PVC/mcl-PHA blend
exhibited similar two-stage degradation as PVC. Both degradation of mcl-PHA and
dehydrochlorination took place simultaneously in the first stage of degradation. All the
binary blends had lower thermal stability, Ed and ∆S than unplasticized PVC. These
findings were consistent with the Tg results obtained from DSC and DMA studies where
the binary blends had a lower and single glass transition temperature than the PVC.
These show that the polymer blends were miscible and compatible. Higher reduction of
Ed, ∆S and Tg was observed when the proportion of PHA was increased in the blend; and
when oligoesters were used as the plasticizer instead of polyesters, resulting in a more
flexible and softer plasticized PVC film. The SPKO derived PHA was also found to
exert a stronger plasticising effect than OA derived PHA.
In summary, small additions of PHA (2.5 and 5 phr.) to the PVC could
effectively reduce the Tg of the polymer and impart flexibility to the PVC compound.
Mcl-PHA and the oligoesters were shown to be a compatible plasticizer for PVC as they
have reasonable apparent affinity towards the PVC resin due to the presence of some
levels of intermolecular attraction between the polymers. The mcl-PHA also enhanced
the segmental mobility of PVC by increasing the free volume of the system and therefore
decreasing the glass transition temperature of the polymer blend and imparted greater
flexibility to the PVC compound.
204
CHAPTER 6
CONCLUSION
6.1 Conclusion
The bacterial polyester, medium-chain-length poly(3-hydroxyalkanoates) (mcl-
PHA), biosynthesized from two different palm oil-based carbon substrates, oleic acid and
palm kernel oil were heat treated at various decomposition temperatures. The thermal,
physical and structural properties of the un-degraded polyesters and their decomposition
products, low molecular weight hydroxyacids oligoesters were characterized to study the
thermal decomposition mechanism of the polymers. The polyesters and oligoesters were
then assessed for the ability to act as plasticizer for poly(vinyl chloride) (PVC).
6.1.1 Thermal degradation of mcl-PHA
Oleic acid and SPKO-derived mcl-PHA were thermally degraded at 160ºC to
180ºC; and at 160ºC to 190ºC respectively prior to the onset of rapid decomposition of
the polymers, to generate low molecular weight hydroxyacids oligoesters. The
degradation activation energy (Ea), pre-exponential factor (A) and change of activation
entropy (∆S) for oleic acid-derived PHA were 85.3 kJ mol-1
, 6.07 x 10⁵ s
-1 and -139.4 J
K-1
, respectively; whereas for SPKO-derived PHA, the values were found to be 128.9 kJ
mol-1
, 1.15 x 10¹⁰
s-1
and -57.6 J K-1
, respectively. Thermodegradation of mcl-PHA
resulted in a progressive reduction in the polymer molecular weight, generating useful
oligomeric hydroxyl acids with functional end-groups which could be used as
biodegradable additives, plasticizers, or as blending materials in a polymerization
process.
The thermal, physical and structural properties of the mcl-PHA changed
dramatically when subjected to moderately high temperatures of degradation. Glass

205
transition temperatures (Tg) and initial degradation temperatures for both types of mcl-
PHA decreased when the polymers were heat treated at increasing temperature. The
morphology of the polymers was altered following thermal treatments. Acid values
obtained from end group analysis showed that thermally-degraded PHA contained higher
concentration of carboxylic terminals and lower Mn compared to control PHA (non heat-
treated). The acid numbers of heat-treated PHA increased with increasing treatment
temperatures, with 180˚C-treated oleic acid-derived mcl-PHA and 190˚C-treated SPKO-
derived PHA contained the highest acid number, the highest concentration of terminal
carboxylic acids and the lowest number average molecular weight. These results were
corroborated with the decreased Mn from the GPC analysis. An increase in the acidity of
the decomposition products was probably due to the formation of low molecular weight
water-soluble hydroxyl acids in which the numbers of hydrogen and alkyl substituents
were greatly decreased in the polymer chains. The standard Gibbs free energy (∆Gº) for
the heat-treated PHA were positive, showing that dissociation of the weak
hydroxyalkanoic acids into thermodynamically stable hydroxyl-carboxylate and
hydrogen ions was not spontaneous, requiring energy input into the system to occur.
Analyses of GC, FTIR and 1H-NMR spectra suggested the thermal degradation
mechanism of mcl-PHA involved random hydrolytic chain scission which initiated at the
weak links of the ester linkages, producing a mixture of low molecular weight
hydroxyacids accompanied by proportional increase in the hydroxyl and carboxyl end
groups. Subsequent heating in the acidic environment at high temperature would lead to
dehydration of some hydroxyl terminal groups, producing alkenoic acids as additional
end product.

206
6.1.2 Assessment of PHA and its oligoesters as plasticizers for PVC
FTIR analysis confirmed the presence of both polar functional groups of PHA
and PVC in the binary blends. The amount of polar C=O groups varied with the
composition and type of PHA present in the binary blends. It is postulated that the PVC-
PHA miscibility was possibly due to the specific interactions between the ester C=O
group of PHA with the CH-Cl group of PVC.
Results from 1H-NMR spectroscopic analysis also showed that the inter-polymer
attractions between the two polymers were probably attributed to the α-hydrogen as well
as the local dipole-dipole interaction between chlorines of PVC with the PHA.
SEM micrographs of PVC/PHA films showed that plasticization of PVC involved
the PHA polymers penetrated in some of the porous structures of PVC, and interfused
with PVC polymer segments. These PHA polymers possibly embedded themselves
between PVC chains and increased the free volume in the system, by separating the PVC
chains further apart and therefore promoted higher polymer chain movements
PVC/PHA blends exhibited similar two-stage degradation pattern as PVC, where
the degradation of PHA and dehydrochlorination simultaneously took place in the first
stage of degradation. At the first stage of degradation, the thermal stability, degradation
activation energy (Ed), pre-exponential factor (A) and change of activation entropy (∆S)
decreased in the following order: PVC>PVC/PHA2.5>PVC/PHA5. The PHA plasticizer
can induce the degrading effects to the PVC possibly as a consequence of the solvation
of plasticizer-polymer chains and the effect was more pronounced when the amount of
plasticizer increased. Besides that, polymer blends consisting of PHA oligoesters
(compared to the longer polyesters) and the SPKO-derived mcl-PHA (compared to the
oleic acid derived PHA) as plasticizer had the lower thermal stability, Ed, A and ∆S.
These findings were consistent with the Tg results obtained from DSC and DMA. There

207
was no a clear trend of variation between the Ed, A and ∆S of PVC/PHA blends for the
second stage of decomposition as this stage of decomposition mainly consisted of the
decomposition of unsaturated hydrocarbon structures.
The miscibility of the PVC with PHA and its oligoesters was shown by the
PVC/PHA blend having a single glass transition based on DSC and DMA analyses. The
Tg of the blends decreased with increasing the amount of mcl-PHA as more PHA
plasticizer embedding themselves between the PVC chains, spacing them further apart to
increase the free volume and therefore imparting the plasticizing effect more
significantly. Polymer blends composed of PVC and the oligoesters as plasticizer
showed lower Tg than the blends composed of polymeric polyesters. As low molecular
weight plasticizers possessed more end groups, this would accordingly increase the free
volume and mobility among the PVC polymer chains, thus softer plasticized films with
better plasticizing effect would be formed. Oleic acid-derived mcl-PHA either in
polymeric or oligomeric form imparted lower plasticizing effect to the PVC compared to
SPKO-derived mcl-PHA by reducing the Tg of the polymer blends less effectively. A
plausible reason for that is that mcl-PHA derived from oleic acid consisted of polymer
chains with numerous longer side chains compared to mcl-PHA derived from SPKO, and
this would cause a decrease in chain hydrodynamic volume in the PVC system, resulting
in a less flexible and harder plasticized PVC film. The experimental Tg values from DSC
analysis were compared with theoretical Tg values predicted from the Fox and Gordon-
Taylor equations. It was found that the experimental Tg fitted well with the Gordon-
Taylor equation. However, the experimental Tg was generally higher than the values
calculated from the Fox equation, as the intermolecular forces present in the polymer
system were not taken into consideration in the equation, and therefore the differences
between the theoretical and experimental values can be used to predict the level of
intermolecular attractions between PVC and the plasticizers.
208
Both measurements of DSC and DMA gave consistent results where the dynamic
viscoelastic measurements showed a single Tg for the PVC/PHA blends and a lower loss
modulus peak compared to the PVC, indicating the PHA were highly miscible with PVC.
Decreased Tg, stiffness, storage modulus and elastic modulus were observed in the
polymer blends with higher amounts of PHA, and PHA in the form of oligoesters. When
larger quantities of PHA plasticizers were added to the PVC, more amorphous areas of
the PVC particles would be swollen and this would lead to increased ease of movement
of the PVC macromolecules. On the other hand, low molecular weight PHA plasticizer
would increase the degree of chain movement and segmental flexibility to the PVC
chains in a greater extent and would therefore increase the softening properties of the
blends.
In summary, oligomeric and SPKO-derived mcl-PHA were shown to be more
compatible plasticizers for PVC compared to polymeric and oleic acid-derived mcl-PHA.
These plasticizers enhanced the segmental mobility of PVC more effectively by
increasing the free volume and macromolecular mobility of the system.
6.2 Future research plan
For future study, a bigger size of the PVC-PHA plasticized films is needed for
measurements relating to mechanical properties i.e. tensile strength and elongation at
break. It would be of interest also to study the migration of the plasticizer from the PVC-
PHA compound, for example migration of the plasticizer on heating, resistance of
plasticizer to extraction by chemicals e.g. water, soap solution, polar or organic solvents
in order to investigate whether the plasticizers studied have sufficient affinities for the
PVC to resist migration from the internal regions to the surface.
The work presented here studied the lightly plasticized PVC at low level of mcl-
PHA. It is also interesting to investigate the effects of higher level of plasticizer in

209
formulations such as 10, 20, 30 and 40 parts of mcl-PVC per hundred parts of PVC resin
in terms of thermal and physical properties of the blends as well as to determine the
optimum point of plasticizer concentration. In terms of compound production, it is also
interesting to investigate the effect of mixing time in solution blending under defined
conditions, on the physical properties of the PVC/mcl-PHA binary blends.