Embed Size (px)
Citation preview
Chapter 1 Introduction and Summary of Conclusions
Introduction 5
Major Conclusions 6 Preparation of This Report 7
Terms Related to Race and Ethnicity 7 Terms Related to Tobacco Use 8
Demographic Characteristics of the Four Racial/Ethnic Minority Groups 8 Effects of Racial/Ethnic Background on Health 22
Chapter Conclusions 12
Chapter 2. Patterns of Tobacco Use Among Four Racial/Ethnic Minority Groups Chapter 3. Health Consequences of Tobacco Use Among Four Racial/Ethnic
Minority Groups 12 Chapter 4. Factors That Influence Tobacco Use Among Four Racial/Ethnic
Minority Groups 13 Chapter 5. Tobacco Control and Education Efforts Among Members
of Four Racial/Ethnic Minority Groups Z-1
12
References 15
Tobacco Use Among U.S. Racial/Ethnic Minority Groups
Introduction
This Surgeon General’s report on tobacco use summarizes current information on risk factors and patterns related to tobacco use among members of four major racial and ethnic minority groups in the United States: African Americans, American Indians and Alaska Natives, Asian Americans and Pacific Island- ers, and Hispanics. In addition, this report presents information on national and regional efforts to curtail consumption of tobacco products among members of these four groups. Previous Surgeon General’s reports on smoking and health have briefly summarized find- ings related to one or more of the racial/ethnic groups covered in this report, but this is the first Surgeon General’s report to concentrate specifically on the four major racial/ethnic groups in the United States.
Several factors prompted the development of this report. First, the information in this report has never before been compiled in one source. Consequently, policymakers, community leaders, researchers, and public health workers have had difficulty determin- ing the extent of the problem, identifying gaps in in- formation regarding tobacco use among members of the four groups, or being aware of existing tobacco con- trol programs that have demonstrated effectiveness. Thus, incorporating such information into the design and implementation of culturally appropriate services has been difficult.
Second, the four racial/ethnic groups currently constitute about one-fourth of the population of this country, and the Bureau of the Census projects that by 2050 the non-Hispanic white population in the United States will total only 53 percent (Day 1996). Prevent- ing health problems related to tobacco use among the individuals in racial and ethnic groups will be inte- gral to achieving U.S. public health objectives, such as those proposed in Healthy People 2000: National Health Promotion and Disease Prevention Objectives (U.S. Depart- ment of Health and Human Services [USDHHS] 1991, 1995; National Center for Health Statistics [NCHS] 1994).
This report contributes essential knowledge that must be incorporated into efforts to accomplish the Healthy People 2000 objectives, particularly these six goals:
l Objective 3.1. Reduce coronary heart disease deaths to no more than 100 per 100,000 people. (Age- adjusted baseline: 135 deaths per 100,000 people
in 1987.) Among African Americans, reduce the number from 168 to 115 deaths per 100,000 people between 1987 and the year 2000 (Objective 3.la).
l Objective 3.2. Slow the rise in lung cancer deaths to achieve a rate of no more than 42 per 100,000 people. (Age-adjusted baseline: 38.5 deaths per 100,000 people in 1987.) Among African Ameri- can males, slow the rise from 86.1 to 91 deaths per 100,000 people between 1990 and the year 2000 (Objective 3.2b).
l Objective 3.4. Reduce the prevalence of cigarette smoking to no more than 15 percent among people aged 18 years and older. (Baseline: 29 percent in 1987 [31 percent for men and 27 percent for women].) Particular year 2000 objectives include lowering the prevalence of smoking to 18 percent among African Americans (Objective 3.4d), 15 per- cent among Hispanics (Objective 3.4e), and 20 per- cent among American Indians and Alaska Natives (Objective 3.4f) and Southeast Asian men (Objec- tive 3.4g).
l Objective 3.5. Reduce the initiation of cigarette smoking by children and youths so that no more than 15 percent have become regular cigarette smokers by the age of 20 years. (Baseline: 30 per- cent of youths had become regular cigarette smok- ers by the ages of 20-24 years in 1987.)
. Objecfive 3.9. Reduce the prevalence of smokeless tobacco use among males aged 12-24 years to no more than 4 percent. (Baseline: 6.6 percent among males aged 12-17 years in 1988; 8.9 percent among males aged 18-24 years in 1987.) A specific objec- tive is to lower the prevalence of smokeless tobacco use among American Indian and Alaska Native young adults to 10 percent by the year 2000 (Ob- jective 3.9a).
l Objective 3.18. Reduce stroke deaths to no more than 20 per 100,000 people. (Age-adjusted baseline: 30.4 deaths per 100,000 people in 1987.) Among African Americans, reduce the number from 52.5 to 27.0 deaths per 100,000 people between 1987 and the year 2000 (Objective 3.18a).
Introduction and Summary 5
This report of the Surgeon General also responds to the need to thoroughly analyze the smoking-related health status of racial/ethnic groups and to determine if there is a differential risk for tobacco addiction (Chen 1993). High risk might derive from personal charac- teristics but also from social factors, such as migratory patterns, acculturation, and the tobacco industry’s his- torical involvement in the racial/ethnic communities and targeted advertising and promotion of tobacco products (see Chapter 4).
In addition, this report is needed to document how patterns of health, disease, and illness among people in the various racial/ethnic minority groups differ from patterns in the rest of the U.S. population. These differences reflect the groups’ exposure to to- bacco products, as well as the heterogeneity of the groups’ lifestyles, cultural beliefs and practices, genetic backgrounds, and environmental exposures. This re- port illustrates how patterns of tobacco use differ among and within the four racial/ethnic groups (Chapter 2). It compares the groups in terms of the incidence and the prevalence of death rates for diseases commonly associated with tobacco use and presents data from case-control and cohort studies whenever possible (Chapter 3).
The health status of members of racial and eth- nic groups in this country has also been the focus of previous federal reports, such as the Health Sfot~ of Minorities nrzd Lo7~~-Im~11zc Grou~75 (Health Resources and Services Administration [HRSAI 19851, the Report of the Secretnry’s Task Force OH BInck mzd Minority Henlth (USDHHS 19851, and CIrroizic Disense in Mifforify Pop~l- lations (Centers for Disease Control and Prevention [CDC] 1994). This Surgeon General’s report supports initiatives such as the Hispanic Health and Nutrition Examination Survey in the early 1980s; the Surgeon General’s National Hispanic/Latin0 Health Initiative (Novello and Soto-Torres 1993); special funding ini- tiatives from federal agencies such as the CDC, the National Cancer Institute, the National Institute on Alcohol Abuse and Alcoholism, the National Institute on Drug Abuse, the National Heart, Lung, and Blood Institute (1994), and the National Institute of Mental Health (National Institutes of Health 1993); the Department of Health and Human Services’s 1996 Hispanic Agendn for Action: lmprouiug Stwiccs to Hispanic Americans, and the 1998 President’s Race Ini- tiative, which includes special funding initiatives for the CDC, the Indian Health Service, and the Health Resources and Services Administration.
Major Conclusions
1. Cigarette smoking is a major cause of disease and death in each of the four population groups stud- ied in this report. African Americans currently bear the greatest health burden. Differences in the magnitude of disease risk are directly related to differences in patterns of smoking.
2. Tobacco use varies within and among racial/ ethnic minority groups; among adults, American Indians and Alaska Natives have the highest prevalence of tobacco use, and African American and Southeast Asian men also have a high preva- lence of smoking. Asian American and Hispanic women have the lowest prevalence.
3. Among adolescents, cigarette smoking prevalence increased in the 1990s among African Americans and Hispanics after several years of substantial de- cline among adolescents of all four racial/ethnic minority groups. This increase is particularly strik- ing among African American youths, who had the greatest decline of the four groups during the 1970s and 1980s.
4. No single factor determines patterns of tobacco use among racial/ethnic minority groups; these pat- terns are the result of complex interactions of mul- tiple factors, such as socioeconomic status, cultural characteristics, acculturation, stress, biological el- ements, targeted advertising, price of tobacco products, and varying capacities of communities to mount effective tobacco control initiatives.
5. Rigorous surveillance and prevention research are needed on the changing cultural, psychosocial, and environmental factors that influence tobacco use to improve our understanding of racial/ethnic smoking patterns and identify strategic tobacco control opportunities. The capacity of tobacco control efforts to keep pace with patterns of to- bacco use and cessation depends on timely recog- nition of emerging prevalence and cessation patterns and the resulting development of appro- priate community-based programs to address the factors involved.

Preparation of This Report This report of the Surgeon General was prepared
by the Office on Smoking and Health, National Cen- ter for Chronic Disease Prevention and Health Promo- tion, Centers for Disease Control and Prevention, U.S. Department of Health and Human Services, as part of the Department’s mandate, under Public Laws 91-222 and 99-252, to report to the U.S. Congress current in- formation about the health effects of tobacco use.
The report was produced with the assistance of experts in the behavioral, epidemiological, medical, and public health fields. Initial background papers were produced by more than 25 scientists w~ho \vere selected because of their expertise and familiaritv M’ith the topics covered in this report. Their various contri- butions were summarized into five major chapters that were reviewed by 28 peer revie\vers. The entire manu- script was then sent to 13 scientists and experts, wrllo reviewed it for its scientific integritv. Subsequently, the report was reviewed by various institutes and agencies within the Department of Health and Human Services.
Terms Related to Race and Ethnicity
Race and ethnicity are classifications currently used for various purposes, such as tracking morbidity and mortality statistics, defining group characteristics (as is done in many studies and by most federal and state agencies, including the U.S. Bureau of the Cen- sus), and exploring the health characteristics of indi- viduals and groups. Most extant data consider four rack! groups in the United States (African American or black, American Indian and Alaska Native, Asian American and Pacific Islander, and white) as well as two etlr,ric categories (Hispanic and non-Hispanic).
Specific choices have been made in selecting the labels used to identify individuals who share a given race, tradition, culture, or ethnicity. These labels dif- fer somewhat from those published in the Race and Ethnic Standards for Federal Statistics and Adminis- trative Reporting, more commonly known as Direc- tive 15 (U.S. Department of Commerce 1978). This di- rective presents rules for classifying persons into four racial groups (American Indian or Alaskan Native, Asian or Pacific Islander, black, and white) and two ethnic categories (Hispanic origin and not of Hispanic origin). The labels in this report were chosen to reflect current preferred use by many members of each group and researchers as well as to more clearly identify
Tobacco Use Amo~lg U.S. Ra&l/Ethic Minority Groups
members of a given group. Nevertheless, because of differences in the way in which ethnicity has been as- certained in the various studies, some overlap and misclassification may exist, particularly with regard to Hispanic origin (for example, Hispanics of African background may be classified as African Americans, or Hispanics may be classified as non-Hispanic whites). In addition, the terms used in this report do not always precisely depict the racial/ethnic group studied (for instance, this report consistently uses the term American I,diall and Alaska Ndiue, even when de- scribing studies of Nofive Americnm-a category that in some cases excludes Alaska Natives). Moreover, the terms used here do not reflect the fact that some studies were conducted in the 48 contiguous states and may exclude a substantial number of Alaska Natives and Native Hawaiians. Throughout this report, the following labels and definitions are used, with the ref- erents basically agreeing with those of Directive 15:
Afrimll Americau. Individuals who trace their an- cestry of origin to Sub-Saharan Africa.
Aliwricnn Idinn ~nrl AInska Nntiue. Persons who have origins in any of the original peoples of North America and who maintain that cultural identifi- cation through self-identification, tribal affiliation, or community recognition.
Asin~ American amI Pacific lslnnder. Individuals who trace their background to the Far East, South- east Asia, the Indian subcontinent, or the Pacific Islands.
His[JaJ7iC. Persons who trace their background to one of the Spanish-speaking countries in the Americas or to other Spanish cultures or origins.
Wlzite. Persons who have origins in any of the original peoples of Europe, North Africa, or the Middle East. Throughout most of this report, white refers to non-Hispanic whites.
Finally, this report avoids using such labels as /““FJk of color, spa%/ p0p741nti017s, Jntdticdtural pOp7dLP from, or diverse popzrlntinm because some people con- sider them inaccurate, improper, or pejorative. With- out question, not everyone will agree with the terms used in this report because no universally accepted labels exist. These terms will continue to evolve with time.
Terms Related to Tobacco Use
Throughout this report, F?rezlnle?zce of smking ces- sation is used to describe the proportion of persons who had ever smoked and who were former smokers at the time of survey (this term is used instead of quit ratio or quit rate). Definitions related to smoking status-ever smokers, never smokers, current smok- ers, and former smokers-are presented later in this report (see Chapter 2).
Demographic Characteristics of the Four Racial/Ethnic Minority Groups
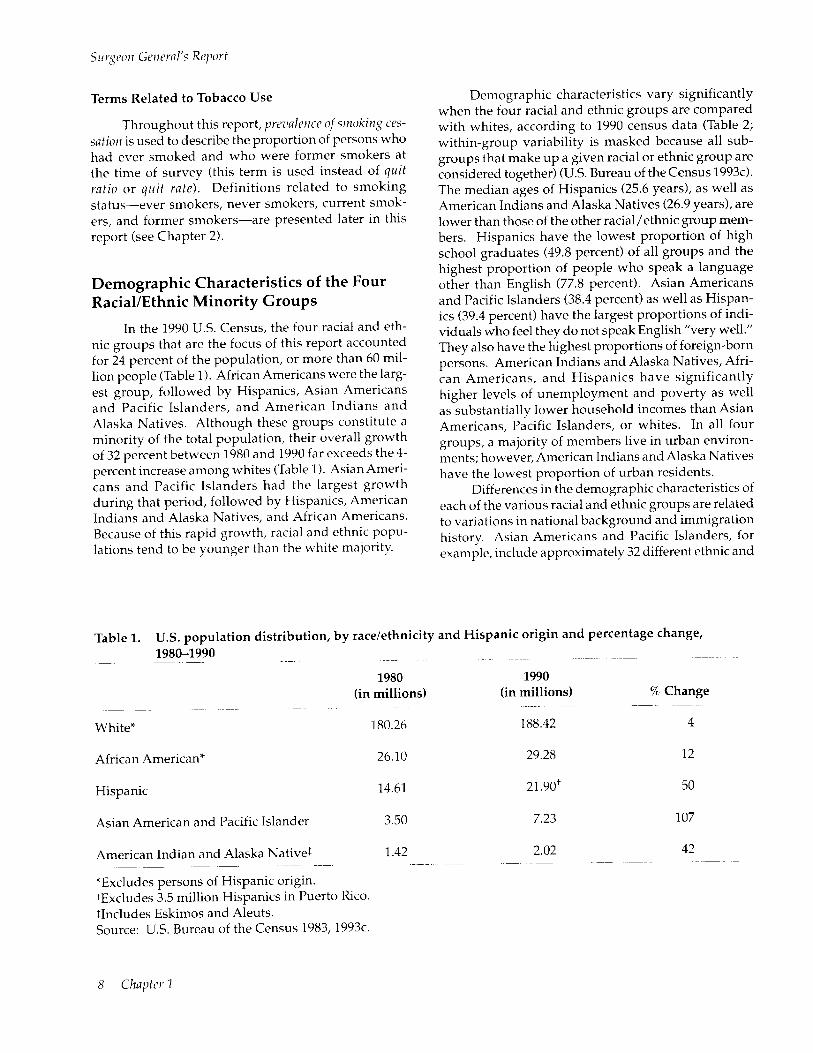
In the 1990 U.S. Census, the four racial and eth- nic groups that are the focus of this report accounted for 24 percent of the population, or more than 60 mil- lion people (Table 1). African Americans were the larg- est group, followed by Hispanics, Asian Americans and Pacific Islanders, and American Indians and Alaska Natives. Although these groups constitute a minority of the total population, their overall growth of 32 percent between 1980 and 1990 far exceeds the 4- percent increase among whites (Table 1). Asian Ameri- cans and Pacific Islanders had the largest growth during that period, followed by Hispanics, American Indians and Alaska Natives, and African Americans. Because of this rapid growth, racial and ethnic popu- lations tend to be younger than the white majority.
Demographic characteristics vary significantly when the four racial and ethnic groups are compared with whites, according to 1990 census data (Table 2; within-group variability is masked because all sub- groups th.at make up a given racial or ethnic group are considered together) (U.S. Bureau of the Census 1993~). The median ages of Hispanics (25.6 years), as well as American Indians and Alaska Natives (26.9 years), are lower than those of the other racial/ethnic group mem- bers. Hispanics have the lowest proportion of high school graduates (49.8 percent) of all groups and the highest proportion of people who speak a language other than English (77.8 percent). Asian Americans and Pacific Islanders (38.4 percent) as well as Hispan- ics (39.4 percent) have the largest proportions of indi- viduals who feel they do not speak English “very well.” They also have the highest proportions of foreign-born persons. American Indians and Alaska Natives, Afri- can Americans, and Hispanics have significantly higher levels of unemployment and poverty as well as substantially lower household incomes than Asian Americans, Pacific Islanders, or whites. In all four groups, a majority of members live in urban environ- ments; however, American Indians and Alaska Natives have the lowest proportion of urban residents.
Differences in the demographic characteristics of each of the various racial and ethnic groups are related to variations in national background and immigration history. Asian Americans and Pacific Islanders, for example, include approximately 32 different ethnic and
Table 1. U.S. population distribution, by racelethnicity and Hispanic origin and percentage change, 1980-1990
1980 1990 (in millions) (in millions) 70 Change
White* 180.26 188.42 4
African American* 26.10 29.28 12
Hispanic
Asian American and Pacific Islander 3.50 7.23 107
American Indian and Alaska Native% 1.42 2.02 42
*Excludes persons of Hispanic origin. *Excludes 3.5 million Hispanics in Puerto Rico. $Includes Eskimos and Aleuts. Source: U.S. Bureau of the Census 1983,1993c.
8 Clzaytrr 1

Tobacco Use Among U.S. Racial/Ethnic Minnrity Groups
Table 2. Selected demographic characteristics for the U.S. population, by racelethnicity, 1990
African American Indians/ Asian Americans/ Characteristic Americans Alaska Natives Pacific Islanders Hispanics Whites*
Population 29,930,524 2,015,143 7,226,986 21,900,089 188,424,773
Women (percentage)
Median age (years)
Foreign born (percentage)
52.8 50.4 51.2 49.2 51.3
28.2 26.9 30.1 25.6 34.9
4.9 2.3 63.1 35.8 3.3
Education (percentage of persons aged 225 years)
High school education Bachelor’s degree or higher
English-language ability (percentage of persons aged 25 years)
Speak a language other than English
Do not speak English “very well”
Number of persons per family
Percentage of families with own children aged ~18 years
Employment statust (percentage of persons aged 216 years)
Employed Unemployed
Percentage of employed persons aged 216 years in a managerial/professional occupation
Household income in 1989 ($) Median Mean
Per capita income in 1989 ($)
Poverty rate (percentage) Families Persons
Urban residents (percentage)
63.1 65.5 77.5 49.8 79.1 11.4 9.3 36.6 9.2 22.1
6.3
2.4
3.5
56.5
62.7 62.1 67.5 67.5 65.3 12.9 14.4 5.3 10.4 5.0
23.8 73.3 77.8 5.7
9.2 38.4 39.4 1.8
3.6 3.7 3.8 3.0
60.7 59.5 64.5 45.2
18.1 18.3 30.6 14.1 28.5
19,758 20,025 36,784 24,156 31,672 25,872 26,602 46,695 30,301 40,646
8,859 8,328 13,638 8,400 16,074
26.3 27.0 11.6 22.3 7.0 29.5 30.9 14.1 25.3 9.2
87.2 56.0 95.4 91.4 70.9
*Excludes persons of Hispanic origin. The population figures for African Americans in Tables 1 and 2 are different because the population cited in Table 2 includes African Americans of Hispanic origin, while the African
American population cited in Table 1 excludes persons of Hispanic origin. tThese figures do not include several categories of people who were not in the civilian labor force for various
reasons, such as students, housewives, retired workers, seasonal workers in an off season who were not looking for work, institutionalized persons, during the reference week).
and persons doing only incidental unpaid family work (less than 15 hours
Source: U.S. Bureau of the Census 1993a,c.
national groups and speak nearly 500 languages and dialects (Chen 1993). They trace their background to areas as diverse as Mongolia to the north, Indonesia and the South Pacific Islands to the south, India to the west, and Japan to the east. Hispanics include indi- viduals who trace their background to the original set- tlers of large areas in what is now the Southwest United States as well as recent immigrants from any of the 18 Spanish-speaking countries in Latin America. The American Indian and Alaska Native population in the United States is likewise composed of a richly diverse group of indigenous cultures of indigenous cultures, over half of whom do not live on a reservation (U.S. Bureau of the Census 1993~). More than 500 federally recognized tribes and an additional 100 nonfederally recognized tribes are concentrated primarily in 25 res- ervation states (U.S. Bureau of the Census 1992a). American Indians and Alaska Natives continue to speak more than 150 languages. (For additional infor- mation, see U.S. Bureau of the Census reports on Asian Americans and Pacific Islanders [1993a], Hispanics [1993b], and American Indians and Alaska Natives [ 1993~1.) Most African Americans in the United States can trace their ancestry to territories that include the modern states of Benin, Burkina Faso (formerly
Upper Volta), Cameroon, the Congo Republic, Cote d’lvoire (Ivory Coast), the Democratic Republic of the Congo (formerly Zaire), Gabon, Gambia, Ghana, Guinea, Liberia, Nigeria, Senegal, Sierra Leone, and Togo (Ploski and Williams 1989). The mode of entry for practically all Africans who entered the United States in the seventeenth, eighteenth, and nineteenth centuries (until 1865) was as slaves (see Chapter 4 for further historical discussion). Many recent immigrants came from the Caribbean islands and Sub-Saharan Africa. This report excludes data on the 3.5 million residents of Puerto Rico as well as data on residents of other territories and associated states of the United States; however, many of the issues discussed in this report are relevant to these individuals because they have been influenced by the events taking place in the 50 states.
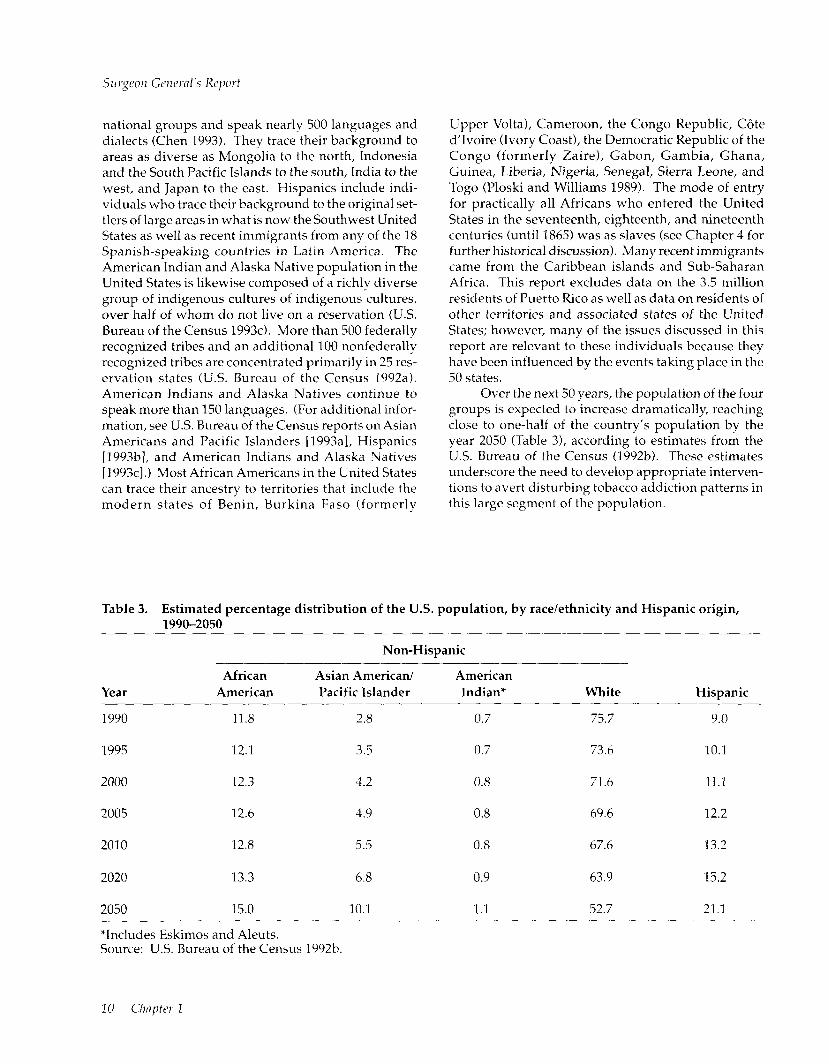
Over the next 50 years, the population of the four groups is expected to increase dramatically, reaching close to one-half of the country’s population by the year 2050 (Table 3), according to estimates from the U.S. Bureau of the Census (1992b). These estimates underscore the need to develop appropriate interven- tions to avert disturbing tobacco addiction patterns in this large segment of the population.
Table 3. Estimated percentage distribution of the U.S. population, by race/ethnicity and Hispanic origin, 1990-2050
Year African
American
Non-Hispanic
Asian American/ American Pacific Islander Indian* White Hispanic
1990 11.8 2.8 0.7 75.7 9.0
1995 12.1 3.5 0.7 73.6 10.1
2000 12.3 4.2 0.8 71.6 11.1
2005 12.6 ‘I.9 0.8 69.6 12.2
2010 12.8 5.5 0.8 67.6 13.2
2020 13.3 6.8 0.9 63.9 15.2
2050 15.0 10.1 1.1 52.7 21.1
*Includes Eskimos and Aleuts. Source: U.S. Bureau of the Census 1992b.
10 Chapter 2
Tblmco Uw Amorzg U.S. Rncid/Ethnic Minority Groups
Effects of Racial/Ethnic Background on Health
Extensive research has been conducted on the relationship between health and race/ethnicity (see, for example, Harwood 1981; Polednak 1989; Braithwaite and Taylor 1992; Young 1994). Published reports of these studies tend to show different rates of illness across racial/ethnic groups. Some of these dif- ferences may be explained by variations in each group’s beliefs and attitudes, traditional health-related practices, normative behaviors, social conditions, lev- els of access to high-quality health care, experiences with discrimination and racism, living env,ironments, competing causes of death, and genetic backgrounds. Genetic factors may contribute to certain differences among groups of people; however, culture, degree of acculturation, and socioeconomic factors are probably far more significant determinants of health status in the United States (Freeman 1993; Adler et al. 1994).
Culture is a broad concept (Kroeber and Kluckhohn 1963)-its influence encompasses all as- pects of daily life, including beliefs and practices about health and illness as well as norms that dictate behav- iors. Most contemporary societies include many dif- ferent cultures, which may be defined by historical, geographic, economic, social, and political elements (Helman 1985). The United States has always been a nation of immigrants and coexisting cultures.
Acculturation-the process of learning the val- ues, beliefs, norms, and traditions of a new culture (Marin 1992)-allows individuals to make choices and to learn of new worldviews, while keeping their origi- nal views (biculturalism) or modifying their initial perspectives to be more consonant with those of the new culture (assimilation). In multicultural societies such as the United States, acculturation occurs among immigrants (as they learn the host culture) as well as among individuals born in the United States (as they learn the culture of immigrants). Despite the signifi- cance of acculturation’s link with human behavior, few studies have focused on how acculturation might affect the health status and behavior of ethnic groups in the United States. Part of the problem has been the difficulty in designing appropriate measuring instru- ments (Marin 19921, although recent research has begun to assess the role that acculturation plays in
determining the health status of members of U.S. racial/ethnic groups (Perez-Stable 1994; Vega and Amaro 1994; Williams and Collins 1995).
Socioeconomic characteristics, which are power- ful determinants of health and disease (USDHHS 1985, 1991; Liberatos et al. 1988; HRSA 1991; Williams and Collins 1995), differ markedly among the racial and ethnic groups of the United States (Table 2). Levels of income and education may directly and indirectly af- fect the health status of individuals (Council on Ethi- cal and Judicial Affairs 1990; Weissman et al. 1991). Jncome, for example, often is a determinant of access to health care as well as of the quantity and quality of health care available. Persons with low incomes, re- gardless of race or ethnicity, are more likely to be uninsured (American College of Physicians 19901, to encounter delays in seeking or receiving care or to be denied care (Tallon 1989), to rely on hospital clinics and emergency rooms for health services (NCHS 19851, and to receive substandard care (Burstin et al. 1992). Level of education may influence health beliefs and behaviors, which determine whether and how indi- viduals seek health care, make treatment choices, and comply with treatment suggestions. Because the lit- erature reviewed in this report has often failed to con- sider the role of socioeconomic factors in the health status of members of racial/ethnic groups, under- standing the significance of the results is difficult. Nevertheless, these published reports indicate that access to health care and the type of care received are partly determined by the race and ethnicity of the pa- tient and that members of minority groups are less likely than whites to receive adequate care (e.g., Blendon et al. 1989; CDC 1989; Todd et al. 1993; Wil- liams and Collins 1995).
The information summarized in this report re- flects the role of race, ethnicity, and culture in shaping tobacco use among members of the four population groups. Unfortunately, currently available methods do not help delineate the role of acculturation, socio- economic conditions, and societal problems such as racism, prejudice, and discrimination (e.g., Osborne and Feit 1992; Freeman 1993; Pappas 1994). Never- theless, efforts were made here to discern the possible role of these variables in explaining tobacco use among racial/ethnic minority group members.

Surgeon General’s Report
Chapter Conclusions
Following are the specific conclusions for each chapter in this report.
Chapter 2. Patterns of Tobacco Use Among Four Racial/Ethnic Minority Groups
1.
2.
3.
4.
5.
6.
7.
In 1978-1995, the prevalence of cigarette smoking declined among African American, Asian Ameri- can and Pacific Islander, and Hispanic adults. However, among American Indians and Alaska Natives, current smoking prevalence did not change for men from 1983 to 1995 or for women from 1978 to 1995.
Tobacco use varies within and among racial/ ethnic groups; among adults, American Indians and Alaska Natives have the highest prevalence of tobacco use; African American and Southeast Asian men also have a high prevalence of smok- ing. Asian American and Hispanic women have the lowest prevalence.
In all racial/ethnic groups discussed in this report except American Indians and Alaska Natives, men have a higher prevalence of cigarette smoking than women.
In all racial/ethnic groups except African Ameri- cans, men are more likely than women to use smokeless tobacco.
Cigarette smoking prevalence increased in the 1990s among African American and Hispanic ado- lescents after several years of substantial decline among adolescents of all four racial/ethnic minor- ity groups. This increase is particularly striking among African American youths, who had the greatest decline of the four groups during the 1970s and 1980s.
Since 1978, the prevalence of cigarette smoking has remained strikingly high among American Indian and Alaska Native women of reproductive age and has not declined as it has among African Ameri- can, Asian American and Pacific Islander, and Hispanic women of reproductive age.
Declines in smoking prevalence were greater among African American, Hispanic, and white men who were high school graduates than they
8.
9.
10.
were among those with less formal education. Among women in these three groups, education- related declines in cigarette smoking were less pronounced. Educational attainment accounts for only some of the differences in smoking behaviors (current smoking, heavy smoking, ever smoking, and smoking cessation) between whites and the racial/ ethnic minority groups discussed in this report. Other biological, social, and cultural factors are likely to further account for these differences.
Compared with whites who smoke, smokers in each of the four racial/ethnic minority groups smoke fewer cigarettes each day. Among smok- ers, African Americans, Asian Americans and Pa- cific Islanders, and Hispanics are more likely than whites to smoke occasionally (less than daily).
The data in general suggest that acculturation in- fluences smoking patterns in that individuals tend to adopt the smoking behavior of the current broader community; however, the exact effects of acculturation on smoking behavior are difficult to quantify because of limitations on most available measures of this cultural learning process.
Chapter 3. Health Consequences of Tobacco Use Among Four Racial/Ethnic Minority Groups 1. Cigarette smoking is a major cause of disease and
death in each of the four racial/ethnic groups stud- ied in this report. African Americans currently bear the greatest health burden. Differences in the magnitude of disease risk are directly related to differences in patterns of smoking.
2. Although lung cancer incidence and death rates vary widely among the nation’s racial/ethnic groups, lung cancer is the leading cause of cancer death for each of the racial/ethnic groups studied in this report. Before 1990, death rates from malig- nant neoplasms of the respiratory system increased among African American, Hispanic, and American Indian and Alaska Native men and women. From
12 Chapter 1
3.
4.
5 L
6.
7.
8.
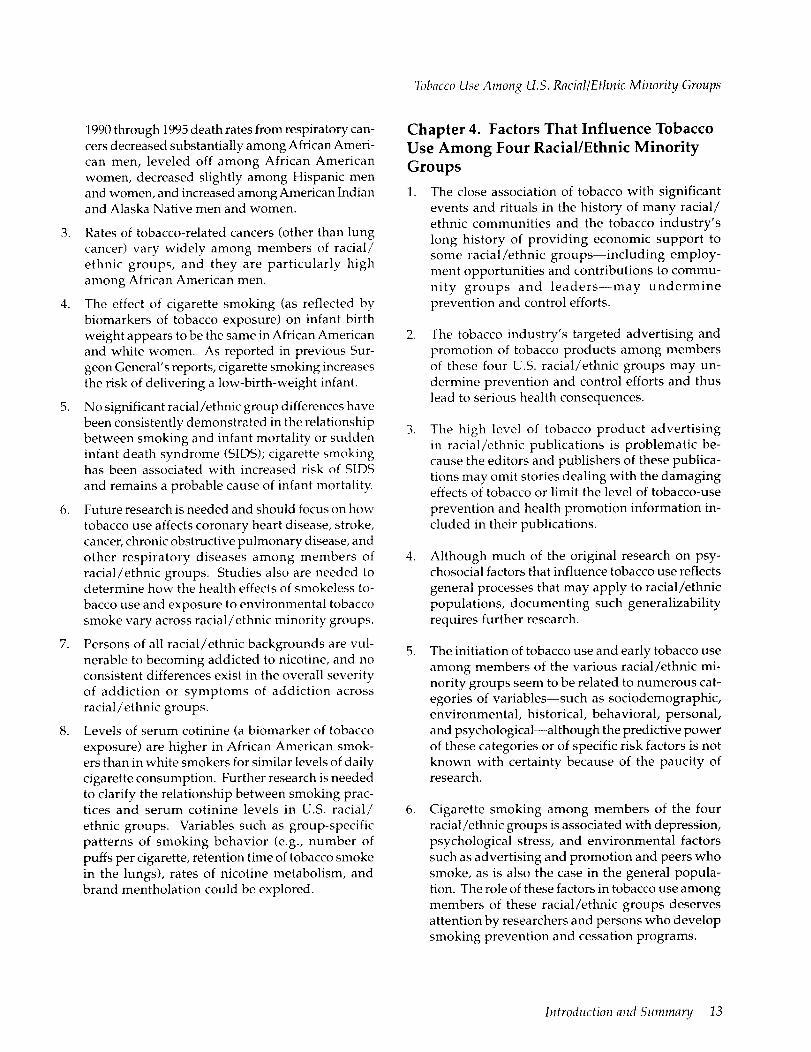
1990 through 1995 death rates from respiratory can- cers decreased substantially among African Ameri- can men, leveled off among African American women, decreased slightly among Hispanic men and women, and increased among American Indian and Alaska Native men and women.
Rates of tobacco-related cancers (other than lung cancer) vary widely among members of racial/ ethnic groups, and they are particularly high among African American men.
The effect of cigarette smoking (as reflected by biomarkers of tobacco exposure) on infant birth weight appears to be the same in African American and white women. As reported in previous Sur- geon General’s reports, cigarette smoking increases the risk of delivering a low-birth-weight infant.
No significant racial/ethnic group differences have been consistently demonstrated in the relationship between smoking and infant mortality or sudden infant death syndrome (SIDS); cigarette smoking has been associated with increased risk of SIDS and remains a probable cause of infant mortality.
Future research is needed and should focus on 110~ tobacco use affects coronary heart disease, stroke, cancer, chronic obstructive pulmonary disease, and other respiratory diseases among members of racial/ethnic groups. Studies also are needed to determine how the health effects of smokeless to- bacco use and exposure to environmental tobacco smoke vary across racial/ethnic minority groups.
Persons of all racial/ethnic backgrounds are vul- nerable to becoming addicted to nicotine, and no consistent differences exist in the overall severity of addiction or symptoms of addiction across racial/ethnic groups.
Levels of serum cotinine (a biomarker of tobacco exposure) are higher in African American smok- ers than in white smokers for similar levels of daily cigarette consumption. Further research is needed to clarify the relationship between smoking prac- tices and serum cotinine levels in U.S. racial/ ethnic groups. Variables such as group-specific patterns of smoking behavior (e.g., number of puffs per cigarette, retention time of tobacco smoke in the lungs), rates of nicotine metabolism, and brand mentholation could be explored.
Tobacco Use Among U.S. Racinl/Ethnic Minority Groups
Chapter 4. Factors That Influence Tobacco Use Among Four Racial/Ethnic Minority Groups 1.
2.
3.
4.
5.
6.
The close association of tobacco with significant events and rituals in the history of many racial/ ethnic communities and the tobacco industry’s long history of providing economic support to some racial/ethnic groups-including employ- ment opportunities and contributions to commu- nity groups and leaders-may undermine prevention and control efforts.
The tobacco industry’s targeted advertising and promotion of tobacco products among members of these four U.S. racial/ethnic groups may un- dermine prevention and control efforts and thus lead to serious health consequences.
The high level of tobacco product advertising in racial/ethnic publications is problematic be- cause the editors and publishers of these publica- tions may omit stories dealing with the damaging effects of tobacco or limit the level of tobacco-use prevention and health promotion information in- cluded in their publications.
Although much of the original research on psy- chosocial factors that influence tobacco use reflects general processes that may apply to racial/ethnic populations, documenting such generalizability requires further research.
The initiation of tobacco use and early tobacco use among members of the various racial/ethnic mi- nority groups seem to be related to numerous cat- egories of variables-such as sociodemographic, environmental, historical, behavioral, personal, and psychological-although the predictive power of these categories or of specific risk factors is not known with certainty because of the paucity of research.
Cigarette smoking among members of the four racial/ethnic groups is associated with depression, psychological stress, and environmental factors such as advertising and promotion and peers who smoke, as is also the case in the general popula- tion. The role of these factors in tobacco use among members of these racial/ethnic groups deserves attention by researchers and persons who develop smoking prevention and cessation programs.
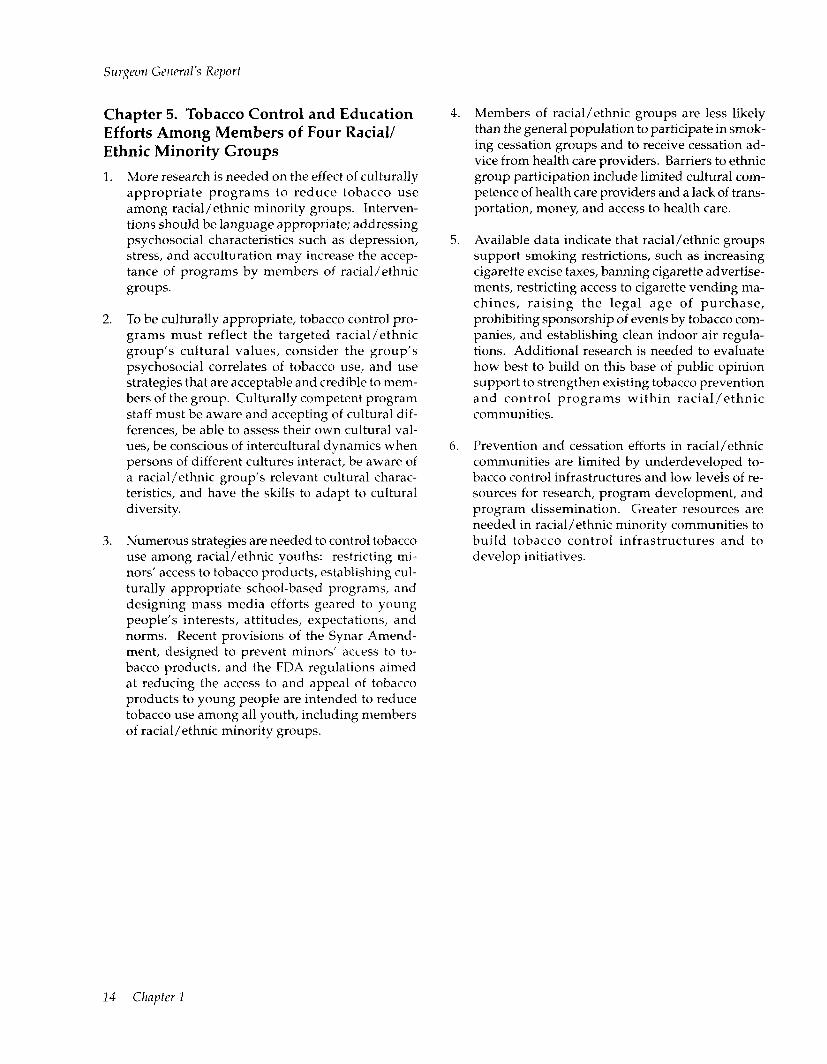
Chapter 5. Tobacco Control and Education Efforts Among Members of Four Racial/ Ethnic Minority Groups 1. More research is needed on the effect of culturally
appropriate programs to reduce tobacco use among racial/ethnic minority groups. Interven- tions should be language appropriate; addressing psychosocial characteristics such as depression, stress, and acculturation may increase the accep- tance of programs by members of racial/ethnic groups.
2. To be culturally appropriate, tobacco control pro- grams must reflect the targeted racial/ethnic group’s cultural values, consider the group’s psychosocial correlates of tobacco use, and use strategies that are acceptable and credible to mem- bers of the group. Culturally competent program staff must be aware and accepting of cultural dif- ferences, be able to assess their own cultural val- ues, be conscious of intercultural dynamics when persons of different cultures interact, be aware of a racial/ethnic group’s relevant cultural charac- teristics, and have the skills to adapt to cultural diversity.
3. Numerous strategies are needed to control tobacco use among racial/ethnic youths: restricting mi- nors’ access to tobacco products, establishing cul- turally appropriate school-based programs, and designing mass media efforts geared to young people’s interests, attitudes, expectations, and norms. Recent provisions of the Synar Amend- ment, designed to prevent minors’ access to to- bacco products, and the FDA regulations aimed at reducing the access to and appeal of tobacco products to young people are intended to reduce tobacco use among all youth, including members of racial/ethnic minority groups.
4. Members of racial/ethnic groups are less likely than the general population to participate in smok- ing cessation groups and to receive cessation ad- vice from health care providers. Barriers to ethnic group participation include limited cultural com- petence of health care providers and a lack of trans- portation, money, and access to health care.
5. Available data indicate that racial/ethnic groups support smoking restrictions, such as increasing cigarette excise taxes, banning cigarette advertise- ments, restricting access to cigarette vending ma- chines, raising the legal age of purchase, prohibiting sponsorship of events by tobacco com- panies, and establishing clean indoor air regula- tions. Additional research is needed to evaluate how best to build on this base of public opinion support to strengthen existing tobacco prevention and control programs within racial/ethnic communities.
6. Prevention and cessation efforts in racial/ethnic communities are limited by underdeveloped to- bacco control infrastructures and low levels of re- sources for research, program development, and program dissemination. Greater resources are needed in racial/ethnic minority communities to build tobacco control infrastructures and to develop initiatives.
14 Chapter 1
Tc7bacco USP Amoilg U.S. Racial/Ethnic Minority Groups
References
Adler NE, Boyce T, Chesney MA, Cohen S, Folkman S, Kahn RL, et al. Socioeconomic status and health: the challenge of the gradient. Anrericarl Psychologist 1994;49(1):15-24.
American College of Physicians. Access to health care [position paper]. Allllals of lizferr~a[ Medicir~e 1990;112(9):641-61.
Blendon RJ, Aiken LH, Freeman HE, Corey CR. Ac- cess to medical care for black and white Americans: a matter of continuing concern. ]olllrlfl/ of th Americans Medical Associatioll 1989;261(2):278-81.
Braithwaite RL, Taylor SE, editors. Health Iss~~es ijz the Black Con?lnrlllif!/. San Francisco: Jossey-Bass I’ublish- ers, 1992.
Burstin HR, Lipsitz SR, Brennan TA. Socioeconomic status and risk for substandard medical care. ]or~rml of the Amcricall Medical Associafioll 1992;268(17): 2383-7.
Centers for Disease Control. Pap smear screening- Behavioral Risk Factor Surveillance System, 1988. Morbidity afld Mortalify Weekly Rer’orf 1989;38(45): 777-9.
Centers for Disease Control and Prevention. Clrronic Disease itz Minority Populations. Atlanta: Centers for Disease Control and Prevention, 1994.
Chen VW. Smoking and the health gap in minorities. Annals of Epidemiology 1993;3(2):159-64.
Council on Ethical and Judicial Affairs. Black-white disparities in health care. Journal of the American Mcdi- cal Associafioll 1990;263(17):2344-6.
Day JC. Population Projections ofthe United States buy Age, Sex, Race, aud Hispanic Origin: 2995 to 2050. U.S. Bureau of the Census, Current Population Reports. Washington (DC): US Government Printing Office. P25-1130,1996.
Freeman HP. Poverty, race, racism, and survival. An- nals of Epidemiology 1993;3(2):145-9.
Harwood A, editor. Ethnicity and Medical Care. Cam- bridge (MA): Harvard University Press, 1981.
Health Resources and Services Administration. Health Shfus of Minorifics alzll Lozo-Income Groups. Washing- ton (DC): US Department of Health and Human Ser- Lices, Public Health Service, Health Resources and Services Administration, Bureau of Health Professions, Division of Disadvantaged Assistance. DHHS Publi- cation No. (HRSA) HRS-P-DV 85-1,1985.
Health Resources and Services Administration. Health Staflrs of Minorities aild Lox,-Income Groups: Third Edi- tion. Washington (DC): US Department of Health and Human Services, Public Health Service, Health Re- sources and Services Administration, Bureau of Health Professions, Division of Disadvantaged Assistance. GPO Publication No. 507-J-1, 1991.
Helman C. Cldfllre, Health and Illness: An Introduction for Health Proftssionals. Bristol (England): John Wright & Sons, 1985.
Kroeber AL, Kluckhohn C. Culture: A Critical Review of Co~zcq~fs aizd Definitions. New York: Vintage Books, 1963.
Liberatos I’, Link BG, Kelsey JL. The measurement of social class in epidemiology. Epidemiologic Rez.iews 1988;10:87-121.
Marin G. Issues in the measurement of acculturation among Hispanics. In: Geisinger KF, editor. Psychologz’- cal Testing of Hispanics. Washington (DC): American Psychological Association, 1992:235-51.
National Center for Health Statistics. Persons With and Without a Regular Source of Medical Care: United States. Data from the National Health Survey. Vituland Health Statistics. Series 10, No. 151. Hyattsville (MD): US Department of Health and Human Services, Pub- lic Health Service, National Center for Health Statis- tics. DHHS Publication No. (PHS) 85-1579,1985.
National Center for Health Statistics. Healthy People 2000 Rez+w, 1993. Hyattsville (MD): US Department of Health and Human Services, Public Health Service, Centers for Disease Control and Prevention, National Center for Health Statistics. DHHS Publication No. (PHS) 94-l 232-1, 1994.
Introduction and Swrmar~y 15
National Heart, Lung, and Blood Institute. Mi!lorif?/ Prqpm oft/w Nntioiznl Hcnrt, Lung, and Blood Zmfitllfe: Fiscal Ycnr 2993. Bethesda (MD): US Department of Health and Human Services, Public Health Service, National Institutes of Health, National Heart, Lung, and Blood Institute. NIH Publication No. 94-3037,1994.
National Institutes of Health. Minorities in AJIH Exfm- rllllrnl Grmt Programs: Fiscal Xw 2982-1991. Bethesda (MD): National Institutes of Health, Division of Re- search Grants. GPO Publication No. 351-597, 1993.
Novello AC, Soto-Torres LE. One voice, one vision- uniting to improve Hispanic-Latin0 health. Public Hmlfh Rcyorts 1993;108(5):529-33.
Osborne NC, Feit MD. The use of race in medical re- search [commentary]. /ourml of the Awricm Mrdicnl Associnfio!l 1992;267(2):275-9.
Pappas G. Elucidating the relationships between race, socioeconomic status, and health [editorial]. A~nrricm \ownnl of PnbIic Hen/Hz 1994;84(6):892-3.
IVrez-Stable EJ. Cardiovascular disease. In: Molina CW, Aguirre-Molina M. Lntim Hmlth ifz thr US: A Grozll- it~g Challrngc. Washington (DC): American Public Health Association, 1994:247-78.
Ploski HA, Williams J, editors. Tlw Nepv Alnznmc: A Rcfercmc Work on t/w AfricofI Awricnll. Detroit: Gale Research Inc, 1989.
Polednak AI? Rncial md Ethnic Di,ffowws ifz Diwasc. New York: Oxford University Press, 1989.
Tallon JR Jr. A health policy agenda proposal for in- cluding the poor. luurnnl (Tf the Americmr Mcdicnl Asso- ciation 1989;261(7):1044.
Todd KH, Samaroo N, Hoffman JR. Ethnicity as a risk factor for inadequate emergency department analge- sia. lolcrlrrrl of fhe Americrzu Medico1 Associafiou 1993;269(12):1k37-9.
US Bureau of the Census. Chapter C, General Social and Economic Characteristics. Part 1, United States Summary. 2980 Cfws~~s of Poylrlatiorl, Volume 1, C1umc- trristics of tlze Pnplnfion. Washington (DC): US Gov- ernment Printing Office. Publication No. PC80-I-Cl, 1983.
US Bureau of the Census. 7990 Censlls CJ~ Popdnfion,
Genernl Poplation Characteristics, United States. Wash- ington (DC): US Department of Commerce, Econom- ics and Statistics Administration, Bureau of the Census, 1992a.
US Bureau of the Census. Population Projections of the United States, by Age, Sex, Race, and Hispanic Origin: 1992 to 2050. U.S. Bureau of the Census, Cur- rent Pqdation Reports. Washington (DC): US Govern- ment Printing Office. P25-1092, 1992b.
US Bureau of the Census. 2990 Census of Population: Asians md Pmific Islanders in the United States. Wash- ington (DC): US Department of Commerce, Econom- ics and Statistics Administration, Bureau of the Census. Publication No. CP-3-5,1993a.
US Bureau of the Census. 2990 Census of Population: Pcrsmzs of Hispanic Origirz in the United States. Wash- ington (DC): US Department of Commerce, Econom- ics and Statistics Administration, Bureau of the Census. Publication No. CP-3-3,1993b.
US Bureau of the Census. 1990 Census of Poplafion: Social nr~d Economic Charocferisfics, United States. Wash- ington (DC): US Department of Commerce, Econom- ics and Statistics Administration, Bureau of the Census. Publication No. 0-2-1, 1993~.
US Department of Commerce. Directive No. 15. Race and ethnic standards for federal statistics and admin- istrative reporting. In: Stnfisticnl Polic!/ Ha&book. Wash- ington (DC): US Department of Commerce, Office of Federal Statistical Policy and Standards, 1978:37-g.
US Department of Health and Human Services. Re- prf of fh Sccrcfary’s Tnsk Force 011 Black & Minority H~wltlz. Vol~om~ 2: Esrcutiz~e Sumrmy. Washington (DC): US Department of Health and Human Services, 1985.
US Department of Health and Human Services. Healthy People 2000: Nnfiorzrr/ Heaifh Promofion and Disease Pre- ZWI~~OJ~ Objecfiws. Washington (DC): US Department of Health and Human Services, Public Health Service. DHHS Publication No. (PHS) 91-50212,199l.
US Department of Health and Human Services. Healthy People 2000: Midcourse Rez+w nnd 1995 Rezlisions. Wash- ington (DC): US Department of Health and Human Services, Public Health Service, 1995.

Tobacco Use Among U.S. Racial/Ethnic Minority Groups
Vega WA, Amaro H. Latin0 outlook: good health, Williams DR, Collins C. US socioeconomic and racial uncertain prognosis. Annual Reviezu of Public Health differences in health: patterns and explanations. An- 1994;15:39-67. nrlal Review of Sociology 1995;21:349-86.
Weissman JS, Stern R, Fielding SL, Epstein AM. De- layed access to health care: risk factors, reasons, and consequences. Amals of Interlral Medicilre 1991;114 (4):325-3 1.
Young TK. The Health of Nafive Americans: Toward a Bi- cultural Epidemiology. New York: Oxford University Press, 1994.
Il7troduction and Summary 17

Chapter 2 Patterns of Tobacco Use Among Four Racial/Ethnic Minority Groups
Introduction 21
Long-Term Tobacco-Use Trends and Behavior Among Racial/Ethnic Minority Groups 22
African Americans 22 Prevalence of Cigarette Smoking 22 Number of Cigarettes Smoked Daily 23 Quitting Behavior 25 Women of Reproductive Age 26 Young People 28
American Indians and Alaska Natives 44 Prevalence of Cigarette Smoking 44 Number of Cigarettes Smoked Daily 45 Quitting Behavior 46 Women of Reproductive Age 48 Young People 49 Regional and Tribal Tobacco Use 50
Asian Americans and Pacific Islanders 56 Prevalence of Cigarette Smoking 56 Number of Cigarettes Smoked Daily 56 Quitting Behavior 57 Women of Reproductive Age 57 Young People 59 State and Local Smoking Estimates 60 Cigarette Smoking in Asian Countries 65
Hispanics 66 Prevalence of Cigarette Smoking 66 Number of Cigarettes Smoked Daily 69 Quitting Behavior 70 Women of Reproductive Age 71 Young People 72
Retrospective Analyses of Smoking Prevalence Among African Americans and Hispanics 74
Prevalence of Cigarette Smoking Among Successive Birth Cohorts 74 African Americans 74 Hispanics 75
Long-Term Trends in Cigarette-Smoking Initiation 78 African Americans 78 Hispanics 78
Cigarette Brand Preferences 79
Effects of Education and Race/Ethnicity on Cigarette-Smoking Behavior 83
Current Smoking 85 Smoking Cessation 85 Heavy Smoking 85 Ever Smoking 85 Occasional Smoking 86
Exposure to Environmental Tobacco Smoke 86
Comparisons Between Racial/Ethnic Minority Groups in Current Tobacco Use 87
Cigarette Smoking 87 Pipe and Cigar Use 92 Use of Smokeless Tobacco 94
Conclusions 94
Appendix 1. Sources of Data 95
National Health Interview Survey (NHIS) 95 Hispanic Health and Nutrition Examination Survey (HHANES) 9.5 Behavioral Risk Factor Surveillance System (BRFSS) 95 Adult Use of Tobacco Survey (AUTS) 96 Monitoring the Future (MTF) Surveys 96 Youth Risk Behavior Survey (YRBS) 96 Teenage Attitudes and Practices Survey (TAPS) 96
Appendix 2. Measures of Tobacco Use 97
Cigarette Smoking and Cessation 97 Number of Cigarettes Smoked Daily 97 Use of Cigars, Pipes, and Smokeless Tobacco 97
Appendix 3. Patterns of Cigarette Use Among Whites 98
Appendix 4. Patterns of Cigarette Use Among African Americans 722
Appendix 5. Validation of the Retrospective Assessment of Smoking Prevalence 122
References 12.5

TC~JOCCO Use Anrorzg U.S. Racial/Ethic Mixority Groups
Introduction
Over the past 15 years, the prevalence of ciga- rette smoking has generally declined among adult African Americans, Asian Americans and Pacific Islanders, and Hispanics. Nevertheless, rates of ciga- rette smoking and other tobacco use are still high among certain racial/ethnic minority groups compared with among the overall population, particularly American Indians and Alaska Natives. Designing more successful public health efforts to reduce tobacco-related diseases and deaths in racial / ethnic populations requires greater understanding of these racial/ethnic patterns of tobacco use. This chapter summarizes bon smoking beha\?ors such as current tobacco use, cigarette consumption, and quit- ting behavior among adults vary within and among racial/ethnic groups. In addition, for all racial/ ethnic groups, the prel.alence of cigarette smoking is examined for two groups of special interest, xvomen of reproductive age and adolescents.
The purpose of this chapter is to summarize in one source the reported trends and patterns of tobacco use among members of the four racial/ethnic minor- ity groups, by gender, age, and level of education. In addition, newly compiled information is presented on smoking patterns by birth cohort (based on year of birth) for African Americans and Hispanics. The rela- tionship between racial/ethnic group and education as predictors of cigarette smoking is explored, and data on cigarette brand preference and exposure to environmental tobacco smoke are presented. The in- fluence of acculturation on smoking behavior is ex- amined among the two fastest growing immigrant groups to the United States-Asian Americans and Pacific Islanders and Hispanics. Although reports of the effects of acculturation vary widely in the litera- ture, it is an important correlate of behavior despite limitations in conceptualization, operationalization, and measurement.
The analyses presented in this chapter incorpo- rate data from national and state-specific population- based surveys of adults, national population-based
surveys of adolescents, and local and international surveys of various adult and adolescent populations. The national studies cited in this chapter include the National Health Interview Survey (NHIS) (197%1995), which garners yearly data on cigarette smoking; the Behavioral Risk Factor Surveillance System (BRFSS) (1987-1992), which collects information on behavioral risks among adults in the United States; the Adult Use of Tobacco Survey, which has been conducted periodi- cally since 1964; the Hispanic Health and Nutrition Examination Survey (HHANES), which gathered de- mographic and cigarette-smoking information from Hispanics between 1982 and 1984; the Monitoring the Future (MTF) surveys, which have been conducted in high schools annually since 1975; and the Teenage Attitudes and Practices Survey (TAPS), conducted in 1989 and 1993. Appendix 1 describes these major data sources, and Appendix 2 details the various measures of tobacco use. Appendix 3 presents data on patterns of cigarette use among whites that can be compared with the racial/ethnic group data presented in the chapter. Appendix 4 presents supplementary data on patterns of tobacco use among African Americans, and Appendix 5 describes how the authors validated one of the analytic techniques used to retro- spectively estimate smoking prevalence.
The analyses in this chapter update and expand on previous Surgeon General’s reports that describe tobacco use among racial/ethnic groups; most of these previous reports have focused on cigarette smoking only among African Americans (U.S. Department of Health, Education, and Welfare [USDHEW] 1979; U.S. Department of Health and Human Services [USDHHS] 1983,1988,1989,1990a). For some analyses reported here, small sample sizes limit the precision of the estimates. The patterns described in the text generally use point estimates, but confi- dence intervals presented in most tables can be referred to when the precision of the estimates needs to be defined.
P~ttcrns of Tohcco Use 21
Long-Term Tobacco-Use Trends and Behavior Among Racial/Ethnic Minority Groups
African Americans Prevalence of Cigarette Smoking
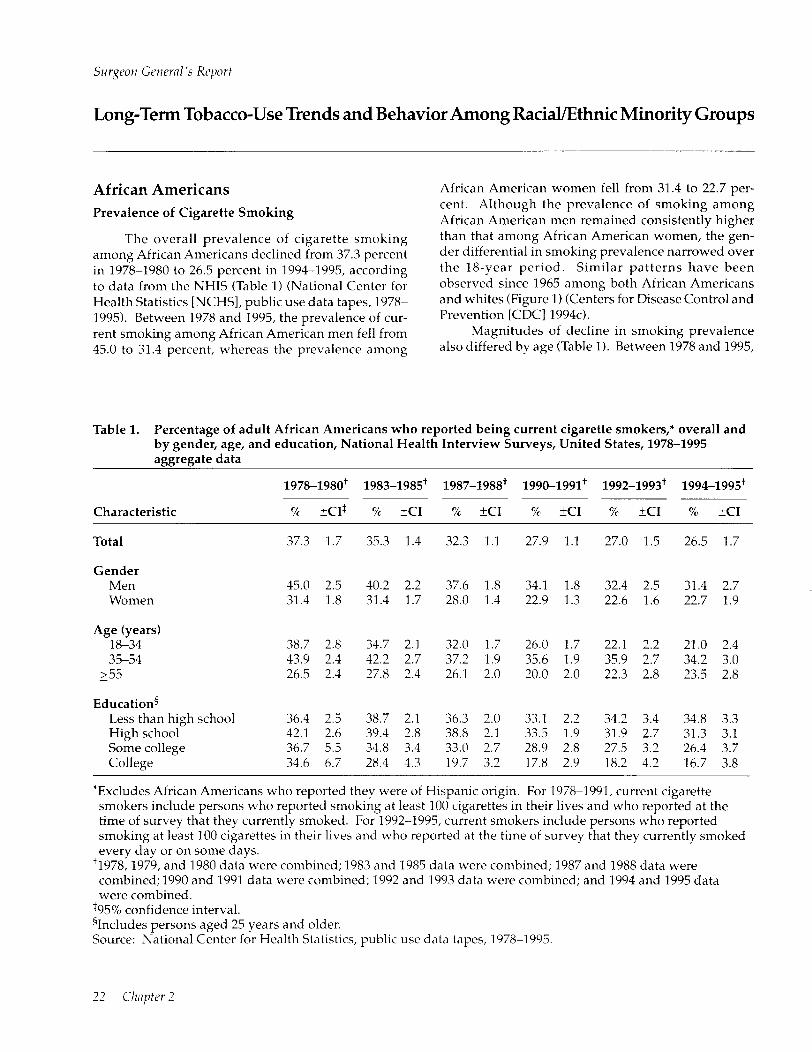
The overall prevalence of cigarette smoking among African Americans declined from 37.3 percent in 197881980 to 26.5 percent in 1994-1995, according to data from the NHIS (Table 1) (National Center for Health Statistics [NCHSI, public use data tapes, 1978- 1995). Between 1978 and 1995, the prevalence of cur- rent smoking among African American men fell from 45.0 to 31.4 percent, whereas the prevalence among
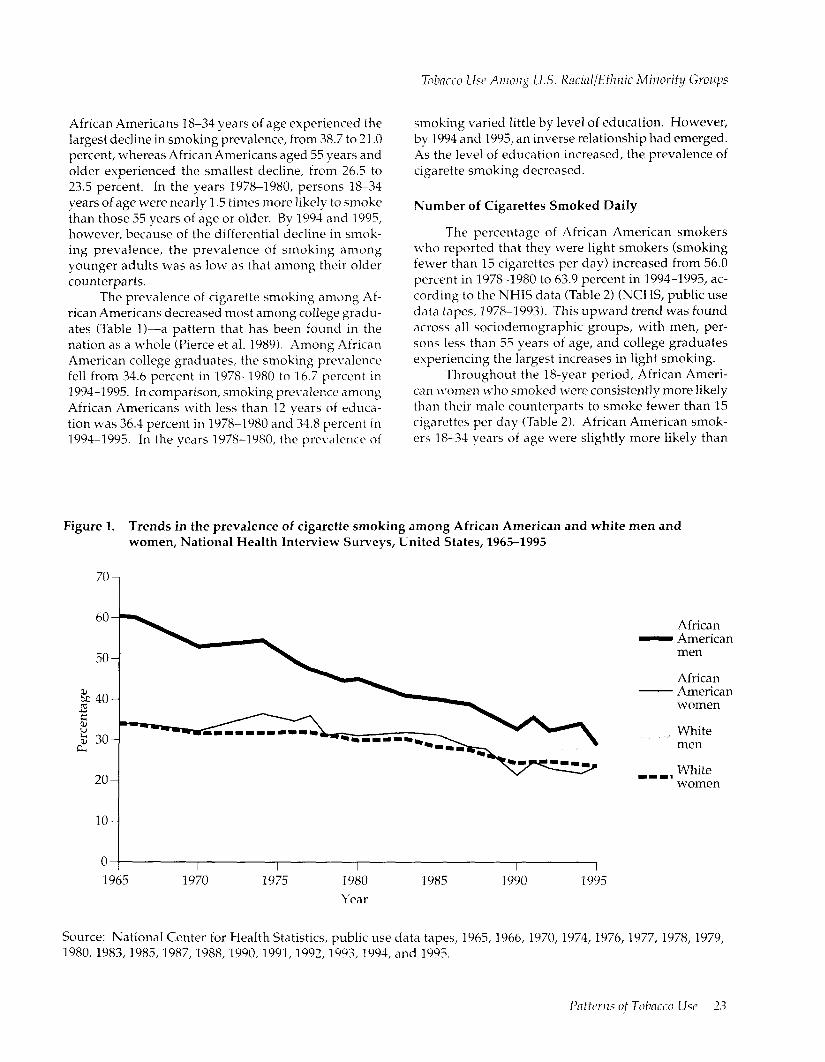
African American women fell from 31.4 to 22.7 per- cent. Although the prevalence of smoking among African American men remained consistently higher than that among African American women, the gen- der differential in smoking prevalence narrowed over the 18-year period. Similar patterns have been observed since 1965 among both African Americans and whites (Figure 1) (Centers for Disease Control and Prevention [CDC] 1994~).
Magnitudes of decline in smoking prevalence also differed by age (Table 1). Between 1978 and 1995,
Table 1. Percentage of adult African Americans who reported being current cigarette smokers,* overall and by gender, age, and education, National Health Interview Surveys, United States, 1978-1995 aggregate data
1978-1980+ 1983-1985+ 1987-1988+ 1990-1991+ 1992-1993+ 1994-1995+
Characteristic 7% KI$ % I-c1 7% KI % KI % +c1 % fC1
Total 37.3 1.7 35.3 1.4 32.3 1.1 27.9 1.1 27.0 1.5 26.5 1.7
Gender Men Women
45.0 2.5 40.2 2.2 37.6 1.8 34.1 1.8 32.4 2.5 31.4 2.7 31.4 1.8 31.4 1.7 28.0 1.4 22.9 1.3 22.6 1.6 22.7 1.9
Age (years) 18-34 38.7 2.8 34.7 2.1 32.0 1.7 26.0 1.7 22.1 2.2 21.0 2.4 35-54 43.9 2.4 42.2 2.7 37.2 1.9 35.6 1.9 35.9 2.7 34.2 3.0
255 26.5 2.4 27.8 2.4 26.1 2.0 20.0 2.0 22.3 2.8 23.5 2.8
Education5 Less than high school 36.4 2.3 38.7 2.1 36.3 2.0 33.1 2.2 34.2 3.4 34.8 3.3 High school 42.1 2.6 39.4 2.8 38.8 2.1 33.5 1.9 31.9 2.7 31.3 3.1 Some college 36.7 5.5 34.8 3.4 33.0 2.7 28.9 2.8 27.5 3.2 26.4 3.7 College 34.6 6.7 28.4 4.3 19.7 3.2 17.8 2.9 18.2 4.2 16.7 3.8
*Excludes African Americans who reported they were of Hispanic origin. For 1978-1991, current cigarette smokers include persons who reported smoking at least 100 cigarettes in their lives and who reported at the time of survey that they currently smoked. For 1992-1995, current smokers include persons who reported smoking at least 100 cigarettes in their lives and who reported at the time of survey that they currently smoked every day or on some days.
‘1978,1979, and 1980 data were combined; 1983 and 1985 data were combined; 1987 and 1988 data were combined; 1990 and 1991 data were combined; 1992 and 1993 data were combined; and 1994 and 1995 data were combined.
t95% confidence interval. 41ncludes persons aged 25 years and older. Source: National Center for Health Statistics, public use data tapes, 1978-1995.
African Americans 18-34 years of age experienced the largest decline in smoking prevalence, from 38.7 to 21.0 percent, whereas African Americans aged 55 years and older experienced the smallest decline, from 26.5 to 23.5 percent. In the years 1978-1980, persons 18-34 years of age were nearly 1.5 times more likely to smoke than those 55 years of age or older. By 1994 and 1995, however, because of the differential decline in smok- ing prevalence, the prevalence of smoking among younger adults was as low as that among their older counterparts.
The prevalence of cigarette smoking among Af- rican Americans decreased most among college gradu- ates (Table 11-a pattern that has been found in the nation as a whole (Pierce et al. 1989). Among African American college graduates, the smoking prel’alence fell from 34.6 percent in 1978-1980 to 16.7 percent in 1994-1995. In comparison, smoking pre\.alence among African Americans with less than 12 years of educa- tion was 36.4 percent in 1978-1980 and 34.8 percent in 1994-1995. In the years 1978-1980, the prevalence of
smoking varied little by level of education. However, by 1994 and 1995, an inverse relationship had emerged. As the level of education increased, the prevalence of cigarette smoking decreased.
Number of Cigarettes Smoked Daily
The percentage of African American smokers who reported that they were light smokers (smoking fewer than 15 cigarettes per day) increased from 56.0 percent in 19781980 to 63.9 percent in 1994-1995, ac- cording to the NHIS data (Table 2) (NCHS, public use data tapes, 1978-l 993). This upward trend was found across all sociodemographic groups, with men, per- sons less than 35 years of age, and college graduates experiencing the largest increases in light smoking.
Throughout the l&year period, African Ameri- can I~~omen ~‘110 smoked were consistently more likely than their male counterparts to smoke fewer than 15 cigarettes per day (Table 2). African American smok- ers 18-34 years of age were slightly more likely than
Figure 1. Trends in the prevalence of cigarette smoking among African American and white men and women, National Health Interview Surveys, United States, 1965-1995
60-
0 ( 1965
I 1970
I 1975
I 1980 Year
I I I 1985 1990 1995
African - American
men
African - American
women
White men
111, White women
Source: National Center for Health Statistics, public use data tapes, 1965, 1966, 1970, 1974, 1976, 1977, 1978, 1979, 1980,1983,1985,1987,1988,1990,1991,1992,1993,1994, and 1995.

Table 2. Percentage of adult African American smokers* who reported smoking <15,15-24, or 225 cigarettes per day, overall and by gender, age, and education, National Health Interview Surveys, United States, 1978-1995 aggregate data
1978-1980+ 1983-1985+ 1987-1988+ 1990-1991+ 1992-1993+ 1994-1995+
Characteristic 7c *c1$ % KI % fC1 % +c1 % +c1 % +c1
Total < 15 cigarettes
15-24 cigarettes 225 cigarettes
Gender Men
< 15 cigarettes 15-24 cigarettes
225 cigarettes
Women < 15 cigarettes
15-24 cigarettes 225 cigarettes
Age (years) 18-34
< 15 cigarettes 15-24 cigarettes
225 cigarettes
35-54 < 15 cigarettes
15-24 cigarettes 225 cigarettes
2 55 < 15 cigarettes
15-24 cigarettes 225 cigarettes
56.0 2.2 55.4 2.5 58.8 2.0 60.6 2.2 63.3 3.0 63.9 3.5 33.6 2.2 35.2 2.4 32.8 1.9 31.9 2.1 31.1 2.8 28.4 3.2 10.4 1.7 9.4 1.6 8.4 1.2 7.5 1.2 5.6 1.3 7.6 2.1
50.4 3.2 52.3 3.8 53.2 3.1 55.2 3.1 59.3 4.5 61.1 5.1 37.1 3.6 36.3 3.4 37.0 3.1 35.6 3.1 34.4 4.2 28.6 4.7 12.5 2.3 11.4 2.6 9.8 1.7 9.2 1.9 6.3 2.0 10.3 3.7
62.2 3.2 58.6 3.1 65.0 2.7 67.1 2.6 67.9 3.8 67.1 4.2 29.8 2.8 34.1 2.8 28.2 2.4 27.5 2.5 27.4 3.6 28.3 4.0
8.1 2.3 7.3 1.5 6.8 1.3 5.4 1.3 4.7 1.5 4.6 1.7
59.8 3.6 56.9 3.7 64.1 2.9 67.2 3.4 69.5 5.1 70.0 5.5 31.7 3.3 34.4 3.3 28.5 2.7 26.6 3.2 25.5 4.8 23.3 5.3
8.5 2.3 8.7 2.3 7.4 1.7 6.2 1.8 5.1 2.1 6.7 2.7
51.2 3.4 31.0 4.1 52.1 3.1 54.6 3.4 60.4 4.3 58.9 5.2 35.6 3.7 37.7 3.9 37.7 3.1 36.9 3.2 33.2 4.1 32.2 4.8 13.2 2.7 11.3 2.5 10.2 1.7 8.5 1.9 6.3 2.1 8.9 3.6
55.3 5.4 60.4 5.6 59.1 5.2 60.4 4.8 59.0 6.5 66.7 6.6 34.8 5.6 32.3 5.9 33.6 5.0 31.9 4.7 36.3 6.4 27.3 6.0
9.9 4.8 7.4 3.1 7.3 2.5 7.7 2.7 4.7 2.7 6.0 3.8
*Excludes African Americans who reported they were of Hispanic origin. For 1978-1991, current cigarette smokers include persons who reported smoking at least 100 cigarettes in their lives and who reported at the time of survey that they currently smoked. For 1992-1995, current smokers include persons who reported smoking at least 100 cigarettes in their lives and who reported at the time of survey that they currently smoked every day or on some days.
‘1978,1979, and 1980 data were combined; 1983 and 1985 data were combined; 1987 and 1988 data were combined; 1990 and 1991 data were combined; 1992 and 1993 data were combined; and 1994 and 1995 data were combined.
$95% confidence interval.
their older counterparts to be light smokers (except for the years 1983-1985). An association between edu- cation and light smoking became apparent in 1990-1991. In 1990 and beyond, among smokers, education was directly related to the proportion of
smokers who smoked fewer than 15 cigarettes per day. As the level of education increased, the proportion smoking lightly also increased.
Throughout the 18-year period, the prevalence of heavy smoking (smoking 25 or more cigarettes per
24 Cl7i7ytrr 2
i%bacco Use Amo7zg U.S. Racinl/Etlznic Minorify Groups
Table 2. Continued
197%1980+ 1983-1985+ 1987-1988+ 1990-1991+ 1992-1993+ 1994-1995+
Characteristic 7c +c1* % 3x1 % +c1 7c +a Yc KI x KI
Education5 Less than high school
< 15 cigarettes 15-24 cigarettes
225 cigarettes
High school < 15 cigarettes
15-24 cigarettes 225 cigarettes
Some college < 15 cigarettes
15-24 cigarettes 225 cigarettes
College < 15 cigarettes
15-24 cigarettes 125 cigarettes
53.1 4.0 56.0 4.1 57.3 3.1 57.3 3.4 57.7 5.5 56.1 6.0 33.5 3.6 32.7 4.0 32.7 3.3 33.5 3.3 33.9 5.4 32.5 5.6 13.4 3.1 11.3 3.1 10.0 2.2 9.2 2.3 8.4 3.0 11.5 4.5
53.9 4.7 52.4 4.4 58.3 3.6 59.0 3.7 62.7 4.6 64.0 5.7 34.9 4.8 40.6 4.1 33.2 3.5 34.8 3.6 33.4 4.4 29.2 4.9 11.2 3.6 6.9 2.1 8.5 1.9 6.2 1.6 3.9 1.8 6.8 3.9
49.7 7.5 48.6 6.6 56.3 4.7 60.9 5.6 63.4 7.0 63.0 8.4 37.6 6.1 37.4 6.8 34.7 4.7 32.2 5.5 31.0 6.8 32.2 8.2 12.7 5.9 14.1 5.1 9.0 3.1 6.9 2.9 5.6 3.1 4.9 2.5
57.1 10.2 50.9 9.7 55.2 9.6 65.0 9.3 74.7 10.0 79.0 9.9 34.1 9.0 35.6 10.9 38.2 9.6 24.9 7.9 20.6 9.5 18.1 9.5
8.8 5.5 13.5 9.4 6.7 3.4 10.1 6.7 4.7 4.0 2.9 3.5
gIncludes persons aged 25 vears and older. Source: National Center fir Health Statistics, public use data tapes, 1978-1995.
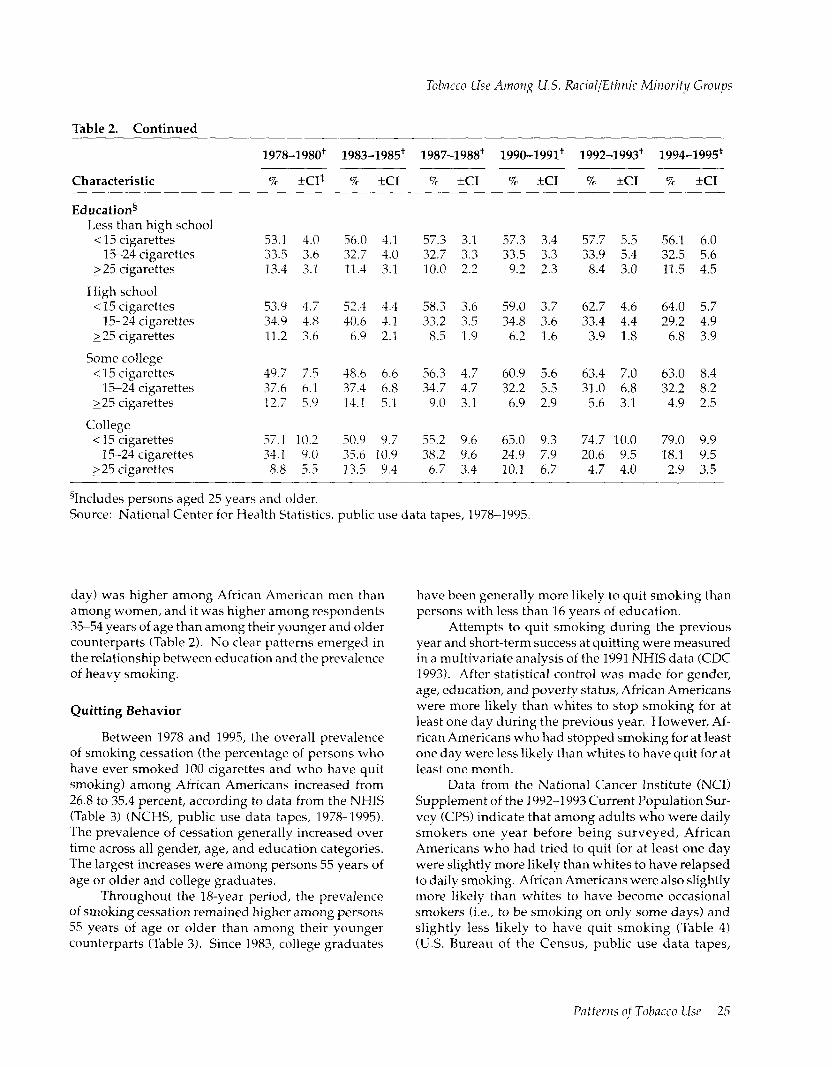
day) was higher among African American men than among women, and it was higher among respondents 3554 years of age than among their younger and older counterparts (Table 2). No clear patterns emerged in the relationship between education and the prevalence of heavy smoking.
Quitting Behavior
Between 1978 and 1995, the overall prevalence of smoking cessation (the percentage of persons who have ever smoked 100 cigarettes and who have quit smoking) among African Americans increased from 26.8 to 35.4 percent, according to data from the NHIS (Table 3) (NCHS, public use data tapes, 1978-1995). The prevalence of cessation generally increased over time across all gender, age, and education categories. The largest increases were among persons 55 years of age or older and college graduates.
Throughout the 18-year period, the prevalence of smoking cessation remained higher among persons 55 years of age or older than among their younger counterparts (Table 3). Since 1983, college graduates
have been generally more likely to quit smoking than persons with less than 16 years of education.
Attempts to quit smoking during the previous year and short-term success at quitting were measured in a multivariate analysis of the 1991 NHIS data (CDC 1993). After statistical control was made for gender, age, education, and poverty status, African Americans were more likely than whites to stop smoking for at least one day during the previous year. However, Af- rican Americans who had stopped smoking for at least one day were less likely than whites to have quit for at least one month.
Data from the National Cancer Institute (NC11 Supplement of the 1992-l 993 Current Population Sur- vey (CPS) indicate that among adults who were daily smokers one year before being surveyed, African Americans who had tried to quit for at least one day were slightly more likely than whites to have relapsed to daily smoking. African Americans were also slightly more likely than whites to have become occasional smokers (i.e., to be smoking on only some days) and slightly less likely to have quit smoking (Table 4) (U.S. Bureau of the Census, public use data tapes,
Patterns of Tobacco Use 25
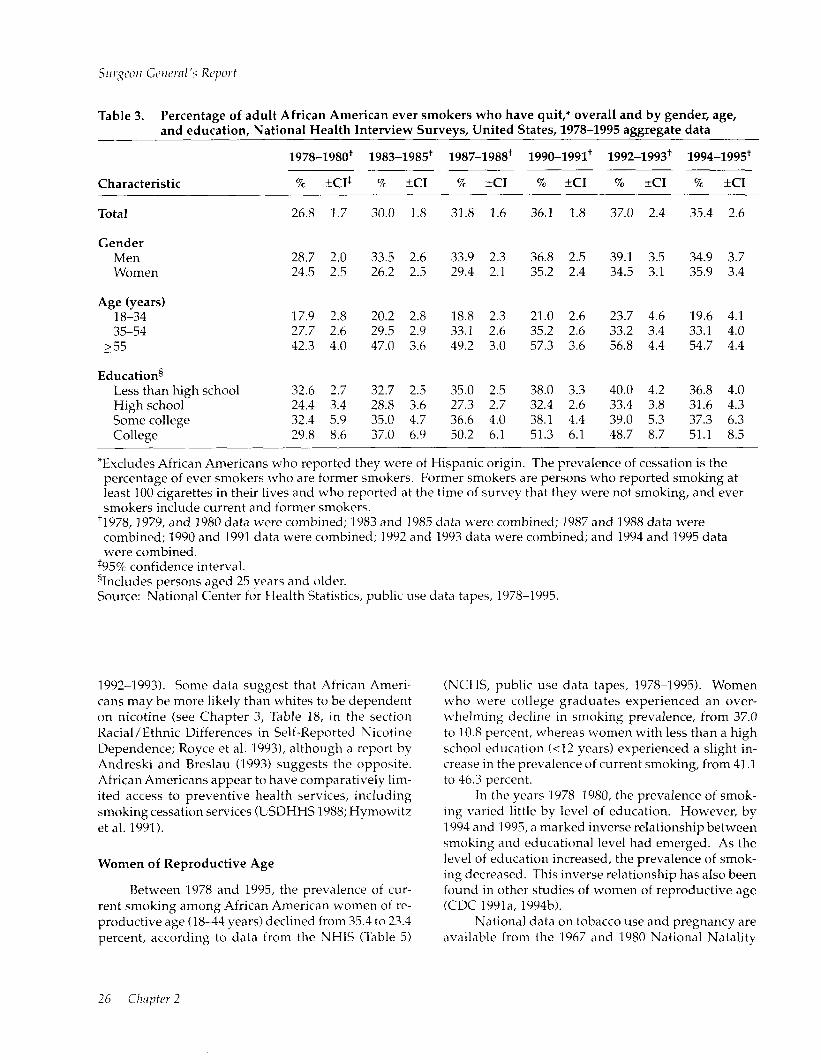
Table 3. Percentage of adult African American ever smokers who have quit,* overall and by gender, age, and education, National Health Interview Surveys, United States, 1978-1995 aggregate data
1978-1980+ 1983-1985+ 1987-1988+ 1990-1991+ 1992-1993+ 1994-1995+
Characteristic 9% &CIS % fC1 70 +c1 % +c1 -
Total 26.8 1.7 30.0 1.8 31.8 1.6 36.1 1.8
Gender Men Women
Age (years) 18-34 35-54
255
Educations Less than high school High school Some college College
28.7 2.0 33.5 2.6 33.9 2.3 36.8 2.5 24.5 2.5 26.2 2.5 29.4 2.1 35.2 2.4
17.9 2.8 20.2 2.8 18.8 2.3 21.0 2.6 27.7 2.6 29.5 2.9 33.1 2.6 35.2 2.6 42.3 4.0 47.0 3.6 49.2 3.0 57.3 3.6
32.6 2.7 32.7 2.5 35.0 2.5 38.0 3.3 24.4 3.4 28.8 3.6 27.3 2.7 32.4 2.6 32.4 5.9 35.0 4.7 36.6 4.0 38.1 4.4 29.8 8.6 37.0 6.9 50.2 6.1 51.3 6.1
% tc1 % XI
37.0 2.4 35.4 2.6
39.1 3.5 34.9 3.7 34.5 3.1 35.9 3.4
23.7 4.6 19.6 4.1 33.2 3.4 33.1 4.0 56.8 4.4 54.7 4.4
40.0 4.2 36.8 4.0 33.4 3.8 31.6 4.3 39.0 5.3 37.3 6.3 48.7 8.7 51.1 8.5
*Excludes African Americans who reported they were of Hispanic origin. The prevalence of cessation is the percentage of ever smokers who are former smokers. Former smokers are persons who reported smoking at least 100 cigarettes in their lives and who reported at the time of survey that they were not smoking, and ever smokers include current and former smokers.
‘1978,1979, and 1980 data were combined; 1983 and 1985 data were combined; 1987 and 1988 data were combined; 1990 and 1991 data were combined; 1992 and 1993 data were combined; and 1994 and 1995 data were combined.
$95% confidence interval. %cludes persons aged 25 years and older. Source: National Center for Health Statistics, public use data tapes, 1978-1995.
1992-1993). Some data suggest that African Ameri- cans may be more likely than whites to be dependent on nicotine (see Chapter 3, Table 18, in the section Racial/Ethnic Differences in Self-Reported Nicotine Dependence; Royce et al. 19931, although a report by Andreski and Breslau (1993) suggests the opposite. African Americans appear to have comparatively lim- ited access to preventive health services, including smoking cessation services (USDHHS 1988; Hymowitz et al. 1991).
Women of Reproductive Age
Between 1978 and 1995, the prevalence of cur- rent smoking among African American women of re- productive age (18-44 years) declined from 35.4 to 23.4 percent, according to data from the NHIS (Table 5)
(NCHS, public use data tapes, 1978-1995). Women who were college graduates experienced an over- ~~helming decline in smoking prevalence, from 37.0 to 10.8 percent, whereas women with less than a high school education (~12 years) experienced a slight in- crease in the prevalence of current smoking, from 41 .l to 46.3 percent.
In the years 1978-1980, the prevalence of smok- ing vraried little by level of education. However, by 1994 and 1995, a marked inverse relationship between smoking and educational level had emerged. As the level of education increased, the prevalence of smok- ing decreased. This inverse relationship has also been found in other studies of women of reproductive age (CDC 1991 a, 1994b).
National data on tobacco use and pregnancy are available from the 1967 and 1980 National Natality

Tobacco USC ~4tno~zg U.S. Racial/Ethnic Minority Groups
Table 4. Current cigarette smoking status among persons* who reported that they were daily smokers 1 year before being surveyed, Current Population Survey National Cancer Institute Supplement, 1992-1993
Currrent smoking status
American Asian Indians/ Americans/
African Alaska Pacific Americans Natives Islanders Hispanics Whites Total
x =I+ p% kc1 %kcI I kc1 R KI % &CI
Smoke every day; did not try to quit for at least one day during the previous year
Smoke every day; did try to quit for at least one day during the previous year
Smoke on some days
Do not smoke cigarettes; abstinent for l-90 davs
Do not smoke cigarettes; abstinent for 91-364 days
59.8 I.5 62.8 5.5 57.8 4.4 59.8 2.3 63.1 0.5 62.5 0.5
29.7 1.4 28.9 5.1 32.0 4.2 28.5 2.1 26.0 0.5 26.6 0.4
5.6 0.7 3.7 2.1 4.8 1.9 5.6 1.1 3.7 0.2 4.0 0.2
2.2 0.5 1.8 1.5 2.5 1.4 2.5 0.7 3.4 0.2 3.2 0.2
2.7 0.5 2.8 1.9 2.9 1.5 3.6 0.9 3.8 0.2 3.7 0.2
“Aged 18 years and older; N = 44,272. ‘95% confidence interval. Source: U.S. Bureau of the Census, public use data tapes, 1992-1993.
Surveys, the 1982 and 1988 National Surveys of Fam- ily Growth, the 1985 and 1990 NHISs, the 1988 Na- tional Maternal and Infant Health Survey (NMIHS), and the 1992-1993 National Pregnancy and Health Survey. Furthermore, since 1989, national trend data on smoking and pregnancy have become readily avail- able from information collected on the revised U.S. Standard Certificate of Live Birth, which is included as part of U.S. final natality statistics compiled each calendar year (NCHS 1992, 1993, 1994; Ventura et al. 1994).
Among the earliest sources of national trend data on smoking during pregnancy were the National Na- tality Surveys, which were administered to a national sample of married mothers of live infants born in 1967 and 1980 (Kleinman and Kopstein 1987; USDHHS 1989). Among African American mothers ~20 years of age, smoking rates remained virtually constant over time at about 27 percent. The smoking prevalence
among African American mothers aged 220 years de- clined from 33 percent in 1967 to 23 percent in 1980. The National Survey of Family Growth collected data in 1982 and 1988 on the smoking behavior of females 1544 years of age during their most recent pregnancy. In 1982,29.2 percent of African American women re- ported smoking during their most recent pregnancy, compared with 23.4 percent in 1988 (Pamuk and Mosher 1992; Chandra 1995). More recent data from U.S. final natality statistics indicate that smoking rates for African Americans during pregnancy declined from 17.1 percent in 1989 to 10.6 percent in 1995 (Table 6). Smoking rates declined for African American teen- aged mothers from 1989 through 1995 but remained virtually unchanged for African American adult moth- ers aged 2049 years during those years (NCHS 1992, 1993,1994; Ventura et al. 1994,1995,19961. In general, African American adolescent mothers were less likely to have smoked than mothers 20-49 years