Embed Size (px)
Citation preview

MODULE 1: OVERVIEW OF NONWOVENS
1.1 Nonwovens: What are they?
Introduction to nonwovens Nonwovens are known as engineered fabrics. They are created with a view to targeted
structure and properties by applying a set of scientific principles for a variety of
applications.
Nonwovens are manufactured by high-speed
and low-cost processes. As compared to the
traditional woven and knitting technology, a
larger volume of materials can be produced at a
lower cost by using nonwoven technology.
The manufacturing principles of nonwovens are
manifested in a unique way based on the
technologies of creation of textiles, papers, and
plastics (Figure 1.1), as a result, the structure and properties of nonwovens resemble, to a
great extent, to those of three materials.
1
Figure 1.1

Nonwovens are already found in many applications, but most are hidden and you do not
see them. Figure 1.2 displays a few products prepared by using nonwovens. The readers are
suggested to identify these products and their applications. The most common products made
with nonwovens listed by INDA include:
Disposable nappies
Sanitary napkins and tampons
Sterile wraps, caps, gowns, masks, and curtains used in the medical field
Household and personal wipes
Laundry aids (fabric dryer-sheets)
Apparel interlinings
Carpeting and upholstery fabrics, padding and backing
Wall coverings
Agricultural coverings and seed strips
Automotive headliners and upholstery
Filters
Envelops
Tags
Labels
Insulation
2
Figure 1.2

House wraps
Roofing products
Civil engineering fabrics/geotextiles
Definitions of nonwovensNonwovens are defined in many ways by different standards and different associations.
They are stated below.
As per ISO 9092, nonwoven is defined as “manufactured sheet, web or batt of
directionally or randomly oriented fibers, bonded by friction, and/or cohesion and/or adhesion,
excluding paper and products which are woven, knitted, tufted, stitch-bonded incorporating
binding yarns or filaments or felted by wet-milling, whether or not additionally needled. The
fibers may be of natural or man-made origin. They may be staple or continuous filaments or be
formed in situ.
Note: To distinguish wet-laid nonwovens from wet-laid papers, a material shall be regarded as a
nonwoven if
a) more than 50 % by mass of its fibrous content is made up of fibers (excluding chemically
digested vegetable fibers) with a length to diameter ratio greater than 300; or, if the conditions in
a) do not apply, then
b) If the following conditions are fulfilled:
more than 30 % by mass of its fibrous content is made up of fibers (excluding chemically
digested vegetable fibers) with a length to diameter ratio greater than 300 and its density is less
than 0.40 g/cm3.”
The aforesaid definition of nonwoven, given by ISO 9092, has been adapted by CEN (EN
29092), and consequently by DIN, AFNOR, and all standardization offices in the EU.
But, ASTM prefers to define nonwoven as “a textile structure produced by bonding or
interlocking of fibers, or both, accomplished by mechanical, chemical, thermal, or solvent
means, and combinations thereof.
Note: the term does not include paper, or fabrics which are woven, knitted, tufted, or those made
by wool or other felting processes.”
This definition is available in many ASTM standards including D 123, D 1117, D 2646,
D 3786, D 3787, D 5684, D 5732, D 5733, D 5734, D 5735, and D 5736.
3

Today, there are two leading associations of nonwovens in the world, namely EDANA
(The European Disposables and Nonwovens Association) and INDA (The North America’s
Association of the Nonwoven Fabrics Industry). They have been the voice of the nonwoven
industries in Europe and North America, respectively. Nonwovens are defined by them as well.
Though EDANA has adopted the ISO 9092 or CEN 29092 definition of nonwoven. but, INDA
prefers to define nonwovens in another way. According to INDA, “Nonwoven fabrics are
broadly defined as sheet or web structures bonded together by entangling fiber or filaments (and
by perforating films) mechanically, thermally or chemically. They are flat, porous sheets that are
made directly from separate fibers or from molten plastic or plastic film. They are not made by
weaving or knitting and do not require converting the fibers to yarn.”
It is quite interesting to note that these definitions include raw materials, structures, and
manufacturing processes employed to prepare nonwovens. However, there is no unique
definition of nonwovens found to exist in the world.
1.2 Nonwovens: How do they look like?It is often asked “Nonwovens: How do they look like?” This refers to the structure of
nonwovens. It is necessary to have a sense of structure of nonwovens also to make the study of
nonwoven technology more meaningful. As in case of woven and knit fabrics, the structure of
the fabrics in conjunction with the properties of the constituent fibres and yarns determine the
properties of the fabrics, so is the case in case of nonwovens. While the structure of the woven
fabrics
can be
described
in terms
of the
weave
geometry
and the
density of
warp and
weft,
4
Figure 1.3

similarly the knitted fabrics are described in terms of the intermeshing structure and the density
of courses and wales [1], the structure of nonwovens is described primarily in terms of fibre
packing arrangement and fibre directional arrangement. Sometimes, the geometry of pores in
nonwovens is also studied. Before developing a fundamental understanding of nonwoven
structure, let us first study the characteristics of the constituent materials, that is, fibres – the
building block of fibre-based nonwovens.
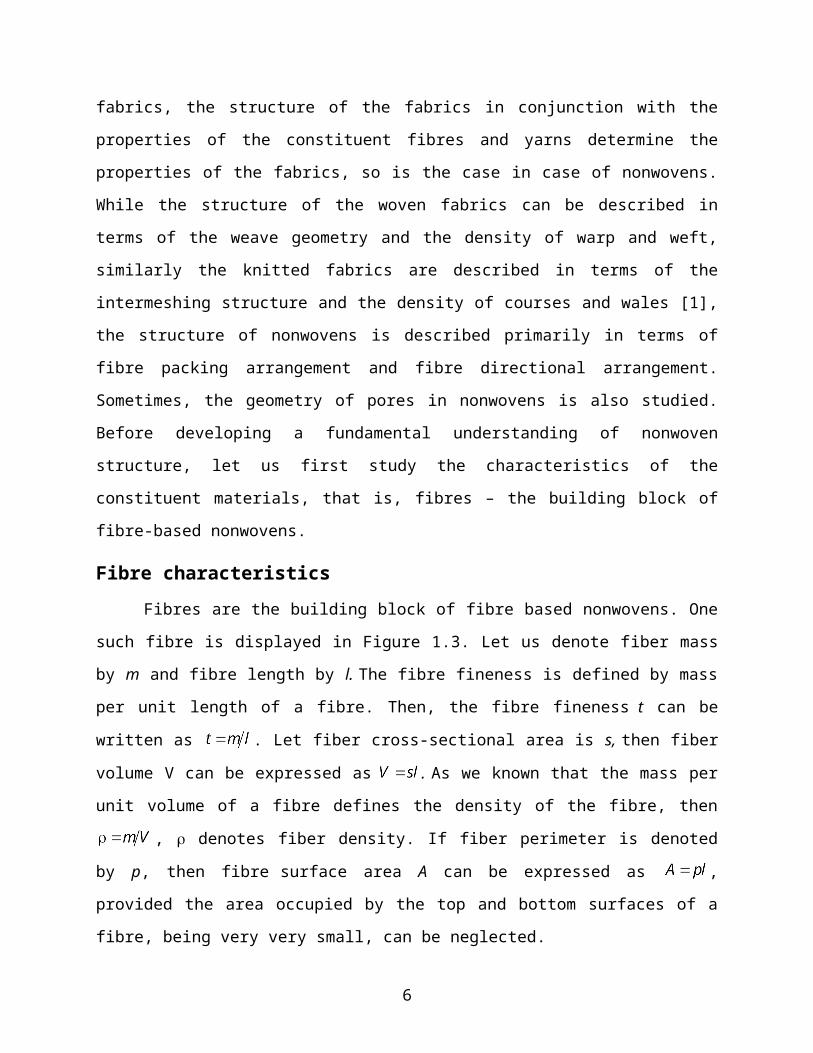
Fibre characteristicsFibres are the building block of fibre based nonwovens. One such fibre is displayed in
Figure 1.3. Let us denote fiber mass by m and fibre length by l. The fibre fineness is defined by
mass per unit length of a fibre. Then, the fibre fineness t can be written as . Let fiber
cross-sectional area is s, then fiber volume V can be expressed as . As we known that the
mass per unit volume of a fibre defines the density of the fibre, then , r denotes fiber
density. If fiber perimeter is denoted by p, then fibre surface area A can be expressed as ,
provided the area occupied by the top and bottom surfaces of a fibre, being very very small, can
be neglected.
Let us write the expression of fibre density in another manner. This is shown below.
It can be written as . What it follows is that the larger fibre (higher value of s) may come
out to be finer (smaller value of t) than the smaller fibre (lower value of s). This is because of the
influence of fibre density on fibre fineness, the coarser fibre need not to be heavier always. Let
us illustrate. A 3 denier polyester fibre possesses cross-sectional area of 2.4910-4 mm2, but a 2.5
denier polypropylene fibre possesses cross-sectional area of 3.0510-4 mm2. According to the
definition of fineness, the polyester fibre is coarser than the polypropylene fibre, but according to
the cross-sectional area, the former is smaller than the latter. It indicates that the fibre fineness is
not a purely geometrical characteristic and the traditional definition of fiber fineness does not
truly express the fiber size. The size of fibres can be better characterized by the cross-sectional
area or ratio of the fibres. But, as the measurement of fibre volume is difficult in practice,
the textile technologists prefer to use fibre fineness in order to characterize the size of fibres.
5
When the cross-section of the fibres is circular, we can write where
represents fibre diameter. Then the diameter of the fibres can be calculated from the following
expression
.
But, when the cross-section of fibres is not circular, then we assume that the cross-sectional area
s of non-circular fibres is equal to the cross-sectional area of a circle of diameter d., then
is called as equivalent fibre diameter.
It is well-known that the perimeter of a fiber having non-circular cross-section is always
higher than the perimeter of a circle. Then, it is logical to introduce a quantity called fiber shape
factor q such as
.
Clearly, the shape factor of a circular fibre is equal to zero. The fibre perimeter can be written as
, consequently, the fibre surface area can be expressed as .
Often, the surface area of fibres in divided by the mass of the fibres and the resulting ratio
is termed as specific surface area. If the specific surface area of a fibre is denoted by a then it is
possible to write that
.
This terminology is very commonly used in case of nano fibres. But, one can see that the specific
surface area is not a purely geometrical characteristic. In order to obtain a purely geometrical
characteristic, the surface area of fibres is often divided by the volume of the fibres and this ratio
is termed as fibre surface area per unit volume. This is expressed as follows
.
The aforesaid fibre characteristics are often used to study the effect of fibre properties on
physical and transport properties of fibre based nonwovens.
6

Let us now solve some numerical problems
Problem 1.1: Calculate the equivalent diameter of a non-circular polyester fiber of 3 denier
fineness and the equivalent diameter of polypropylene fiber of 2 denier fineness. Comment on
the results obtained.
Solution 1.1: We take polyester fiber density as , then the equivalent fiber
diameter d is calculated as follows
Then we take polypropylene fiber density as , then we calculate its equivalent
fiber diameter d as follows
Thus, we see two different fibers having two different fineness show almost the same diameter.
The traditional definition of fiber fineness does not truly reflect the fiber geometry
Problem 1.2: Consider a nonwoven wipe of 100 g weight which is made up of non-cylindrical
cotton fibers of 25.4 mm length, 3 dtex fineness, and shape factor of 0.05. Calculate the total
surface area occupied by the fibers in the wipe.
Solution 1.2: We take cotton fibre density as , then, the cross-sectional area s of a
cotton fiber is calculated as follows
.
Then we obtain the volume V of a cotton fiber as follows
.
Now the mass m of a cotton fiber is obtained as follows
.
The equivalent diameter d of cotton fiber is calculated as follows
7

.
Then the surface area of a cotton fiber is calculated as follows
.
Now the number n of cotton fibers present in the wipe having mass M of 100 g is calculated as
follows
.
Then the total surface area Y occupied by all cotton fibers present in this wipe is
.
Fibre packing arrangement
8

The fiber packing arrangement is usually characterized by fiber packing density. Note
that fiber packing density is known as fiber volume fraction or solid volume fraction. Figure 1.4
displays the image of a nonwoven fabric. Let the volume of this fabric is and the volume of
all fibers in the fabric is V. As the fibre packing density is defined by the ratio of the volume
occupied
by the
fibres to
the
volume
of the
fabric, we
can write
, where µ
denotes
fiber
packing
density.
Evidently, the value of fibre packing density lies from zero to one. Sometimes fiber packing
density is interpreted in terms of density. Let the mass of a nonwoven fabric be M, then the
9
Figure 1.4
Figure 1.5

density of the fabric is . Similarly, the density of fiber is . As we know
, then . Also, fiber packing density is interpreted in terms of sectional area.
Figure 1.5 shows a thin section of a nonwoven fabric and a thin section of a fibre. The total
volume of this infinitesimally thin section of a nonwoven fabric is , where
is the sectional area of the thin section of the fabric. The volume of all fibers in the thin
section of the fabric is , where is the sectional area of the
fibres in the thin section of the fabric. Then the fibre packing density can be expressed as follows
.
Let us now solve some numerical problems.
Problem 1.3: Consider a laminated nonwoven material which is made up of polypropylene fiber
and has the following dimensions: 10 cm length, 10 cm width, and 0.7 mm thickness. Its weight
is 2.82 g. Calculate fiber packing density in this material.
Solution 1.3: The weight (M) of the nonwoven material is 2.82 10-3 Kg and its volume (VF) is
710-6 m3. So, its (mass) density (r*) is calculated as follows:
Let us consider the polypropylene fiber density (r) be 910 Kg×m-3. Therefore, fiber packing
density (m) is calculated as follows
.
Problem 1.4: Take a needlebonded fiber web, made up of polyester fiber, has 2 mm thickness
and 100 g×m-2 basis weight. Calculate fiber packing density in this material.
Solution 1.4: The basis weight (W) of the needlebonded fiber web is 10010-3 Kg×m-2 and its
thickness is (T) is 210-3 m. So, its (mass) density (r*) is calculated as follows
.
Let us consider the polyester fiber density (r) be 1380 Kg×m-3. Therefore, fiber packing density
(m) is calculated as follows
10

.
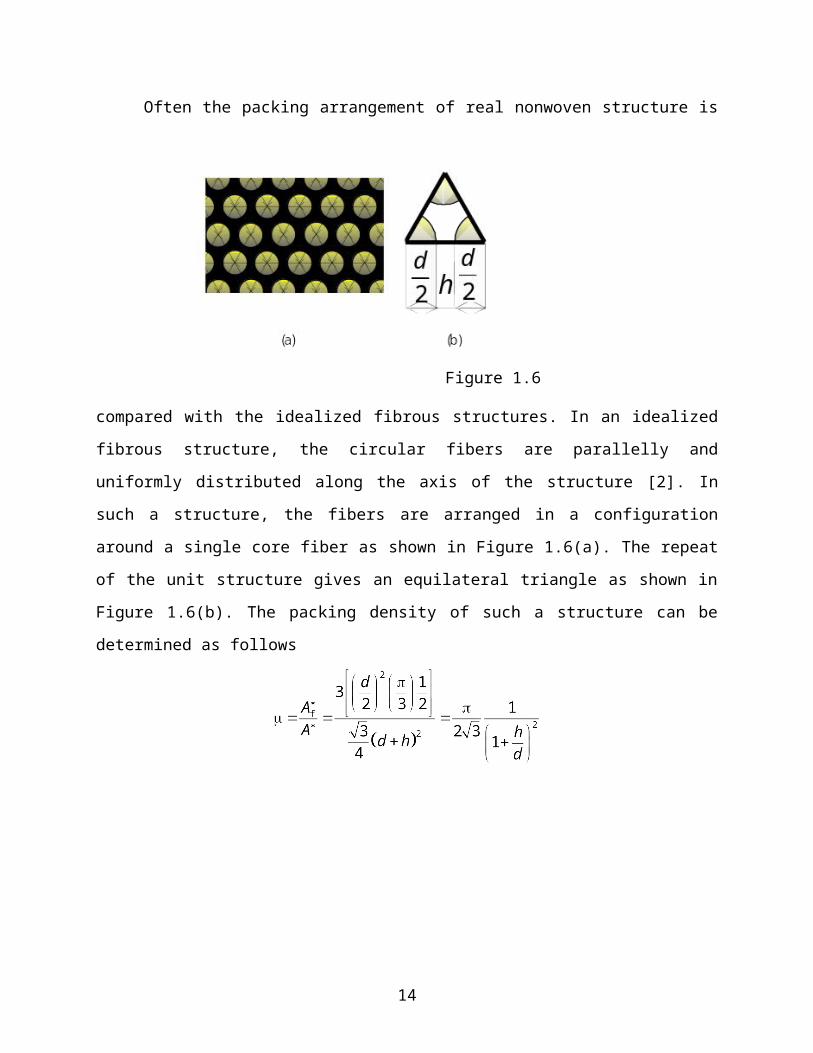
Often the packing arrangement of real nonwoven structure is compared with the idealized
fibrous
structures. In an idealized fibrous structure, the circular fibers are parallelly and uniformly
distributed along the axis of the structure [2]. In such a structure, the fibers are arranged in a
configuration around a single core fiber as shown in Figure 1.6(a). The repeat of the unit
structure gives an equilateral triangle as shown in Figure 1.6(b). The packing density of such a
structure can be determined as follows
11
Figure 1.6

Let us further consider four variants of this idealized structure. In the first variant, the fibre are
touching each other, that is, h=0. Then the packing density can be obtained as m=0.91. Let us call
this structure as the tightest structure. It shows the highest resistance to mechanical deformation,
but it offers least softness. In the second variant, , then the packing density takes on
. Let us call this structure as tight structure. It shows the high resistance to
mechanical deformation, but it offers low softness. In the third variant, , then the
packing density takes on . Let us call this structure as intermediate structure. It
shows the moderate resistance to mechanical deformation, and at the same time it offers
moderate softness. In the forth variant, , then the packing density takes on . Let us
call this structure as loose structure. It shows the least resistance to mechanical deformation, but
it offers highest softness. Figure 1.7 gives a better visualization of these idealized structures.
Fibre directional arrangement
12
Figure 1.7

The arrangement of fibers in nonwovens is described not only by the fiber packing
arrangement, but also by the fiber directional arrangement (fiber orientation). Let us now discuss
about fibre orientation [2]. We consider one such fiber, shown by thin green line in Figure 1.8.
As shown, the curvature of the fibres varies
widely. Simply, it has many directions. Then
how can we describe this fiber in terms of its
direction? To answer this question, let us divide
this fiber into small segments. Thus, we get
fiber segments. Consider a fiber segment of
finite length (thick green line), which can be
assigned by a suitable orientation vector i. This
vector has a direction of joining the end points
(A and B) of the fiber segment and it is unitary. When its direction is given by its
tangent.
It
is
generally
known
that the
orientation of fibres in the thickness direction (z-direction) is not significant and we will discuss
here about the orientation of fibres in two-dimensional plane of nonwovens. Such an orientation
of fibres is known as planar orientation of fibres. We will first consider planar isotropic
orientation of fibres, that is, purely random orientation of fibres in plane. Let us think about fiber
segments. The direction of these fiber segments can be described by their orientation angles
, as shown in Figure 1.9. In this case, all fiber segments are equally distributed
in all directions. Therefore, the probability density function of their orientation is
. Then
13
Figure 1.8
Figure 1.9
(Think that the area under the probability curve is equal to
one.) then, . The behavior of this function is shown in Figure 1.10.
Often, fiber segments, during their processing, take a direction near to a preferential
direction because they are mechanically affected by 1) other fiber segments of the same or other
fiber and 2) technological (machine) elements like pins, cylinders, rollers, etc. This can be
analogously described by a flexible felt equipped with spikes being extended in a particular
direction (preferential direction), as shown in Figure 1.11 [2]. Here,
14
Figure 1.10

. Then,
. Then, . Further, differentiation
of with respect to yields
15
Figure 1.11

Here,
denotes
the
probability density function of orientation before extension. Then, the relative frequency of fiber
segments in an elementary class before extension is . Let us consider that
represents the probability density function of orientation after extension and refers to
the relative frequency of fiber segments in an elementary class after extension. Both of these
relative frequencies must be the same. Therefore, Substituting
and into this, we obtain
. Clearly, the maximum value of is and
the minimum value of is . The value of extension C is known as a
measure of preference, that is, measure of anisotropy. Here, . The behavior of the
probability density function for different values of the anisotropy parameter C is shown in Figure
1.12. The corresponding distribution function is
16
Figure 1.12

Sometimes, the preferential direction of fibre orientation may be something other than the
direction of y-axis. Let us assume that the preferential direction (/) is described by the
preferential angle with y-axis, shown in Figure 1.13. Here, x is the angle of fiber segment from
preferential direction and y is the angle of fiber segment from y-axis. Then
. Since and ,
we obtain .
Let us see if the orientation of fibres in a real nonwoven fabric can be explained in terms
of the aforesaid theory of fibre orientation. A nonwoven fabric was developed by using polyester
fibres of
51 mm
length
and 1.1
dtex
fineness
and
employing opening, carding, cross-lapping, needle-punch technology. This fabric is shown in
Figure 1.14. A sample of this fleece was placed on a mirror, and the light was allowed to pass
through the fleece and reflect off the mirror surface vertically back to the camera. The fibers,
17
Figure 1.14

regardless of their position within the fleece, could merely block the light, appeared dark, and
were in focus. The result was an image with excellent contrast and uniformity. The image was
“thresholded” to separate the fibers from the black and white background to obtain a binary
image. This binary image was then analyzed to determine the orientation of 1500 fixed 24-pixel
fiber segments. Thirty such images were taken randomly from different parts of the fleece, thus
the orientation of 45000 fiber segments was determined. This large set of orientation data was
summarized by frequency distribution in ten classes each of 18 degree width. The resulting
histogram is displayed in Figure 1.15. The continuous line corresponds to the probability density
function of fiber orientation in nonwoven for C=1.1678. This was obtained by using the standard
non-linear regression technique. Evidently, the theoretical result corresponded well to the
experimental one. Note that this nonwoven material shows lowest value of probability density
function of fibre orientation in the machine direction . Why? The answer lies in
understanding of the cross-lay process. The readers are encouraged to first study the cross-lay
process and then provide a meaningful answer to this question.
The images of some major types of nonwovens are shown in Figure 1.16. The manufacturing
processes of these fabrics will be discussed in detail later on.
18
Figure 1.15

19
Figure 1.16

Pore structure in nonwovensA nonwoven fabric generally consists of a large number of fibers and a large (volume)
portion of
this
material
is
occupied
by air. If
we
project
this fabric
onto a two-dimensional plane, we obtain an “elementary plane” of this fabric. This is shown in
Figure 1.17. Evidently, this plane consists of numerous fibers and many air spaces are
surrounded by fibers. We call these air spaces as pores. One such pore is shown in Figure 1.17.
We will now study the structure of these pores present in such an elementary plane of a
nonwoven fabric.
Let the fibers be distributed randomly in an elementary plane of unit area and the
probability P(n) that any given point is covered by n fibers present per unit area of the plane is
given by Poisson distribution of the following form
,
where c is the total projected area of fibers per unit area of the plane. (c is termed as coverage.)
Evidently, , where l is fiber length, and d is fiber width (diameter). According to the
geometrical definition of probability, P(n) is the area covered by n fibers per unit area of the
plane, that is, P(n) is the fraction of unit area covered by n fibers. If so then P(0) is the fraction of
unit area not covered by fibers, then P(0) represents the open area fraction of the plane. Then,
20
Figure 1.17
Figure 1.18

. Clearly, 1-x is the fraction of the unit area covered by fibers. Similarly, P(1) is
the fraction of area covered by one fiber, P(2) is the fraction of area covered by two fibers, and
so on. Let us assume that a point covered by n fibers is covered by n-1 crossings. This is
illustrated in Figure 1.18.
Therefore, the total area Ac occupied by all fiber crossings per unit area of the plane is
.
Thus, the total area of fiber crossings Ac is the difference between the total coverage c and the
fraction of the unit area covered by fibers (1-x). The area ac occupied by one fiber crossing
(Figure 1.19) is given by . Then the number nc of fiber crossings per unit
area of the plane is
21

Fiber crossings form the vertices of polygons in the plane. Each polygon simulates a
pore. According to Kallmes and Corte [4], the expression for number of such pores np is
. The mean cross-sectional area ap of pore is given by
. Generally, , then,
.
Thus, the mean pore cross-sectional area ap is inversely proportional to the square of the total
length (nl) of fiber deposited. We consider the mean cross-sectional area ap of pore is equal to
the area of a circle of diameter . Then we write
We call as equivalent pore diameter or simply, pore diameter. Here the pore diameter (dp) is
inversely proportional to the total length (nl) of fiber deposited. Note that we assumed all fibers
were randomly deposited in an elementary plane, therefore, all these relations are valid for such
plane only.
So far we have studied about the pore structure in an elementary plane. We imagine that
many such identical elementary planes are stacked one on the other in order to make the ultimate
22
Figure 1.19

nonwoven fabric. Let us now assume that (1) The thickness T of such a plane is equal to the
thickness of two fibers, that is, T=2d (Figure 1.20) and (2) The center of fibers lie on or within
this plane, that means, in principle, as many as three fibers can intersect within this plane. Hence,
this model holds whenever P(4) <<1. Apparently, the pore structure of an elementary plane is
decided by the pore structure of other elementary planes. Then, how many elementary planes
must be considered to determine the effective pore structure of a given plane? This depends upon
how densely the elementary planes are packed together. This is, of course, decided by the fiber
material used and the process technology employed for making the nonwovens. Whatsoever, at
least minimum of two elementary planes always interact to determine the effective pore structure
of a given plane. Let be the number of elementary planes that must be taken into account
together to describe the pore structure in nonwoven and we assume Then,
Here V is total volume of all fibers, VF is total volume of fabric, m is packing density, y is
porosity.
23
Figure 1.20

Let us see if the pore structure of a real nonwoven fabric can be explained in terms of the
aforesaid theory of pore structure. A series of spunbond nonwovens was prepared with varying
basis weight (weight per unit area), thickness, and porosity. The fibre diameter was measured as
3.82 micron. The pore diameter was measured by using the standard image analysis technique.
Table 1.1 shows the results of experiments. The pore diameter was also calculated from the
above theory. The theoretical results are also shown in Table 1.1. Evidently, the theoretical
results correspond very well with the experimental results.
1.3 Nonwovens: How are they created?
Basic nonwoven processesLet us take that the nonwoven manufacturing technology that produces fibre-based
nonwovens generally consists of four basic nonwoven processes namely, fibre preparation
process, web formation process, web bonding process and finishing process. A brief summary of
the nonwoven processes is illustrated in Figure 1.21.
24
Table 1.1
Fabric code Measured value (Experiment) Calculated
values of
average pore
diameter
(micron)
Basis weight
(g.m-2)
Thickness
(mm)
Porosity (-) Average pore
diameter
(micron)
A 34.20 0.3140 0.90 15.70 14.99
B 50.0 0.3430 0.87 11.70 11.53
C 65.0 0.3360 0.83 10.00 8.82
D 96.0 0.4690 0.82 8.80 8.33
E 111.0 0.5060 0.81 8.40 7.89

Figure 1.21
The fibre preparation process prepares fibres for web formation process. It includes fibre
opening and mixing and fibre feeding to carding machine or air-lay machine. The web formation
process, as the name implies, indicates those processes that disperses the fibres or filaments to
form a sheet or web and also stacks the webs to form multi-layered webs, sometimes called as
batts. The web bonding processes imparts integrity to the web and the resulting material is often
called as fabrics. Often, the fabrics undergo mechanical or chemical finishing or both in order to
achieve enhanced properties and appearance.
As expected, these processes along with the choice of fibres determine the structures and
properties of the nonwoven fabrics. It is often said that the nonwoven fabrics are engineered in a
unique way by the nonwoven technology employed and the fibre materials used so as to offer a
set of targeted properties. Here, the word technology implies a system of sequence of basic
processes. As a nonwoven technologist, it is imperative to learn how these basic processes can be
arranged to engineer a wide spectrum of nonwoven fabrics for a wide variety of applications.
25

Process augmentations
Often the technology of nonwovens is implied by the name of the nonwoven materials
which are prepared by utilizing a particular sequence of basic nonwoven processes [1]. For
example, carded nonwovens refer to a technology in which the staple fibres undergo a sequence
of opening and mixing process, followed by web formation by carding processes, and then
followed by adhesive bonding or thermal bonding. Similarly, perpendicular-laid nonwovens refer
to a technology in which the staple fibres undergo a sequence of opening and mixing process,
followed by web formation by carding processes, and then web stacking by perpendicular-lay
process and finally followed by through-air thermal bonding process. In a similar manner, air-
laid nonwovens refer to a technology in which the staple fibres undergo a sequence of opening
and mixing process, followed by web formation by air-lay processes, and then followed by
thermal bonding or adhesive bonding. In the same vein, wet-laid nonwovens refer to a
technology in which the staple fibres undergo a sequence of opening and mixing process,
followed by web formation by wet-lay processes, and then followed by adhesive bonding or
thermal bonding. In these cases, the web formation processes tend to give the name to the
technology.
In contrast, the needle-punch technology often refers to systems in which the staple
fibres, taken from bales, are opened, carded by using roller top card or flat top card, cross-lapped
to achieve the desired basis weight of the final web (batt), passed through a needle loom for
bonding and then given a finishing treatment. Similarly, hydroentanglement technology refers to
a system in which the staple fibres are opened and formed into a web by using air-lay
technology, and finally bonded by hydroentanglement machine. To enhance the properties of
fabrics for specific end-uses, an additional step of resin bonding, drying, and curing may follow;
one may think of this as a finishing process. Note that the hydroentanglement technology is also
called as spunlace technology. In these cases, the web bonding processes tend to give the name
to the technology.
The next set of technologies was developed as a combination of at least polymer
preparation process, web formation process, and web bonding process. We refer to spunbond
technology and meltblown technology. In these technologies, the characteristics of the polymers
used and the principles of the processes followed are highly different; as a result, the structures
26

and the properties of the resulting nonwovens are very much different, which demands for
different applications of these nonwovens.
In this course, we will first focus on the nonwoven technologies that are relevant to staple
fibre nonwovens. Then we will focus on polymer-extrusion based nonwoven technologies
namely, spunbond technology and meltblown technology.
Note that in recent years many attempts are made to develop new nonwoven technologies
by combing these processes in a unique way, for example, Evolon technology, Coform
technology, SMS technology, etc. These technologies are often described as composite
nonwoven technologies, which are, however, beyond the scope of this course.
References[1] Batra, S., Pourdeyhimi, B., Shiffler, D., TT 305 Fibre Web and Nonwoven Production,
Desk Copy, North Carolina State University, USA, 2004.
[2] Neckar, B. and Das, D., Theory of structure and mechanics of fibrous assemblies,
Woodhead Publishing India Ltd., New Delhi, 2011.
[3] Simmonds, G. E., Bomberger, J. D., Bryner, M. A., Designing nonwovens to meet pore
size specifications, Journal of Engineered Fibres and Fabrics 2 (1), 1-15, 2007.
[4] Kallmes, O. and Corte, H., TAPPI 43 (9), 737-752, 1960.
27