Embed Size (px)
DESCRIPTION
CHAPTER 1 Overview Of Renal Biopsy In Malaysia Lee Ming Lee Lily Mushahar Lee Day Guat. Table 1.2.1: Total number of renal biopsies by centres, 2005 – 2012. 5 th MRRB report 2011 & 2012, Malaysia. Continue;. 5 th MRRB report 2011 & 2012, Malaysia. - PowerPoint PPT Presentation
Citation preview

CHAPTER 1Overview Of Renal Biopsy In Malaysia
Lee Ming LeeLily MushaharLee Day Guat

Table 1.2.1: Total number of renal biopsies by centres, 2005 – 2012
5th MRRB report 2011 & 2012, Malaysia

Continue;
5th MRRB report 2011 & 2012, Malaysia
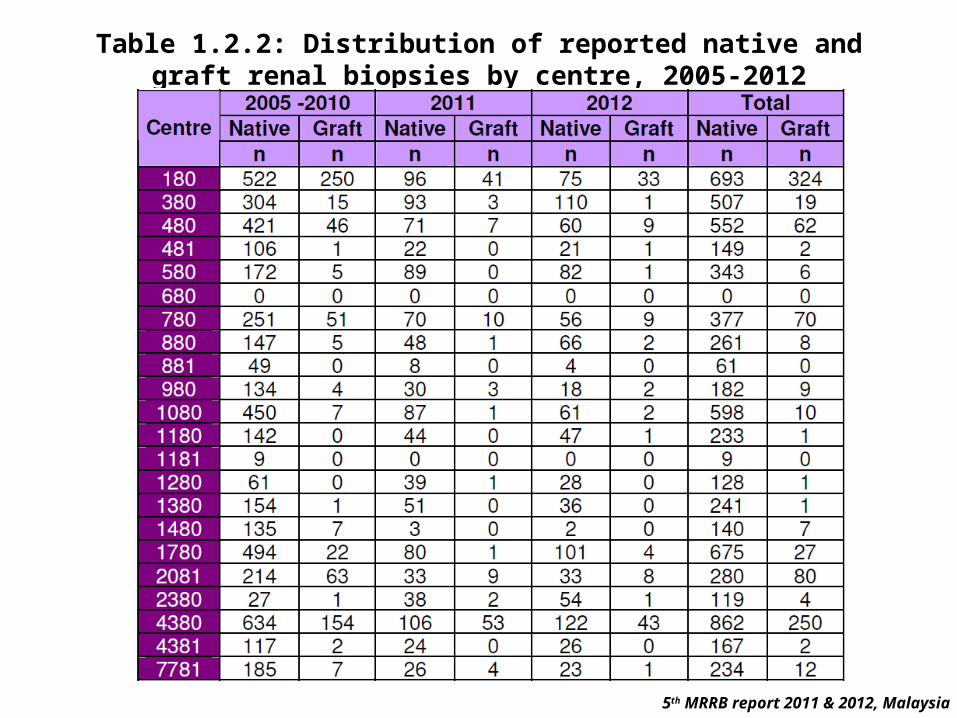
Table 1.2.2: Distribution of reported native and graft renal biopsies by centre, 2005-2012
5th MRRB report 2011 & 2012, Malaysia

Continue;
5th MRRB report 2011 & 2012, Malaysia

Table 1.2.3(a): Distribution of native renal biopsy in patients by number of episodes, 2005-2012
Native2005 - 2010 2011 2012 Total
n % n % n % n
1st episode 4711 86.8 1214 84.5 1219 85.0 7144
2nd episode 577 10.6 174 12.1 162 11.3 913
3rd episode 119 2.2 37 2.6 41 2.9 197
≥4th episode 21 0.4 11 0.8 12 0.8 44
Total Patient 5428 100 1436 100 1434 100 8298
5th MRRB report 2011 & 2012, Malaysia
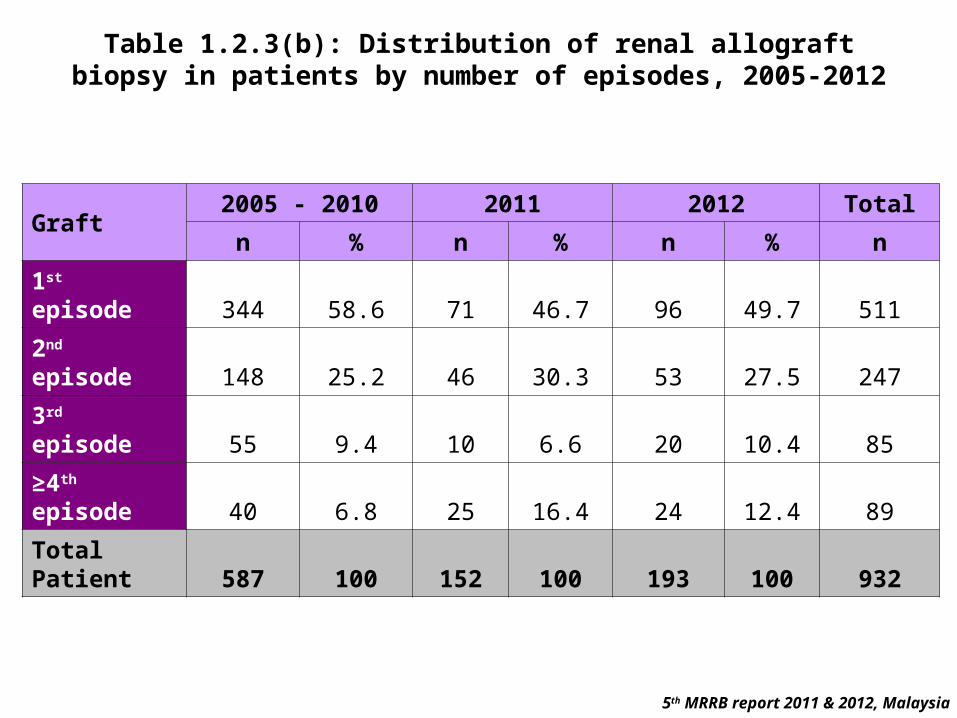
Table 1.2.3(b): Distribution of renal allograft biopsy in patients by number of episodes, 2005-2012
Graft2005 - 2010 2011 2012 Total
n % n % n % n
1st episode 344 58.6 71 46.7 96 49.7 511
2nd episode 148 25.2 46 30.3 53 27.5 247
3rd episode 55 9.4 10 6.6 20 10.4 85
≥4th episode 40 6.8 25 16.4 24 12.4 89
Total Patient 587 100 152 100 193 100 932
5th MRRB report 2011 & 2012, Malaysia

Table 1.2.4.1(a): Age distribution of native renal biopsy, 2005-2012
Age group (years)
2005 - 2010 2011 2012 Total
n n n n %
<15 879 184 158 1221 14.1
15-<25 1589 404 391 2384 27.5
25-<35 1266 373 341 1980 22.9
35-<45 892 205 234 1331 15.4
45-<55 627 180 192 999 11.5
55-<65 292 100 109 501 5.8
≥65 147 48 46 241 2.8
Total 5692 1494 1471 8657 100
5th MRRB report 2011 & 2012, Malaysia
Table 1.2.4.1(b): Age distribution of renal allograft biopsy, 2005-2012
Age group (years)
2005 - 2010 2011 2012 Total
n n n n %
<15 37 9 8 54 4.2
15-<24 122 34 21 177 13.7
25-<35 133 36 78 247 19.1
35-<45 218 86 76 380 29.3
45-<55 176 44 69 289 22.3
55-<65 65 29 33 127 9.8
65 15 1 5 21 1.6
Total 766 239 290 1295 100
5th MRRB report 2011 & 2012, Malaysia

Table 1.2.4.1(c): Age group distribution of reported renal biopsies by state, 2005-2012
5th MRRB report 2011 & 2012, Malaysia

Table 1.2.4.2(a): Gender distribution of native renal biopsy, 2005-2012
Gender2005 – 2010 2011 2012 Total
n n n n %
Male 2176 589 599 3364 40.5
Female 3252 847 835 4934 59.5
Total 5428 1436 1434 8298 100
5th MRRB report 2011 & 2012, Malaysia

Table 1.2.4.2(b): Gender distribution of renal allograft biopsy, 2005-2012
Gender2005 - 2010 2011 2012 Total
n n n n %
Male 370 101 121 592 63.5
Female 217 51 72 340 36.5
Total 587 152 193 932 100
5th MRRB report 2011 & 2012, Malaysia

Table 1.2.4.3(a): Racial distribution of native renal biopsy, 2005-2012
Race2005 - 2010 2011 2012 Total
n n n n %
Malay 3110 862 851 4823 58.1
Chinese 1390 320 346 2056 24.8
Indian 359 109 98 566 6.8
Others 569 145 139 853 10.3
Total 5428 1436 1434 8298 100
5th MRRB report 2011 & 2012, Malaysia

Table 1.2.4.3(b): Racial distribution of renal allograft biopsy, 2005-2012
Race2005 - 2010 2011 2012 Total
n n n n %
Malay 186 49 59 294 31.5
Chinese 314 80 97 491 52.7
Indian 56 12 24 92 9.9
Others 31 11 13 55 5.9
Total 587 152 193 932 100
5th MRRB report 2011 & 2012, Malaysia

Table 1.2.5: Number of glomeruli obtained at each biopsy by centres, 2005-2012
5th MRRB report 2011 & 2012, Malaysia
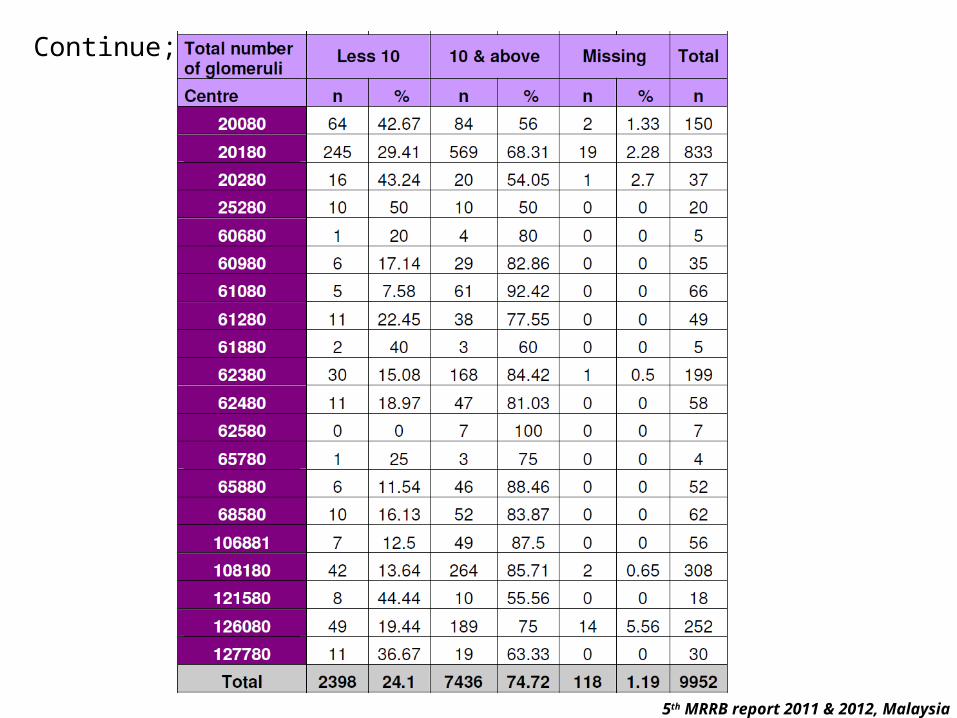
Continue;
5th MRRB report 2011 & 2012, Malaysia
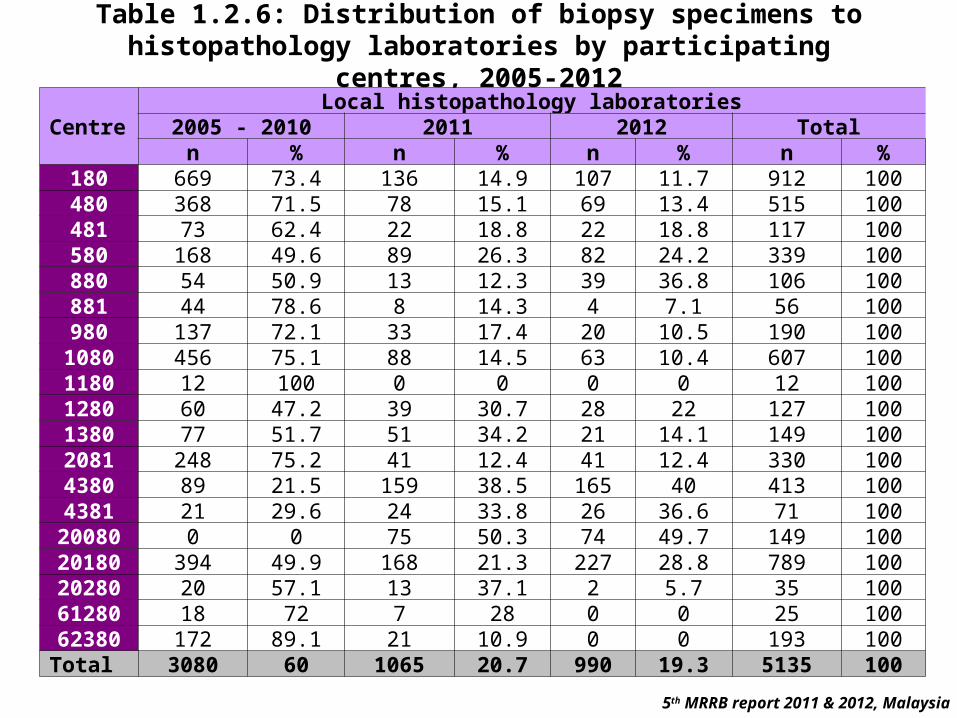
Table 1.2.6: Distribution of biopsy specimens to histopathology laboratories by participating centres, 2005-2012
CentreLocal histopathology laboratories
2005 - 2010 2011 2012 Totaln % n % n % n %
180 669 73.4 136 14.9 107 11.7 912 100480 368 71.5 78 15.1 69 13.4 515 100481 73 62.4 22 18.8 22 18.8 117 100580 168 49.6 89 26.3 82 24.2 339 100880 54 50.9 13 12.3 39 36.8 106 100881 44 78.6 8 14.3 4 7.1 56 100980 137 72.1 33 17.4 20 10.5 190 1001080 456 75.1 88 14.5 63 10.4 607 1001180 12 100 0 0 0 0 12 1001280 60 47.2 39 30.7 28 22 127 1001380 77 51.7 51 34.2 21 14.1 149 1002081 248 75.2 41 12.4 41 12.4 330 1004380 89 21.5 159 38.5 165 40 413 1004381 21 29.6 24 33.8 26 36.6 71 100
20080 0 0 75 50.3 74 49.7 149 10020180 394 49.9 168 21.3 227 28.8 789 10020280 20 57.1 13 37.1 2 5.7 35 10061280 18 72 7 28 0 0 25 10062380 172 89.1 21 10.9 0 0 193 100
Total 3080 60 1065 20.7 990 19.3 5135 100
5th MRRB report 2011 & 2012, Malaysia

Continue;
CentreOutside histopathology laboratories
2005 - 2010 2011 2012 Total Alln % n % n % n % n %
180 103 98.1 1 1 1 1 105 100 1017 10.2380 319 60.6 96 18.3 111 21.1 526 100 526 5.3480 99 100 0 0 0 0 99 100 614 6.2481 34 100 0 0 0 0 34 100 151 1.5580 9 90 0 0 1 10 10 100 349 3.5780 302 67.6 80 17.9 65 14.5 447 100 447 4.5880 98 60.1 36 22.1 29 17.8 163 100 269 2.7881 5 100 0 0 0 0 5 100 61 0.6980 1 100 0 0 0 0 1 100 191 1.9
1080 1 100 0 0 0 0 1 100 608 6.11180 130 58.6 44 19.8 48 21.6 222 100 234 2.41181 9 100 0 0 0 0 9 100 9 0.11280 1 50 1 50 0 0 2 100 129 1.31380 78 83.9 0 0 15 16.1 93 100 242 2.41480 142 96.6 3 2 2 1.4 147 100 147 1.51780 516 73.5 81 11.5 105 15 702 100 702 7.12081 29 96.7 1 3.3 0 0 30 100 360 3.62380 28 22.8 40 32.5 55 44.7 123 100 123 1.24380 699 100 0 0 0 0 699 100 1112 11.24381 98 100 0 0 0 0 98 100 169 1.77781 192 78 30 12.2 24 9.8 246 100 246 2.5
5th MRRB report 2011 & 2012, Malaysia

Continue;
CentreOutside histopathology laboratories
2005 - 2010 2011 2012 Total Alln % n % n % n % n %
20080 0 0 1 100 0 0 1 100 150 1.520180 4 9.1 15 34.1 25 56.8 44 100 833 8.420280 0 0 2 100 0 0 2 100 37 0.425280 14 70 3 15 3 15 20 100 20 0.260680 5 100 0 0 0 0 5 100 5 0.160980 18 51.4 7 20 10 28.6 35 100 35 0.461080 39 59.1 14 21.2 13 19.7 66 100 66 0.761280 8 33.3 4 16.7 12 50 24 100 49 0.561880 5 100 0 0 0 0 5 100 5 0.162380 6 100 0 0 0 0 6 100 199 262480 0 0 18 31 40 69 58 100 58 0.662580 6 85.7 0 0 1 14.3 7 100 7 0.165780 4 100 0 0 0 0 4 100 4 065880 36 69.2 7 13.5 9 17.3 52 100 52 0.568580 44 71 8 12.9 10 16.1 62 100 62 0.6
106881 39 69.6 9 16.1 8 14.3 56 100 56 0.6108180 162 52.6 76 24.7 70 22.7 308 100 308 3.1121580 14 77.8 4 22.2 0 0 18 100 18 0.2126080 63 25 82 32.5 107 42.5 252 100 252 2.5127780 18 60 5 16.7 7 23.3 30 100 30 0.3
Total 3378 70.1 668 13.9 771 16 4817 100 9952 100
5th MRRB report 2011 & 2012, Malaysia

Figure 1.2.6(b) i: Distribution of biopsy specimens to Local histopathology laboratories by participating centres, 2005-2012
0
10
20
30
40
50
60
70
80
90
100
110
180
380
480
481
580
780
880
881
980
1080
1180
1181
1280
1380
1480
1780
2081
2380
4380
4381
7781
2008
0
2018
0
2028
0
2528
0
6068
0
6098
0
6108
0
6128
0
6188
0
6238
0
6248
0
6258
0
6578
0
6588
0
6858
0
1068
81
1081
80
1215
80
1260
80
1277
80
Centre
Pe
rce
nta
ge
(%
)
2005 - 2010 2011 2012
5th MRRB report 2011 & 2012, Malaysia

Figure 1.2.6(b) ii: Distribution of biopsy specimens to Outside histopathology laboratories by participating centres, 2005-2012
0
10
20
30
40
50
60
70
80
90
100
110
180
380
480
481
580
780
880
881
98010
8011
8011
8112
8013
8014
8017
8020
8123
8043
8043
8177
81
2008
0
2018
0
2028
0
2528
0
6068
0
6098
0
6108
0
6128
0
6188
0
6238
0
6248
0
6258
0
6578
0
6588
0
6858
0
1068
81
1081
80
1215
80
1260
80
1277
80
Centre
Pe
rce
nta
ge
(%
)
2005 - 2010 2011 2012
5th MRRB report 2011 & 2012, Malaysia

Table 1.2.6(c): Summary of biopsies received by local and outside laboratories, 2007-2010
2007 (1st report)
2008 (2nd report)
2009 (3rd report)
2010 (4th report)
2012 (5th report)
n % n % n % n % n %
In house Lab 1085 44.9 1799 47.6 2360 48.5 2984 47.8 5135 51.6
Outside Lab 1334 55.1 1978 52.4 2506 51.5 3265 52.2 4817 48.40
All Lab 2419 100 3777 100 4866 100 6249 100 9952 100
5th MRRB report 2011 & 2012, Malaysia

Table 1.2.6(d): Histopathology laboratories receiving renal biopsy specimens, 2005-2012
5th MRRB report 2011 & 2012, Malaysia
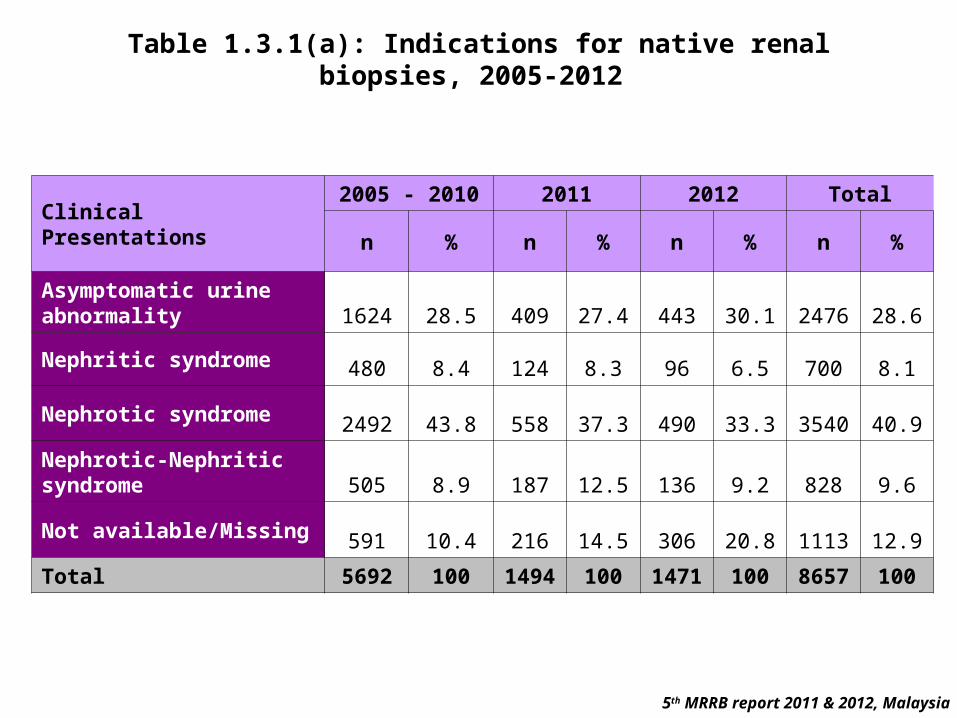
Table 1.3.1(a): Indications for native renal biopsies, 2005-2012
Clinical Presentations2005 - 2010 2011 2012 Total
n % n % n % n %
Asymptomatic urine abnormality 1624 28.5 409 27.4 443 30.1 2476 28.6
Nephritic syndrome 480 8.4 124 8.3 96 6.5 700 8.1
Nephrotic syndrome 2492 43.8 558 37.3 490 33.3 3540 40.9
Nephrotic-Nephritic syndrome 505 8.9 187 12.5 136 9.2 828 9.6
Not available/Missing 591 10.4 216 14.5 306 20.8 1113 12.9
Total 5692 100 1494 100 1471 100 8657 100
5th MRRB report 2011 & 2012, Malaysia

Table 1.3.1(b): Renal function at time of biopsy, 2005-2012
Clinical Presentations2005 – 2010 2011 2012 Total
n % n % n % n %
Normal 2936 51.6 729 48.8 670 45.5 4335 50.1
Impaired 2106 37.0 551 36.9 541 36.8 3198 36.9
Not available/Missing 650 11.4 214 14.3 260 17.7 1124 13.0
Total 5692 100 1494 100 1471 100 8657 100
5th MRRB report 2011 & 2012, Malaysia

Table 1.3.2: Histopathology of all native renal biopsies, 2005-2012
5th MRRB report 2011 & 2012, Malaysia

Continue;
5th MRRB report 2011 & 2012, Malaysia

Table 1.3.3.1: HPE diagnosis in patients presenting with Nephrotic Syndrome, 2005-2012
*Patients may have either one or more histopathology or not have any histopathologyOthers = Tubulo. Disease + Vascular + Advance GN + Others + Hereditary (no observation)
Type Histopathological Diagnosis n %
Primary GN
Minimal Change 969 26.9FSGS 751 20.9lg A nephropathy 182 5.1Membranous nephropathy 207 5.8Membrano-proliferative 33 0.9Mesangial Proliferative GN-non IgA 51 1.4Crescentic 0 0.0Idiopathic crescentic 8 0.2Not available/Missing 7 0.2Sub total 2208 61.3
Secondary GN
Other infection 9 0.3Lupus Nephritis 815 22.6Henoch Schonlein Purpura 4 0.1HUS/TTP 1 0.0Amyloidosis 12 0.3Systemic vasculitis 1 0.0Post infection GN 29 0.8Polyarteritis nodosa 0 0.0Malignancy 1 0.0Light/ heavy chain disease 1 0.0Diabetic nephropathy 181 5.0Anti GBM 0 0.0Immunotactoid / fibrillary GN 0 0.0Multiple myeloma 1 0.0Not available/Missing 10 0.3Sub total 1065 29.6
Others 327 9.1Total 3600 100.0
5th MRRB report 2011 & 2012, Malaysia

Table 1.3.3.2: HPE diagnosis in Patients presenting with Asymptomatic Urine Abnormalities, 2005-2012
Type Histopathological Diagnosis n %
Primary GN
Minimal Change 151 6.2FSGS 232 9.6lg A nephropathy 376 15.5Membranous nephropathy 66 2.7Membrano-proliferative 8 0.3Mesangial Proliferative GN-non IgA 42 1.7Crescentic 8 0.3Idiopathic crescentic 13 0.5Not available/Missing 6 0.2Sub total 902 37.3
Secondary GN
Other infection 3 0.1Lupus Nephritis 1031 42.6Henoch Schonlein Purpura 22 0.9HUS/TTP 0 0.0Amyloidosis 8 0.3Systemic vasculitis 5 0.2Post infection GN 24 1.0Polyarteritis nodosa 0 0.0Malignancy 0 0.0Light/ heavy chain disease 1 0.0Diabetic nephropathy 90 3.7Anti GBM 0 0.0Immunotactoid / fibrillary GN 0 0.0Multiple myeloma 7 0.3Missing 5 0.2Sub total 1196 49.4
Others 321 13.3Total 2419 100.0
* Patients may have either one or more histopathology or not have any histopathologyOthers = Tubulo. Disease + Vascular + Advance GN + Others + Hereditary 5th MRRB report 2011 & 2012, Malaysia

Table 1.3.3.3: HPE diagnosis in patients presenting with Nephritic-Nephrotic, 2005-2012
Type Histopathological Diagnosis n %
Primary GN
Minimal Change 49 5.7FSGS 62 7.2lg A nephropathy 78 9.0Membranous nephropathy 13 1.5Membrano-proliferative 11 1.3Mesangial Proliferative GN-non IgA 15 1.7Crescentic 2 0.2Idiopathic cresentic 8 0.9Not available/Missing 1 0.1Sub total 239 27.7
Secondary GN
Other infection 5 0.6Lupus Nephritis 427 49.5Henoch Schonlein Purpura 8 0.9HUS/TTP 1 0.1Amyloidosis 0 0.0Systemic vasculitis 2 0.2Post infection GN 44 5.1Polyarteritis nodosa 0 0.0Malignancy 2 0.2Light/ heavy chain disease 0 0.0Diabetic nephropathy 24 2.8Anti GBM 0 0.0Immunotactoid / fibrillary GN 0 0.0Multiple myeloma 1 0.1Not available/Missing 2 0.2Sub total 516 59.8
Others 108 12.5Total 863 100.0
* Patients may have either one or more histopathology or not have any histopathologyOthers = Tubulo. Disease + Vascular + Advance GN + Others + Hereditary (no observation) 5th MRRB report 2011 & 2012, Malaysia

Table 1.3.3.4: HPE diagnosis in Patients presenting with Nephritic syndrome, 2005-2012
Type Histopathological Diagnosis n %
Primary GN
Minimal Change 43 6.2FSGS 55 7.9lg A nephropathy 64 9.2Membranous nephropathy 4 0.6Membrano-proliferative 12 1.7Mesangial Proliferative GN-non IgA 14 2.0Crescentic 7 1.0Idiopathic cresentic 13 1.9Not available/Missing 5 0.7Sub total 217 31.0
Secondary GN
Other infection 0 0.0Lupus Nephritis 288 41.2Henoch Schonlein Purpura 7 1.0HUS/TTP 0 0.0Amyloidosis 1 0.1Systemic vasculitis 7 1.0Post infectious GN 53 7.6Polyarteritis nodosa 0 0.0Malignancy 0 0.0Light/ heavy chain disease 0 0.0Diabetic nephropathy 22 3.1Anti GBM 1 0.1Immunotactoid / fibrillary GN 0 0.0Multiple myeloma 0 0.0Not available/Missing 1 0.1Sub total 380 54.4
Others 102 14.6Total 699 100
* Patients may have either one or more histopathology or not have any histopathologyOthers = Tubulo. Disease + Vascular + Advance GN + Others + Hereditary 5th MRRB report 2011 & 2012, Malaysia

Table 1.3.3.5: Table for Primary Glomerulonephritis, 2005-2012
5th MRRB report 2011 & 2012, Malaysia

Figure 1.3.3.5: Primary gromerulonephritis according to the various age group, 2005-2012
0%
10%
20%
30%
40%
50%
60%
70%
80%
90%
100%
<15 15-<25 25-<35 35-<45 45-<55 55-<65 >65Age
Pe
rce
nta
ge
(%
)Minimal change disease FSGS
Ig A Nephropathy Membranous nephropathy
Membrano proliferative Mesangial proliferative Non-Ig ACrescentic ANCA Idiopathic crescentic
Not available/Missing
5th MRRB report 2011 & 2012, Malaysia


![Li Guat - Thesis[1]](https://img.pdfslide.net/doc/110x75/545cb858b1af9f08718b45ef/li-guat-thesis1.jpg)