Embed Size (px)
Citation preview

Chapter 1 第1章
Number of Patent Applications 特許出願件数1
Note: • The number of patent applications includes the number of applications for registration of extension of the duration of a right.
• An international patent application is an international application under the Patent Cooperation Treaty (PCT) that includes Japan as one of the designated countries and for which documents to enter the national phase were submitted to the JPO (patent applications only). The number of the applications was counted by the date when documents to enter the national phase were filed.
備考 : • 特許出願件数は、特許権の存続期間の延長登録の出願を含む。• 国際特許出願とは、特許協力条約に基づく国際出願であって指定国に日本国を含み、かつ日本国特許庁に国内書面が提出された出願(特許出願に係るものに限る。)。当該出願の件数は、国内書面の提出の日を基準にカウント。
Number of Patent Applications特許出願件数の推移
Figure 1-1-1 1-1-1図
Trends in Intellectual Property in Japan我が国の知財動向
0
300,000
200,000
100,000
Number / 件
2018 20192017201620152014201320122011Year / 年
291,091 289,738 274,279 267,652 258,290 258,488 255,951 249,554
51,519 53,05854,157 58,337 60,431 59,893 62,530 64,013
342,610 342,796 328,436 325,989 318,721 318,381 318,481 313,567 307,969
Number of International Patent Applications国際特許出願件数
Number of Patent Applications ExcludingInternational Patent Applications国際特許出願を除く特許出願件数
66,968
241,001
2020
288,472288,472
67,634
220,838
400,000
SR2021-1-1-1
1 2 3 4 5
1 Patents / 特許
12

Number of Requests for Examination 審査請求件数2
Number of Patent Registrations 特許登録件数3
Note: • The numbers of the requests for examination from 2011 to 2012 include the numbers of requests that are subject to the fee payment deferral system.
備考 : • 2011~2012年の審査請求件数は、審査請求料の納付を繰り延べた審査請求を含む。
Number of Requests for Examination審査請求件数の推移
Figure 1-1-2 1-1-2図
Number of Patent Registrations特許登録件数の推移
Figure 1-1-3 1-1-3図
0
300,000
200,000
100,000
Number / 件
20182017201620152014201320122011Year / 年
253,754 245,004 240,188 245,535 241,412 240,455 240,118 234,309
2019
235,182
2020
232,215
SR2021-1-1-2
1 2 3 4 5
0
300,000
250,000
200,000
150,000
100,000
50,000
Number / 件
2018 20192017201620152014201320122011Year / 年
238,323
274,791 277,079
227,142
189,358203,087 199,577 194,525
179,910
2020
179,383
SR2021-1-1-3
1 2 3 4 5
JPO STATUS REPORT 2021 13
Part1-Chapter1 Trends in Intellectual Property in Japan 第1部
第1章 我が国の知財動向
1

Number of PatentApplications特許出願件数
Number of Requests forExamination審査請求件数
Number of Patent Registrations特許登録件数
Number of Pending Examinations, Appeals against Examiner’s Decisionof Refusal, and Other Status審査・拒絶査定不服審判係属中等件数
Patent Registration Rate特許登録率
0
500,000
400,000
300,000
200,000
100,000
0
100
80
60
40
20
Number / 件 %
Year / 年
In Examination Request Period審査請求期間中
408,569
260,221
163,773
2006
396,160
252,485
166,613
2007
390,879
257,116
174,826
2008
348,429
233,901
166,919
2009
344,397
233,780
173,310
2010
342,312
232,471
175,937
2011
342,589
237,906
183,572
2012
328,138
233,708
183,845
2013
325,688
233,963
185,297
2014
313,028
168,079
66,114
2018
307,232
110,071
37,657
2019
287,747
64,752
7,851
2020
318,030
232,911
107,839
2017
317,922
231,357
167,970
2016
318,345
228,917
181,800
2015
Number of Requests for Examination審査請求件数
Number of Patent Registrations特許登録件数
Number of PatentApplications 特許出願件数
2018 2019 2020201720162015201420132012201120102009200820072006
SR2021-1-1-4
1 2 3 4 5
Number of Patent Registrations, etc. by Filing Year 出願年別特許登録件数等4
Number of Patent Registrations, etc. by Filing Year出願年別特許登録件数等の推移
Figure 1-1-4 1-1-4図
Note: • The number of patent registrations, etc. by filing year does not include The number of applications for registration of extension of the duration of a right.• The number of patent registrations by filing year is a provisional figure as of March 1, 2021.• The numbers of requests for examination by filing year in applications from 2018 to 2020 are provisional figures as of March 1, 2021.
備考 : • 出願年別特許登録件数等は、特許権の存続期間の延長登録の出願の件数は含まれない件数。• 出願年別特許登録件数は、2021年3月1日時点での暫定値。• 2018年から2020年の出願における出願年別審査請求件数は、2021年3月1日時点での暫定値。
14
Chapter 1 第1章

Number of Patent Applications by Country/Region of Applicant出願人国籍・地域別特許出願件数
5
Number of Patent Applications by Country/Region of Applicant in 2020 (Top 10 Countries/Regions)
2020年における出願人国籍・地域別特許出願件数(上位10か国・地域)
Figure 1-1-5 1-1-5図
Number / 件
Othersその他の国・地域
Swedenスウェーデン
Taiwan台湾
Netherlandsオランダ
UK英国
Switzerlandスイス
Franceフランス
South Korea韓国
Germanyドイツ
China中国
US米国
Japan日本
200,070 3,415 2,703 2,025 581 259 108 171 90711998698
Number of Foreign Language Applications外国語書面出願件数
Number of Patent Applications Excluding International Patent Applications and Foreign Language Applications国際特許出願及び外国語書面出願を除く特許出願件数
Number of InternationalPatent Applications国際特許出願件数
7,456
5,448
1,101
227,348
26,963
315
22,451
14,656
4,380
8,406
5,330
373
5,881
3,629
227
5,540
3,918
1041
2,602
1,790
553
2,375
1,865
402
1,946
1,470
305
1,861
1,550
213
1,442
146
310
1,164
869
176
Total Number ofPatent Applications総特許出願件数
Othersその他の国・地域
Swedenスウェーデン
Taiwan台湾
Netherlandsオランダ
UK英国
Switzerlandスイス
Franceフランス
South Korea韓国
Germanyドイツ
China中国
US米国
Japan日本
0
5,000
10,000
15,000
20,000
25,000
30,000
200,000
225,000
250,000
Number of InternationalPatent Applications国際特許出願件数
Number of Foreign Language Applications外国語書面出願件数
Number of Patent Applications Excluding InternationalPatent Applications and Foreign Language Applications国際特許出願及び外国語書面出願を除く特許出願件数
SR2021-1-1-51 2 3 4 5
Note: • In the case joint applicants filed, the number of patent applications were counted by country/region of a head applicant.• An international patent application is an international application under the Patent Cooperation Treaty (PCT) that includes Japan as one of the designated
countries and for which documents to enter the national phase were submitted to the JPO (patent applications only). The number of the applications was counted by the date when documents to enter the national phase were filed.
備考 : • 共同出願については、筆頭出願人の国籍・地域でカウント。• 国際特許出願とは、特許協力条約に基づく国際出願であって指定国に日本国を含み、かつ日本国特許庁に国内書面が提出された出願(特許出願に係るものに限る。)。当該出願の件数は、国内書面の提出の日を基準にカウント。
JPO STATUS REPORT 2021 15
Part1-Chapter1 Trends in Intellectual Property in Japan 第1部
第1章 我が国の知財動向
1

Top 10 Companies with the Most Number of Patent Registrations (Domestic Companies)
特許登録件数上位10社(国内企業)
6
Note: • Numbers in parentheses are for 2019.• Each applicant was counted in the case joint applicants filed.
備考 : • 表中括弧内は2019年。• 共同出願については、それぞれの出願人でカウント。
Top 10 Companies with the Most Number of Patent Registrationsin 2020(Domestic Companies)
2020年における 特許登録件数上位10社 (国内企業)
Figure 1-1-6 1-1-6図
Canon Inc.キヤノン株式会社
Mitsubishi Electric Corporation三菱電機株式会社
TOYOTA MOTOR CORPORATIONトヨタ自動車株式会社
Panasonic Intellectual Property Management Co., Ltd.パナソニックIPマネジメント株式会社
DENSO CORPORATION株式会社デンソー
Honda Motor Co., Ltd.本田技研工業株式会社
Ricoh Company, Ltd.株式会社リコー
SANKYO CO., LTD.株式会社 SANKYO
FUJITSU LIMITED富士通株式会社
NEC Corporation日本電気株式会社
1
2
3
4
5
6
7
8
9
10
Rank in 2020順位
Rank in 2019前年順位
Applicant出願人
Number of Registrations登録件数
3,680
3,626
2,714
2,643
2,049
1,651
1,602
1,542
1,453
1,370
(4,264)
(3,543)
(2,898)
(2,564)
(2,651)
(1,813)
(1,495)
(1,670)
(1,632)
(1,188)
1
2
3
5
4
6
10
7
8
14
SR2021-1-1-6
1 2 3 4 5
7,608
16
Chapter 1 第1章

Top 10 Companies with the Most Number of Patent Registrations (Foreign Companies)
特許登録件数上位10社(国外企業)
7
Note: • Numbers in parentheses are for 2019.• Each applicant was counted in the case joint applicants filed.
備考 : • 表中括弧内は2019年。• 共同出願については、それぞれの出願人でカウント。
Top 10 Companies with the Most Number of Patent Registrationsin 2020(Foreign Companies)
2020年における 特許登録件数上位10社 (国外企業)
Figure 1-1-7 1-1-7図
QUALCOMM Incorporatedクアルコム,インコーポレイテッド
LG Chem, Ltd.エルジー・ケム・リミテッド
HUAWEI TECHNOLOGIES CO., LTD.ホアウェイ・テクノロジーズ・カンパニー・リミテッド
Royal Philipsコーニンクレッカ フィリップス エヌ ヴェ
Samsung Electronics Co., Ltd.三星電子株式会社
Robert Bosch GmbHロベルト・ボッシュ・ゲゼルシャフト・ミト・ベシュレンクテル・
General Electric Companyゼネラル・エレクトリック・カンパニイ
The Boeing Companyザ・ボーイング・カンパニー
ALIBABA GROUP HOLDING LTDアリババ・グループ・ホールディング・リミテッド
Google LLCグーグル エルエルシー
1
2
3
4
5
6
7
8
9
10
Rank in 2020順位
Rank in 2019前年順位
Applicant出願人
Number of Registrations登録件数
679
650
569
540
341
335
327
290
278
245
(904)
(661)
(729)
(684)
(411)
(305)
(324)
(344)
(109)
(276)
1
4
2
3
5
8
7
6
33
10
SR2021-1-1-7
1 2 3 4 5
7,608
JPO STATUS REPORT 2021 17
Part1-Chapter1 Trends in Intellectual Property in Japan 第1部
第1章 我が国の知財動向
1

Note: • The numbers in parentheses are for 2019.• Applications filed by a university president, university, or approved TLO were counted.• The count includes joint Applications with corporations, etc.• In The case joint applicants filed, each applicant was counted.
備考 : • 表中括弧内は2019年。• 出願人が大学長又は大学を有する学校法人名の出願及び承認TLOの出願をカウント。• 企業等との共同出願もカウント。• 共同出願については、それぞれの出願人でカウント。
Top 11 Universities, etc., with the Most Number of Patent Registrations in 20202020年における特許登録件数上位11大学等
Figure 1-1-9 1-1-9図
The University of Tokyo東京大学
Osaka University大阪大学
Kyoto University京都大学
Tohoku University東北大学
Tokyo Institute of Technology東京工業大学
Kyushu University九州大学
Tokai National Higher Education and Research System東海国立大学機構
Hiroshima University広島大学
Hokkaido University北海道大学
Shinshu University信州大学
Keio University慶應義塾大学
Total全大学等合計
1
2
3
4
5
6
7
8
9
10
10
Rank in 2020順位
Rank in 2019前年順位
Applicant出願人
Number of Registrations登録件数
213
205
190
184
138
103
99
84
75
72
72
3,625
(255)
(175)
(161)
(179)
(106)
(96)
(111)
(66)
(82)
(70)
(68)
1
3
4
2
6
7
5
11
8
9
10
SR2021-1-1-91 2 3 4 5
7,608
Number of Patent Applications Filed by Universities, etc., in Japan我が国の大学等の特許出願件数
8
Note: • Applications filed by a university president, university, or approved TLO were counted.• The count includes joint Applications with corporations, etc.
備考 : • 出願人が大学長又は大学を有する学校法人名の出願及び承認TLOの出願をカウント。• 企業等との共同出願もカウント。
Number of Patent Applications Filed by Universities, etc., in Japan我が国の大学等の 特許出願件数の推移
Figure 1-1-8 1-1-8図
0
9,000
8,000
7,000
6,000
5,000
4,000
3,000
2,000
1,000
Number / 件
20182017201620152014201320122011Year / 年
2019 2020
SR2021-1-1-8
1 2 3 4 5
6,756 6,962 6,561 6,899 6,967 7,223 7,281 7,1467,608
7,084
18
Chapter 1 第1章

Number of PCT International Applications PCT国際出願件数9
Number of PCT International Applications Filed with the JPO as the Receiving Office日本国特許庁を受理官庁とするPCT国際出願件数の推移
Figure 1-1-10 1-1-10図
0
60,000
50,000
40,000
30,000
20,000
10,000
Number / 件
20182017201620152014201320122011
37,97442,787 43,075 41,292 43,097 44,495
47,425 48,630
7,608
SR2021-1-1-10
1 2 3 4 5
2019
51,652
2020
49,314
Year / 年
JPO STATUS REPORT 2021 19
Part1-Chapter1 Trends in Intellectual Property in Japan 第1部
第1章 我が国の知財動向
1

Number of Utility Model Registrations 実用新案登録件数2
Number of Utility Model Registrations実用新案登録件数の推移
Figure 1-1-12 1-1-12図
SR2021-1-1-12
1 2 3 4 5
7,608
0
10,000
8,000
6,000
4,000
2,000
Number / 件
20182017201620152014201320122011Year / 年
7,5958,054
7,363 7,017 6,695 6,297 6,0245,303
2019
5,033
2020
5,518
Note: • An international utility model application is an international application under the Patent Cooperation Treaty (PCT) that includes Japan as one of the designated countries and for which documents to enter the national phase were submitted to the JPO (utility model applications only).The number of the applications were counted by the date when documents to enter the national phase were filed.
備考 : • 国際実用新案登録出願は、特許協力条約に基づく国際出願であって指定国に日本国を含み、かつ日本国特許庁に国内書面が提出された出願(実用新案登録出願に係るものに限る。)。当該出願の件数は、国内書面の提出の日を基準にカウント。
Number of Utility Model Applications 実用新案登録出願件数1
Number of Utility Model Applications実用新案登録出願件数の推移
Figure 1-1-11 1-1-11図
SR2021-1-1-11
1 2 3 4 5
0
8,000
6,000
4,000
2,000
Number / 件
2019 202020182017201620152014201320122011Year / 年
7,905 8,024 7,525 6,968 6,700 6,349 5,9625,189
79 8897
127 160 131144
199
7,984 8,1127,622
7,095 6,860 6,480 6,1065,388 5,241
Number of InternationalUtility Model Applications国際実用新案登録出願件数
Number of Utility Model Applications ExcludingInternational Utility Model Applications国際実用新案登録出願を除く実用新案登録出願件数
191
5,050
6,018253
5,765
10,000
2 Utility Models / 実用新案
20
Chapter 1 第1章

Number of Requests for Utility Model Technical Opinion実用新案技術評価の請求件数
3
Number of Requests for Utility Model Technical Opinion実用新案技術評価の 請求件数の推移
Figure 1-1-13 1-1-13図
SR2021-1-1-13
1 2 3 4 5
7,608
0
800
600
400
200
Number / 件
20182017201620152014201320122011Year / 年
491 519437 401 422
341295 293
2019
289
2020
221
JPO STATUS REPORT 2021 21
Part1-Chapter1 Trends in Intellectual Property in Japan 第1部
第1章 我が国の知財動向
1

Number of Utility Model Applications by Country/Region of Applicant出願人国籍・地域別実用新案登録出願
4
Number of Utility Model Applications by Country/Region of Applicant in 2020 (Top 5 Countries/Re-gions)
2020年における出願人国籍・地域別実用新案登録出願件数(上位5か国・地域)
Figure 1-1-14 1-1-14図Number / 件
Othersその他の国・地域
China中国
US米国
Taiwan台湾
South Korea韓国
Japan日本
Number of UtilityModel ApplicationsExcluding InternationalUtility Model Applications国際実用新案登録出願を除く実用新案登録出願件数
Number of InternationalUtility Model Applications国際実用新案登録出願件数
Total Number ofUtility Model Applications総実用新案登録出願件数
Othersその他の国・地域
China中国
Germanyドイツ
US米国
Taiwan台湾
South Korea韓国
Japan日本
Germanyドイツ
0
800
700
600
500
400
300
200
100
4,000
4,500
Number of InternationalUtility Model Applications国際実用新案登録出願件数
Number of Utility Model Applications ExcludingInternational Utility Model Applications国際実用新案登録出願を除く実用新案登録出願件数
4,370 612 640 36 31 18 58
85
27
19
1
42
11
44
8
652
12
799
187
4,377
7
SR2021-1-1-14
1 2 3 4 5
7,608
Note: • In the case joint applicants filed, the number of patent applications were counted by country/region of a head applicant.
• An international utility model application is an international application under the Patent Cooperation Treaty (PCT) that includes Japan as one of the designated countries and for which documents to enter the national phase were submitted to the JPO (utility model applications only).The number of the applications were counted by the date when documents to enter the national phase were filed.applicant.
備考 : • 共同出願については、筆頭出願人の国籍・地域でカウント。• 国際実用新案登録出願は、特許協力条約に基づく国際出願であって指定国に日本国を含み、かつ日本国特許庁に国内書面が提出された出願(実用新案登録出願に係るものに限る。)。当該出願の件数は、国内書面の提出の日を基準にカウント。
22
Chapter 1 第1章
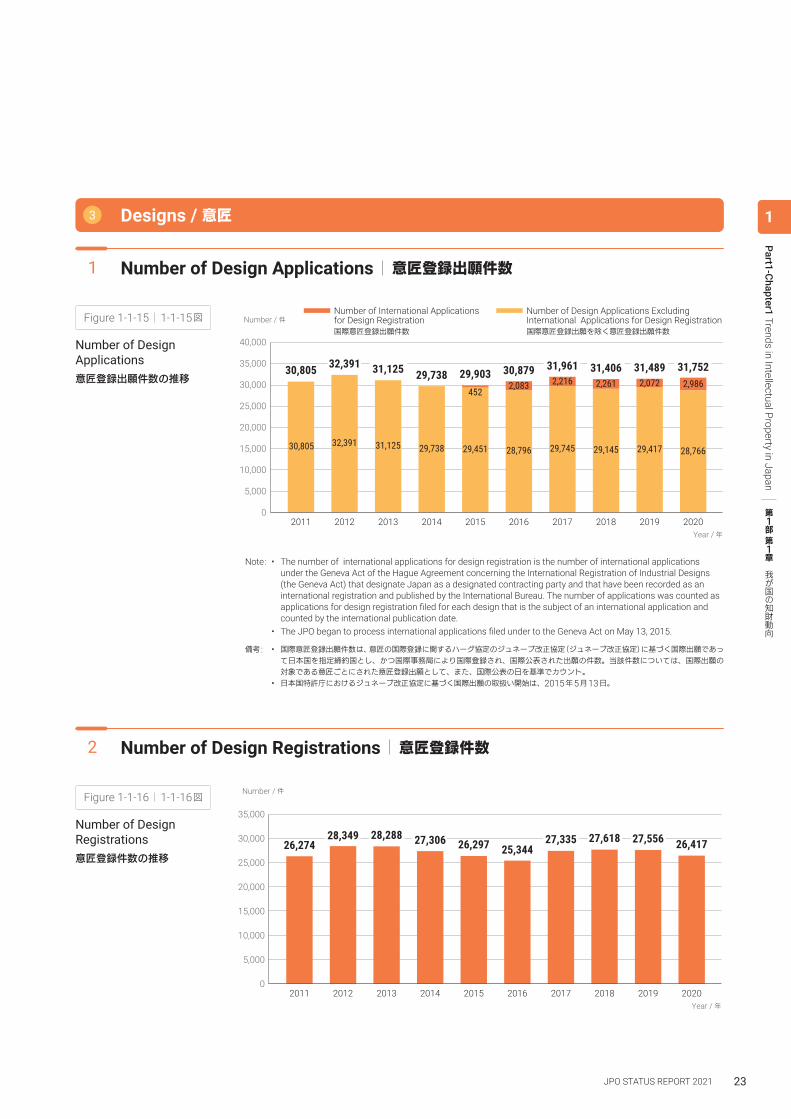
Number of Design Registrations 意匠登録件数2
Number of Design Registrations意匠登録件数の推移
Figure 1-1-16 1-1-16図
3 Designs / 意匠
Note: • The number of international applications for design registration is the number of international applications under the Geneva Act of the Hague Agreement concerning the International Registration of Industrial Designs (the Geneva Act) that designate Japan as a designated contracting party and that have been recorded as an international registration and published by the International Bureau. The number of applications was counted as applications for design registration filed for each design that is the subject of an international application and counted by the international publication date.
• The JPO began to process international applications filed under to the Geneva Act on May 13, 2015.
備考 : • 国際意匠登録出願件数は、意匠の国際登録に関するハーグ協定のジュネーブ改正協定(ジュネーブ改正協定)に基づく国際出願であって日本国を指定締約国とし、かつ国際事務局により国際登録され、国際公表された出願の件数。当該件数については、国際出願の対象である意匠ごとにされた意匠登録出願として、また、国際公表の日を基準でカウント。
• 日本国特許庁におけるジュネーブ改正協定に基づく国際出願の取扱い開始は、2015年5月13日。
Number of Design Applications 意匠登録出願件数1
Number of Design Applications意匠登録出願件数の推移
Figure 1-1-15 1-1-15図
SR2021-1-1-15
1 2 3 4 5
7,608
0
Number / 件
2018 20192017201620152014201320122011
30,805 32,391 31,125 29,738 29,451 28,796 29,745 29,145
4522,083 2,216 2,261
30,805 32,391 31,125 29,738 29,903 30,879 31,961 31,406 31,489
Number of International Applicationsfor Design Registration国際意匠登録出願件数
Number of Design Applications ExcludingInternational Applications for Design Registration国際意匠登録出願を除く意匠登録出願件数
2,072
29,417
2020
31,7522,986
28,766
35,000
40,000
30,000
25,000
20,000
15,000
10,000
5,000
Year / 年
0
30,000
25,000
35,000
20,000
15,000
10,000
5,000
Number / 件
20182017201620152014201320122011Year / 年
26,27428,349 28,288 27,306 26,297 25,344
27,335 27,618
2019
27,556
2020
26,417
SR2021-1-1-16
1 2 3 4 5
7,608
JPO STATUS REPORT 2021 23
Part1-Chapter1 Trends in Intellectual Property in Japan 第1部
第1章 我が国の知財動向
1

Number of Design Applications by Country/Region of Applicant in 2020 (Top 10 Countries/Regions)
2020年における出願人国籍・地域別意匠登録出願件数(上位10か国・地域)
Figure 1-1-17 1-1-17図
Othersその他の国・地域
Italyイタリア
Netherlandsオランダ
Taiwan台湾
UK英国
Germanyドイツ
Franceフランス
South Korea韓国
Switzerlandスイス
US米国
China中国
Japan日本
Number of International Applicationsfor Design Registration国際意匠登録出願件数
Number of Design Applications ExcludingInternational Applications for Design Registration国際意匠登録出願を除く意匠登録出願件数
0
22,500
2,500
22,000
2,000
1,500
1,000
500
Number / 件
22,258
154
22,412
1,975
375
2,350
1,958
224
2,182
506
407
913
294
382
676
339
289
628Total Number ofDesign Applications総意匠登録出願件数
Number of International Applications for Design Registration国際意匠登録出願件数
Othersその他の国・地域
Italyイタリア
Taiwan台湾
UK英国
Franceフランス
Netherlandsオランダ
Switzerlandスイス
Germanyドイツ
South Korea韓国
China中国
US米国
Japan日本
198
176
374
102
256
358
183
119
302
236
0
236
50
159
209
667
445
1,112
Number of Design Applications Excluding InternationalApplications for Design Registration国際意匠登録出願を除く意匠登録出願件数
SR2021-1-1-17
1 2 3 4 5
7,608
Note: • In the case joint applicants filed, the number of design applications were counted by country/region of a head applicant.• The number of international applications for design registration was counted by the residence of a head applicant.
備考 : • 共同出願については、筆頭出願人の国籍・地域でカウント。• 国際意匠登録出願については、筆頭出願人の居住国・地域でカウント。
Number of Design Applications by Country/Region of Applicant出願人国籍・地域別意匠登録出願件数
3
24
Chapter 1 第1章
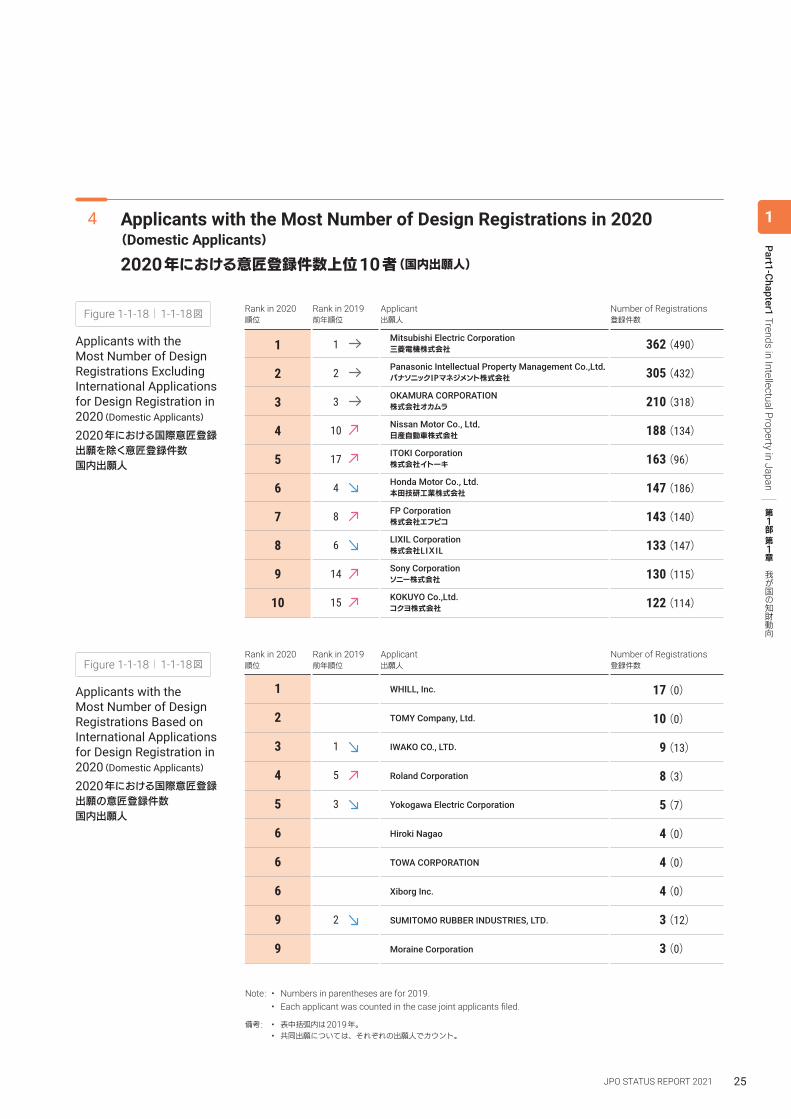
Applicants with the Most Number of Design Registrations in 2020 (Domestic Applicants)
2020年における意匠登録件数上位10者(国内出願人)
4
Note: • Numbers in parentheses are for 2019.• Each applicant was counted in the case joint applicants filed.
備考 : • 表中括弧内は2019年。• 共同出願については、それぞれの出願人でカウント。
Applicants with the Most Number of Design Registrations Excluding International Applications for Design Registration in 2020(Domestic Applicants)
2020年における国際意匠登録出願を除く意匠登録件数 国内出願人
Figure 1-1-18 1-1-18図
Applicants with the Most Number of Design Registrations Based on International Applications for Design Registration in 2020(Domestic Applicants)
2020年における国際意匠登録出願の意匠登録件数 国内出願人
Figure 1-1-18 1-1-18図
Mitsubishi Electric Corporation三菱電機株式会社
Panasonic Intellectual Property Management Co.,Ltd.パナソニックIPマネジメント株式会社
OKAMURA CORPORATION株式会社オカムラ
Nissan Motor Co., Ltd.日産自動車株式会社
ITOKI Corporation株式会社イトーキ
Honda Motor Co., Ltd.本田技研工業株式会社
FP Corporation株式会社エフピコ
LIXIL Corporation株式会社LIXIL
Sony Corporationソニー株式会社
KOKUYO Co.,Ltd.コクヨ株式会社
1
2
3
4
5
6
7
8
9
10
Rank in 2020順位
Rank in 2019前年順位
Applicant出願人
Number of Registrations登録件数
362
305
210
188
163
147
143
133
130
122
(490)
(432)
(318)
(134)
(96)
(186)
(140)
(147)
(115)
(114)
1
2
4
15
10
17
3
14
8
6
Rank in 2020順位
Rank in 2019前年順位
Applicant出願人
Number of Registrations登録件数
17
10
9
8
5
4
4
4
3
3
(0)
(0)
(13)
(3)
(7)
(0)
(0)
(0)
(12)
(0)
WHILL, Inc.1
TOMY Company, Ltd.2
IWAKO CO., LTD.3 1
Roland Corporation4 5
Yokogawa Electric Corporation5 3
Hiroki Nagao6
TOWA CORPORATION6
Xiborg Inc.6
SUMITOMO RUBBER INDUSTRIES, LTD.9 2
Moraine Corporation9
SR2021-1-1-18
SR2021-1-1-18
1 2 3 4 5
7,608
JPO STATUS REPORT 2021 25
Part1-Chapter1 Trends in Intellectual Property in Japan 第1部
第1章 我が国の知財動向
1

Companies with the Most Number of Design Registrations in 2020 (Foreign Companies)
2020年における意匠登録件数上位10社(国外企業)
5
Note: • Numbers in parentheses are for 2019.• Each applicant was counted in the case joint applicants filed.
備考 : • 表中括弧内は2019年。• 共同出願については、それぞれの出願人でカウント。
Companies with the Most Number of Design Registrations Excluding International Applications for Design Registration in 2020(Foreign Companies)
2020年における国際意匠登録出願を除く意匠登録件数 上位11社(国外企業)
Figure 1-1-19 1-1-19図
Companies with the Most Number of Design Registrations Based on International Applications for Design Registration in 2020(Foreign Companies)
2020年における国際意匠登録出願の意匠登録件数 上位10社(国外企業)
Figure 1-1-19 1-1-19図
Rank in 2020順位
Rank in 2019前年順位
Applicant出願人
Number of Registrations登録件数
264
216
129
98
78
66
51
51
42
41
41
(46)
(125)
(32)
(22)
(99)
(159)
(65)
(38)
(16)
(34)
(20)
NIKE INNOVATE C.V.ナイキ イノベイト シーブイ1 6
Apple Inc.アップル インコーポレイテッド2 2
HARRY WINSTON SAハリー・ウィンストン・エス アー3 18
LG ELECTRONICS INC.エルジー エレクトロニクス インコーポレイティド4 32
Ethicon LLCエシコン エルエルシー5 3
Google LLCグーグル エルエルシー6 1
Fisher & Paykel Healthcare Limited.フィッシャー アンド ペイケル ヘルスケア リミテッド7 4
Amazon Technologies, Inc.アマゾン テクノロジーズ インコーポレイテッド7 11
SHARKNINJA OPERATING LLCシャークニンジャ オペレーティング エルエルシー9 48
Louis Vuitton Malletierルイ ヴィトン マルチェ10 16
Huawei Technologies Co., Ltd.ホアウェイ・テクノロジーズ・カンパニー・リミテッド10 38
1
2
3
4
5
6
7
8
9
10
Rank in 2020順位
Rank in 2019前年順位
Applicant出願人
Number of Registrations登録件数
167
126
116
51
44
37
31
28
24
22
(45)
(54)
(97)
(8)
(17)
(3)
(18)
(34)
(0)
(3)
4
2
1
12
6
96
96
11
29
LG ELECTRONICS INC.
THE PROCTER & GAMBLE COMPANY
KONINKLIJKE PHILIPS N.V.
FERRARI S.P.A.
HERMES SELLIER(SOCIÉTÉ PAR ACTIONS SIMPLIFIÉE)
BEIJING XIAOMI MOBILE SOFTWARE CO., LTD.
CARTIER INTERNATIONAL AG
PATEK PHILIPPE SA GENEVE
TETRA LAVAL HOLDINGS & FINANCE S.A.
CHRISTIAN DIOR COUTURE
SR2021-1-1-19
SR2021-1-1-19
Rank in 2020順位
Rank in 2019前年順位
Applicant出願人
Number of Registrations登録件数
264
216
129
98
78
66
51
51
42
41
41
(46)
(125)
(32)
(22)
(99)
(159)
(65)
(38)
(16)
(34)
(20)
NIKE INNOVATE C.V.ナイキ イノベイト シーブイ1 6
Apple Inc.アップル インコーポレイテッド2 2
HARRY WINSTON SAハリー・ウィンストン・エス アー3 18
LG ELECTRONICS INC.エルジー エレクトロニクス インコーポレイティド4 32
Ethicon LLCエシコン エルエルシー5 3
Google LLCグーグル エルエルシー6 1
Fisher & Paykel Healthcare Limited.フィッシャー アンド ペイケル ヘルスケア リミテッド7 4
Amazon Technologies, Inc.アマゾン テクノロジーズ インコーポレイテッド7 11
SHARKNINJA OPERATING LLCシャークニンジャ オペレーティング エルエルシー9 48
Louis Vuitton Malletierルイ ヴィトン マルチェ10 16
Huawei Technologies Co., Ltd.ホアウェイ・テクノロジーズ・カンパニー・リミテッド10 38
1
2
3
4
5
6
7
8
9
10
Rank in 2020順位
Rank in 2019前年順位
Applicant出願人
Number of Registrations登録件数
167
126
116
51
44
37
31
28
24
22
(45)
(54)
(97)
(8)
(17)
(3)
(18)
(34)
(0)
(3)
4
2
1
12
6
96
96
11
29
LG ELECTRONICS INC.
THE PROCTER & GAMBLE COMPANY
KONINKLIJKE PHILIPS N.V.
FERRARI S.P.A.
HERMES SELLIER(SOCIÉTÉ PAR ACTIONS SIMPLIFIÉE)
BEIJING XIAOMI MOBILE SOFTWARE CO., LTD.
CARTIER INTERNATIONAL AG
PATEK PHILIPPE SA GENEVE
TETRA LAVAL HOLDINGS & FINANCE S.A.
CHRISTIAN DIOR COUTURE
SR2021-1-1-19
SR2021-1-1-19
26
Chapter 1 第1章

Number of International Applications (Design) 国際登録出願(意匠)件数等6
Number of Designs Included in International Applications by Applicant’s Country of Residence出願人居住国別の国際出願に含まれる意匠数の推移
Figure 1-1-20 1-1-20図
Number / 件
Franceフランス
US米国
South Korea韓国
Italyイタリア
Switzerlandスイス
Germanyドイツ
Netherlandsオランダ
Japan日本
China中国
UK英国
0
1,000
2,000
3,000
4,000
5,000
2015 2016 2017 2018 2019
SR2021-1-1-20
1 2 3 4 5
7,608
4,536
,2,736
2,179 1,995
1,375 1,356 1,298 1,151
676 550
Source: • This figure was prepared by the JPO based on the WIPO Intellectual Property Statistics.
資料 : • WIPO Intellectual Property Statisticsを基に特許庁作成
JPO STATUS REPORT 2021 27
Part1-Chapter1 Trends in Intellectual Property in Japan 第1部
第1章 我が国の知財動向
1

Number of Trademark Registrations 商標登録件数2
Number of Trademark Registrations商標登録件数の推移
Figure 1-1-22 1-1-22図
0
140,000
120,000
100,000
80,000
60,000
40,000
20,000
Number / 件
20182017201620152014201320122011Year / 年
89,27996,359
103,399 99,896 98,085105,207 111,180 116,547
SR2021-1-1-22
1 2 3 4 5
7,608
2019
109,859
2020
135,314
Note: • The number of trademark applications includes applications for defensive trademark registration and applica-tions for renewal based on defensive trademark registration.
• The number of international applications for trademark registration is the number of international applications under the Protocol Relating to the Madrid Agreement which designate Japan and for which their designated states were noticed to the JPO. The number of the applications were counted by the date of the notification.
備考 : • 商標登録出願件数は、防護標章登録出願及び防護標章登録に基づく権利の存続期間の更新登録の出願を含む。 • 国際商標登録出願件数は、マドリッド協定議定書に基づく国際出願であって日本国を指定し、かつ領域指定の通報が日本国特許庁に行われた出願の件数。当該件数については、領域指定の通報が日本国特許庁に行われた日を基準にカウント。
Number of Trademark Applications 商標登録出願件数1
Number of Trademark Applications商標登録出願件数の推移
Figure 1-1-21 1-1-21図
0
120,000
60,000
150,000
180,000
90,000
30,000
Number / 件
2018 20192017201620152014201320122011 2020Year / 年
95,648 107,222 103,979 111,770131,299
148,024173,611 166,681
12,41211,788 13,696 12,672
15,98413,835
17,328 17,802
108,060119,010 117,675 124,442
147,283161,859
190,939 184,483 190,773181,072
Number of InternationalApplications for TrademarkRegistration国際商標登録出願件数
Number of Trademark ApplicationsExcluding International Applicationsfor Trademark Registration国際商標登録出願を除く商標登録出願件数
19,450
171,323
17,924
163,148
210,000
SR2021-1-1-21
1 2 3 4 5
7,608
4 Trademarks / 商標
28
Chapter 1 第1章

Number of Trademark Applications by Country/Region of Applicant in 2020 (Top 10 Countries/Regions)
2020年における出願人国籍・地域別商標登録出願件数(上位10か国・地域)
Figure 1-1-23 1-1-23図
SR2021-1-1-23
1 2 3 4 5
7,608
Othersその他
Hong Kong香港
Taiwan台湾
Italyイタリア
UK英国
Switzerlandスイス
Franceフランス
South Korea韓国
Germanyドイツ
US米国
China中国
Japan日本
Number of International Applicationsfor Trademark Registration国際商標登録出願件数
Number of Trademark Applications ExcludingInternational Applications for Trademark Registration国際商標登録出願を除く商標登録出願件数
0
135,500
135,000
15,000
18,000
12,000
9,000
6,000
3,000
Number / 件
135,361 15,770 4,519 2,121 279 498 403 303 2,135761884114
Total number ofTrademark Applications総商標登録出願件数
Number of InternationalApplications forTrademark Registration国際商標登録出願件数
Number of Trademark Applications Excluding International Applica-tions for Trademark Registration国際商標登録出願を除く商標登録出願件数
Othersその他
Hong Kong香港
Taiwan台湾
Italyイタリア
Switzerlandスイス
Franceフランス
UK英国
South Korea韓国
Germanyドイツ
US米国
China中国
Japan日本
6,525
4,390
761
0
884
0
1,106
992
1,422
1,119
1,462
1,059
1,514
1,016
2,230
1,951
2,996
875
8,616
4,097
18,181
2,411
135,375
14
Note: • In the case joint applicants filed, the number of trademark applications were counted by country/region of a head applicant.• The number of international applications for trademark registration was counted by the residence of a head applicant.• The number of international applications for trademark registration is the number of international applications under the Protocol Relating to the Madrid
Agreement which designate Japan and for which their designated states were noticed to the JPO. The number of the applications were counted by the date of the notification.
備考 : • 共同出願については、筆頭出願人の国籍・地域でカウント。• 国際商標登録出願については、筆頭出願人の居住国・地域でカウント。• 国際商標登録出願件数は、マドリッド協定議定書に基づく国際出願であって日本国を指定し、かつ領域指定の通報が日本国特許庁に行われた出願の件数。当該件数については、領域指定の通報が日本国特許庁に行われた日を基準にカウント。
Number of Trademark Applications by Country/Region of Applicant出願人国籍・地域別商標登録出願件数
3
JPO STATUS REPORT 2021 29
Part1-Chapter1 Trends in Intellectual Property in Japan 第1部
第1章 我が国の知財動向
1

Note: • The numbers in parentheses are for 2019.• in The case joint applicants filed, each applicant was counted.
備考 : • 表中括弧内は2019年の件数• 共同出願については、それぞれの出願人でカウント。
Sanrio Company, Ltd.株式会社サンリオ
Kao Corporation花王
Shiseido Company, Limited株式会社資生堂
JASS INTERNATIONAL INC.ジャス・インターナショナル株式会社
KOSE Corporation(also known as Kabushiki Kaisha KOSE)株式会社コーセー
Kobayashi Pharmaceutical Co., Ltd.小林製薬株式会社
HISAMITSU PHARMACEUTICAL CO.,INC.久光製薬株式会社
Taisho Pharmaceutical Co., Ltd. 大正製薬株式会社
Panasonic Corporationパナソニック株式会社
HARVEY BALL SMILE LIMITED有限会社ハーベイ・ボール・スマイル・リミテッド
1
2
3
4
5
6
7
8
9
10
Rank in 2020順位
Rank in 2019前年順位
Applicant出願人
Number of Registrations登録件数
674
603
507
505
470
340
213
198
194
189
(470)
(469)
(385)
(271)
(201)
(154)
(93)
(116)
(217)
(210)
1
2
3
4
8
11
26
17
6
7
SR2021-1-1-24
1 2 3 4 5
7,608
Top 10 Companies with the Most Number of Trademark Registrations(Domestic Companies)
商標登録件数上位10社(国内企業)
4
Top 10 Companies with the Most Number of Trademark Registrations in 2020(Domestic Companies)
2020年における商標登録件数上位10社(国内企業)
Figure 1-1-24 1-1-24図
30
Chapter 1 第1章
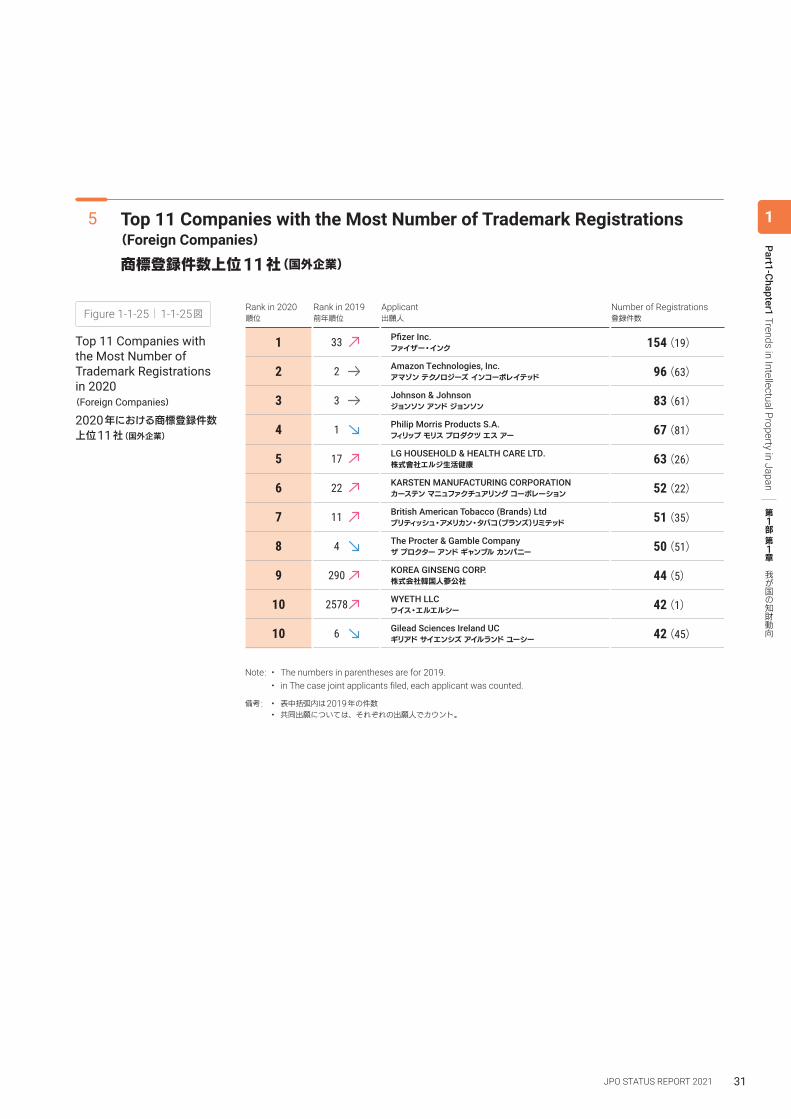
Note: • The numbers in parentheses are for 2019.• in The case joint applicants filed, each applicant was counted.
備考 : • 表中括弧内は2019年の件数• 共同出願については、それぞれの出願人でカウント。
Rank in 2020順位
Rank in 2019前年順位
Applicant出願人
Number of Registrations登録件数
154
96
83
67
63
52
51
50
44
42
42
(19)
(63)
(61)
(81)
(26)
(22)
(35)
(51)
(5)
(1)
(45)
Amazon Technologies, Inc.アマゾン テクノロジーズ インコーポレイテッド2 2
Johnson & Johnsonジョンソン アンド ジョンソン3 3
Philip Morris Products S.A.フィリップ モリス プロダクツ エス アー4 1
LG HOUSEHOLD & HEALTH CARE LTD.株式會社エルジ生活健康5 17
KARSTEN MANUFACTURING CORPORATIONカーステン マニュファクチュアリング コーポレーション6 22
British American Tobacco (Brands) Ltdブリティッシュ・アメリカン・タバコ(ブランズ)リミテッド7 11
The Procter & Gamble Companyザ プロクター アンド ギャンブル カンパニー8 4
KOREA GINSENG CORP.株式会社韓国人蔘公社9 290
WYETH LLCワイス・エルエルシー10 2578
Gilead Sciences Ireland UCギリアド サイエンシズ アイルランド ユーシー10 6
Pfizer Inc.ファイザー・インク1 33
SR2021-1-1-25
1 2 3 4 5
7,608
Top 11 Companies with the Most Number of Trademark Registrations(Foreign Companies)
商標登録件数上位11社(国外企業)
5
Top 11 Companies with the Most Number of Trademark Registrations in 2020(Foreign Companies)
2020年における商標登録件数上位11社(国外企業)
Figure 1-1-25 1-1-25図
JPO STATUS REPORT 2021 31
Part1-Chapter1 Trends in Intellectual Property in Japan 第1部
第1章 我が国の知財動向
1

Number of International Applications (Trademark)国際登録出願(商標)件数
6
Note: • An international application filed through the JPO as the office of origin, under the Protocol Relating to the Madrid Agreement, means an application for international registration set forth in Article 68-2 of the Trademark Act of Japan.
備考 : • 日本国特許庁を本国官庁とするマドリッド協定議定書に基づく国際出願とは、商標法第68条の2の国際登録出願。
Number of International Applications filed through the JPO as the Office of Origin, under the Protocol Relating to the Madrid Agreement日本国特許庁を本国官庁とするマドリッド協定議定書に基づく 国際出願件数の推移
Figure 1-1-26 1-1-26図
0
3,500
3,000
2,500
2,000
1,500
1,000
500
Number / 件
20182017201620152014201320122011Year / 年
1,547
2,1271,881 1,999 2,157
2,379 2,505
3,164
SR2021-1-1-26
1 2 3 4 5
7,608
2019
3,139
2020
3,033
32
Chapter 1 第1章

Result of Reconsideration by Examiners before Appeal Proceedings (Patents) 前置審査結果の推移(特許)
Figure 1-1-28 1-1-28図
SR2021-1-1-28
1 2 3 4 5
7,608
0
20,000
10,000
15,000
5,000
Number / 件
2018 20192017201620152014201320122011Year / 年
14,033 13,463 13,00212,507
11,949 10,546 9,801 8,893
8,8347,981 8,117
8,878
7,9576,351 6,407
5,749
Reconsideration Reportsby Examiners beforeAppeal Proceedings前置報告
Decisions to Grant a Patentupon Reconsideration by Examiners(before Appeal Proceedings)前置登録
6,000
8,389
2020
25,000
6,159
8,719
Statistics Related to Appeal against an Examiner’s Decision of Refusal拒絶査定不服審判関連統計
1
Number of Requests for Appeal against an Examiner’s Decision of Refusal拒絶査定不服審判請求件数の 推移
Figure 1-1-27 1-1-27図 Patent / 特許 Design / 意匠 Trademark / 商標Number / 件
30,000
25,000
20,000
15,000
2,000
1,000
02020201920182017201620152014201320122011
26,66324,958 24,644 25,709
21,860
,18,898 18,59116,536 16,699 16,899
Year / 年
SR2021-1-1-27
1 2 3 4 5
7,608
742367
811389
838293
672400514384
855845389
1,012
363899
396
1,460
440 391
5 Trials and Appeals / 審判
JPO STATUS REPORT 2021 33
Part1-Chapter1 Trends in Intellectual Property in Japan 第1部
第1章 我が国の知財動向
1
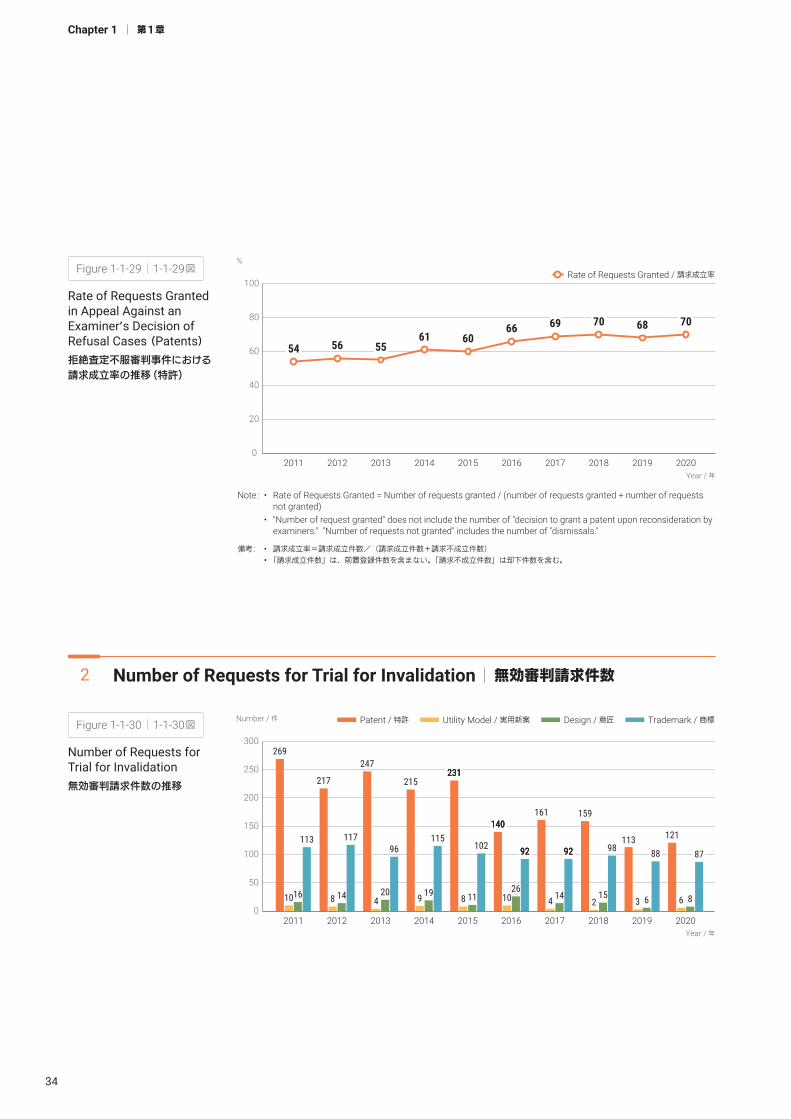
Number of Requests for Trial for Invalidation 無効審判請求件数2
Number of Requests for Trial for Invalidation無効審判請求件数の推移
Figure 1-1-30 1-1-30図 Patent / 特許 Utility Model / 実用新案 Design / 意匠 Trademark / 商標Number / 件
300
250
200
150
100
50
0201920182017201620152014201320122011
88
63
113
2020
92929292
2610
140140140140
SR2021-1-1-30
1 2 3 4 5
7,608
92929292
144
161
98
152
159
96
204
247
113
269
1610 14
117
217
8
102
118
231231231231
115
199
215
Year / 年
8787
86
121
Note: • Rate of Requests Granted = Number of requests granted / (number of requests granted + number of requests not granted)
• "Number of request granted" does not include the number of "decision to grant a patent upon reconsideration by examiners." "Number of requests not granted" includes the number of "dismissals."
備考 : • 請求成立率=請求成立件数/(請求成立件数+請求不成立件数)• 「請求成立件数」は、前置登録件数を含まない。「請求不成立件数」は却下件数を含む。
Rate of Requests Granted in Appeal Against an Examiner’s Decision of Refusal Cases (Patents) 拒絶査定不服審判事件における請求成立率の推移(特許)
Figure 1-1-29 1-1-29図
SR2021-1-1-29
1 2 3 4 5
7,608
%
100
80
60
40
20
0 201920182017201620152014201320122011
Year / 年
68
2020
7069 70666061
555654
Rate of Requests Granted / 請求成立率
34
Chapter 1 第1章

Number of Requests for Trial for Rescission 取消審判請求件数4
Number of Requests for Trial for Rescission of Registration of Trademark取消審判(商標)請求件数の 推移
Figure 1-1-32 1-1-32図
0
1,600
1,200
1,400
800
1,000
200
400
600
Number / 件
20182017201620152014201320122011Year / 年
1,1931,050
1,1901,099
973 958 1,001 1,045
SR2021-1-1-32
1 2 3 4 5
7,608
2019
996
2020
1,011
Number of Requests for Trial for Correction 訂正審判請求件数3
Note: • The number of requests for a trial for correction is the total number of requests for both patents and former utility models (i.e., utility models filed prior to the enforcement date of the 1993 amendment of the Utility Model Act of Japan).
• No request for trial for correction has been filed for former utility models since 2013.
備考 : • 訂正審判請求件数は、特許及び旧実用新案(平成5年改正実用新案法の施行日前(1993年以前)に出願された実用新案)の合計。• 旧実用新案については、2013年以降請求されていない状況。
Number of Requests for Trial for Correction訂正審判請求件数の推移
Figure 1-1-31 1-1-31図
SR2021-1-1-31
1 2 3 4 5
7,608
0
250
200
150
50
100
Number / 件
20182017201620152014201320122011
147
179
238210
151163 160
203
2019
129
2020
120
Year / 年
JPO STATUS REPORT 2021 35
Part1-Chapter1 Trends in Intellectual Property in Japan 第1部
第1章 我が国の知財動向
1
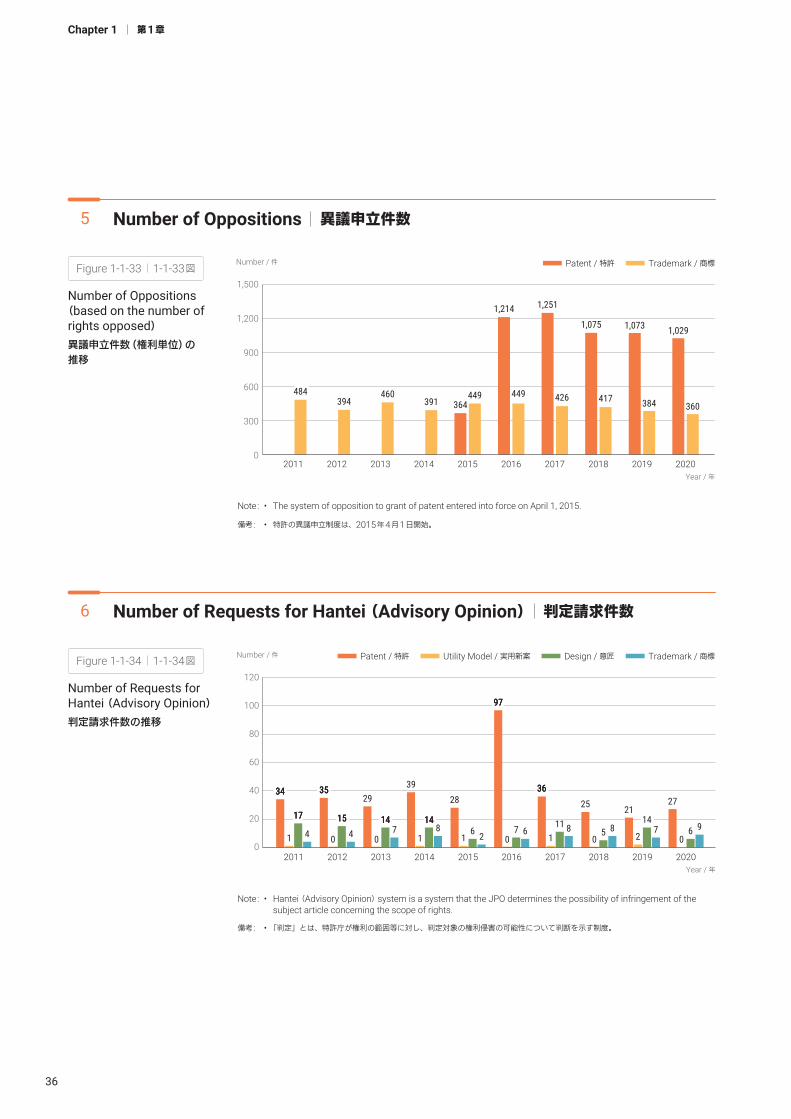
Number of Requests for Hantei (Advisory Opinion) 判定請求件数6
Note: • Hantei (Advisory Opinion) system is a system that the JPO determines the possibility of infringement of the subject article concerning the scope of rights.
備考 : • 「判定」とは、特許庁が権利の範囲等に対し、判定対象の権利侵害の可能性について判断を示す制度。
Number of Requests for Hantei (Advisory Opinion)判定請求件数の推移
Figure 1-1-34 1-1-34図
SR2021-1-1-34
1 2 3 4 5
7,608
Patent / 特許 Utility Model / 実用新案 Design / 意匠 Trademark / 商標Number / 件
120
100
80
60
40
20
0201920182017201620152014201320122011
714
2
21
2020
960
27
670
97979797
8111
36363636
850
25
714141414
0
29
4
34343434
17171717
1
15151515
4
35353535
0 261
28
814141414
1
39
Year / 年
Number of Oppositions 異議申立件数5
Number of Oppositions (based on the number of rights opposed)異議申立件数(権利単位)の 推移
Figure 1-1-33 1-1-33図
SR2021-1-1-33
1 2 3 4 5
7,608
Patent / 特許 Trademark / 商標Number / 件
1,500
1,200
900
600
300
0201920182017201620152014201320122011
Year / 年
384417
1,073
2020
360
1,0291,075
426
1,251
449449391
460394
484
1,214
364
Note: • The system of opposition to grant of patent entered into force on April 1, 2015.
備考 : • 特許の異議申立制度は、2015年4月1日開始。
36
Chapter 1 第1章

Number of Court Decisions 判決件数8
Number of Revocation Actions against Trial/Appeal Decisions 出訴件数7
Note: • The numbers in parentheses are for 2019. 1 This includes appeals against examiner’s decision of refusal, and appeals against examiner's decision to
dismiss amendments. 2 This includes trials for invalidation, trials for rescission, and trials for correction.
備考 : • 表中括弧内は、2019年の件数。1 拒絶査定不服審判、補正却下不服審判
2 無効審判、取消審判、訂正審判
Number of Court Decisions in Revocation Actions against Trial/Appeal Decisions in 20202020年における 審決取消訴訟判決件数
Figure 1-1-36 1-1-36図
Number of Revocation Actions against Trial/Appeal Decisions in 20202020年における 審決取消訴訟出訴件数
Figure 1-1-35 1-1-35図
15(23) 9(5)
51(47) 13(19)
2(1) 7(3)
0(4) 0(0)
0(2) 0(0)
-
17(4) 2(1)
10(18) 4(10)
0(0) 0(0)
1-1-36
Ex-parte appeal1査定系審判1
Inter-partes trial2当事者系審判2
Opposition異議申立
Dismissal ofAction請求棄却
Patent and Utility Model特許・実用新案
Revocation ofDecision審決取消
Dismissal ofAction請求棄却
Design意匠
Revocation ofDecision審決取消
Dismissal ofAction請求棄却
Trademark商標
Revocation ofDecision審決取消
26(30)
63(83)
8(8)
1(1)
0(0)
-
16(19)
37(32)
1(1)
Ex-parte appeal1査定系審判1
Trademark商標
Design意匠
Inter-partes trial2当事者系審判2
Opposition異議申立
Patent and Utility Model特許・実用新案
1-1-35
Note: • The numbers in parentheses are for 2019. 1 This includes appeals against examiner’s decision of refusal, and appeals against examiner's decision to
dismiss amendments. 2 This includes trials for invalidation, trials for rescission, and trials for correction.
備考 : • 表中括弧内は、2019年の件数。1 拒絶査定不服審判、補正却下不服審判
2 無効審判、取消審判、訂正審判
JPO STATUS REPORT 2021 37
Part1-Chapter1 Trends in Intellectual Property in Japan 第1部
第1章 我が国の知財動向
1