Embed Size (px)
Citation preview
CHAPTER
What isphonology?
1
This chapter introduces phonology, the study of the soundsystems of language. Its key objective is to:◆ introduce the notion of phonological rule◆ explain the nature of sound as a physical phenomenon◆ highlight the tradeoff between accuracy and usefulness
in representing sound◆ distinguish between phonetics and phonology◆ contrast the continuous and discrete aspects of linguistic
sounds◆ introduce the notion of “sound as cognitive symbol”
PREVIEW
sound
symbol
transcription
grammar
continuousnature ofspeech
accuracy
KEY TERMS
www.cambridge.org© Cambridge University Press
Cambridge University Press0521826691 - Introducing PhonologyDavid OddenExcerptMore information
2 INTRODUCING PHONOLOGY
Phonology is one of the core fields that composes the discipline of lin-guistics, which is defined as the scientific study of language structure.One way to understand what the subject matter of phonology is, is to con-trast it with other fields within linguistics. A very brief explanation isthat phonology is the study of sound structure in language, which is dif-ferent from the study of sentence structure (syntax) or word structure(morphology), or how languages change over time (historical linguistics).This definition is very simple, and also inadequate. An important featureof the structure of a sentence is how it is pronounced – its sound struc-ture. The pronunciation of a given word is also a fundamental part of thestructure of the word. And certainly the principles of pronunciation in alanguage are subject to change over time. So the study of phonology even-tually touches on other domains of linguistics.
An important question is how phonology differs from the closelyrelated discipline of phonetics. Making a principled separation betweenphonetics and phonology is difficult – just as it is difficult to make aprincipled separation between physics and chemistry, or sociology andanthropology. A common characterization of the difference between pho-netics and phonology is that phonetics deals with “actual” physicalsounds as they are manifested in human speech, and concentrates onacoustic waveforms, formant values, measurements of duration meas-ured in milliseconds, of amplitude and frequency, or in the physical prin-ciples underlying the production of sounds, which involves the study ofresonances and the study of the muscles and other articulatory struc-tures used to produce physical sounds. On the other hand, phonology, itis said, is an abstract cognitive system dealing with rules in a mentalgrammar: principles of subconscious “thought” as they relate to lan-guage sound. Yet once we look into the central questions of phonology ingreater depth, we will find that the boundaries between the disciplinesof phonetics and phonology are not entirely clear-cut. As research in bothof these fields has progressed, it has become apparent that a betterunderstanding of many issues in phonology requires that you bring pho-netics into consideration, just as a phonological analysis is a prerequisitefor any phonetic study of language.
As a step towards understanding what phonology is, and especially how itdiffers from phonetics, we will consider some specific aspects of soundstructure that would be part of a phonological analysis. The point whichis most important to appreciate at this moment is that the “sounds”which phonology is concerned with are symbolic sounds – they are cog-nitive abstractions, which represent but are not the same as physicalsounds.
The sounds of a language. One aspect of phonology considers what the“sounds” of a language are. We would want to take note in a description
1.1 Concerns of phonology
www.cambridge.org© Cambridge University Press
Cambridge University Press0521826691 - Introducing PhonologyDavid OddenExcerptMore information
of the phonology of English that we lack a particular vowel that exists inGerman in words like schön ‘beautiful,’ a vowel which is also found inFrench (spelled eu, as in jeune ‘young’), or Norwegian (øl ‘beer’). Similarly,the consonant spelled th in English thing, path does exist in English (aswell as in Icelandic where it is spelled with the letter þ, or Modern Greekwhere it is spelled with �, or Saami where it is spelled t�), but this sounddoes not occur in German or French, and it is not used in Latin AmericanSpanish, although it does occur in Continental Spanish in words such ascerveza ‘beer,’ where by the spelling conventions of Spanish, the letters cand z represent the same sound as the one spelled � (in Greek) or th(in English).
Rules for combining sounds. Another aspect of language sound whicha phonological analysis would take account of is that in any given lan-guage, certain combinations of sounds are allowed, but other combina-tions are systematically impossible. The fact that English has the wordsbrick, break, bridge, bread is a clear indication that there is no restrictionagainst having words begin with the consonant sequence br; besides thesewords, one can think of many more words beginning with br such as bribe,brow and so on. Similarly, there are many words which begin with bl, suchas blue, blatant, blast, blend, blink, showing that there is no rule againstwords beginning with bl. It is also a fact that there is no word �blick1 inEnglish, even though the similar words blink, brick do exist. The questionis, why is there no word �blick in English? The best explanation for thenonexistence of this word is simply that it is an accidental gap – not everylogically possible combination of sounds which follows the rules ofEnglish phonology is found as an actual word of the language.
Native speakers of English have the intuition that while blick is not actu-ally a word of English, it is a theoretically possible word of English, andsuch a word might easily enter the language, for example via the intro-duction of a new brand of detergent. Fifty years ago the English languagedid not have any word pronounced bick, but based on the existence ofwords like big and pick, that word would certainly have been included inthe set of nonexistent but theoretically allowed words of English.Contemporary English, of course, actually does contain that word –spelled Bic – which is a type of pen.
While the nonexistence of blick in English is accidental, the exclusionfrom English of many other imaginable but nonexistent words is based ona principled restriction of the language. While there are words that beginwith sn like snake, snip and snort, there are no words beginning with bn,and thus �bnick, �bnark, �bniddle are not words of English. There simply areno words in English which begin with bn. Moreover, native speakers ofEnglish have a clear intuition that hypothetical �bnick, �bnark, �bniddlecould not be words of English. Similarly, there are no words in Englishwhich are pronounced with pn at the beginning, a fact which is not onlydemonstrated by the systematic lack of words such as �pnark, �pnig, �pnilge,
What is phonology? 3
1 The asterisk is used to indicate that a given word is non-existent or wrong.
www.cambridge.org© Cambridge University Press
Cambridge University Press0521826691 - Introducing PhonologyDavid OddenExcerptMore information
but also by the fact that the word spelled pneumonia which derives fromAncient Greek (a language which does allow such consonant combina-tions) is pronounced without p. A description of the phonology of Englishwould then provide a basis for characterizing such restrictions onsequences of sounds.
Variations in pronunciation. In addition to providing an account of pos-sible versus impossible words in a language, a phonological analysis willexplain other general patterns in the pronunciation of words. For exam-ple, there is a very general rule of English phonology which dictates thatthe plural suffix on nouns will be pronounced as [�z], represented inspelling as es, when the preceding consonant is one of a certain set ofconsonants including [�] (spelled sh) as in bushes, [�] (spelled as ch) as inchurches, and [ j�] (spelled j, ge, dge) as in cages, bridges. This pattern of pro-nunciation is not limited to the plural, so despite the difference inspelling, the possessive suffix s2 is also subject to the same rules of pro-nunciation: thus, plural bushes is pronounced the same as the possessivebush’s, and plural churches is pronounced the same as possessive church’s.
This is the sense in which phonology is about the sounds of language.From the phonological perspective, a “sound” is a specific unit which com-bines with other such specific units, and which represent physical sounds.
Phonetics, on the other hand, is about the concrete, instrumentally meas-urable physical properties and production of these cognitive speechsounds. That being the case, we must ask a very basic question about pho-netics (one which we also raise about phonology). Given that phoneticsand phonology both study “sound” in language, what are sounds, and howdoes one represent the sounds of languages? The question of the physicalreality of an object, and how to represent the object, is central in anyscience. If we have no understanding of the physical reality, we have noway of talking meaningfully about it. Before deciding how to represent asound, we need to first consider what a sound is. To answer this question,we will look at two basic aspects of speech sounds as they are studied inphonetics, namely acoustics which is the study of the properties of thephysical sound wave that we hear, and articulation, which is the study ofhow to modify the shape of the vocal tract, thereby producing a certainacoustic output (sound).
1.2.1 AcousticsA “sound” is a complex pattern of rapid variations in air pressure, travel-ing from a sound source and striking the ear, which causes a series ofneural signals to be received in the brain: this is true of speech, music andrandom noises.
1.2 Phonetics – what is physical sound?
4 INTRODUCING PHONOLOGY
2 This is the “apostrophe s” suffix found in The child’s shoe, meaning ‘the shoe owned by the child.’
www.cambridge.org© Cambridge University Press
Cambridge University Press0521826691 - Introducing PhonologyDavid OddenExcerptMore information
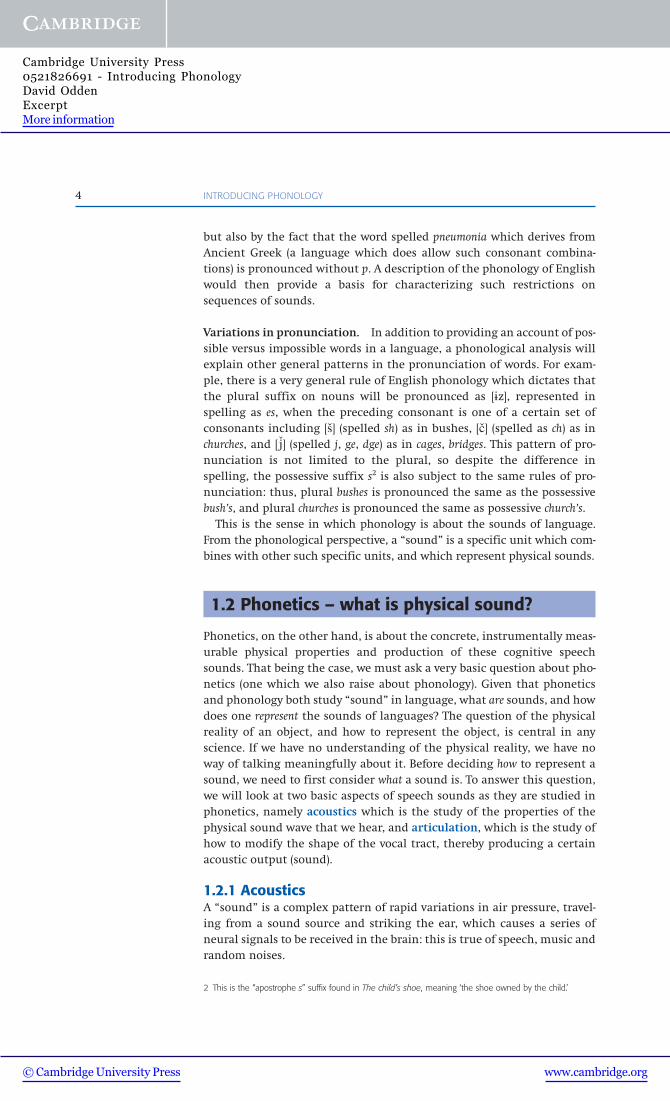
The horizontal axis represents time, with the beginning of each word at theleft and the end of the word at the right. The vertical axis representsdisplacement of air particles and correlates with the variations in atmos-pheric pressure that affect the ear. Positions with little variation from thevertical center of the graph represent smaller displacements of air particles,such as the portion that almost seems to be a straight horizontal line at theright side of each graph. Such minimal displacements from the center cor-respond to lower amplitude sounds. The portion in the middle where thereis much greater vertical movement in the graph indicates that the sound atthat point in time has higher amplitude. While such a direct representationof sounds is extremely accurate, it is also fairly uninformative.
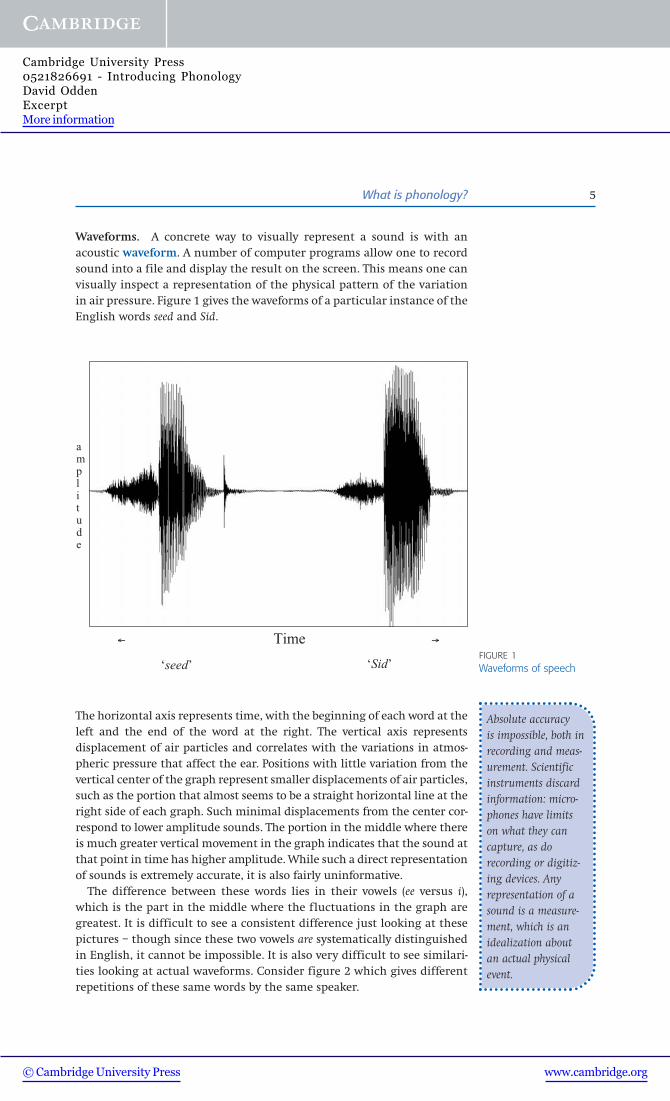
The difference between these words lies in their vowels (ee versus i),which is the part in the middle where the fluctuations in the graph aregreatest. It is difficult to see a consistent difference just looking at thesepictures – though since these two vowels are systematically distinguishedin English, it cannot be impossible. It is also very difficult to see similari-ties looking at actual waveforms. Consider figure 2 which gives differentrepetitions of these same words by the same speaker.
Waveforms. A concrete way to visually represent a sound is with anacoustic waveform. A number of computer programs allow one to recordsound into a file and display the result on the screen. This means one canvisually inspect a representation of the physical pattern of the variationin air pressure. Figure 1 gives the waveforms of a particular instance of theEnglish words seed and Sid.
What is phonology? 5
FIGURE 1Waveforms of speech‘seed’ ‘Sid’
Time
amplitude
Absolute accuracyis impossible, both inrecording and meas-urement. Scientificinstruments discardinformation: micro-phones have limitson what they cancapture, as dorecording or digitiz-ing devices. Anyrepresentation of asound is a measure-ment, which is anidealization aboutan actual physicalevent.
www.cambridge.org© Cambridge University Press
Cambridge University Press0521826691 - Introducing PhonologyDavid OddenExcerptMore information
6 INTRODUCING PHONOLOGY
Visual inspection gives you no reason to think that these sets of graphs arethe same words said on different occasions. The problem is that while aphysical waveform is a very accurate representation of a word, it providesso much information that we cannot tell what is important and whatis not.
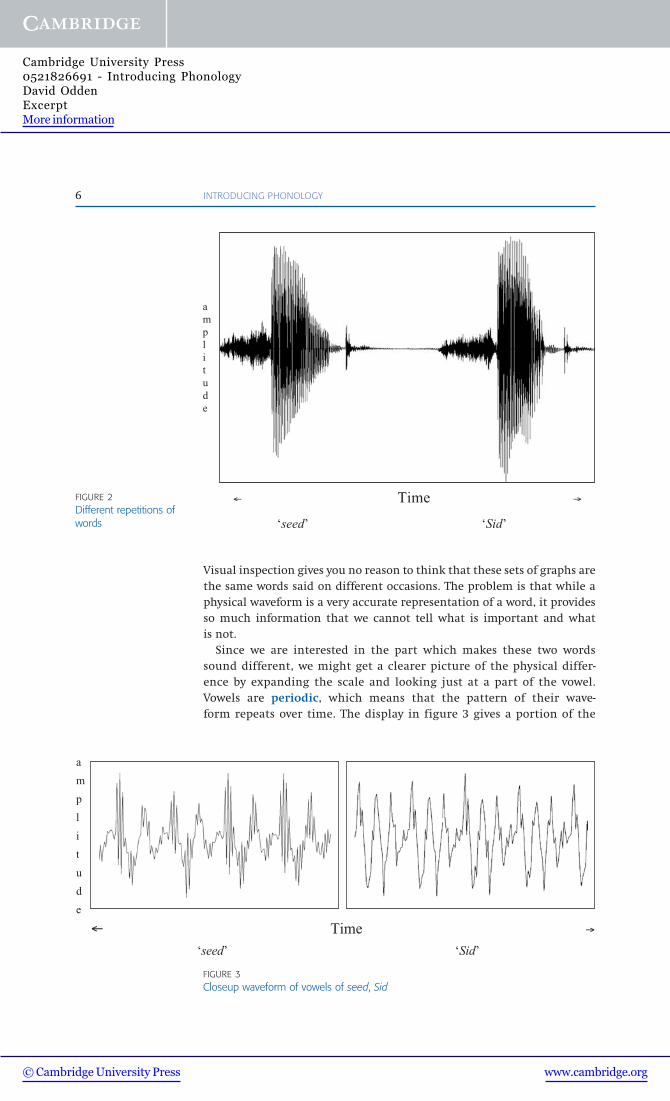
Since we are interested in the part which makes these two wordssound different, we might get a clearer picture of the physical differ-ence by expanding the scale and looking just at a part of the vowel.Vowels are periodic, which means that the pattern of their wave-form repeats over time. The display in figure 3 gives a portion of the
FIGURE 2Different repetitions ofwords
FIGURE 3Closeup waveform of vowels of seed, Sid
ampl i t ude
‘seed’ ‘Sid’
Time
a
m
p
l
i
t
u
d
e
Time
‘seed’ ‘Sid’
www.cambridge.org© Cambridge University Press
Cambridge University Press0521826691 - Introducing PhonologyDavid OddenExcerptMore information
vowels from the middle of the words seed and Sid, involving around30 milliseconds (ms) of each of the words (the entire word in each ofthese two examples actually lasts approximately 600 ms, so this is asmall part of the entire word). We can indeed see that there is a pat-tern which is repeated (although successive repetitions are not perfectreproductions).
Though there are visible differences between the waveforms, the basisfor distinguishing these vowels remains unclear.
Sound spectra. We need a better analytical technique than just lookingat raw sound, to be able to talk precisely about properties of these sounds.We therefore need to understand some basic properties of physicalsounds. All sound waves are definable in terms of three properties thatcharacterize a sine wave familiar from trigonometry, namely frequencymeasured in cycles per second also known as Hertz (Hz), amplitude meas-ured in decibels (dB), and phase measured in the angular measure radi-ans. These characteristics suffice to define any sine wave, which is the ana-lytic basis of sounds. The property phase, which describes how far into theinfinite cycle of repetition a particular sine wave is, turns out to be unim-portant for the study of speech sounds, so it can be ignored. Simple sinewaves (termed “pure tones” when speaking of sounds) made up of a singlefrequency are not commonly encountered in the real world, but can becreated by a tuning fork or by electronic equipment.
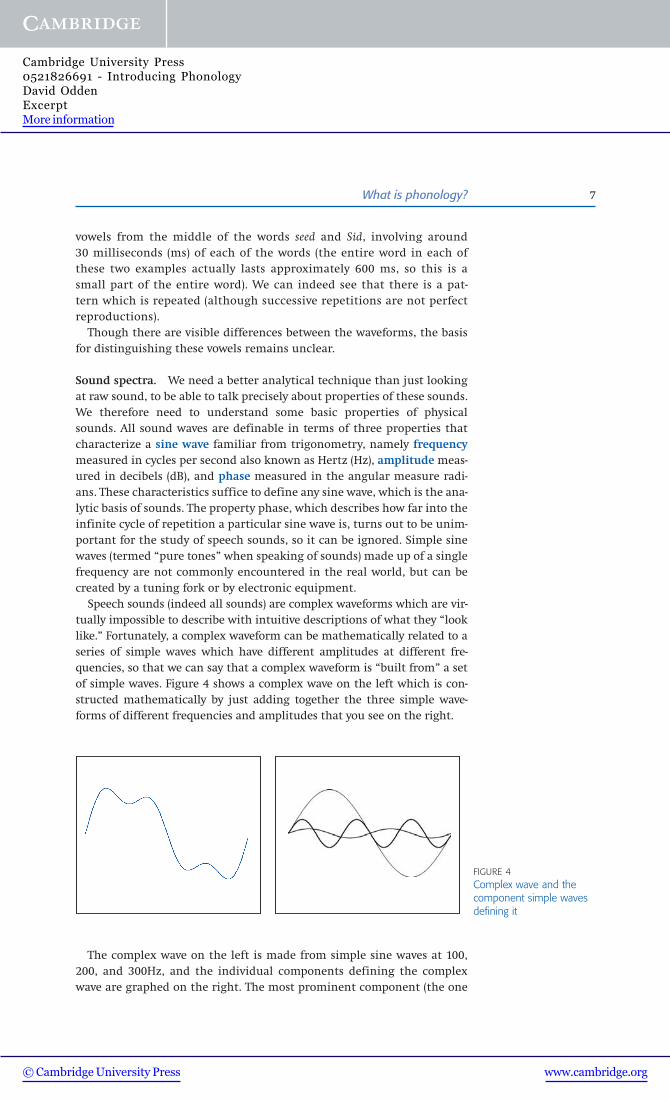
Speech sounds (indeed all sounds) are complex waveforms which are vir-tually impossible to describe with intuitive descriptions of what they “looklike.” Fortunately, a complex waveform can be mathematically related to aseries of simple waves which have different amplitudes at different fre-quencies, so that we can say that a complex waveform is “built from” a setof simple waves. Figure 4 shows a complex wave on the left which is con-structed mathematically by just adding together the three simple wave-forms of different frequencies and amplitudes that you see on the right.
What is phonology? 7
FIGURE 4Complex wave and thecomponent simple wavesdefining it
The complex wave on the left is made from simple sine waves at 100,200, and 300Hz, and the individual components defining the complexwave are graphed on the right. The most prominent component (the one
www.cambridge.org© Cambridge University Press
Cambridge University Press0521826691 - Introducing PhonologyDavid OddenExcerptMore information
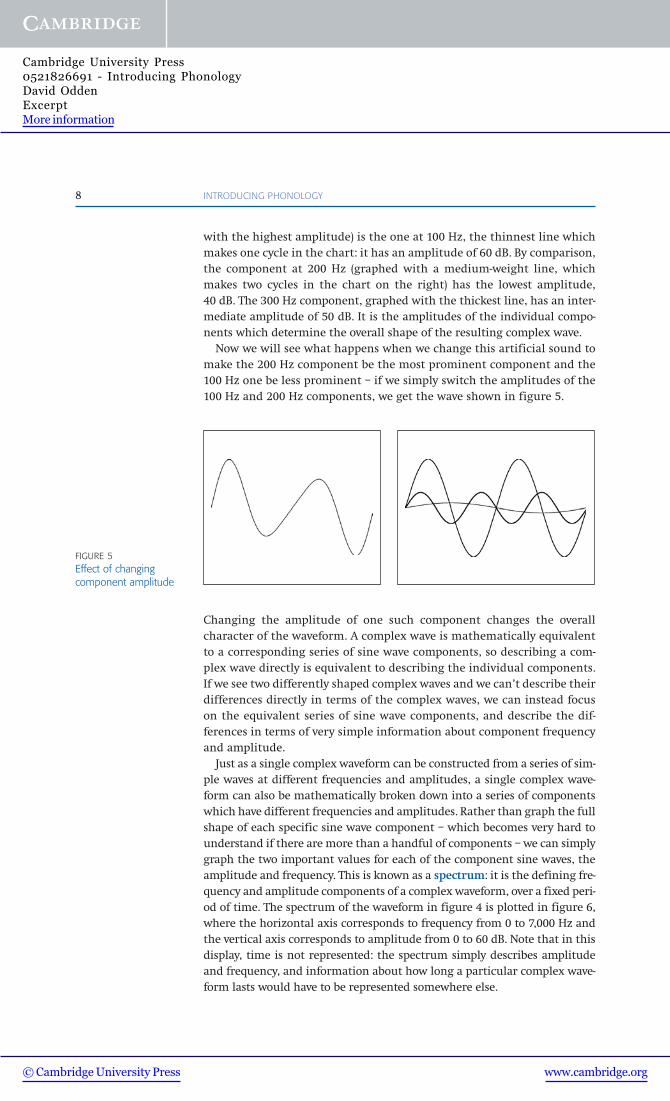
Changing the amplitude of one such component changes the overallcharacter of the waveform. A complex wave is mathematically equivalentto a corresponding series of sine wave components, so describing a com-plex wave directly is equivalent to describing the individual components.If we see two differently shaped complex waves and we can’t describe theirdifferences directly in terms of the complex waves, we can instead focuson the equivalent series of sine wave components, and describe the dif-ferences in terms of very simple information about component frequencyand amplitude.
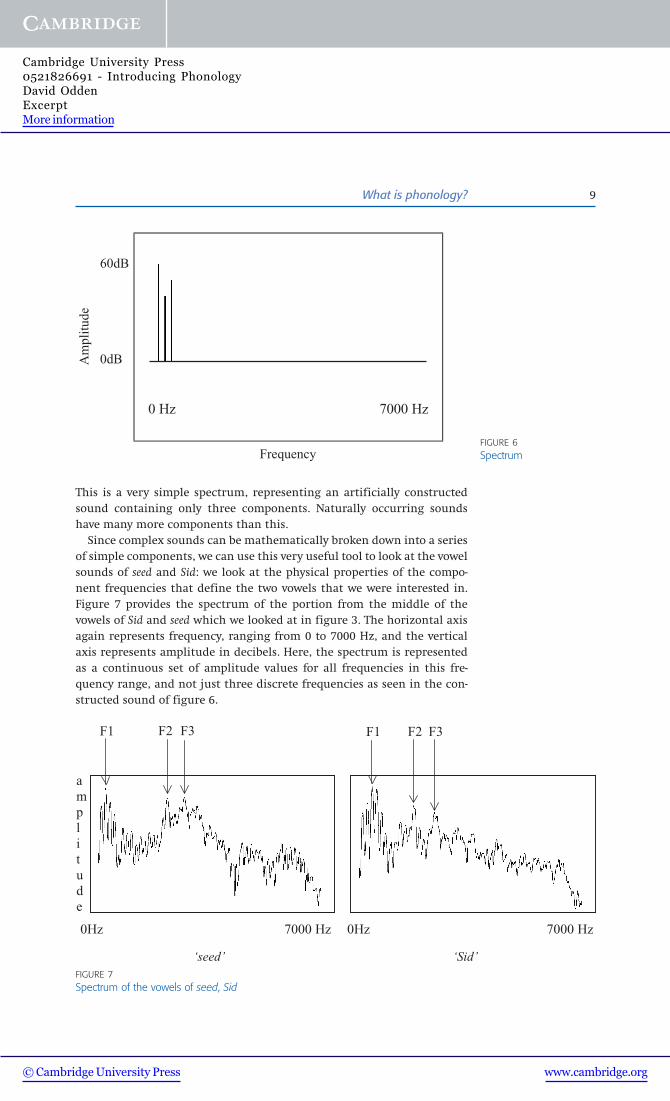
Just as a single complex waveform can be constructed from a series of sim-ple waves at different frequencies and amplitudes, a single complex wave-form can also be mathematically broken down into a series of componentswhich have different frequencies and amplitudes. Rather than graph the fullshape of each specific sine wave component – which becomes very hard tounderstand if there are more than a handful of components – we can simplygraph the two important values for each of the component sine waves, theamplitude and frequency. This is known as a spectrum: it is the defining fre-quency and amplitude components of a complex waveform, over a fixed peri-od of time. The spectrum of the waveform in figure 4 is plotted in figure 6,where the horizontal axis corresponds to frequency from 0 to 7,000 Hz andthe vertical axis corresponds to amplitude from 0 to 60 dB. Note that in thisdisplay, time is not represented: the spectrum simply describes amplitudeand frequency, and information about how long a particular complex wave-form lasts would have to be represented somewhere else.
8 INTRODUCING PHONOLOGY
with the highest amplitude) is the one at 100 Hz, the thinnest line whichmakes one cycle in the chart: it has an amplitude of 60 dB. By comparison,the component at 200 Hz (graphed with a medium-weight line, whichmakes two cycles in the chart on the right) has the lowest amplitude,40 dB. The 300 Hz component, graphed with the thickest line, has an inter-mediate amplitude of 50 dB. It is the amplitudes of the individual compo-nents which determine the overall shape of the resulting complex wave.
Now we will see what happens when we change this artificial sound tomake the 200 Hz component be the most prominent component and the100 Hz one be less prominent – if we simply switch the amplitudes of the100 Hz and 200 Hz components, we get the wave shown in figure 5.
FIGURE 5Effect of changing component amplitude
www.cambridge.org© Cambridge University Press
Cambridge University Press0521826691 - Introducing PhonologyDavid OddenExcerptMore information
What is phonology? 9
This is a very simple spectrum, representing an artificially constructedsound containing only three components. Naturally occurring soundshave many more components than this.
Since complex sounds can be mathematically broken down into a seriesof simple components, we can use this very useful tool to look at the vowelsounds of seed and Sid: we look at the physical properties of the compo-nent frequencies that define the two vowels that we were interested in.Figure 7 provides the spectrum of the portion from the middle of thevowels of Sid and seed which we looked at in figure 3. The horizontal axisagain represents frequency, ranging from 0 to 7000 Hz, and the verticalaxis represents amplitude in decibels. Here, the spectrum is representedas a continuous set of amplitude values for all frequencies in this fre-quency range, and not just three discrete frequencies as seen in the con-structed sound of figure 6.
0 Hz 7000 Hz
60dB
0dB
Frequency
Am
plit
ude
FIGURE 6Spectrum
FIGURE 7Spectrum of the vowels of seed, Sid
amplitude
F2 F2F3 F3 F1 F1
‘seed’
0Hz 7000 Hz
‘Sid’ 0Hz 7000 Hz
www.cambridge.org© Cambridge University Press
Cambridge University Press0521826691 - Introducing PhonologyDavid OddenExcerptMore information
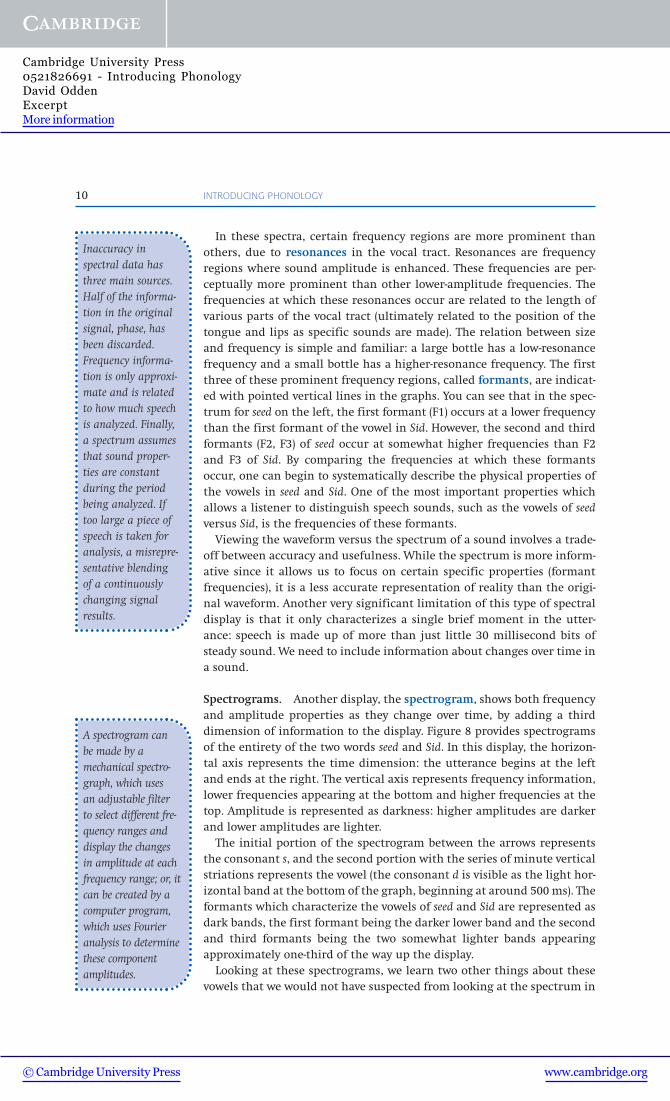
In these spectra, certain frequency regions are more prominent thanothers, due to resonances in the vocal tract. Resonances are frequencyregions where sound amplitude is enhanced. These frequencies are per-ceptually more prominent than other lower-amplitude frequencies. Thefrequencies at which these resonances occur are related to the length ofvarious parts of the vocal tract (ultimately related to the position of thetongue and lips as specific sounds are made). The relation between sizeand frequency is simple and familiar: a large bottle has a low-resonancefrequency and a small bottle has a higher-resonance frequency. The firstthree of these prominent frequency regions, called formants, are indicat-ed with pointed vertical lines in the graphs. You can see that in the spec-trum for seed on the left, the first formant (F1) occurs at a lower frequencythan the first formant of the vowel in Sid. However, the second and thirdformants (F2, F3) of seed occur at somewhat higher frequencies than F2and F3 of Sid. By comparing the frequencies at which these formantsoccur, one can begin to systematically describe the physical properties ofthe vowels in seed and Sid. One of the most important properties whichallows a listener to distinguish speech sounds, such as the vowels of seedversus Sid, is the frequencies of these formants.
Viewing the waveform versus the spectrum of a sound involves a trade-off between accuracy and usefulness. While the spectrum is more inform-ative since it allows us to focus on certain specific properties (formantfrequencies), it is a less accurate representation of reality than the origi-nal waveform. Another very significant limitation of this type of spectraldisplay is that it only characterizes a single brief moment in the utter-ance: speech is made up of more than just little 30 millisecond bits ofsteady sound. We need to include information about changes over time ina sound.
Spectrograms. Another display, the spectrogram, shows both frequencyand amplitude properties as they change over time, by adding a thirddimension of information to the display. Figure 8 provides spectrogramsof the entirety of the two words seed and Sid. In this display, the horizon-tal axis represents the time dimension: the utterance begins at the leftand ends at the right. The vertical axis represents frequency information,lower frequencies appearing at the bottom and higher frequencies at thetop. Amplitude is represented as darkness: higher amplitudes are darkerand lower amplitudes are lighter.
The initial portion of the spectrogram between the arrows representsthe consonant s, and the second portion with the series of minute verticalstriations represents the vowel (the consonant d is visible as the light hor-izontal band at the bottom of the graph, beginning at around 500 ms). Theformants which characterize the vowels of seed and Sid are represented asdark bands, the first formant being the darker lower band and the secondand third formants being the two somewhat lighter bands appearingapproximately one-third of the way up the display.
Looking at these spectrograms, we learn two other things about thesevowels that we would not have suspected from looking at the spectrum in
10 INTRODUCING PHONOLOGY
Inaccuracy in spectral data hasthree main sources.Half of the informa-tion in the originalsignal, phase, hasbeen discarded.Frequency informa-tion is only approxi-mate and is relatedto how much speechis analyzed. Finally,a spectrum assumesthat sound proper-ties are constantduring the periodbeing analyzed. Iftoo large a piece ofspeech is taken foranalysis, a misrepre-sentative blendingof a continuouslychanging signalresults.
A spectrogram can be made by amechanical spectro-graph, which usesan adjustable filterto select different fre-quency ranges anddisplay the changesin amplitude at eachfrequency range; or, itcan be created by acomputer program,which uses Fourieranalysis to determinethese componentamplitudes.
www.cambridge.org© Cambridge University Press
Cambridge University Press0521826691 - Introducing PhonologyDavid OddenExcerptMore information