Embed Size (px)
DESCRIPTION
CHAPTER 10. Projects. Learning Objectives. Explain what project management is and why it is important. Identify the different ways projects can be structured. Describe how projects are organized into major subprojects. Understand what a project milestone is. - PowerPoint PPT Presentation
Citation preview
Projects
CH
AP
TE
R 1
0C
HA
PT
ER
10
Learning Objectives
1. Explain what project management is and why it is important.
2. Identify the different ways projects can be structured.
3. Describe how projects are organized into major subprojects.
4. Understand what a project milestone is.
5. Determine the “critical path” for a project.
6. Demonstrate how to “crash,” or reduce the length, of a project.
Project is a series of related jobs usually directed toward some major output and requiring a significant period of time to perform
Project Management are the management activities of planning, directing, and controlling resources (people, equipment, material) to meet the technical, cost, and time constraints of a project
Project Management Defined
Work Breakdown Structure
Statement of work (SOW): a written description of the objectives to be achieved
Task: a further subdivision of a project Usually shorter than several months Performed by one group or organization
Work package: a group of activities combined to be assignable to a single organizational unit
LO 3LO 3
Work Breakdown Structure Continued
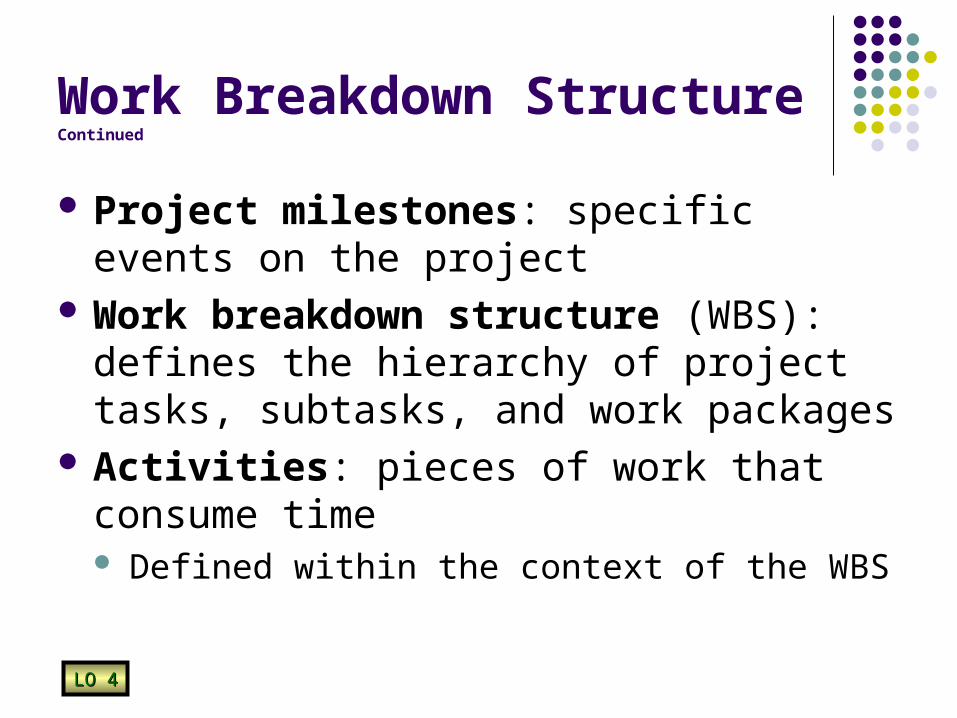
Project milestones: specific events on the project
Work breakdown structure (WBS): defines the hierarchy of project tasks, subtasks, and work packages
Activities: pieces of work that consume time Defined within the context of the WBS
LO 4LO 4
Work Breakdown Structure
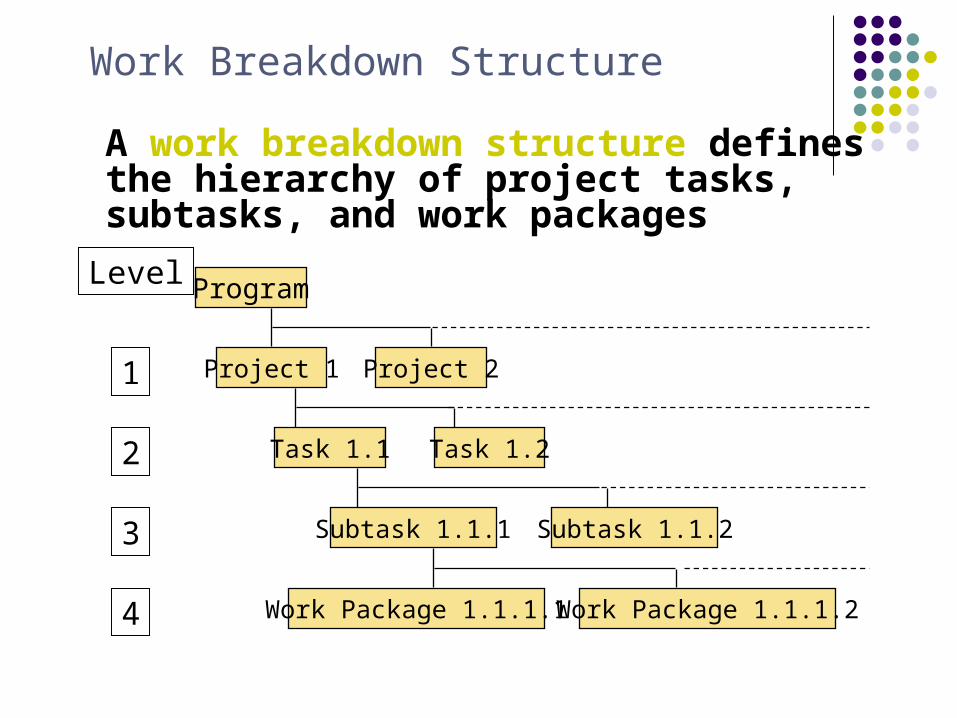
Program
Project 1 Project 2
Task 1.1
Subtask 1.1.1
Work Package 1.1.1.1
Level
1
2
3
4
Task 1.2
Subtask 1.1.2
Work Package 1.1.1.2
A work breakdown structure defines the hierarchy of project tasks, subtasks, and work packages
Project Control Charts
Charts are useful because their visual presentation is easily understood
Software is available to create the charts Gantt chart: a bar chart showing both the
amount of time involved and the sequence in which activities can be performed
LO 3LO 3
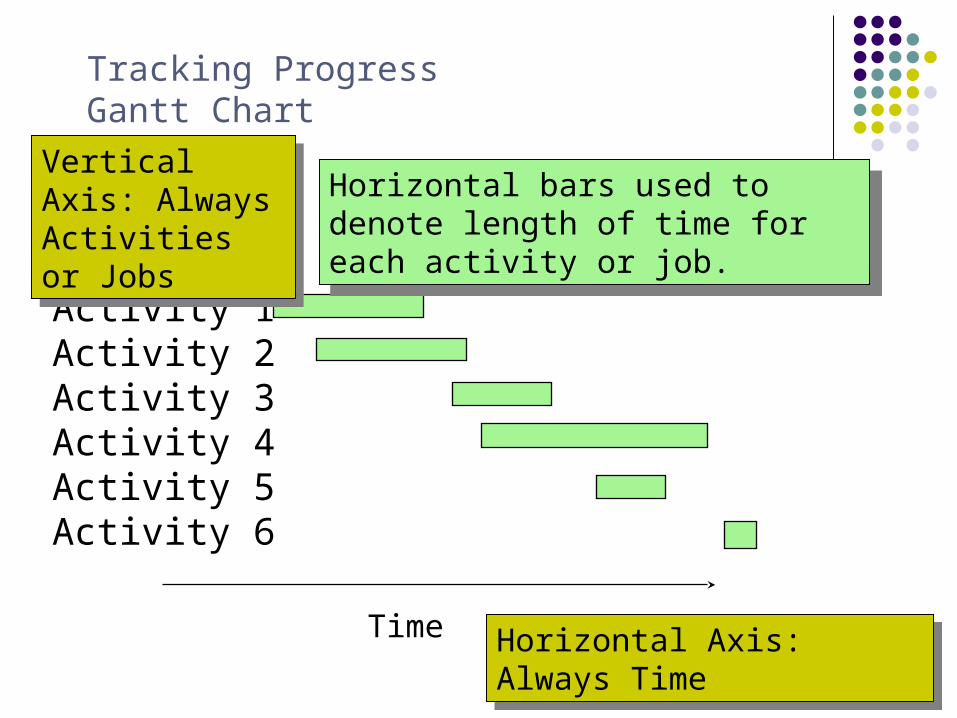
Tracking ProgressGantt Chart
Activity 1Activity 2Activity 3Activity 4Activity 5Activity 6
Time
Vertical Axis: Always Activities or Jobs
Vertical Axis: Always Activities or Jobs
Horizontal Axis: Always TimeHorizontal Axis: Always Time
Horizontal bars used to denote length of time for each activity or job.
Horizontal bars used to denote length of time for each activity or job.
Earned Value Management (EVM)
A technique for measuring project progress in an objective manner
Has the ability to combine measurements of scope, schedule, and cost in a project
Provides a method for evaluating the relative success of a project at a point in time
LO 3LO 3
Managing Resources
In addition to scheduling each task, must assign resources
Software can spot over-allocation Allocations exceed resources
Must either add resources or reschedule Moving a task within slack can free up resources
LO 1LO 1
Tracking Progress
Actual progress on a project will be different from the planned progress Planned progress is called the baseline
A tracking Gantt chart superimposes the current schedule onto a baseline so deviations are visible
Project manager can then manage the deviations
LO 1LO 1
Network-Planning Models
A project is made up of a sequence of activities that form a network representing a project
The path taking longest time through this network of activities is called the “critical path”
The critical path provides a wide range of scheduling information useful in managing a project
Critical Path Method (CPM) helps to identify the critical path(s) in the project networks
Prerequisites for Critical Path Methodology
A project must have:
well-defined jobs or tasks whose completion marks the end of the project;
independent jobs or tasks;
and tasks that follow a given sequence.
Critical Path Method
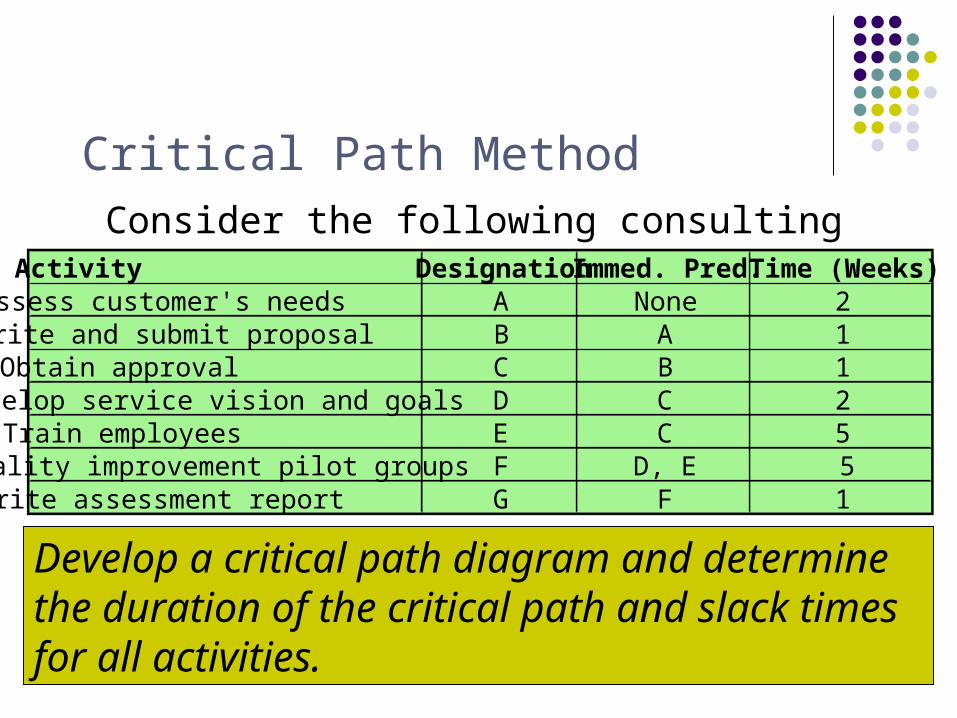
Consider the following consulting project:Activity Designation Immed. Pred. Time (Weeks)Assess customer's needs A None 2Write and submit proposal B A 1Obtain approval C B 1Develop service vision and goals D C 2Train employees E C 5Quality improvement pilot groups F D, E 5Write assessment report G F 1
Develop a critical path diagram and determine the duration of the critical path and slack times for all activities.
CPM with Three Activity Time Estimates
If a single time estimate is not reliable, then use three time estimates Minimum Maximum Most like
Allows us to obtain a probability estimate for completion time for the project
LO 5LO 5
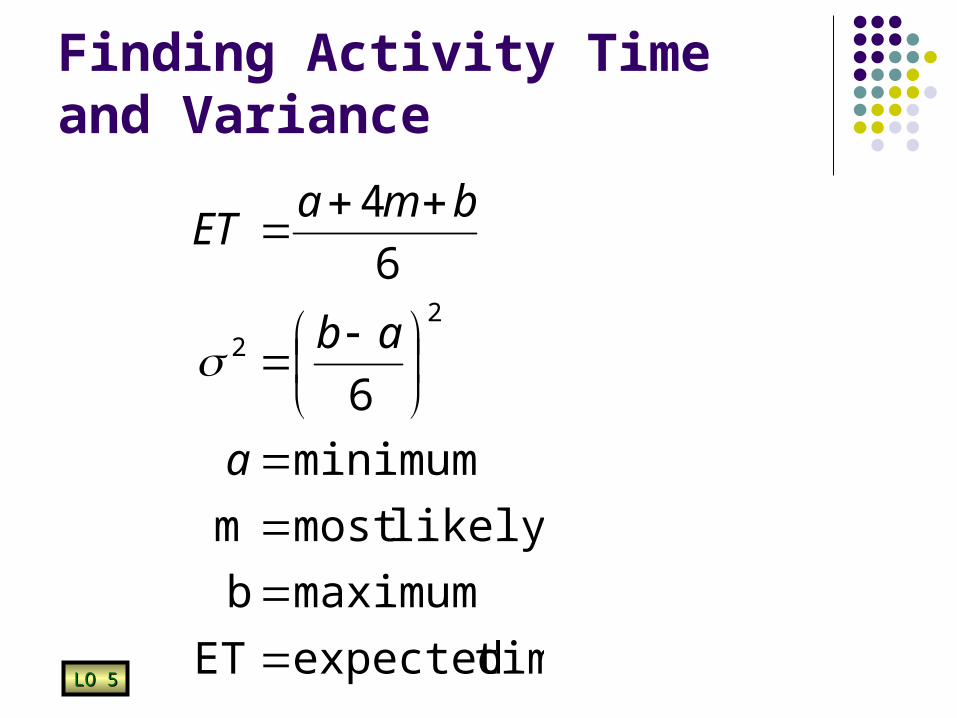
Finding Activity Time and Variance
timeexpectedET
maximumb
likelymost m
minimum
6
6
4
22
a
ab
bmaET
LO 5LO 5
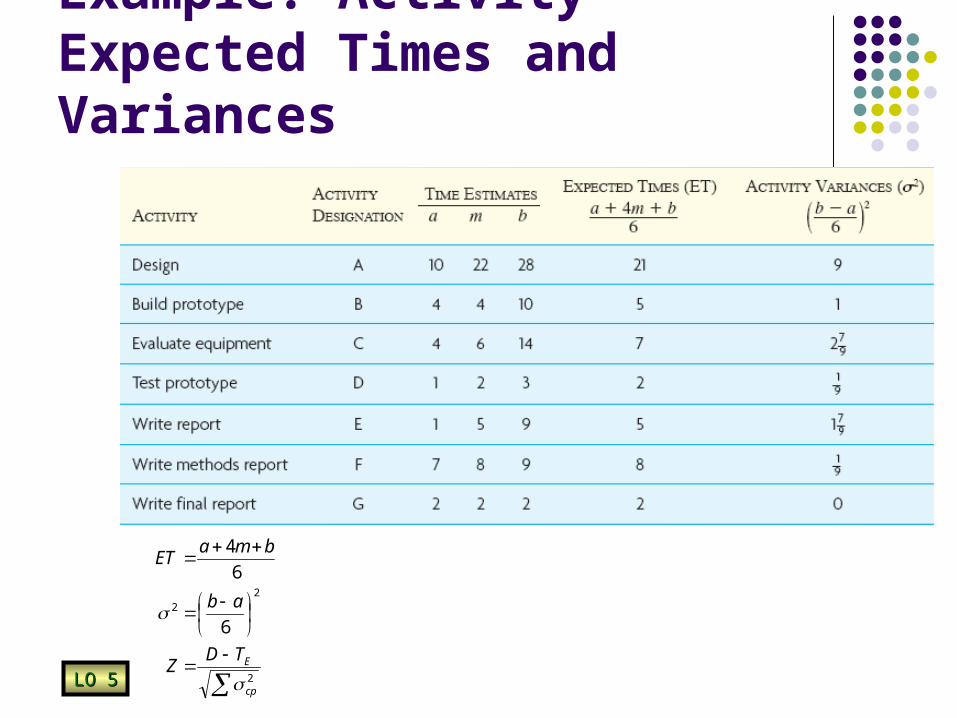
Example: Activity Expected Times and Variances
2
22
6
6
4
cp
ETDZ
ab
bmaET
LO 5LO 5
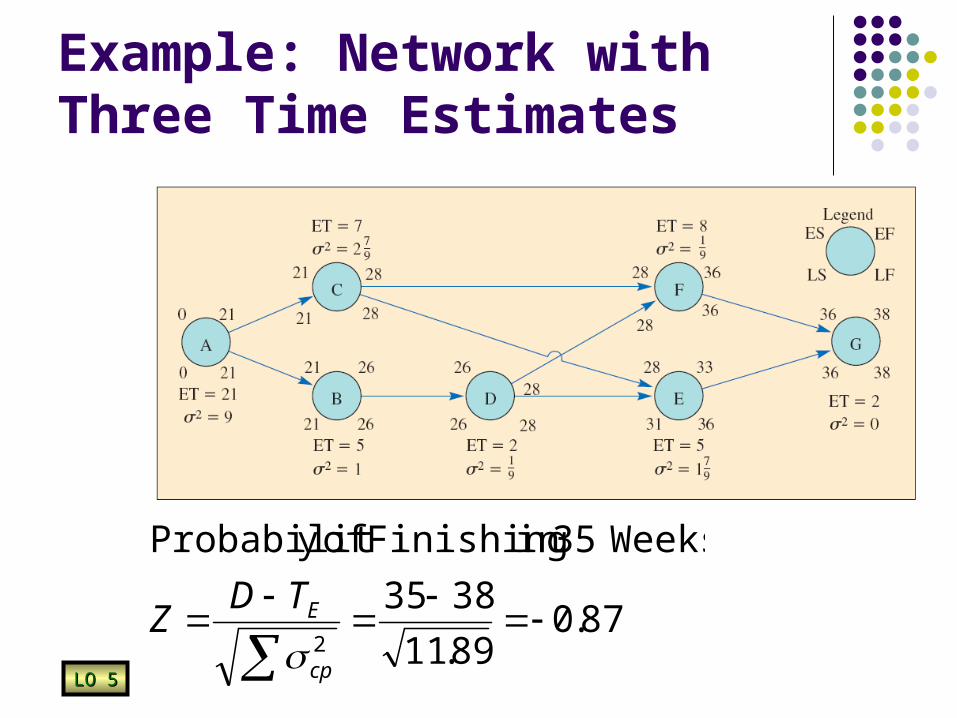
Example: Network with Three Time Estimates
87.089.11
3835
Weeks35in Finishing ofy Probabilit
2
cp
ETDZ
LO 5LO 5
Time-Cost Models
Basic Assumption: Relationship between activity completion time and project cost
Time Cost Models: Determine the optimum point in time-cost tradeoffs Activity direct costs Project indirect costs Activity completion times
Procedure for Project Crashing
1. Prepare a CPM-type network diagram
2. Determine the cost per unit of time to expedite each activity
3. Compute the critical path
4. Shorten the critical path at the least cost
5. Plot project direct, indirect, and total-cost curves and find the minimum-cost schedule
LO 6LO 6

Any Questions?