Embed Size (px)
Citation preview
C H A P T E R 1 0
Data Mining
A s you have seen, Analysis Services enables you to build powerfulBusiness Intelligence (BI) solutions that enable users to really
understand the business. However, many business problems rely on theability to spot patterns and trends across data sets that are far too large orcomplex for human analysts. Data mining can be used to explore yourdata and find these patterns, allowing you to begin to ask why things hap-pen and to predict what will happen in the future.
In this chapter, we look at how to use some of the data mining fea-tures in Analysis Services 2005 to perform tasks such as customer seg-mentation and market basket analysis. The data mining results arepresented in the form of new dimensions in cubes and are used in Webapplications.
Business Problem
Our customer for this chapter is a large music retailer with stores acrossthe country, and which also has an e-commerce site where customerscan buy CDs. The retailer has also moved into the broader entertain-ment market and added product lines such as videos, computer games,and, more recently, DVDs. This latest product line has just been addedto the Web site so that customers can buy DVDs online.
Problem Statement
The retailer faces strong competition in the online DVD market and isstruggling to achieve profitability and gain market share. Its e-commercesystem has built-in capabilities for conducting marketing campaigns andperforming analysis; however, this is restricted to information learnedfrom customers’ online behavior and does not tie back into the retailer’s
309
10_0321356985_CH10.qxd 8/3/06 7:07 PM Page 309
extensive data warehouse, which is populated mostly with informationfrom their stores.
This has led to the following challenges:
■ There is currently no way to segment customers by combining theextensive customer profile information with the Internet-usagemetrics. This segmentation is needed so that they can targetdirect mail and other marketing to segments that will potentiallyuse the Internet channel.
■ The profit margin on DVD sales is low because of extensive com-petition. The retailer needs to find ways to increase the value ofitems sold in a transaction, such as by promoting and cross-sellingadditional products at the time of the purchase.
Solution Overview
We will build an extraction, transformation, and loading (ETL) processto add the Web site’s visit-tracking data to the corporate data warehouse.We will use the data mining features of Analysis Services to help discoverpatterns in this data and provide the information back to the business.
Business Requirements
The high-level requirements to support the business objectives are asfollows:
■ Customer segmentation. The data warehouse already hasexcellent profiling information on customers that is obtainedthrough a popular store loyalty card program. This informationincludes demographic profiles and detailed purchasing histories,because the customer’s unique card number can be used to iden-tify store transactions. However, the business also needs a profileof customers’ online activities.The main areas of interest are frequency, or how often the cus-tomer uses the Web site, and recency, or how much time haselapsed since they visited the site. There is already information inthe data warehouse on the third area of interest, which is inten-sity, or how much money the customer is spending through theInternet channel.
310 Chapter 10 Data Mining
10_0321356985_CH10.qxd 8/3/06 7:07 PM Page 310
When these Internet profiling attributes are available, customerscan be segmented into groups with relatively similar behavior.Analysts can use the information for marketing purposes, such asproducing lists of customers for direct mail campaigns, as well asperforming further analysis using the attributes and groups thatwe identified.
■ Online recommendations. They would like to add an onlinerecommendations feature to the new DVD area of the Web site todrive additional profit per online transaction. When a customeradds a DVD to her shopping basket, she must be prompted with ashort list of other titles that she may be interested in.The performance of this recommendation needs to be goodbecause any delay in the responsiveness of the Web site has beenshown to lead to more abandoned transactions. Also, the recom-mendation must include items sold through the physical stores aswell as the Web site, because the stores currently make up thebulk of the sales.
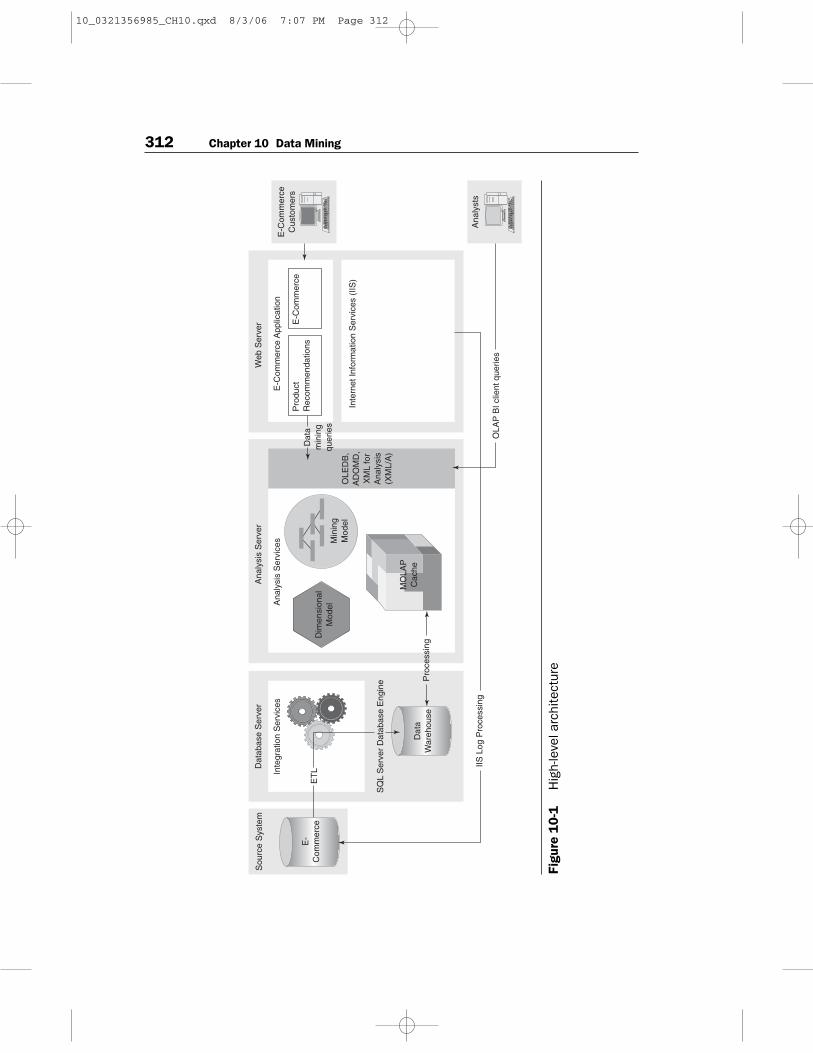
High-Level Architecture
We will add the Internet visit information to the existing data warehouseand Analysis Services cubes. Because the e-commerce applicationalready extracts data from the Web logs and inserts it into a relationaldatabase, we will use this as the source for the ETL process. The data inthis source database already has discrete user sessions identified.
Many e-commerce applications (including those based on theMicrosoft Commerce Server platform) provide this kind of extractionand log processing functionality, but for custom Web sites, the only avail-able tracking information may be the raw Internet Information Server(IIS) logs. A full treatment of the steps to extract this kind of informationfrom Web log files is beyond the scope of this chapter; see the sidebar“Extracting Information from IIS Logs” for a high-level explanation.
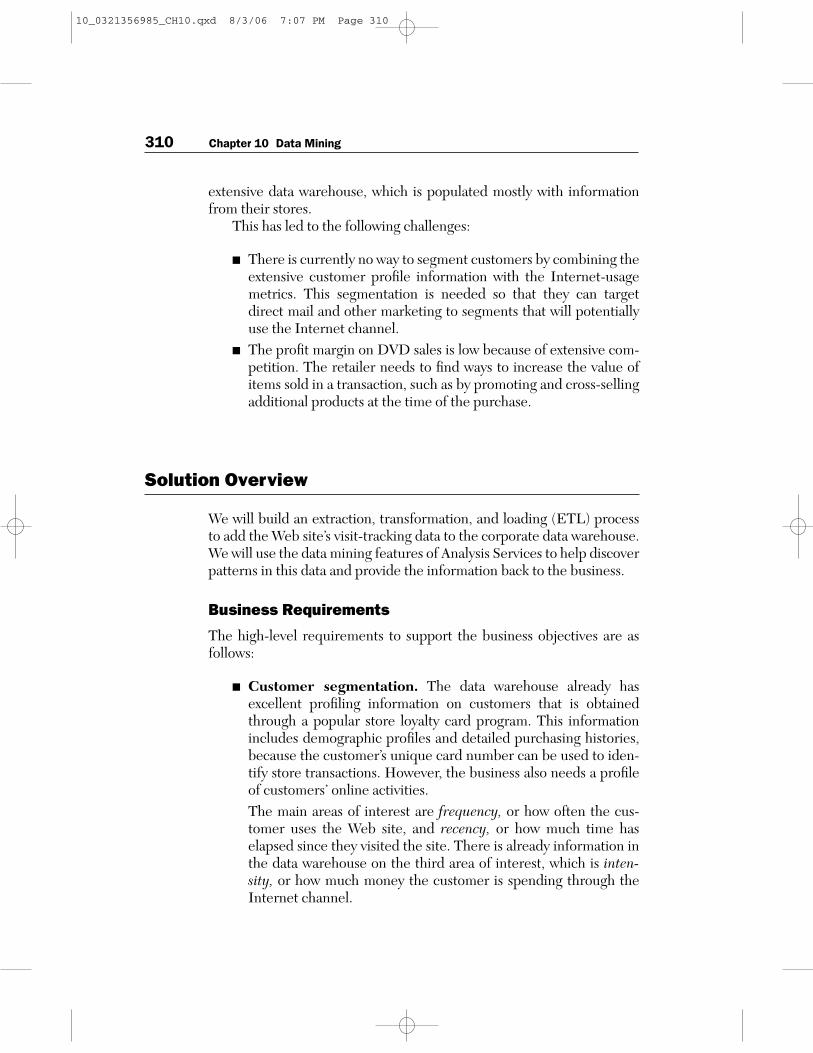
After this information is in the data warehouse, we will use the datamining features of Analysis Services to achieve the business goals forsegmentation and recommendations, as shown in Figure 10-1. For eacharea, we will create a data mining structure that describes the underlyingbusiness problem and then run the appropriate data mining algorithmagainst the data to build a mathematical model. This model can then beused both for predictions such as recommending a list of products or forgrouping information in cubes together in new ways to enable morecomplex analyses.
Solution Overview 311
10_0321356985_CH10.qxd 8/3/06 7:07 PM Page 311
312 Chapter 10 Data Mining
E-
Com
mer
ce
Sou
rce
Sys
tem
Dat
aW
areh
ouse
IIS L
og P
roce
ssin
g
OLA
P B
I clie
nt q
uerie
s
SQ
L S
erve
r D
atab
ase
Eng
ine
Dat
abas
e S
erve
r
Inte
grat
ion
Ser
vice
s
ET
L
Pro
cess
ing
Ana
lysi
s S
erve
r
Ana
lysi
s S
ervi
ces
Dim
ensi
onal
Mod
elM
inin
gM
odel
Web
Ser
ver
E-C
omm
erce
Cus
tom
ers
E-C
omm
erce
App
licat
ion
OLE
DB
,A
DO
MD
,X
ML
for
Ana
lysi
s(X
ML/
A)
MO
LAP
Cac
he
Pro
duct
Rec
omm
enda
tions
E-C
omm
erce
Inte
rnet
Info
rmat
ion
Ser
vice
s (I
IS)
Dat
am
inin
gqu
erie
s
Ana
lyst
s
Figu
re 1
0-1
Hig
h-le
vel a
rchi
tect
ure
10_0321356985_CH10.qxd 8/3/06 7:07 PM Page 312
Data mining in Analysis Services has several different types of algo-rithms to perform tasks such as classification, regression, and segmenta-tion. We will use the Microsoft Clustering algorithm to create acustomer segmentation mining model, and then the model will providethese categories of customers’ online behavior as a new dimension forcube analysis. We will use the Microsoft Association algorithm to builda data mining model that can be used to make product recommenda-tions, and then add code to the Web site to query this model to suggestappropriate DVDs for online shoppers.
Solution Overview 313
Alternative Solution: Build a Feed from the Data Warehouse tothe E-Commerce System
Because the e-commerce application already has some built-in BI capabili-ties, we could use these features for customer segmentation and productrecommendations if we built a feed from the corporate data warehouse tosupply extra information, such as detailed customer profile information oreven sales totals for other channels.
However, this approach is not recommended in this case because it will beimpractical to meet the business requirements. Product recommendationsneed to be based on sales through the physical store channel as well asonline transactions, and copying all the sales transactions to the e-com-merce data warehouse database is not viable. Also, customer segmentationis a core activity for the marketing department, and they need to have accessto all the rich information in the data warehouse.
In summary, although many e-commerce applications have built-in analyticalfunctionality, most large retailers that also have physical stores will alreadyhave an investment in a data warehouse, and the most appropriate approachwill often be to find ways to extend this with information from the Internetchannel.
Extracting Information from IIS Logs
Although in our example solution, we will be taking advantage of the log pars-ing facilities that are built in to the e-commerce application, many companieshave built a custom Web site where the only available tracking information isthe raw IIS logs.
The first step in extracting this information is to parse the log files and extractthe information into a staging database. You could create an Integration
10_0321356985_CH10.qxd 8/3/06 7:07 PM Page 313
314 Chapter 10 Data Mining
Services package to perform this extraction, possibly with an additional tool tomake the data easier to work with. Microsoft has a free Log Parser utility(www.logparser.com), and third-party parsers are also available.However, after you have extracted the raw information, the real fun begins,and is not for the faint of heart. Finding discrete “sessions” involves lookingfor an identifier in the logs such as username or cookie and then identifying atime period that could identify a “visit” fact.
If you also want to look at what pages the users visited, you need to parseURLs to deal with pages that are parameterized with identifiers such as prod-uct IDs (for example, product.aspx?ID=322442). On the whole, it is generallymuch easier to take advantage of an e-commerce application’s existing pars-ing facilities if they exist, or otherwise find an existing tool that meets yourneeds.
Business Benefits
The solution will deliver the following benefits:
■ Targeting direct mail and other marketing to identified groups ofcustomers that will probably use the Internet channel willdecrease the overall cost of marketing and increase the company’smarket share.
■ Profitability will be improved by increasing the average numberof items sold per transaction, such as selling more DVDs in onetransaction and still incurring one shipping cost.
Data Model
Most of the data model for e-commerce is similar to the standard retaildata model. The data that we need for product recommendations is sim-ply a Sales fact that shows products that are sold over time. The interest-ing new areas in e-commerce are the facts that allow us to understandthe behavior of visitors to the Web site.
Many BI solutions for Internet applications focus on how the site is used. Information such as the order that people visit pages, whichpage they start at, what Web site they came from—all of this can helpcompanies to improve the effectiveness of their Web sites. Tracking
10_0321356985_CH10.qxd 8/3/06 7:07 PM Page 314
information such as “click-through” rates, which measure how oftenusers click an advertisement, can produce more optimized campaignsand a better experience for users.
However, for this solution, we focus on the other side of the Webequation: Who are the people visiting our site? To really be able tounderstand customers well enough to produce rich customer profiles,we need to keep track of the visits that users make to our site.
How Often Are Users Visiting the Web Site?
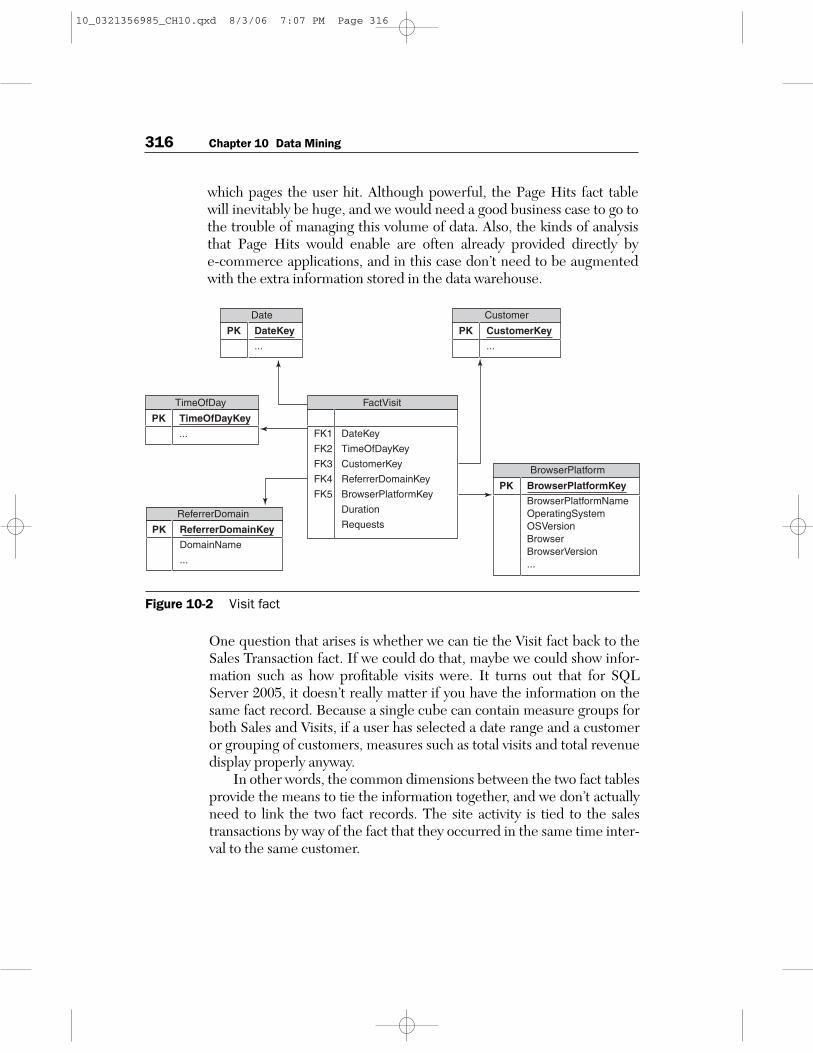
The new fact table in the data warehouse is Visit, which has one recordfor each completed customer visit to the site, as shown in Figure 10-2.So, if a customer signed on at 3:10 p.m. and then clicked through severalpages with the last page hit logged at 3:25 p.m., the e-commerce applica-tion’s log parser will see the last page hit and create a single record thatspans the whole time period.
The measures that we will be tracking are the duration of the visitand the number of requests (or page hits) during the visit. Because weare interested in the date that the visit took place as well as the time, wewill use the approach explained in earlier chapters and have separateDate and Time of Day dimensions. We can also include the ReferrerDomain that the user came from which helps us to determine whichWeb sites are sending the most traffic to our site, and the type of browserplatform that the customer was using, including browser version andoperating system. This dimension is often called User Agent rather thanBrowser Platform because other software such as search spiders can alsovisit the site; however, we always use business-friendly names in the datawarehouse rather than terms such as User Agent, which probably onlymakes sense to Web geeks.
If your log parser supports it, one useful dimension that we can addis Visit Result, which has values such as Browsed, Abandoned Transac-tion, and Completed Transaction. This is somewhat difficult for parsersto derive from the Web logs, however, because they would need to lookfor specific marker pages in the log, such as a confirmation page whenthe user completes a transaction.
The e-commerce application’s database also includes another tablewith the actual page hits that took place, so in some ways it seems we arebreaking one of the cardinal rules of dimensional modeling—always usethe most detailed grain available. By using the summarized Visit table,we are losing the ability to analyze by a Page dimension, which shows
Data Model 315
10_0321356985_CH10.qxd 8/3/06 7:07 PM Page 315
which pages the user hit. Although powerful, the Page Hits fact tablewill inevitably be huge, and we would need a good business case to go tothe trouble of managing this volume of data. Also, the kinds of analysisthat Page Hits would enable are often already provided directly by e-commerce applications, and in this case don’t need to be augmentedwith the extra information stored in the data warehouse.
316 Chapter 10 Data Mining
FactVisit
FK1 DateKey
FK2 TimeOfDayKey
FK3 CustomerKey
FK4 ReferrerDomainKey
FK5 BrowserPlatformKey
Duration
Requests
TimeOfDay
PK TimeOfDayKey
...
ReferrerDomain
PK ReferrerDomainKey
DomainName
...
BrowserPlatform
PK BrowserPlatformKey
BrowserPlatformName OperatingSystem OSVersion Browser BrowserVersion ...
Date
PK DateKey
...
Customer
PK CustomerKey
...
Figure 10-2 Visit fact
One question that arises is whether we can tie the Visit fact back to theSales Transaction fact. If we could do that, maybe we could show infor-mation such as how profitable visits were. It turns out that for SQLServer 2005, it doesn’t really matter if you have the information on thesame fact record. Because a single cube can contain measure groups forboth Sales and Visits, if a user has selected a date range and a customeror grouping of customers, measures such as total visits and total revenuedisplay properly anyway.
In other words, the common dimensions between the two fact tablesprovide the means to tie the information together, and we don’t actuallyneed to link the two fact records. The site activity is tied to the salestransactions by way of the fact that they occurred in the same time inter-val to the same customer.
10_0321356985_CH10.qxd 8/3/06 7:07 PM Page 316
Who Is Using the Web Site?
The most important dimension is certainly Customer, but data ware-house architects face an interesting challenge when it comes to theWeb—we often don’t know who the customers are. Most e-commercesites require users to create an online profile, and if the customer mustsign in before placing any orders, we can usually associate the Web siteactivity after the user signs in with the customer’s profile. However,online profiles usually contain little mandatory information (and as manyonline retailers will testify, the information they contain is often mean-ingless).
The goal for effective BI from the Web site visit information is toaugment the minimal Internet profile information with rich, accuratedemographic information. In our solution, the site profile includes anoptional loyalty card number that is issued by the physical stores.Because customers build up credits to earn free CDs, this information iswell populated and can be used to connect the online behavior from theWeb site’s customer profile with the data warehouse Customer dimen-sion. (In case you have ever wondered why stores are so keen to hand outloyalty cards, now you know—they are trying to build a good Customerdimension!)
For customers who don’t have a loyalty card number and an existingCustomer record in the data warehouse, we have two choices: Either wecan create new Customer records for each of the unmatched customerprofiles with minimal information or we can use a single “UnknownInternet Customer” record that groups all these customer together.Because even the minimal online profile will allow us to track informa-tion such as how long they have been using our Web site, we will still beable to achieve some of our segmentation goals such as identifying fre-quent visitors, and so we will go ahead and create new Customer recordsfor every distinct online profile that doesn’t have a loyalty card.
Note that the CustomerKey will be blank for all visits where the userdid not sign on but just browsed the site. If the user actually places anorder, he must sign on and therefore there will be a customer key, but wewill allocate all the other facts to an “Unknown Customer” record. It isimportant not to just discard these fact records, because even withoutthe customer information, the Visit fact table is a valuable source ofinformation about peak traffic levels on the site.
Alternatively, we could have solved the problem by modeling a sepa-rate “Internet Customer” dimension that is only used for this area and
Data Model 317
10_0321356985_CH10.qxd 8/3/06 7:07 PM Page 317
not related to other facts such as Sales, and thus avoid creating extrarecords in our Customer dimension. However, this would mean that wecouldn’t create a cube with a common Customer dimension that com-bines measure groups for Internet visit measures with sales and otherfacts for the business, which is really the central goal of this solution.
What Interesting Attributes Can We Track?
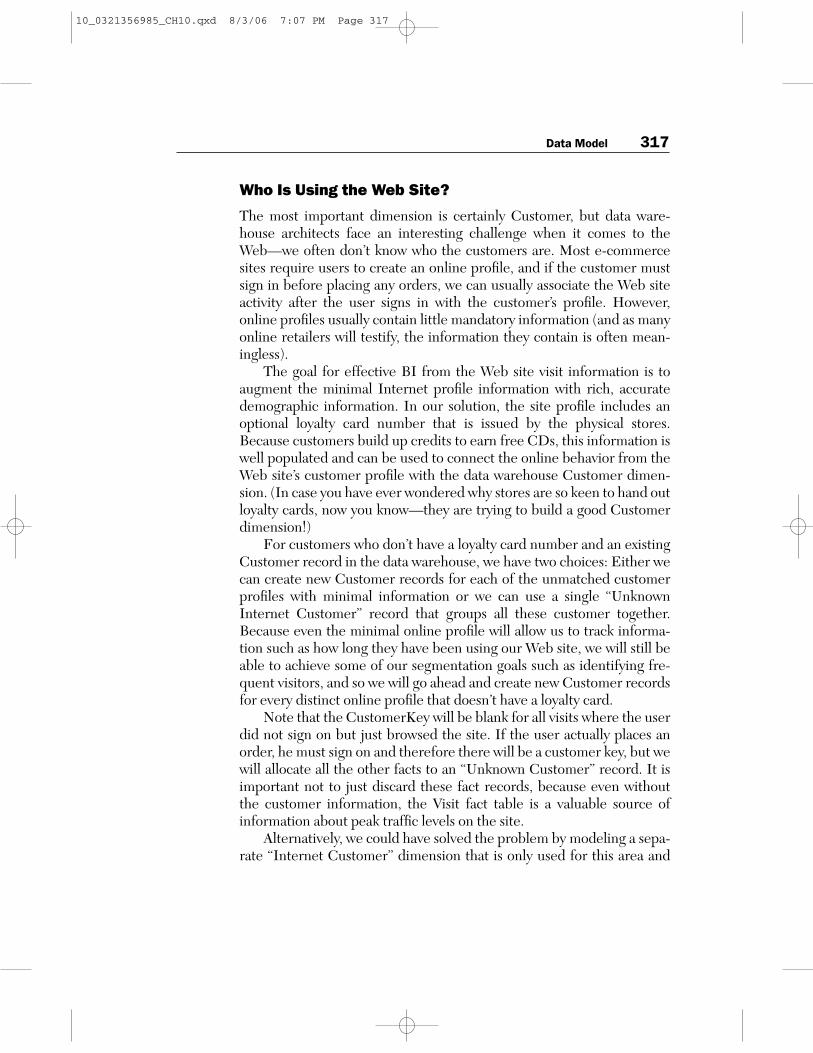
The first attribute we can add to the data warehouse Customer dimen-sion is one of the easiest but most interesting: an InternetUser flag thatindicates whether the customer has created a profile on the site, asshown in Figure 10-3. This is easy to populate and will enable analysts tostart to understand the characteristics of people who use the Internetchannel versus those who don’t.
A related InternetPurchaser attribute can be derived by looking atthe Sales transactions and flagging every customer who has made anypurchases using the Internet channel. All InternetPurchasers will, ofcourse, be InternetUsers, but the reverse is not true because some userswill have created a profile but not yet made a purchase online. Althoughanalysts could easily and flexibly get a list of customers who had pur-chased through the Internet by browsing the Sales cube and selectingthe Internet channel and a time period, it is still a good idea to add theInternetPurchaser flag so that it is easy for both analysts and data miningmodels to distinguish those customers who have ever used the Internetchannel from those who haven’t.
318 Chapter 10 Data Mining
Customer
PK CustomerKey
StoreLoyaltyCardNo ... InternetUser InternetPurchaser DateFirstInternetVisit DateLatestInternetVisit DateFirstInternetPurchase DateLatestInternetPurchase
Figure 10-3 Customer dimension
Other interesting customer attributes are DateFirstInternetVisit, whichtells us how long they have been using our site, and DateLatestInter-netVisit, which tells us how recently they have visited. Both of these
10_0321356985_CH10.qxd 8/3/06 7:07 PM Page 318
attributes are derived from the underlying Visit fact table, but will beadded to the Customer table to make the dimension easy to query. Notethat this means we will be updating our customer records much moreoften, so one way of simplifying the ETL process would be to create aview over Customer and the Visit fact table that returns the maximumdate for each customer and is used as the source for the Analysis ServicesCustomer dimension. We can also add equivalent date columns for the date of the first actual online purchase, and the most recent onlinepurchase.
Technical Solution
We start this section by reviewing the changes that were made to add theVisit fact and customer information to the existing data warehouse, andthen give a detailed description of the data mining sections of the solu-tion.
Adding Visit Information to the Data Warehouse
To add the Visit fact table and associated dimensions to the database, weneed to supplement the existing ETL procedures to load data from thee-commerce application’s tables. As always, when adding a new datasource to the warehouse, you need to perform data mapping to matchany existing dimensions. We have already discussed that for the Cus-tomer dimension we will be using the store loyalty card number to mapInternet profiles to customer records. Date and Time of Day keys areusually simple to map; however, because time stamps in Web server logsare either in the local time of the server or in UTC (coordinated univer-sal time), we need to check this before implementing the ETL.
The Referrer Domain dimension will be sourced from the equiva-lent table in the e-commerce database, but if you are implementing ETLto extract this information from log files (see the sidebar “ExtractingInformation from IIS Logs”), you need to parse the URL of the referringpage to extract the domain name. The Browser Platform attributes suchas OperatingSystem and BrowserVersion also need to be extracted fromthe User Agent field in the log files.
Technical Solution 319
10_0321356985_CH10.qxd 8/3/06 7:07 PM Page 319
Customer Dimension Changes
The new customer attributes can easily be added to the cube definitionby refreshing the data source view (DSV) in BI Development Studio topick up the new columns, and then adding these as attributes to the Cus-tomer dimension. However, they may not be in the best format foranalysis purposes—having the specific date that a user first visited thesite is not very illuminating for users of the cube. In fact, they wouldprobably be better served by being able to select customers based ongroups that show how long they have been Internet site users (for exam-ple, “3–6 months”).
We can add this information into the DSV as a named calculation onCustomer or add it to the underlying view in the database. You canimplement the MonthsSinceFirstInternetVisit named calculation byusing the DateDiff function to work out the number of months betweenthe date of the first visit and the current system date:
DateDiff(m, DateFirstInternetVisit, GetDate())
Instead of showing the user a long list of numbers, it would be betterto group the numbers together into ranges, such as 1–3 months, 3–6months, and so on. Although we could do this manually using a lookuptable of month ranges, we can take advantage of the Analysis Servicesdiscretization feature to do this for us. After adding the MonthsSince-FirstInternetVisit attribute to the Customer dimension, change the Dis-cretizationMethod property of the attribute to Automatic to allowAnalysis Services to decide on the best method of grouping these timeperiods. If you want to specify the approximate number of groups (or “buckets”) that are created, set the DiscretizationBucketCount prop-erty, too.
TIP:Use the Data Load Date Rather Than System DatesAlthough using the GetDate function to work out durations based on thecurrent system date would work, bear in mind that because we will only beloading the data on a weekly basis, the GetDate function should probablybe changed to return the latest date that the data was actually loaded.This date could be stored in a data warehouse table that is populated dur-ing the ETL process.
320 Chapter 10 Data Mining
10_0321356985_CH10.qxd 8/3/06 7:07 PM Page 320
Visit Measure Group
Because we want to be able to look at both sales and visit informationtogether, we can add the Visit fact table to the existing cube as a newmeasure group. Dimensions that are not used in the Visit measure group(such as Product and Promotion) will be grayed out in the DimensionUsage table of the cube editor.
One measure to be careful of is the Duration measure. Although thismeasure is additive across time (for example, we could determine thetotal duration that a group of customers spent on the site in the month ofJanuary), using the information by summing up the facts in this way doesnot make a lot of business sense. The Duration measure is there to pro-vide an indication of how long people spent on the site; and so, we canchange the AggregateFunction property of this measure to Average-OfChildren to display this information in the way that users will expect.
How We Will Be Using Data Mining
As discussed in the section “High-Level Architecture,” we chose theMicrosoft Clustering and Microsoft Association algorithms for our solu-tion. Knowing which algorithm is appropriate for your business problemwill take some experimentation and research in the documentation. Infact, in a lot of cases, there is no obvious candidate at the outset, and youwill need to try different algorithms against the same underlying data tosee which is most appropriate. The data mining designer also includes aMining Accuracy Chart tab that you can use to compare algorithms.
The first decision we need to make is where the data will come from.Analysis Services can use either the relational tables in your data sourceview or the actual cube itself as the source of data for the models.Because data mining is even more sensitive to flawed data than mostapplications, it is important to ensure that you perform as much datacleansing as possible against the source data prior to processing yourmodels; so, at the very least, you should probably be using the tables inyour data warehouse rather than directly using source systems.
However, using the cube as the source for data mining has a numberof benefits, so we will be using that approach for this solution. The cubedata has already been supplemented with additional attributes and cal-culated measures that the data mining algorithms can take advantage of.Also, the load process for data mining models can take some time, sousing the cube as the source means that the aggregates will be used ifapplicable, potentially speeding up the processing time.
Technical Solution 321
10_0321356985_CH10.qxd 8/3/06 7:07 PM Page 321
Approaching the Customer-Segmentation Problem
Because users can slice and dice information by all the attributes in adimension rather than just predefined drilldown hierarchies, analystscould use the new Internet-related attributes that we added to drilldown through the data and start to understand how customers’ onlineactivities affect measures such as total sales or profitability. For example,they can learn that frequent visitors to the site often have high salesamounts, but that this isn’t always the case—some frequent visitors are“just looking.”
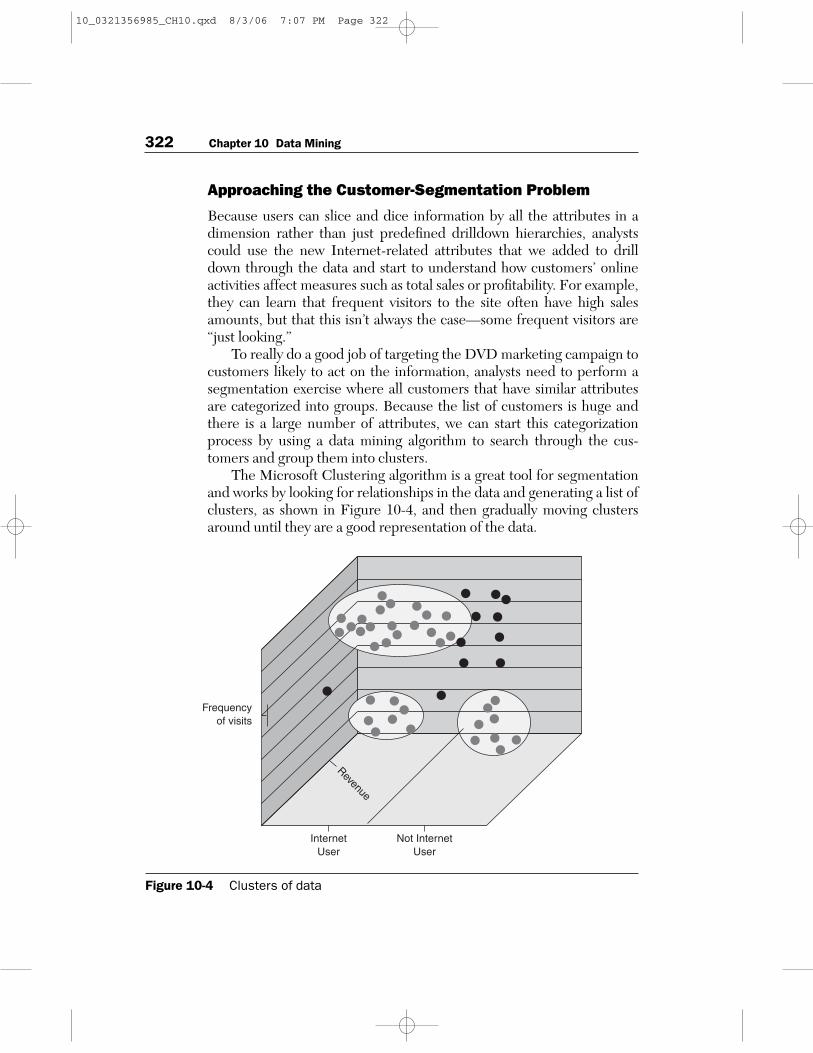
To really do a good job of targeting the DVD marketing campaign tocustomers likely to act on the information, analysts need to perform asegmentation exercise where all customers that have similar attributesare categorized into groups. Because the list of customers is huge andthere is a large number of attributes, we can start this categorizationprocess by using a data mining algorithm to search through the cus-tomers and group them into clusters.
The Microsoft Clustering algorithm is a great tool for segmentationand works by looking for relationships in the data and generating a list ofclusters, as shown in Figure 10-4, and then gradually moving clustersaround until they are a good representation of the data.
322 Chapter 10 Data Mining
Frequencyof visits
InternetUser
Not InternetUser
Revenue
Figure 10-4 Clusters of data
10_0321356985_CH10.qxd 8/3/06 7:07 PM Page 322
Getting Started with Data Mining
We start the data mining process by creating a new mining model for thecustomer segmentation exercise, using an existing Analysis Servicesproject that contains the cubes and dimensions with both the data ware-house information (such as in-store sales) and the new Internet informa-tion described earlier.
In Analysis Services data mining, we define a mining structure thatdescribes the underlying data that will be used for data mining. Eachmining structure can contain multiple mining models, such as a cluster-ing model and an association model, that all use the same underlyingdata but in different ways.
Technical Solution 323
QUICK START: Creating a Cluster Data Mining Model
We will be using the e-commerce sample project for this example because italready contains the necessary source cubes and dimensions:
1. Open the Business Intelligence Development Studio.
2. Select Open Project from the File menu and open the e-commercesample project.
3. On the Project menu, select New Mining Structure.
4. After the first wizard page, select From Existing Cube for the defini-tion method and click Next.
5. Select the Microsoft Clustering data mining technique and clickNext.
6. Select the Customer dimension from the e-commerce cube andclick Next.
7. For the case key, leave the default selection of the Customer attrib-ute and click Next.
8. Select all the Internet activity-related attributes of the customer,such as Internet User and Internet Purchaser, as well as the MonthsSince attributes that we described in the first section. Also, selectthe Visits Count and the Sales Amount from the cube, and thenclick Next.
9. On the Mining Model Column Usage page, leave the default selec-tions—all of our selected columns will be used as inputs. ClickNext.
10_0321356985_CH10.qxd 8/3/06 7:07 PM Page 323
324 Chapter 10 Data Mining
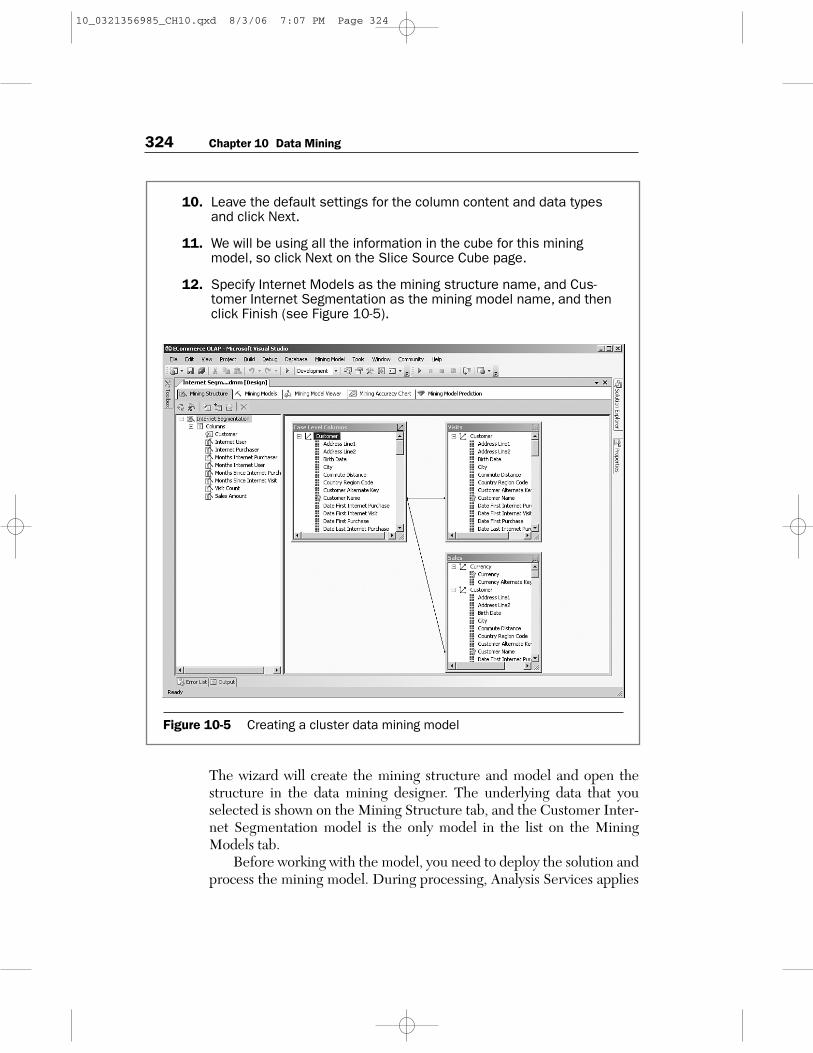
10. Leave the default settings for the column content and data typesand click Next.
11. We will be using all the information in the cube for this miningmodel, so click Next on the Slice Source Cube page.
12. Specify Internet Models as the mining structure name, and Cus-tomer Internet Segmentation as the mining model name, and thenclick Finish (see Figure 10-5).
Figure 10-5 Creating a cluster data mining model
The wizard will create the mining structure and model and open thestructure in the data mining designer. The underlying data that youselected is shown on the Mining Structure tab, and the Customer Inter-net Segmentation model is the only model in the list on the MiningModels tab.
Before working with the model, you need to deploy the solution andprocess the mining model. During processing, Analysis Services applies
10_0321356985_CH10.qxd 8/3/06 7:07 PM Page 324
the algorithm you selected (Microsoft Clustering) to the data from thecube to allocate all the customers to their appropriate clusters—yournext task in data mining is to understand the information that has beenproduced and relate it to the real world.
Looking at the Clusters Created
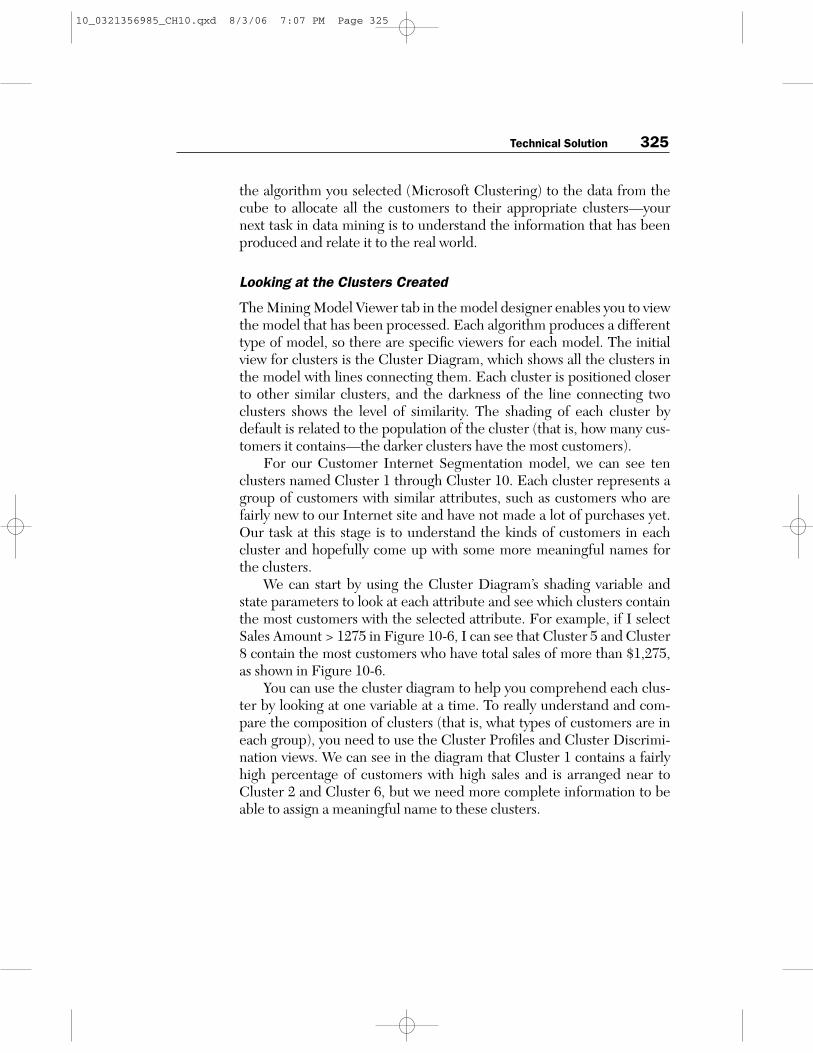
The Mining Model Viewer tab in the model designer enables you to viewthe model that has been processed. Each algorithm produces a differenttype of model, so there are specific viewers for each model. The initialview for clusters is the Cluster Diagram, which shows all the clusters inthe model with lines connecting them. Each cluster is positioned closerto other similar clusters, and the darkness of the line connecting twoclusters shows the level of similarity. The shading of each cluster bydefault is related to the population of the cluster (that is, how many cus-tomers it contains—the darker clusters have the most customers).
For our Customer Internet Segmentation model, we can see tenclusters named Cluster 1 through Cluster 10. Each cluster represents agroup of customers with similar attributes, such as customers who arefairly new to our Internet site and have not made a lot of purchases yet.Our task at this stage is to understand the kinds of customers in eachcluster and hopefully come up with some more meaningful names forthe clusters.
We can start by using the Cluster Diagram’s shading variable andstate parameters to look at each attribute and see which clusters containthe most customers with the selected attribute. For example, if I selectSales Amount > 1275 in Figure 10-6, I can see that Cluster 5 and Cluster8 contain the most customers who have total sales of more than $1,275,as shown in Figure 10-6.
You can use the cluster diagram to help you comprehend each clus-ter by looking at one variable at a time. To really understand and com-pare the composition of clusters (that is, what types of customers are ineach group), you need to use the Cluster Profiles and Cluster Discrimi-nation views. We can see in the diagram that Cluster 1 contains a fairlyhigh percentage of customers with high sales and is arranged near toCluster 2 and Cluster 6, but we need more complete information to beable to assign a meaningful name to these clusters.
Technical Solution 325
10_0321356985_CH10.qxd 8/3/06 7:07 PM Page 325
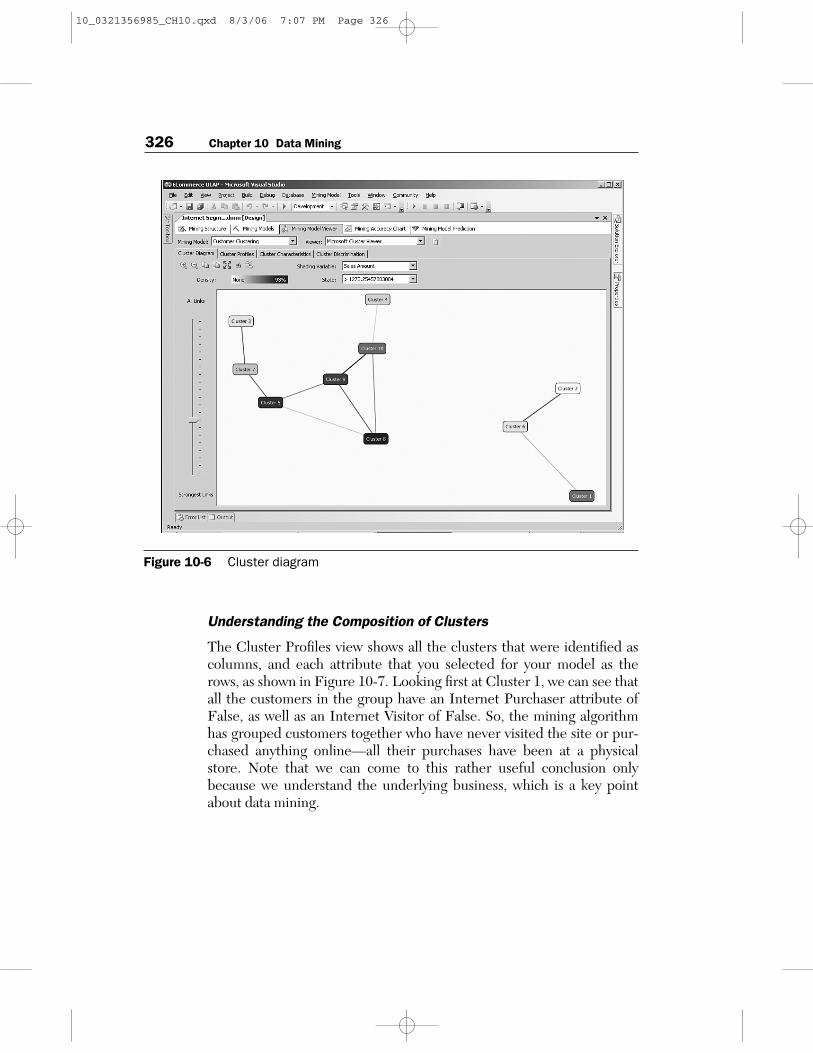
Figure 10-6 Cluster diagram
Understanding the Composition of Clusters
The Cluster Profiles view shows all the clusters that were identified ascolumns, and each attribute that you selected for your model as therows, as shown in Figure 10-7. Looking first at Cluster 1, we can see thatall the customers in the group have an Internet Purchaser attribute ofFalse, as well as an Internet Visitor of False. So, the mining algorithmhas grouped customers together who have never visited the site or pur-chased anything online—all their purchases have been at a physicalstore. Note that we can come to this rather useful conclusion onlybecause we understand the underlying business, which is a key pointabout data mining.
326 Chapter 10 Data Mining
10_0321356985_CH10.qxd 8/3/06 7:07 PM Page 326
Figure 10-7 Cluster profiles
To give Cluster 1 the more sensible name of Store-Only Buyers, right-click the cluster name and select Rename Cluster. So, we now have a sin-gle cluster identified; what about the others? If you look at the nextcolumn, you can see that Cluster 2 differs from Store-Only Buyers inthat all the customers in the cluster have actually visited the site, butthey just haven’t made any purchases online yet. We can call this clusterBrowsers because they are customers who are (so far) using the site forinformation gathering only.
Cluster 6 contains visitors who have also made a purchase, but if welook closely at the Months Internet Purchaser and Months Internet Userattributes, we learn that they are all relative newcomers to our site—allof them have been visitors and purchasers for between zero and threemonths (they are “Newbies”). We can continue the process of looking ateach cluster, but the rest of the clusters are not quite so clear-cut, so weneed a better tool for differentiating between them.
Technical Solution 327
10_0321356985_CH10.qxd 8/3/06 7:07 PM Page 327
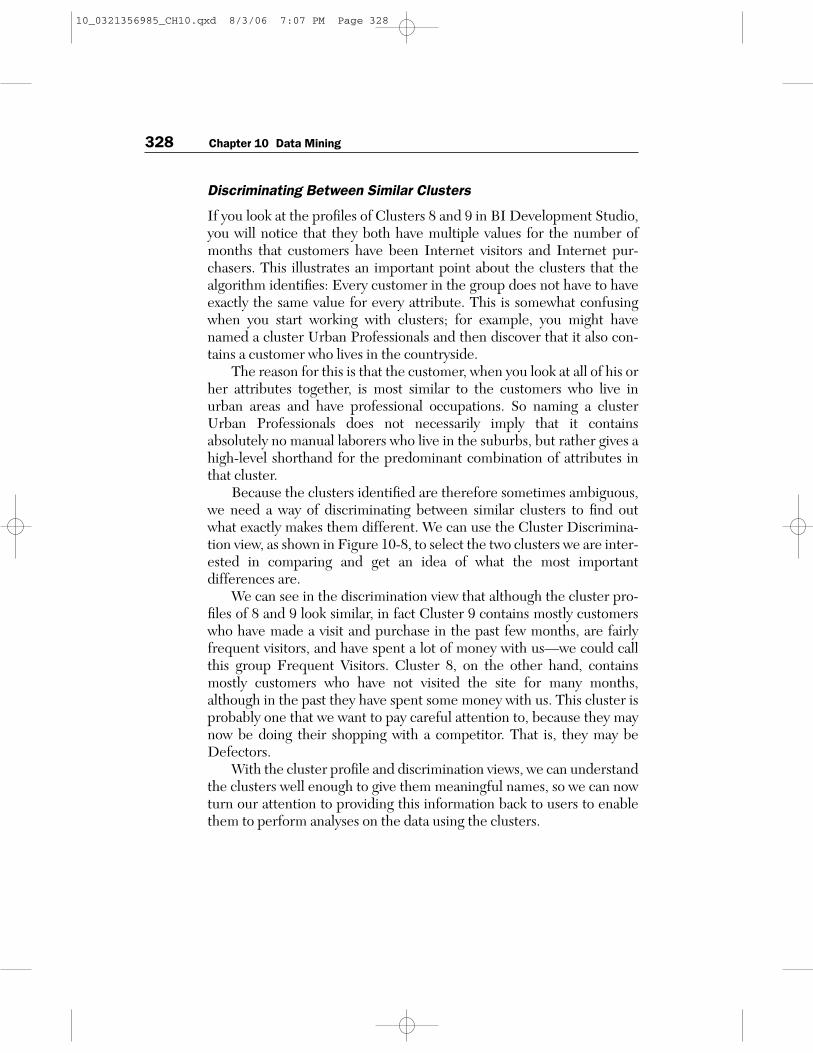
Discriminating Between Similar Clusters
If you look at the profiles of Clusters 8 and 9 in BI Development Studio,you will notice that they both have multiple values for the number ofmonths that customers have been Internet visitors and Internet pur-chasers. This illustrates an important point about the clusters that thealgorithm identifies: Every customer in the group does not have to haveexactly the same value for every attribute. This is somewhat confusingwhen you start working with clusters; for example, you might havenamed a cluster Urban Professionals and then discover that it also con-tains a customer who lives in the countryside.
The reason for this is that the customer, when you look at all of his orher attributes together, is most similar to the customers who live inurban areas and have professional occupations. So naming a clusterUrban Professionals does not necessarily imply that it containsabsolutely no manual laborers who live in the suburbs, but rather gives ahigh-level shorthand for the predominant combination of attributes inthat cluster.
Because the clusters identified are therefore sometimes ambiguous,we need a way of discriminating between similar clusters to find outwhat exactly makes them different. We can use the Cluster Discrimina-tion view, as shown in Figure 10-8, to select the two clusters we are inter-ested in comparing and get an idea of what the most importantdifferences are.
We can see in the discrimination view that although the cluster pro-files of 8 and 9 look similar, in fact Cluster 9 contains mostly customerswho have made a visit and purchase in the past few months, are fairlyfrequent visitors, and have spent a lot of money with us—we could callthis group Frequent Visitors. Cluster 8, on the other hand, containsmostly customers who have not visited the site for many months,although in the past they have spent some money with us. This cluster isprobably one that we want to pay careful attention to, because they maynow be doing their shopping with a competitor. That is, they may beDefectors.
With the cluster profile and discrimination views, we can understandthe clusters well enough to give them meaningful names, so we can nowturn our attention to providing this information back to users to enablethem to perform analyses on the data using the clusters.
328 Chapter 10 Data Mining
10_0321356985_CH10.qxd 8/3/06 7:07 PM Page 328
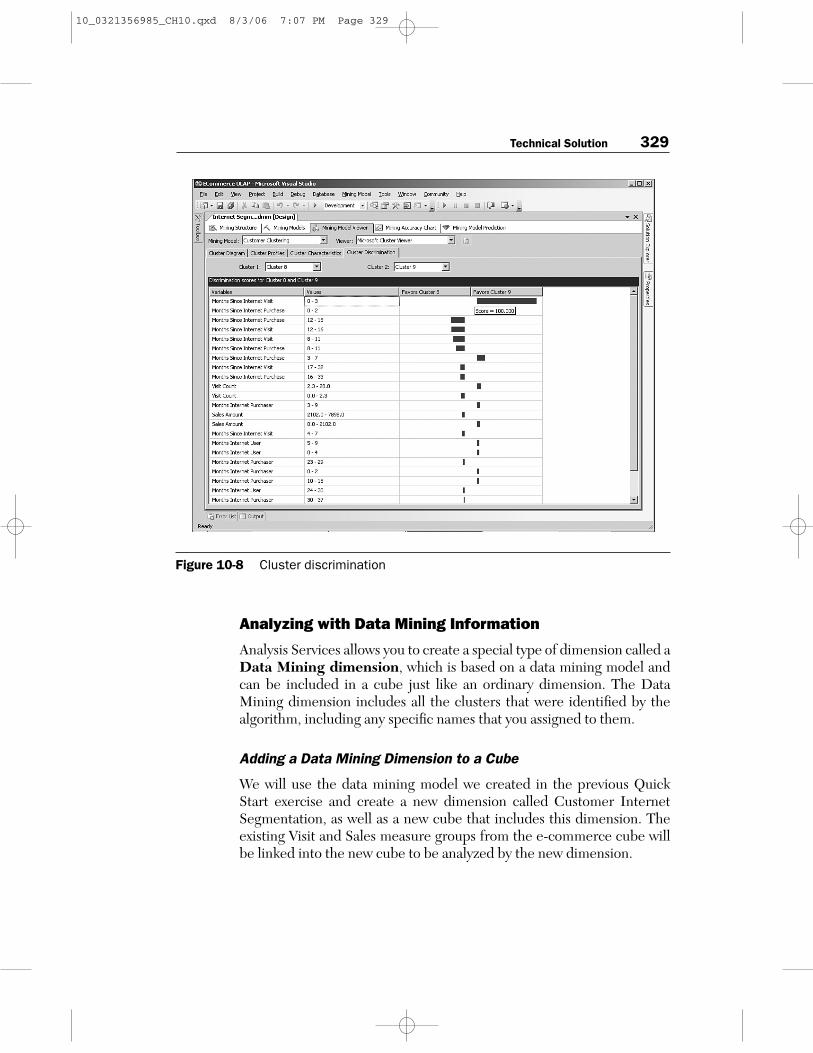
Figure 10-8 Cluster discrimination
Analyzing with Data Mining Information
Analysis Services allows you to create a special type of dimension called aData Mining dimension, which is based on a data mining model andcan be included in a cube just like an ordinary dimension. The DataMining dimension includes all the clusters that were identified by thealgorithm, including any specific names that you assigned to them.
Adding a Data Mining Dimension to a Cube
We will use the data mining model we created in the previous QuickStart exercise and create a new dimension called Customer InternetSegmentation, as well as a new cube that includes this dimension. Theexisting Visit and Sales measure groups from the e-commerce cube willbe linked into the new cube to be analyzed by the new dimension.
Technical Solution 329
10_0321356985_CH10.qxd 8/3/06 7:07 PM Page 329
To create the dimension, open the data mining structure and go tothe Mining Structure tab. Select Create a Data Mining Dimension onthe Mining Model menu. Specify the dimension and cube names andclick OK. Before you can use the new objects, you must deploy the solu-tion and process the new dimension and cube.
Using the Data Mining Dimension
Because the dimension has been added to the cube, marketing databaseanalysts can use the new segmentation to understand measures such asprofitability or total sales for each of the clusters and refine the set ofcustomers who will be targeted by the direct mail campaign to publicizethe site’s new DVD products. The list of customers can be providedeither from a drillthrough action in a BI client tool or by building aReporting Services customer list report that allows the user to select thecluster and other attributes.
Creating a Model for Product Recommendations
Our approach for product recommendations is based on the idea that wecan use a mining model to look at every customer and the DVDs thatthey have bought, and then look for patterns of DVDs that often occurtogether. The Association Rules mining model is often used for this kindof analysis (sometimes called market basket analysis) and produces a setof rules that say, for example, if the customer is buying a DVD of TheGodfather, what are the other movies that other buyers of The Godfatherhave purchased?
Each of these rules has a probability associated with them. Forexample, many customers may also have bought similar films, such asThe Godfather Part II or Goodfellas, so the rules that relate The Godfa-ther to these DVDs would have a high probability. If only a single cus-tomer bought It’s a Wonderful Life and The Godfather, this rule wouldhave a low probability. In data mining terminology, the number of timesthat a set of items occurs together is called the support, so the exampleof It’s a Wonderful Life and The Godfather appearing together wouldhave a support of 1.
We can use these rules to make a prediction: For a specific DVD,give me a list of the most probable DVDs that a customer might alsoenjoy.
330 Chapter 10 Data Mining
10_0321356985_CH10.qxd 8/3/06 7:07 PM Page 330
Asking the Right Question
The best way to successfully set up a sensible data mining model is to beprecise about the question you ask. Because we are looking for DVDsthat sell well together, is the question we are asking “Which other DVDshave been bought during the same shopping trip?” or rather “Whichother DVDs did customers also buy at some point?.” If you were doingproduct recommendations on groceries, the first question would proba-bly be the most sensible. The reason is that if someone is buying beerand wine today, we can probably recommend ice and potato chipsbecause those are often sold in the same transaction.
However, in our case, we are trying to determine the likes and dis-likes of consumers, which have a longer duration than just a single trans-action. We are really trying to understand what kind of movies customersenjoy, so the second question is more appropriate for this business solu-tion. To set up the model, we need to look at each customer and deter-mine the list of DVDs that they have purchased. The data we are lookingfor looks something like Table 10-1. In data mining terminology, the cus-tomer would be the case, and the list of products for each customerwould be a nested table.
Table 10-1 Customer DVD Purchase History
Technical Solution 331
Customer DVD
Customer 3283 The Godfather
The Godfather Part II
Dark City
Customer 3981 The Godfather Part II
Goodfellas
Customer 5488 The Godfather
It’s a Wonderful Life
… …
10_0321356985_CH10.qxd 8/3/06 7:07 PM Page 331
332 Chapter 10 Data Mining
QUICK START: Creating an Association Rules Data Mining Model
We can add the new product recommendations mining model to the same e-commerce solution as the segmentation model; but because we are usingdifferent underlying data, we need to create a new mining structure, too:
1. On the Project menu, select New Mining Structure.
2. After the first wizard page, select From Existing Cube for the defini-tion method and click Next.
3. Select the Microsoft Association Rules data mining technique andclick Next.
4. Select the Customer dimension from the e-commerce cube andclick Next.
5. For the case key, leave the default selection of the Customer attrib-ute and click Next.
6. Leave the other case level columns blank and click Next.
7. Click the Add Nested Tables button, select the Product dimensionfrom the e-commerce cube, and click Next.
8. For the case key, leave the default selection of the Product attributeand click Next.
9. Leave the other case level columns blank and click Finish.
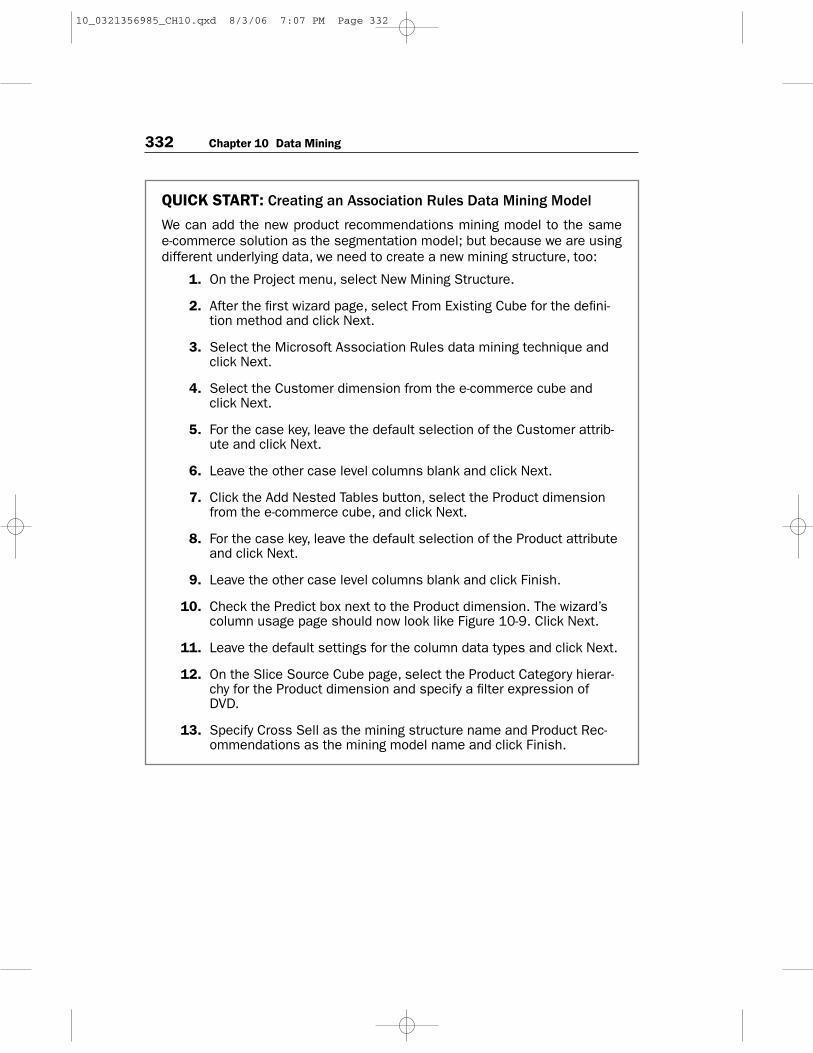
10. Check the Predict box next to the Product dimension. The wizard’scolumn usage page should now look like Figure 10-9. Click Next.
11. Leave the default settings for the column data types and click Next.
12. On the Slice Source Cube page, select the Product Category hierar-chy for the Product dimension and specify a filter expression ofDVD.
13. Specify Cross Sell as the mining structure name and Product Rec-ommendations as the mining model name and click Finish.
10_0321356985_CH10.qxd 8/3/06 7:07 PM Page 332
Understanding the Product Recommendation Rules
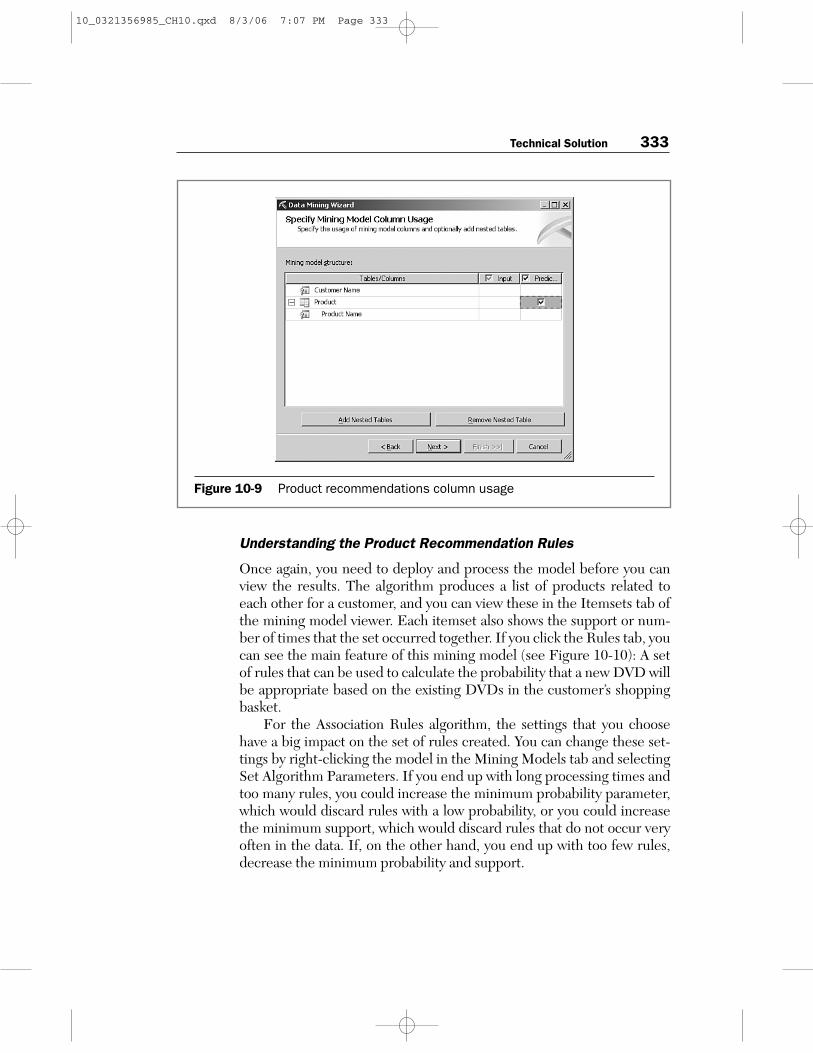
Once again, you need to deploy and process the model before you canview the results. The algorithm produces a list of products related toeach other for a customer, and you can view these in the Itemsets tab ofthe mining model viewer. Each itemset also shows the support or num-ber of times that the set occurred together. If you click the Rules tab, youcan see the main feature of this mining model (see Figure 10-10): A setof rules that can be used to calculate the probability that a new DVD willbe appropriate based on the existing DVDs in the customer’s shoppingbasket.
For the Association Rules algorithm, the settings that you choosehave a big impact on the set of rules created. You can change these set-tings by right-clicking the model in the Mining Models tab and selectingSet Algorithm Parameters. If you end up with long processing times andtoo many rules, you could increase the minimum probability parameter,which would discard rules with a low probability, or you could increasethe minimum support, which would discard rules that do not occur veryoften in the data. If, on the other hand, you end up with too few rules,decrease the minimum probability and support.
Technical Solution 333
Figure 10-9 Product recommendations column usage
10_0321356985_CH10.qxd 8/3/06 7:07 PM Page 333
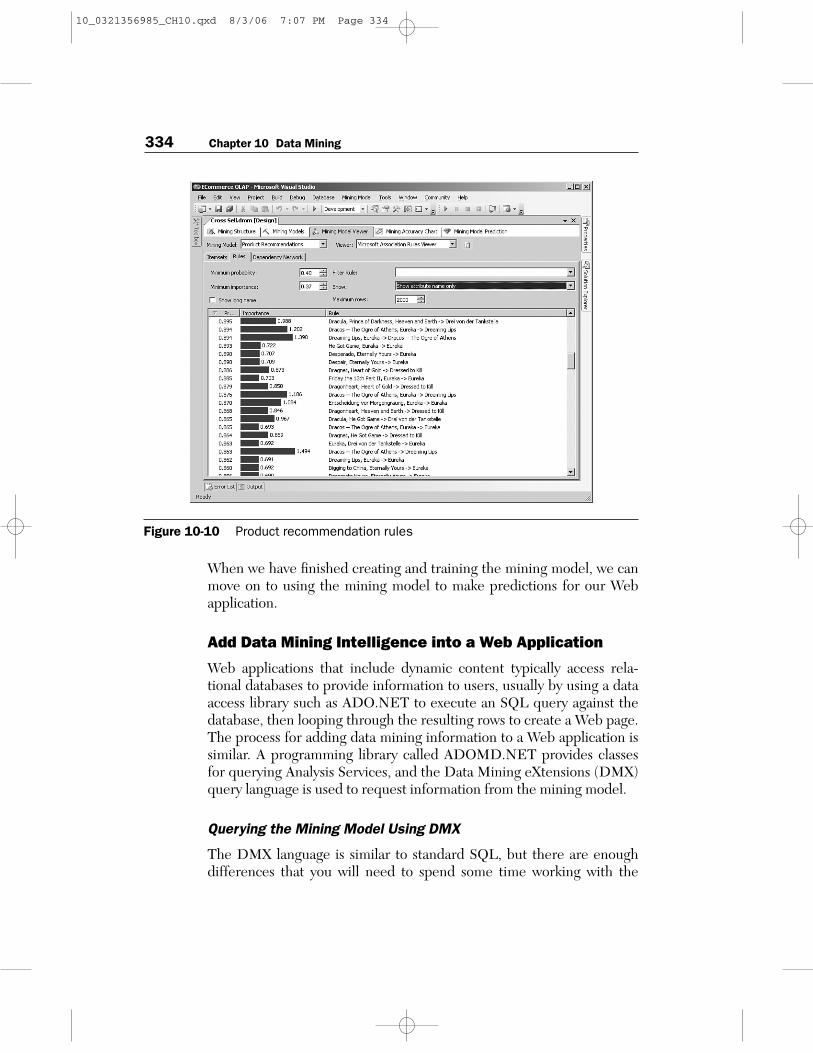
Figure 10-10 Product recommendation rules
When we have finished creating and training the mining model, we canmove on to using the mining model to make predictions for our Webapplication.
Add Data Mining Intelligence into a Web Application
Web applications that include dynamic content typically access rela-tional databases to provide information to users, usually by using a dataaccess library such as ADO.NET to execute an SQL query against thedatabase, then looping through the resulting rows to create a Web page.The process for adding data mining information to a Web application issimilar. A programming library called ADOMD.NET provides classesfor querying Analysis Services, and the Data Mining eXtensions (DMX)query language is used to request information from the mining model.
Querying the Mining Model Using DMX
The DMX language is similar to standard SQL, but there are enough differences that you will need to spend some time working with the
334 Chapter 10 Data Mining
10_0321356985_CH10.qxd 8/3/06 7:07 PM Page 334
language before it becomes natural. As with all new query languages, it isoften better to start out using graphical designers, such as the predictionquery builder in SQL Server Management Studio, before moving on tohand-coding queries. There is also a thriving user community for Analy-sis Services data mining, and there are lots of samples available to getyou started at www.sqlserverdatamining.com.
Technical Solution 335
QUICK START: Using the Prediction Query Builder
We need to build a DMX query that recommends a likely set of productsbased on a product that the customer purchases. The prediction querybuilder enables you to create a query based on either a list of values thatyou supply (called a singleton query) or to make batch predictions on awhole set of records contained in an input table:
1. In SQL Server Management Studio, open the Analysis Servicesdatabase in the Object Explorer.
2. Browse to the Product Recommendations mining model, right-clickit, and choose Build Prediction Query.
3. On the Mining Model menu, select Singleton Query.
4. On the Singleton Query Input box, click on the Product row in theValue column and click the … button.
5. Add some products from the list to the input rows and click OK. Wehave now defined the input to the query. The next step is to definethe output (that is, what we want to predict).
6. In the first row of the grid in the lower half of the designer, selectPrediction Function in the source column, and select Predict in theField column.
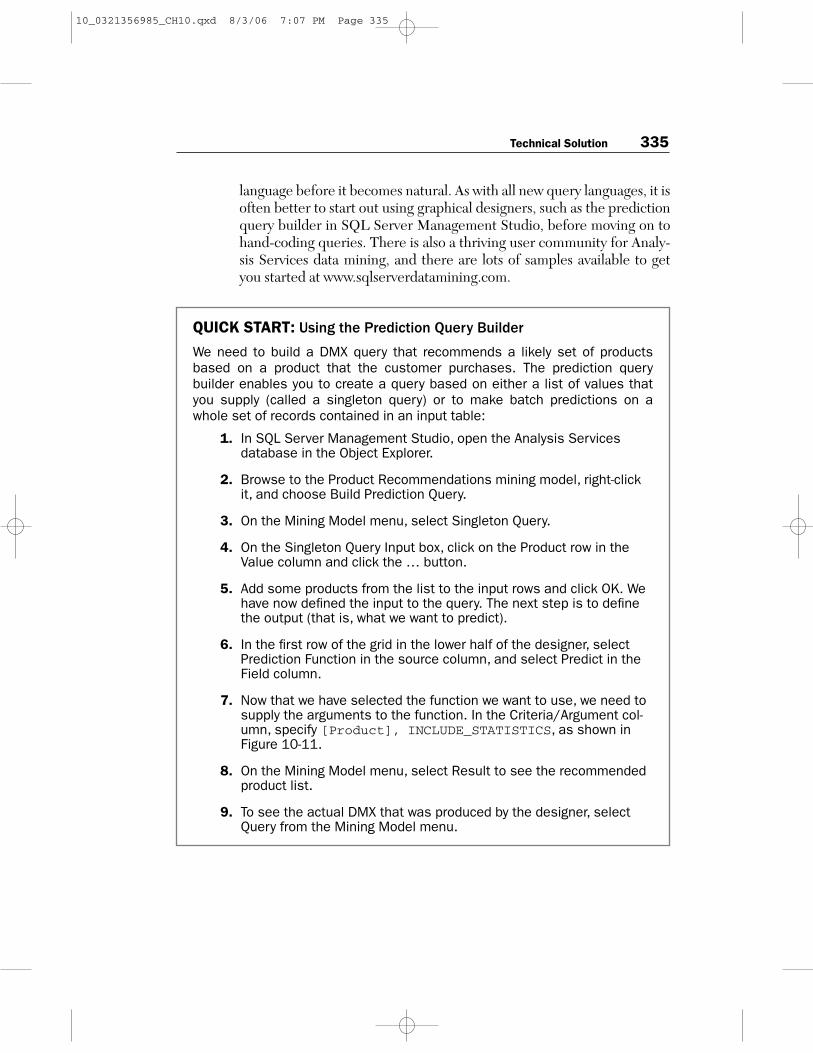
7. Now that we have selected the function we want to use, we need tosupply the arguments to the function. In the Criteria/Argument col-umn, specify [Product], INCLUDE_STATISTICS, as shown inFigure 10-11.
8. On the Mining Model menu, select Result to see the recommendedproduct list.
9. To see the actual DMX that was produced by the designer, selectQuery from the Mining Model menu.
10_0321356985_CH10.qxd 8/3/06 7:07 PM Page 335
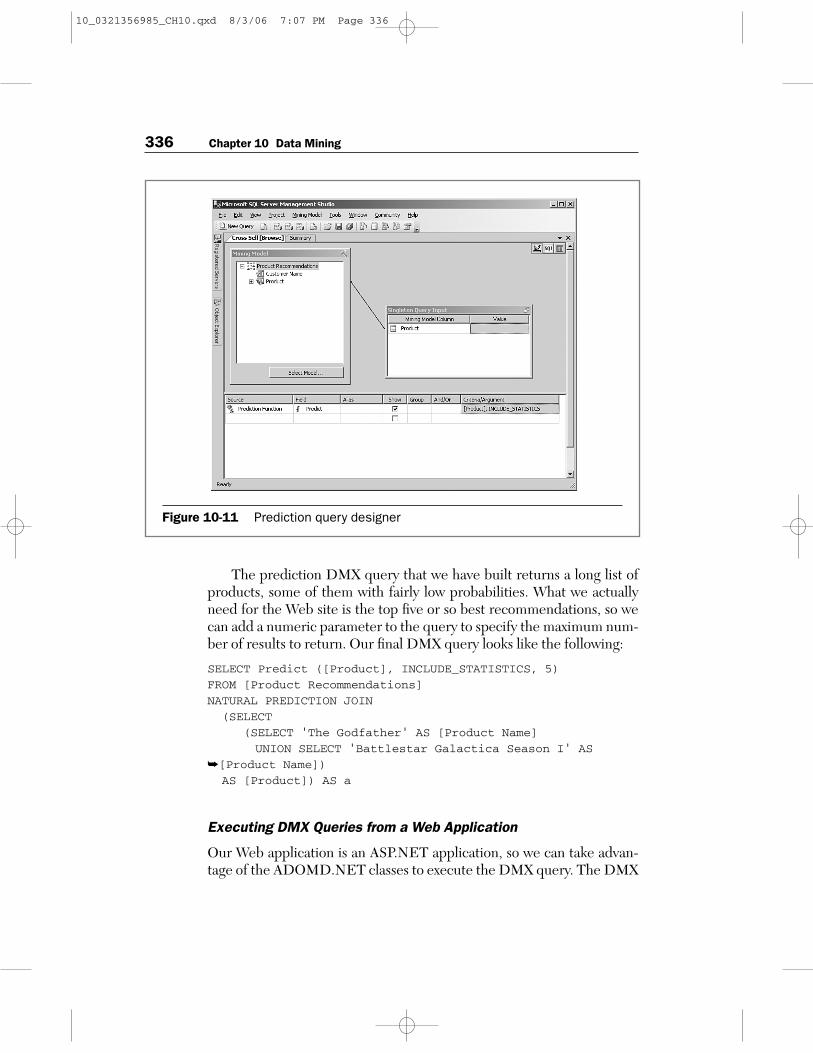
The prediction DMX query that we have built returns a long list ofproducts, some of them with fairly low probabilities. What we actuallyneed for the Web site is the top five or so best recommendations, so wecan add a numeric parameter to the query to specify the maximum num-ber of results to return. Our final DMX query looks like the following:
SELECT Predict ([Product], INCLUDE_STATISTICS, 5)
FROM [Product Recommendations]
NATURAL PREDICTION JOIN
(SELECT
(SELECT ‘The Godfather‘ AS [Product Name]
UNION SELECT ‘Battlestar Galactica Season I‘ AS
➥[Product Name])
AS [Product]) AS a
Executing DMX Queries from a Web Application
Our Web application is an ASP.NET application, so we can take advan-tage of the ADOMD.NET classes to execute the DMX query. The DMX
336 Chapter 10 Data Mining
Figure 10-11 Prediction query designer
10_0321356985_CH10.qxd 8/3/06 7:07 PM Page 336
query that we designed earlier returns the information in a hierarchicalformat, and we would need to navigate through it to extract the productnames. We can simplify the code by using the SELECT FLATTENED syntax,which returns the information as a simple list of products that we canadd to the Web page.
Managing the Solution
Data mining features are provided as part of the Analysis Servicesengine, so many of the usual management tasks are still applicable, butdata mining also adds some new areas to be aware of.
Deployment
We are adding the visit information and customer-segmentation miningmodels to an existing BI solution, so the main deployment challenge thatwe face is for the product recommendations mining model. Because thismodel will be used on the live Internet site, we need to deploy an addi-tional Analysis Server that can be accessed by the Web applicationservers.
Deploying the Mining Model to the Production Server
Because we built our mining model using an Analysis Services cube asthe source, we need to find a way to get the processed cube and miningmodels onto the production server. The easiest way to do this is to backup the Analysis Services database and restore it in production.
If we had built our mining model using a relational database as thesource rather than an Analysis Services cube, we could easily havedeployed the mining model using DMX’s EXPORT command, by runninga DMX query in SQL Server Management Studio with the followingsyntax:
EXPORT MINING MODEL [Product Recommendations] TO
‘C:\ProductRec.abf‘ WITH PASSWORD=‘MyPassword‘
Remember that the path you specify is on the server, not on theclient machine that you are running the DMX query from. The file will
Managing the Solution 337
10_0321356985_CH10.qxd 8/3/06 7:07 PM Page 337
contain everything we need to make predictions, so we can copy it to theproduction server, create a new Analysis Services database, and importthe model using a DMX query with the following syntax:
IMPORT FROM ‘C:\ProductRec.abf‘ WITH PASSWORD=‘MyPassword‘
Securing the Mining Model
Because we will be accessing the product recommendations miningmodel from a Web application, we need to set up the security correctlyto allow the IIS user account to query the Analysis Server. We need tocreate a special role in the production Analysis Services database thathas the IIS account (such as IUSR_machinename) as a member, andthen enable Read and Read Definition permissions for the mining struc-ture and model.
Maintenance
Any future changes that you make to the mining model definitions willneed to be redeployed to the server and will also require processing thechanged models. Mining structures can include more than one model onthe same underlying data (for example, using different algorithms oreven just different algorithm settings), so you might need to add newmodels to handle future business requirements.
Operations
Just like Analysis Services cubes, we need to reprocess mining models totrain them with new input data. There is no “incremental process”option with mining models, however, so you need to reprocess using thefull data set.
The product recommendations model probably needs to bereprocessed on a regular basis so that it is kept current with the latestproducts and sales trends. In our e-commerce solution, the model isreprocessed on a weekly basis and then copied from development intothe Web production environment. The customer segmentation modelwill be used for marketing processes such as organizing marketing cam-paigns that take some time to complete, so the model will not bereprocessed often.
338 Chapter 10 Data Mining
10_0321356985_CH10.qxd 8/3/06 7:07 PM Page 338
TIP:Reprocessing Mining Models Drops Cluster NamesAnother reason that the customer segmentation model is not reprocessedoften is that the carefully selected cluster names such as Defector andNewbie are replaced with the default Cluster 1 and Cluster 2 names duringprocessing. This is also important to know during development when youare designing your model, because you will be losing any cluster namesevery time you need to change anything in the model.
Next Steps
You can leverage data mining for various business requirements in manyways, and you have a whole set of new possibilities available if we add thePage Hits fact table to the data warehouse. This would involve handlinga large fact table, which has ramifications for the relational databasedesign, ETL processes, and even the cube structure. See Chapter 11,“Very Large Data Warehouses,” for a full description of the issues associ-ated with very large databases.
Sequence Clustering to Build Smarter Web Sites
Each visit has an associated path that the user took through the pages ofthe Web site. We could use this data with the Sequence Clustering algo-rithm, which finds clusters of cases that contain similar paths in asequence. This mining model could then be used in the Web site to sug-gest the next page that the user might like to visit.
Other Data Mining Possibilities
This chapter has given a basic introduction to the rich and broad set ofapplications possible using the algorithms in Analysis Services data min-ing. One area that we have only scratched the surface of is prediction.For example, applications that require predictions of an attribute arepossible using the classification algorithms including Decision Trees,Neural Network, and Naive Bayes; and continuous variables such asfuture profit levels can be predicted by the Time Series and DecisionTrees algorithms.
Next Steps 339
10_0321356985_CH10.qxd 8/3/06 7:07 PM Page 339
Using Data Mining in Integration Services to ImproveData Quality
One of the major scenarios that we have not looked at in this chapter isthe use of data mining in Integration Services. We could create a cluster-ing model against a subset of data that is already in the data warehouseand is known to have clean, correct values, and then query this model inan Integration Services package that loads new data to determine theprobability that each new record is valid. Records that are selected aslikely “bad data” can be split out during the load process into a separatetable for further validation or human checking and correction.
Integration Services also has other data mining features, such asloading data directly into data models within the data flow and specifyingsamples of data to be used for training models rather than just using allthe data.
Summary
We added the Internet visit information to the data warehouse andAnalysis Services database and built Integration Services packages toload the data from the e-commerce system’s database. We created a min-ing model to add customer segmentation to the cube, and anothermodel to supply product recommendations to the Web site. We decidednot to use the e-commerce application’s built-in BI features because theobjectives required extensive data from the existing data warehouse,which was not available in the e-commerce database.
Marketing activities, such as Internet advertising and direct mail,can now be targeted more effectively at customers based on their use ofthe Web site and their customer profiles. The high-performance cross-sell feature on the Web site is recommending additional DVDs that thecustomer might like to purchase, hopefully leading to additional itemssold per transaction.
Because many of the interesting measures in the Internet activityfact data are measures of the time elapsed between two dates, we addeda set of time span calculations to the fact views that were used by thecube. To calculate the time up until the present day, the data load datewas used rather than the current system date.
340 Chapter 10 Data Mining
10_0321356985_CH10.qxd 8/3/06 7:07 PM Page 340
We used the Microsoft Clustering algorithm to create a customersegmentation mining model and data mining dimension so that analystscan use clusters of customers such as Newbies and Store-Only Buyers.We used the Microsoft Association Rules algorithm to create a productrecommendations model, and added a DMX query to the e-commerceWeb application to suggest a list of possible DVDs that a customer mightalso purchase.
The product recommendations mining model was deployed to aproduction server that can be accessed by the e-commerce Web applica-tion, and the security was configured so that the Web application canquery the mining model. A new operations task is to periodicallyreprocess the product recommendations mining model so that it is keptcurrent with the latest data.
Summary 341
10_0321356985_CH10.qxd 8/3/06 7:07 PM Page 341

10_0321356985_CH10.qxd 8/3/06 7:07 PM Page 342


![[XLS]ptgmedia.pearsoncmg.comptgmedia.pearsoncmg.com/imprint_downloads/merrill_professional... · Web viewInstitute of Education Sciences ... NCTE National Council Teachers of English](https://img.pdfslide.net/doc/110x75/5ab9b0c77f8b9ad3038e5ccf/xls-viewinstitute-of-education-sciences-ncte-national-council-teachers-of.jpg)

![CLASSIFICA TION AND CLUSTERING OF GRAPHS B ASED ON DISSIMILARITY … · 2010. 4. 26. · [ElGha w alb y and Hancoc k, 2008]" Char acter istic polynomial analysis [Ren, Wilson and](https://img.pdfslide.net/doc/110x75/60cc9994cbe2e85e262b3e15/classifica-tion-and-clustering-of-graphs-b-ased-on-dissimilarity-2010-4-26.jpg)