Embed Size (px)
Citation preview
DISCOVERING STATISTICS USING SPSS
Chapter 10: Moderation, mediation and more regression
Self-test answers
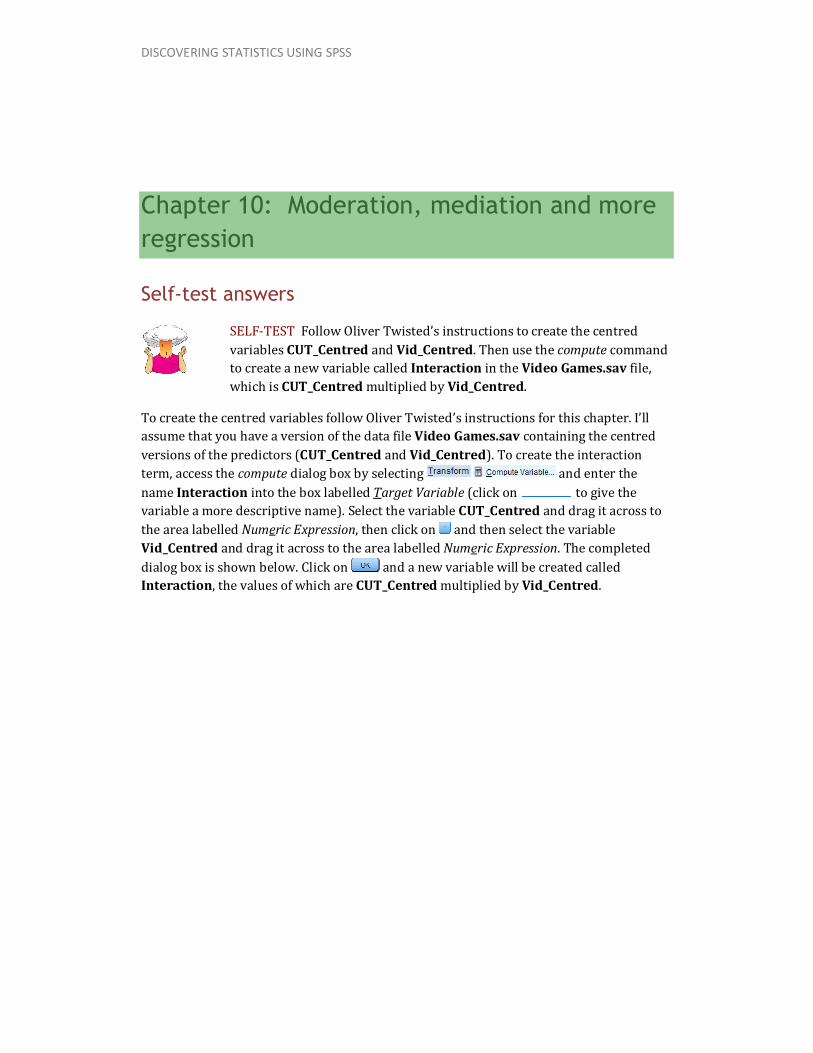
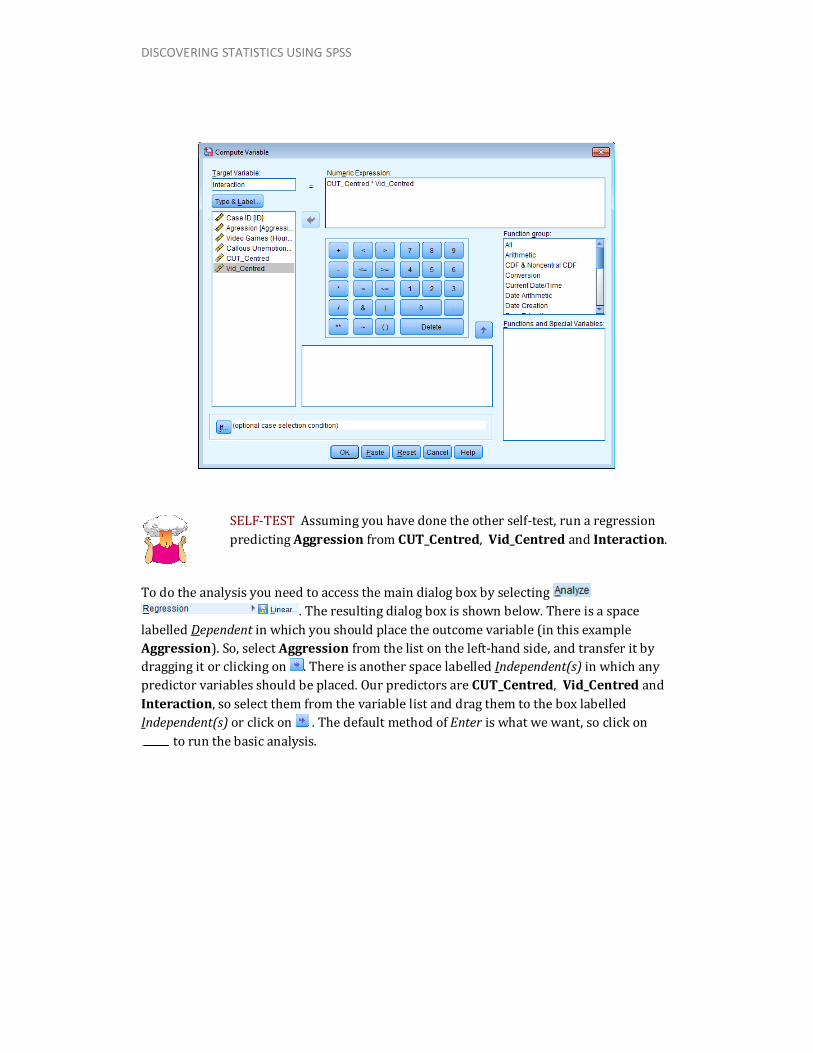
SELF-TEST Follow Oliver Twisted’s instructions to create the centred variables CUT_Centred and Vid_Centred. Then use the compute command to create a new variable called Interaction in the Video Games.sav file, which is CUT_Centred multiplied by Vid_Centred. To create the centred variables follow Oliver Twisted’s instructions for this chapter. I’ll assume that you have a version of the data file Video Games.sav containing the centred versions of the predictors (CUT_Centred and Vid_Centred). To create the interaction term, access the compute dialog box by selecting and enter the name Interaction into the box labelled Target Variable (click on to give the variable a more descriptive name). Select the variable CUT_Centred and drag it across to the area labelled Numeric Expression, then click on and then select the variable
Vid_Centred and drag it across to the area labelled Numeric Expression. The completed dialog box is shown below. Click on and a new variable will be created called Interaction, the values of which are CUT_Centred multiplied by Vid_Centred.
DISCOVERING STATISTICS USING SPSS
SELF-TEST Assuming you have done the other self-test, run a regression predicting Aggression from CUT_Centred, Vid_Centred and Interaction.
To do the analysis you need to access the main dialog box by selecting . The resulting dialog box is shown below. There is a space labelled Dependent in which you should place the outcome variable (in this example Aggression). So, select Aggression from the list on the left-hand side, and transfer it by dragging it or clicking on . There is another space labelled Independent(s) in which any predictor variables should be placed. Our predictors are CUT_Centred, Vid_Centred and Interaction, so select them from the variable list and drag them to the box labelled Independent(s) or click on . The default method of Enter is what we want, so click on to run the basic analysis.

DISCOVERING STATISTICS USING SPSS
SELF-TEST Assuming you did the previous self-test, compare the table of coefficients that you got with those in Output 10.1.
The output below shows the regression coefficients from the regression analysis that you ran using the centred versions of callous traits and hours spent gaming and their interaction as predictors. Basically, the regression coefficients are identical to those in Output 10.1 from using PROCESS. The standard errors differ a little from those from PROCESS, but that’s because when we used PROCESS we asked for heteroscedasticity-consistent standard errors, consequently the t-values are slightly different too (because these are computed from the standard errors: b/SE). The basic conclusion is the same though: there is a significant moderation effect as shown by the significant interaction between hours spent gaming and callous unemotional traits.
DISCOVERING STATISTICS USING SPSS
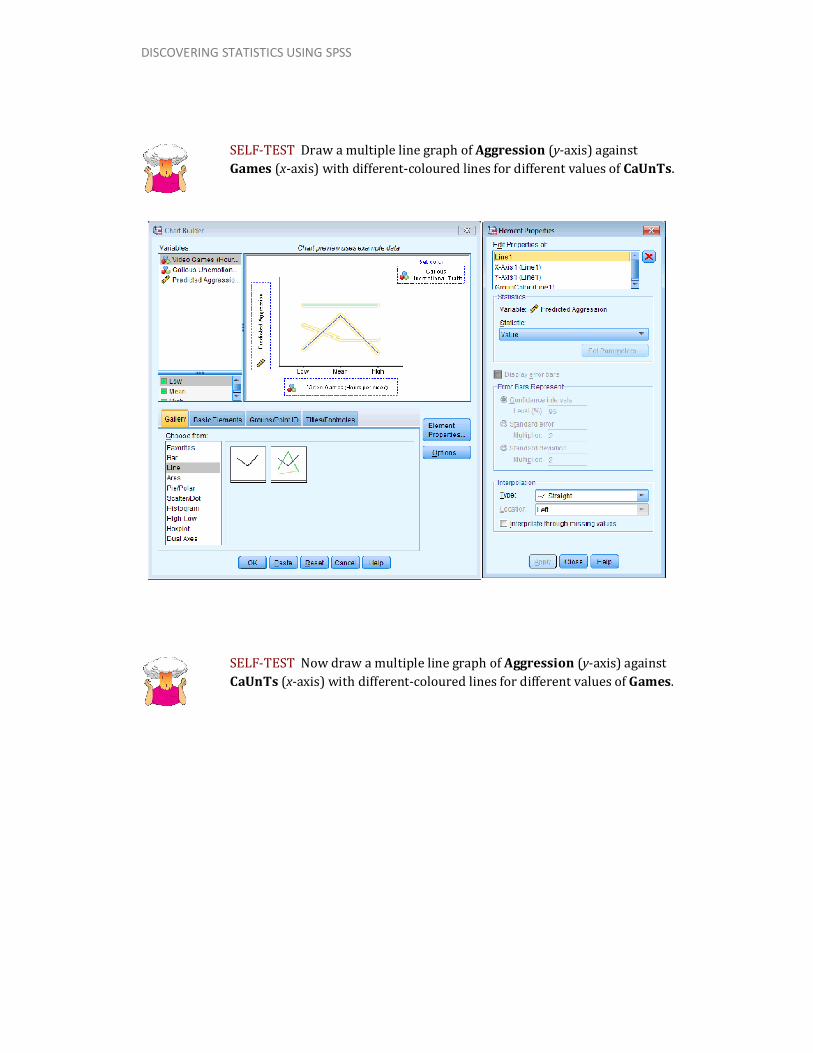
SELF-TEST Draw a multiple line graph of Aggression (y-axis) against Games (x-axis) with different-coloured lines for different values of CaUnTs.
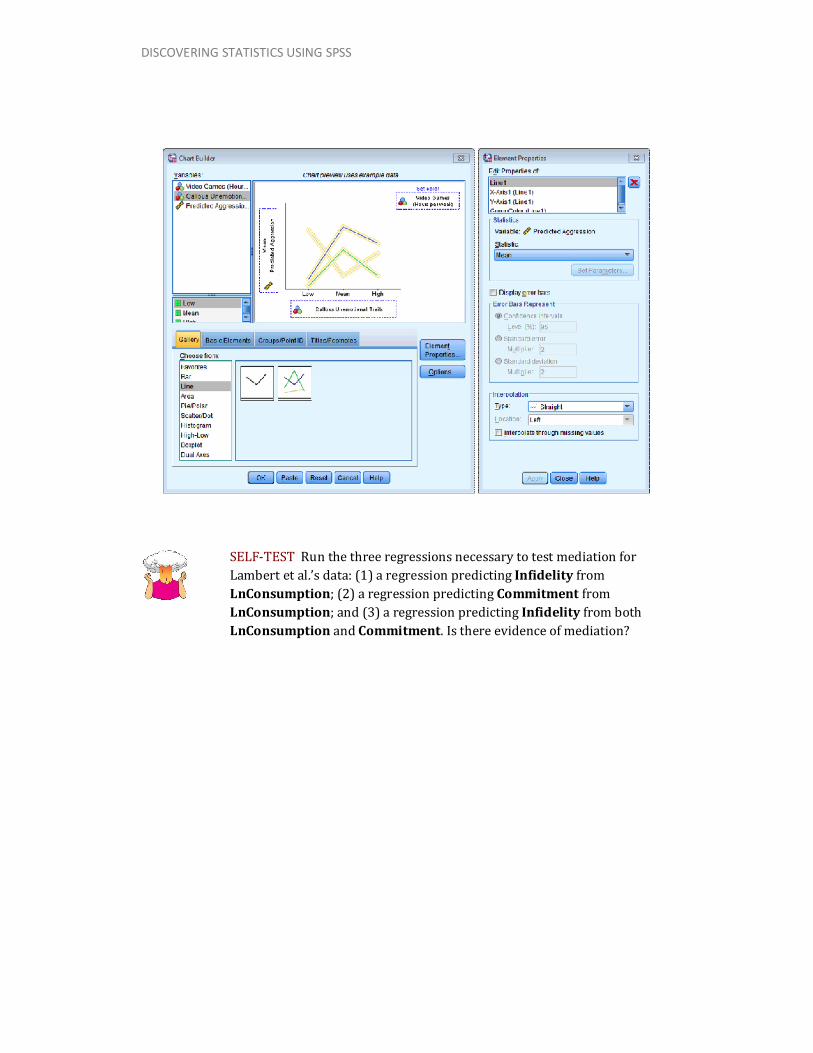
SELF-TEST Now draw a multiple line graph of Aggression (y-axis) against CaUnTs (x-axis) with different-coloured lines for different values of Games.
DISCOVERING STATISTICS USING SPSS
SELF-TEST Run the three regressions necessary to test mediation for Lambert et al.’s data: (1) a regression predicting Infidelity from LnConsumption; (2) a regression predicting Commitment from LnConsumption; and (3) a regression predicting Infidelity from both LnConsumption and Commitment. Is there evidence of mediation?
DISCOVERING STATISTICS USING SPSS
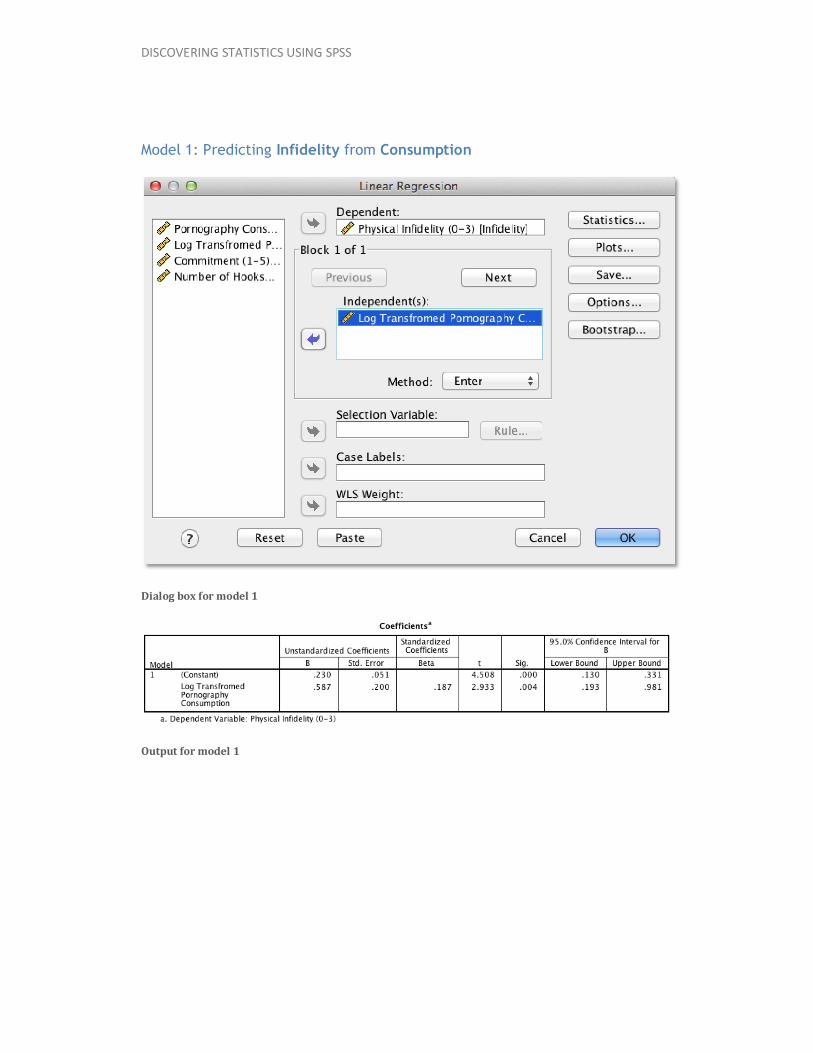
Model 1: Predicting Infidelity from Consumption
Dialog box for model 1
Output for model 1
DISCOVERING STATISTICS USING SPSS
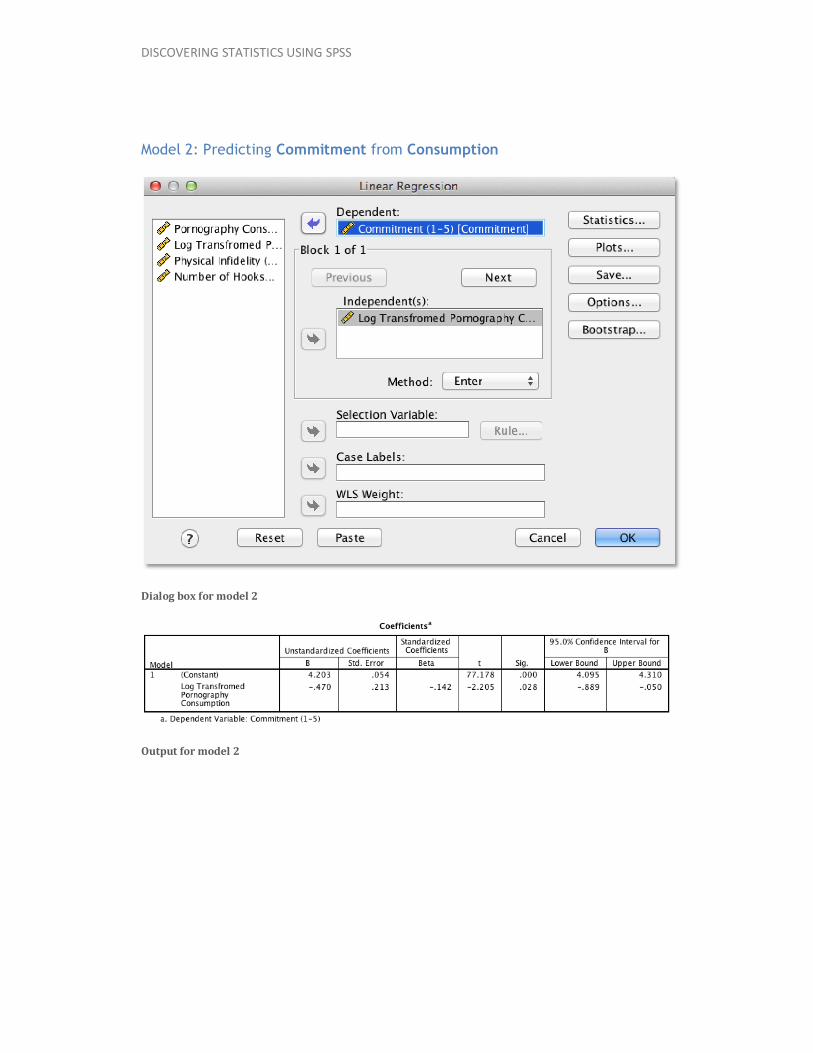
Model 2: Predicting Commitment from Consumption
Dialog box for model 2
Output for model 2
DISCOVERING STATISTICS USING SPSS
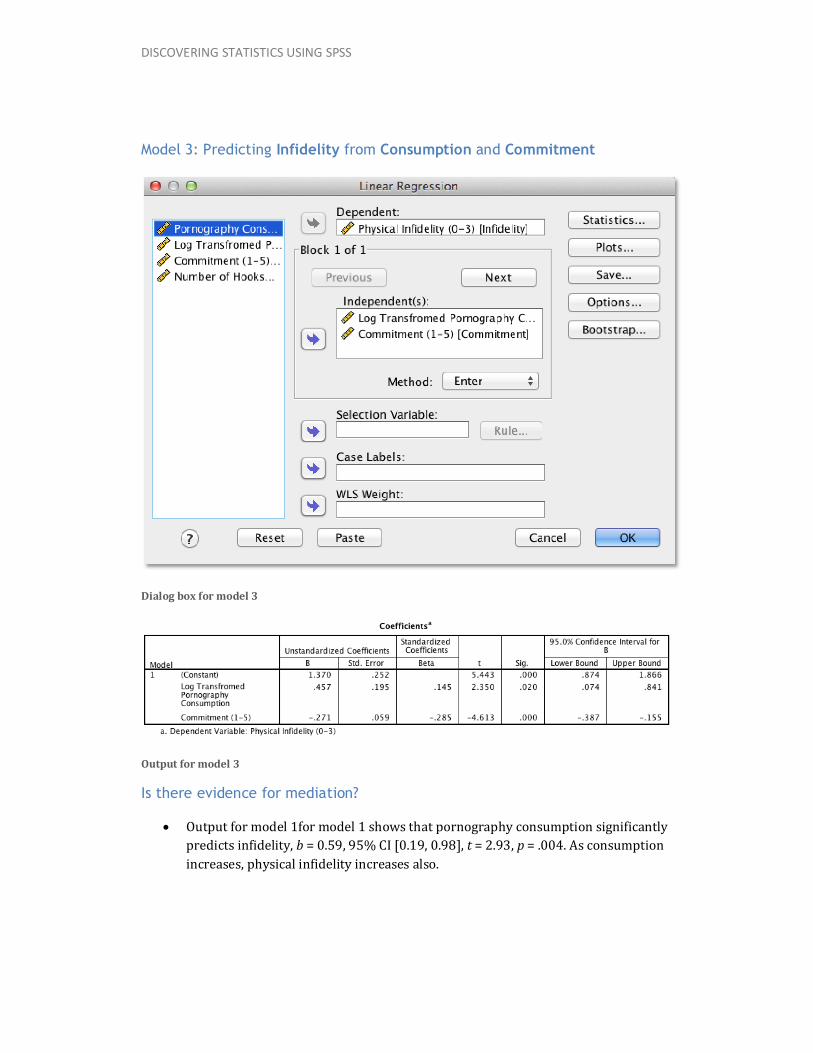
Model 3: Predicting Infidelity from Consumption and Commitment
Dialog box for model 3
Output for model 3
Is there evidence for mediation?
• Output for model 1for model 1 shows that pornography consumption significantly predicts infidelity, b = 0.59, 95% CI [0.19, 0.98], t = 2.93, p = .004. As consumption increases, physical infidelity increases also.

DISCOVERING STATISTICS USING SPSS
• Output for model 1for model 2 shows that pornography consumption significantly predicts relationship commitment, b = −0.47, 95% CI [−0.89, −0.05], t = −2.21, p = .028. As pornography consumption increases, commitment declines. • Output for model 1for model 3 shows that relationship commitment significantly predicts infidelity, b = −0.27, 95% CI [−0.39, −0.16], t = −4.61, p < .001. As relationship commitment increases, physical infidelity declines. • The relationship between pornography consumption and infidelity is stronger in model 1, b = 0.59, than in model 3, b = 0.46. As such, the four conditions of mediation have been met.
SELF-TEST Try creating the remaining two dummy variables (call them Metaller and Indie_Kid) using the same principles.
Select to access the recode dialog box. Select the variable you want to recode (in this case music) and transfer it to the box labelled Numeric Variable → Output Variable by clicking on . You then need to name the new variable. Go to the part that says Output Variable and in the box below where it says Name write a name for your second dummy variable (call it Metaller). You can also give this variable a more descriptive name by typing something in the box labelled Label (for this first dummy variable I’ve called it No Affiliation vs. Metaller). When you’ve done this, click on to transfer this new variable to the box labelled Numeric Variable → Output Variable (this box should now say music → Metaller).
DISCOVERING STATISTICS USING SPSS
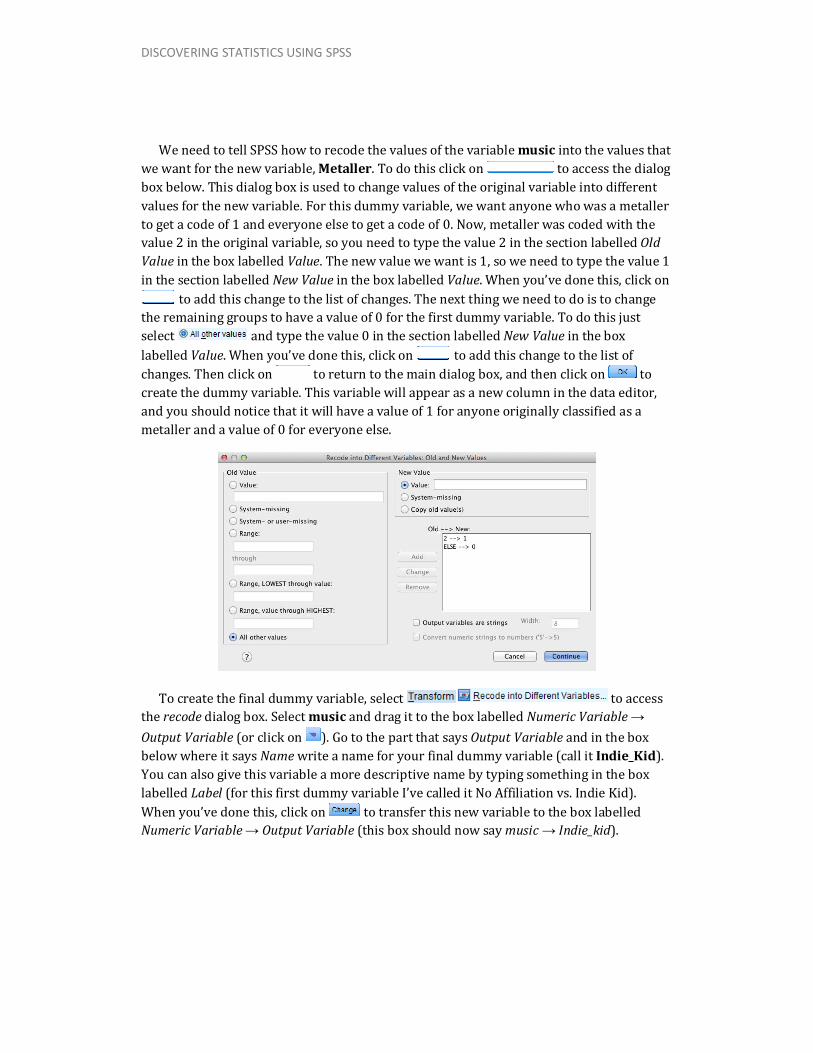
We need to tell SPSS how to recode the values of the variable music into the values that we want for the new variable, Metaller. To do this click on to access the dialog box below. This dialog box is used to change values of the original variable into different values for the new variable. For this dummy variable, we want anyone who was a metaller to get a code of 1 and everyone else to get a code of 0. Now, metaller was coded with the value 2 in the original variable, so you need to type the value 2 in the section labelled Old Value in the box labelled Value. The new value we want is 1, so we need to type the value 1 in the section labelled New Value in the box labelled Value. When you’ve done this, click on to add this change to the list of changes. The next thing we need to do is to change the remaining groups to have a value of 0 for the first dummy variable. To do this just select and type the value 0 in the section labelled New Value in the box labelled Value. When you’ve done this, click on to add this change to the list of changes. Then click on to return to the main dialog box, and then click on to create the dummy variable. This variable will appear as a new column in the data editor, and you should notice that it will have a value of 1 for anyone originally classified as a metaller and a value of 0 for everyone else.
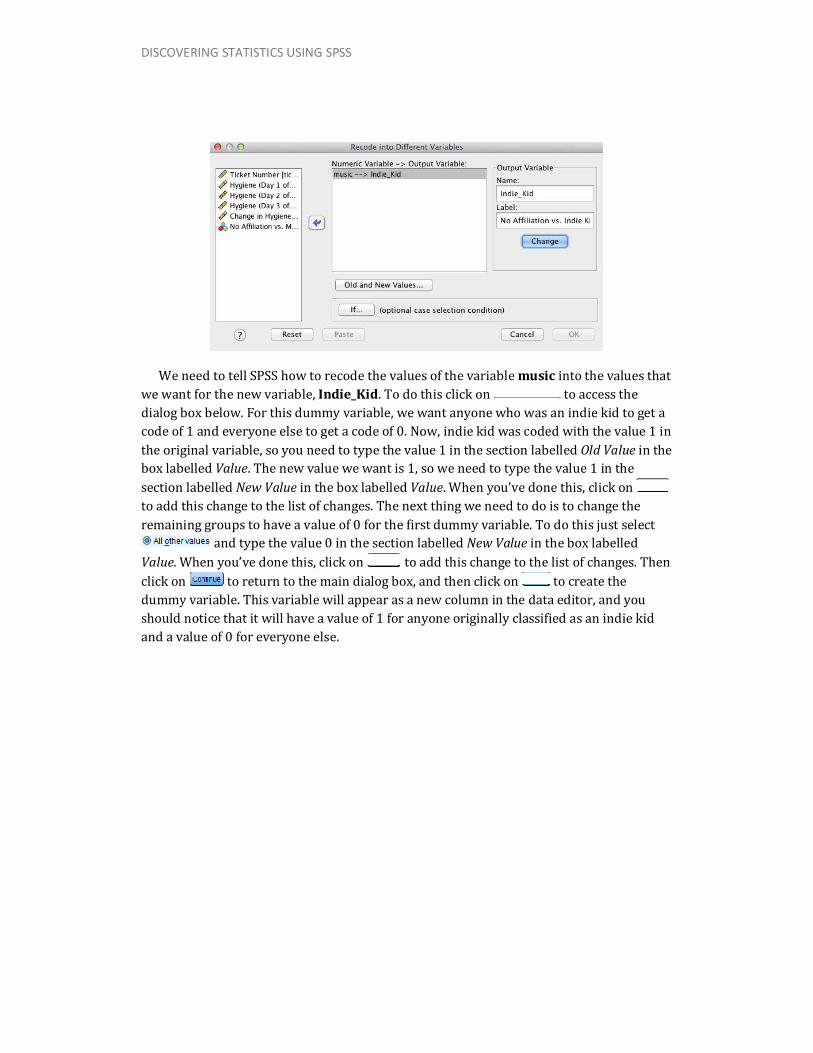
To create the final dummy variable, select to access the recode dialog box. Select music and drag it to the box labelled Numeric Variable → Output Variable (or click on ). Go to the part that says Output Variable and in the box below where it says Name write a name for your final dummy variable (call it Indie_Kid). You can also give this variable a more descriptive name by typing something in the box labelled Label (for this first dummy variable I’ve called it No Affiliation vs. Indie Kid). When you’ve done this, click on to transfer this new variable to the box labelled Numeric Variable → Output Variable (this box should now say music → Indie_kid).
DISCOVERING STATISTICS USING SPSS
We need to tell SPSS how to recode the values of the variable music into the values that we want for the new variable, Indie_Kid. To do this click on to access the dialog box below. For this dummy variable, we want anyone who was an indie kid to get a code of 1 and everyone else to get a code of 0. Now, indie kid was coded with the value 1 in the original variable, so you need to type the value 1 in the section labelled Old Value in the box labelled Value. The new value we want is 1, so we need to type the value 1 in the section labelled New Value in the box labelled Value. When you’ve done this, click on to add this change to the list of changes. The next thing we need to do is to change the remaining groups to have a value of 0 for the first dummy variable. To do this just select and type the value 0 in the section labelled New Value in the box labelled Value. When you’ve done this, click on to add this change to the list of changes. Then click on to return to the main dialog box, and then click on to create the dummy variable. This variable will appear as a new column in the data editor, and you should notice that it will have a value of 1 for anyone originally classified as an indie kid and a value of 0 for everyone else.
DISCOVERING STATISTICS USING SPSS
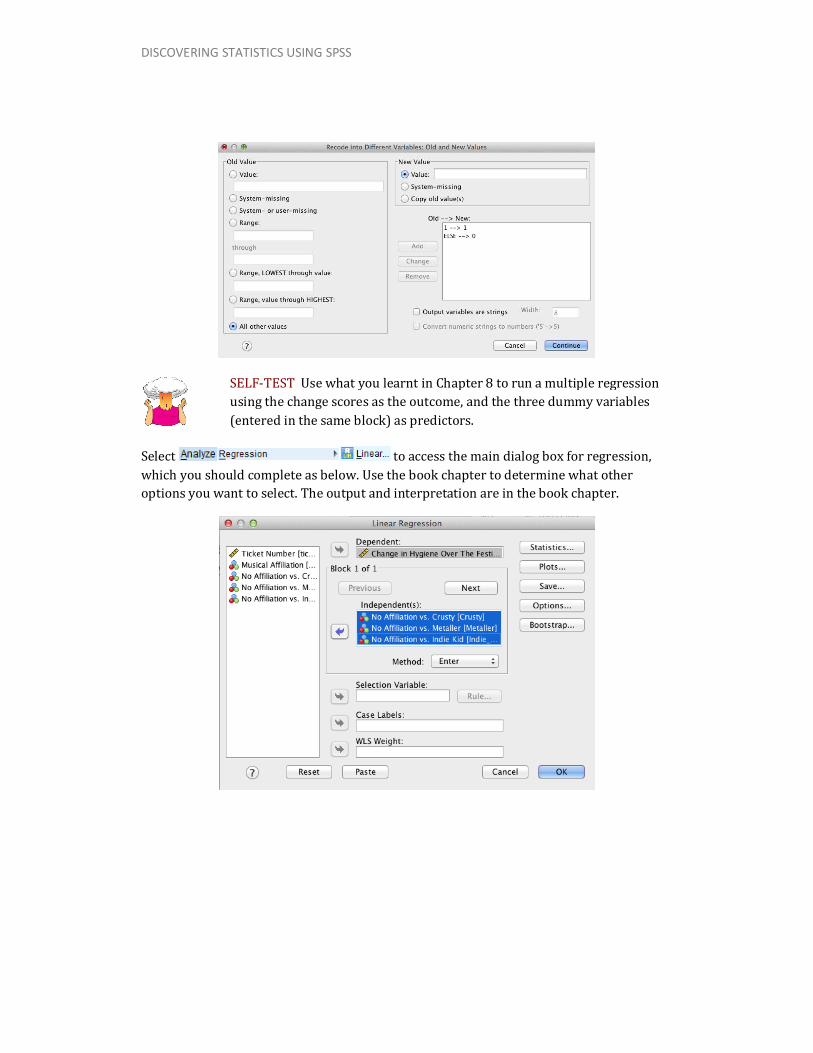
SELF-TEST Use what you learnt in Chapter 8 to run a multiple regression using the change scores as the outcome, and the three dummy variables (entered in the same block) as predictors. Select to access the main dialog box for regression, which you should complete as below. Use the book chapter to determine what other options you want to select. The output and interpretation are in the book chapter.