Embed Size (px)
Citation preview
Chapter 10. Monitoring of marine mammals in the framework of the construction and exploitation of offshore wind farms in Belgian marine water
Jan Haelters
Management Unit of the North Sea Mathematical Models (MUMM), Gulledelle 100, Brussels, Belgium
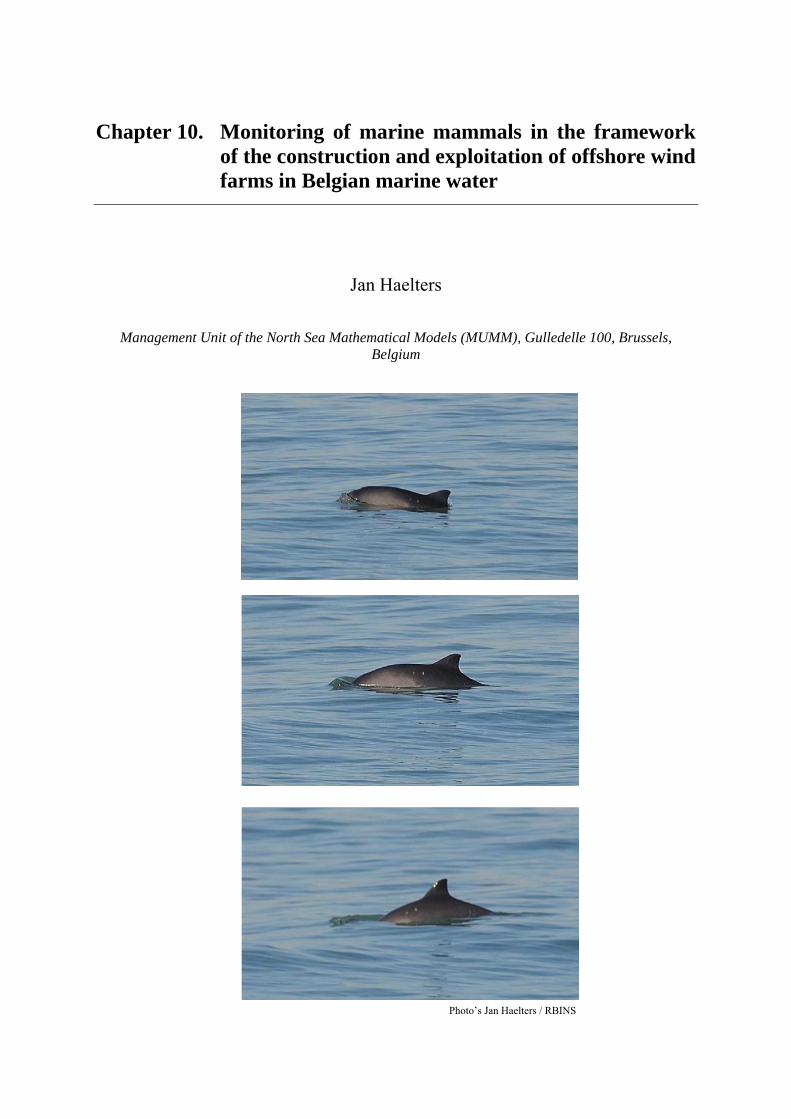
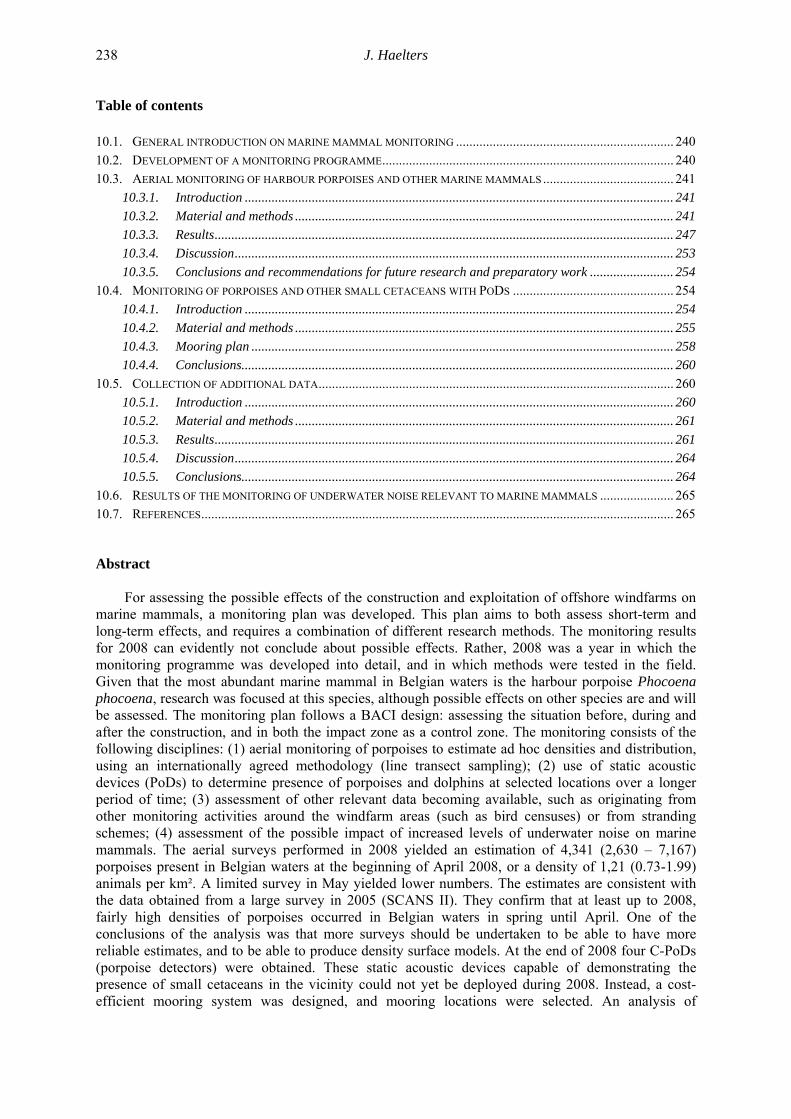
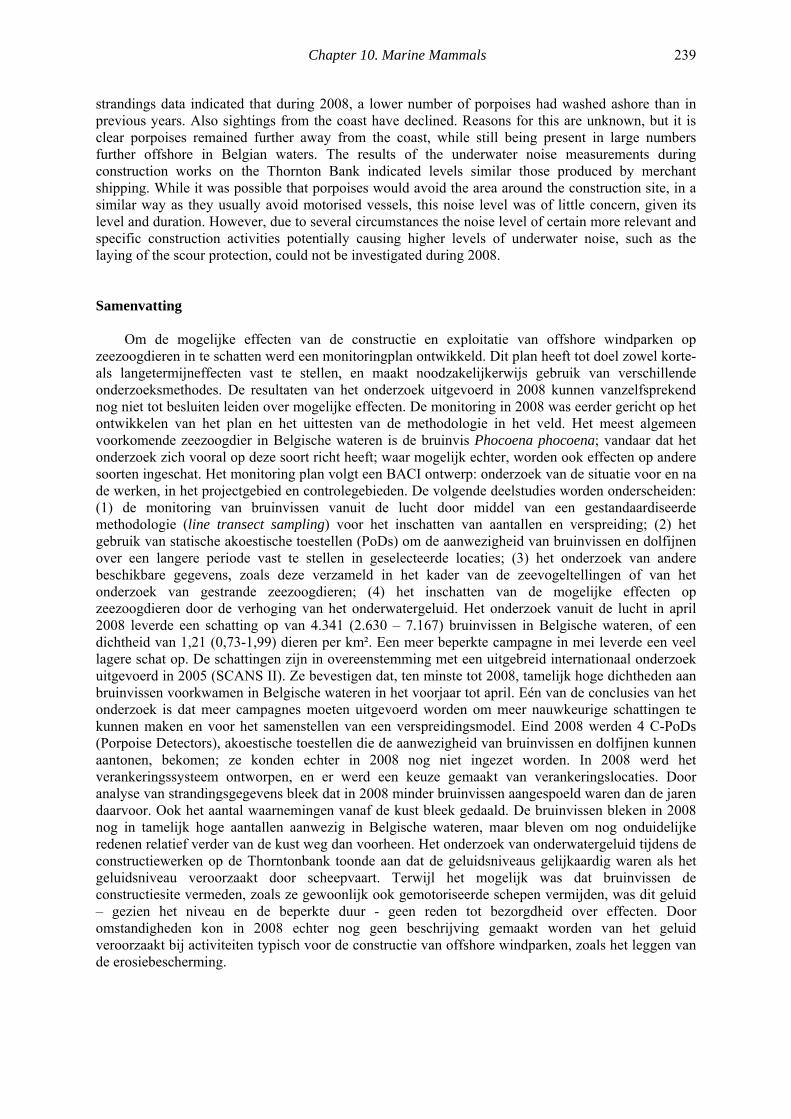
Photo’s Jan Haelters / RBINS
J. Haelters
238
Table of contents
10.1. GENERAL INTRODUCTION ON MARINE MAMMAL MONITORING ................................................................. 240 10.2. DEVELOPMENT OF A MONITORING PROGRAMME....................................................................................... 240 10.3. AERIAL MONITORING OF HARBOUR PORPOISES AND OTHER MARINE MAMMALS ....................................... 241
10.3.1. Introduction ................................................................................................................................ 241 10.3.2. Material and methods ................................................................................................................. 241 10.3.3. Results......................................................................................................................................... 247 10.3.4. Discussion................................................................................................................................... 253 10.3.5. Conclusions and recommendations for future research and preparatory work ......................... 254
10.4. MONITORING OF PORPOISES AND OTHER SMALL CETACEANS WITH PODS ................................................ 254 10.4.1. Introduction ................................................................................................................................ 254 10.4.2. Material and methods ................................................................................................................. 255 10.4.3. Mooring plan .............................................................................................................................. 258 10.4.4. Conclusions................................................................................................................................. 260
10.5. COLLECTION OF ADDITIONAL DATA.......................................................................................................... 260 10.5.1. Introduction ................................................................................................................................ 260 10.5.2. Material and methods ................................................................................................................. 261 10.5.3. Results......................................................................................................................................... 261 10.5.4. Discussion................................................................................................................................... 264 10.5.5. Conclusions................................................................................................................................. 264
10.6. RESULTS OF THE MONITORING OF UNDERWATER NOISE RELEVANT TO MARINE MAMMALS ...................... 265 10.7. REFERENCES............................................................................................................................................. 265
Abstract For assessing the possible effects of the construction and exploitation of offshore windfarms on
marine mammals, a monitoring plan was developed. This plan aims to both assess short-term and long-term effects, and requires a combination of different research methods. The monitoring results for 2008 can evidently not conclude about possible effects. Rather, 2008 was a year in which the monitoring programme was developed into detail, and in which methods were tested in the field. Given that the most abundant marine mammal in Belgian waters is the harbour porpoise Phocoena phocoena, research was focused at this species, although possible effects on other species are and will be assessed. The monitoring plan follows a BACI design: assessing the situation before, during and after the construction, and in both the impact zone as a control zone. The monitoring consists of the following disciplines: (1) aerial monitoring of porpoises to estimate ad hoc densities and distribution, using an internationally agreed methodology (line transect sampling); (2) use of static acoustic devices (PoDs) to determine presence of porpoises and dolphins at selected locations over a longer period of time; (3) assessment of other relevant data becoming available, such as originating from other monitoring activities around the windfarm areas (such as bird censuses) or from stranding schemes; (4) assessment of the possible impact of increased levels of underwater noise on marine mammals. The aerial surveys performed in 2008 yielded an estimation of 4,341 (2,630 – 7,167) porpoises present in Belgian waters at the beginning of April 2008, or a density of 1,21 (0.73-1.99) animals per km². A limited survey in May yielded lower numbers. The estimates are consistent with the data obtained from a large survey in 2005 (SCANS II). They confirm that at least up to 2008, fairly high densities of porpoises occurred in Belgian waters in spring until April. One of the conclusions of the analysis was that more surveys should be undertaken to be able to have more reliable estimates, and to be able to produce density surface models. At the end of 2008 four C-PoDs (porpoise detectors) were obtained. These static acoustic devices capable of demonstrating the presence of small cetaceans in the vicinity could not yet be deployed during 2008. Instead, a cost-efficient mooring system was designed, and mooring locations were selected. An analysis of
Chapter 10. Marine Mammals 239
strandings data indicated that during 2008, a lower number of porpoises had washed ashore than in previous years. Also sightings from the coast have declined. Reasons for this are unknown, but it is clear porpoises remained further away from the coast, while still being present in large numbers further offshore in Belgian waters. The results of the underwater noise measurements during construction works on the Thornton Bank indicated levels similar those produced by merchant shipping. While it was possible that porpoises would avoid the area around the construction site, in a similar way as they usually avoid motorised vessels, this noise level was of little concern, given its level and duration. However, due to several circumstances the noise level of certain more relevant and specific construction activities potentially causing higher levels of underwater noise, such as the laying of the scour protection, could not be investigated during 2008.
Samenvatting Om de mogelijke effecten van de constructie en exploitatie van offshore windparken op
zeezoogdieren in te schatten werd een monitoringplan ontwikkeld. Dit plan heeft tot doel zowel korte- als langetermijneffecten vast te stellen, en maakt noodzakelijkerwijs gebruik van verschillende onderzoeksmethodes. De resultaten van het onderzoek uitgevoerd in 2008 kunnen vanzelfsprekend nog niet tot besluiten leiden over mogelijke effecten. De monitoring in 2008 was eerder gericht op het ontwikkelen van het plan en het uittesten van de methodologie in het veld. Het meest algemeen voorkomende zeezoogdier in Belgische wateren is de bruinvis Phocoena phocoena; vandaar dat het onderzoek zich vooral op deze soort richt heeft; waar mogelijk echter, worden ook effecten op andere soorten ingeschat. Het monitoring plan volgt een BACI ontwerp: onderzoek van de situatie voor en na de werken, in het projectgebied en controlegebieden. De volgende deelstudies worden onderscheiden: (1) de monitoring van bruinvissen vanuit de lucht door middel van een gestandaardiseerde methodologie (line transect sampling) voor het inschatten van aantallen en verspreiding; (2) het gebruik van statische akoestische toestellen (PoDs) om de aanwezigheid van bruinvissen en dolfijnen over een langere periode vast te stellen in geselecteerde locaties; (3) het onderzoek van andere beschikbare gegevens, zoals deze verzameld in het kader van de zeevogeltellingen of van het onderzoek van gestrande zeezoogdieren; (4) het inschatten van de mogelijke effecten op zeezoogdieren door de verhoging van het onderwatergeluid. Het onderzoek vanuit de lucht in april 2008 leverde een schatting op van 4.341 (2.630 – 7.167) bruinvissen in Belgische wateren, of een dichtheid van 1,21 (0,73-1,99) dieren per km². Een meer beperkte campagne in mei leverde een veel lagere schat op. De schattingen zijn in overeenstemming met een uitgebreid internationaal onderzoek uitgevoerd in 2005 (SCANS II). Ze bevestigen dat, ten minste tot 2008, tamelijk hoge dichtheden aan bruinvissen voorkwamen in Belgische wateren in het voorjaar tot april. Eén van de conclusies van het onderzoek is dat meer campagnes moeten uitgevoerd worden om meer nauwkeurige schattingen te kunnen maken en voor het samenstellen van een verspreidingsmodel. Eind 2008 werden 4 C-PoDs (Porpoise Detectors), akoestische toestellen die de aanwezigheid van bruinvissen en dolfijnen kunnen aantonen, bekomen; ze konden echter in 2008 nog niet ingezet worden. In 2008 werd het verankeringssysteem ontworpen, en er werd een keuze gemaakt van verankeringslocaties. Door analyse van strandingsgegevens bleek dat in 2008 minder bruinvissen aangespoeld waren dan de jaren daarvoor. Ook het aantal waarnemingen vanaf de kust bleek gedaald. De bruinvissen bleken in 2008 nog in tamelijk hoge aantallen aanwezig in Belgische wateren, maar bleven om nog onduidelijke redenen relatief verder van de kust weg dan voorheen. Het onderzoek van onderwatergeluid tijdens de constructiewerken op de Thorntonbank toonde aan dat de geluidsniveaus gelijkaardig waren als het geluidsniveau veroorzaakt door scheepvaart. Terwijl het mogelijk was dat bruinvissen de constructiesite vermeden, zoals ze gewoonlijk ook gemotoriseerde schepen vermijden, was dit geluid – gezien het niveau en de beperkte duur - geen reden tot bezorgdheid over effecten. Door omstandigheden kon in 2008 echter nog geen beschrijving gemaakt worden van het geluid veroorzaakt bij activiteiten typisch voor de constructie van offshore windparken, zoals het leggen van de erosiebescherming.
J. Haelters
240
10.1. General introduction on marine mammal monitoring
The environmental impact assessment of the construction and exploitation of offshore windfarms in Belgian waters concluded that gaps in knowledge existed concerning their possible environmental effects on marine mammals, but that effects were possible. Consequently, a monitoring plan was developed. Monitoring the effect is a prerequisite for the validity of the construction permit and exploitation licence. All marine mammals are protected species, for which Belgium made commit-ments in international fora to avoid negative impacts as much as possible. Monitoring the effects of certain activities on these animals is also a legal obligation under international law, amongst which the Habitats Directive1.
The most abundant marine mammal in Belgian waters is the harbour porpoise Phocoena phocoena. Other indigenous species which occur in the area are common seal Phoca vitulina, grey seal Halichoerus grypus, bottlenose dolphin Tursiops truncatus and white-beaked dolphin Lagenorhynchus albirostris (www.mumm.ac.be; Camphuysen & Peet, 2007; SCANS II, 2008; Haelters, 2007). Given that these other species are far less numerous, and some of them remain fairly coastal, monitoring of the effects of the construction and exploitation of offshore windfarms will focus on the harbour porpoise. It has been demonstrated that seasonally relatively high densities of this species can occur in Belgian waters (Depestele et al., 2008; Haelters & Camphuysen, 2009). Moreover, this is a species which is particularly sensitive to disturbance, amongst others originating from underwater noise (MUMM, 2004; MUMM, 2007). However, any information on marine mammals other than porpoises becoming available will be reported.
Through the monitoring we will aim at assessing the short-term and long-term effects of the construction and exploitation of offshore windfarms on marine mammals. The monitoring programme aims at finding out whether these activities have a measurable effect on porpoises and possibly also on other marine mammals. Given the changes in marine mammal populations we have observed in the last years (Haelters & Camphuysen, 2009), and the difficulties in studying marine mammals in the wild, this is a very challenging task, requiring a suite of methods.
This document reports on the preparatory activities for the monitoring, and on the results of the monitoring in 2008. There is a steep learning curve for the different monitoring disciplines, and more detailed investigations will be conducted over the years to come. Some of the monitoring, such as the one with passive acoustic devices, needs to be started in the field in 2009. Although this monitoring is predominantly of a long-term nature, the possibility of acute impacts should not be excluded, especially during the construction phases of the projects.
It is clear that the monitoring results presented here are preliminary, and cannot yet conclude about effects. Rather they should be considered as a description of the monitoring programme which will be continued over the following years. We will only be able to present more elaborated conclusions on the impacts on marine mammals after several years.
Given the subject of this report, the wide-ranging nature of marine mammals, and the initial development of only one of the windfarms in 2008, it has not been possible to subdivide every part of this report into sections for each of the windfarm areas separately. Moreover, the inaccuracy of our knowledge on that matter makes (and will make) such a spatial segregation in many cases very difficult.
10.2. Development of a monitoring programme
Assessing the effects of the construction and exploitation of offshore windfarms on marine mammals is not straightforward. A monitoring programme should be developed to obtain data before and during the construction phase, and during the exploitation phase, both within and outside the windfarm area (BACI design: before-after, control-impact zone). Moreover, to be able to identify cause-effect relationships, data should be collected not only on porpoises and other marine mammals, but also on relevant physical and biological changes occurring in the marine environment due to the construction and exploitation of the wind turbines.
1 European Directive EC/92/43
Chapter 10. Marine Mammals 241
Such a monitoring programme is clearly multidisciplinary and different techniques need to be used. In 2008, the first phase mainly consisted of the development of the monitoring strategy and of the development and fine-tuning of the methodology. In many cases the monitoring methods have been developed only recently. The different disciplines of the monitoring programme can be summarised as follows. They are dealt with in detail in the following chapters of this report.
1) Aerial monitoring of porpoises (and other marine mammals): regular assessment of
numbers and densities over a large area, including the windfarm areas; in combination with density surface modelling, distribution maps will be prepared – these can only give an ad hoc impression of local densities and distribution of marine mammals in Belgian waters.
2) Monitoring of porpoises and dolphins with passive, static acoustic devices (porpoise detectors or PoDs), complementary to aerial surveys: estimation of the relative abundance of porpoises over a longer period, in the windfarm areas and in adjacent areas.
3) Other monitoring activities, such as bird surveys in and around wind farms, or the assessment of strandings data, can yield additional information on marine mammals.
4) The investigations of the underwater noise level during the construction and exploitation phases (see Chapter 3), together with the results of the research described above and the consultation of literature, can lead to the identification of possible short-term and long-term effects.
Prior to the execution of the monitoring programme, detailed protocols, which are similar to the
protocols used in neighboring countries, were prepared for disciplines 1, 2 and 4 (MUMM, 2008a; b; c). Subsequently the field work was started. Where necessary the protocols will be adjusted – therefore these should be considered as dynamic documents.
Individually and in combination the results of the studies described in this report can provide qualitative and quantitative information of the effects on marine mammals, and especially on harbour porpoises. Consequently, they will provide a basis for the possible adjustment of activities in relation to the construction and exploitation of windfarms, and the establishment of relevant preventive actions and mitigation measures. Such measures can consist of alternative foundations to be used in the future, or the use of systems limiting underwater noise.
10.3. Aerial monitoring of harbour porpoises and other marine mammals
10.3.1. Introduction
Different methods to assess the population size, density and distribution of marine mammals exist. A cost-efficient means is the aerial monitoring through standardised line-transect surveys (SCANS II, 2008). In a protocol (MUMM, 2008a) the basic principles of line transect surveys are described, together with technical details on the monitoring itself and on the data analysis. A summary of the protocol is presented below.
10.3.2. Material and methods
10.3.2.1. Aerial line transect sampling
Aerial surveys have important advantages over other types of survey, such as ship-based surveys. Compared to ship-based surveys, an aerial survey can cover a much larger area in a similar stretch of time, and is independent of water depths or restricted shipping areas.
In executing aerial monitoring flights, it is important to use a methodology that can be repeated, that yields data that can be analysed in a standardised way, and that is internationally accepted. The theoretical background of the methodology used is line transect sampling (Buckland et al., 2001).
J. Haelters
242
This background was used for the methodology of the aerial monitoring in the 2005 SCANS II project, in which numbers and distribution of small cetaceans in the North Sea and the adjacent Atlantic Ocean were assessed (SCANS II, 2008). The SCANS protocol had to be simplified for this monitoring programme, due to technical and budgetary limitations.
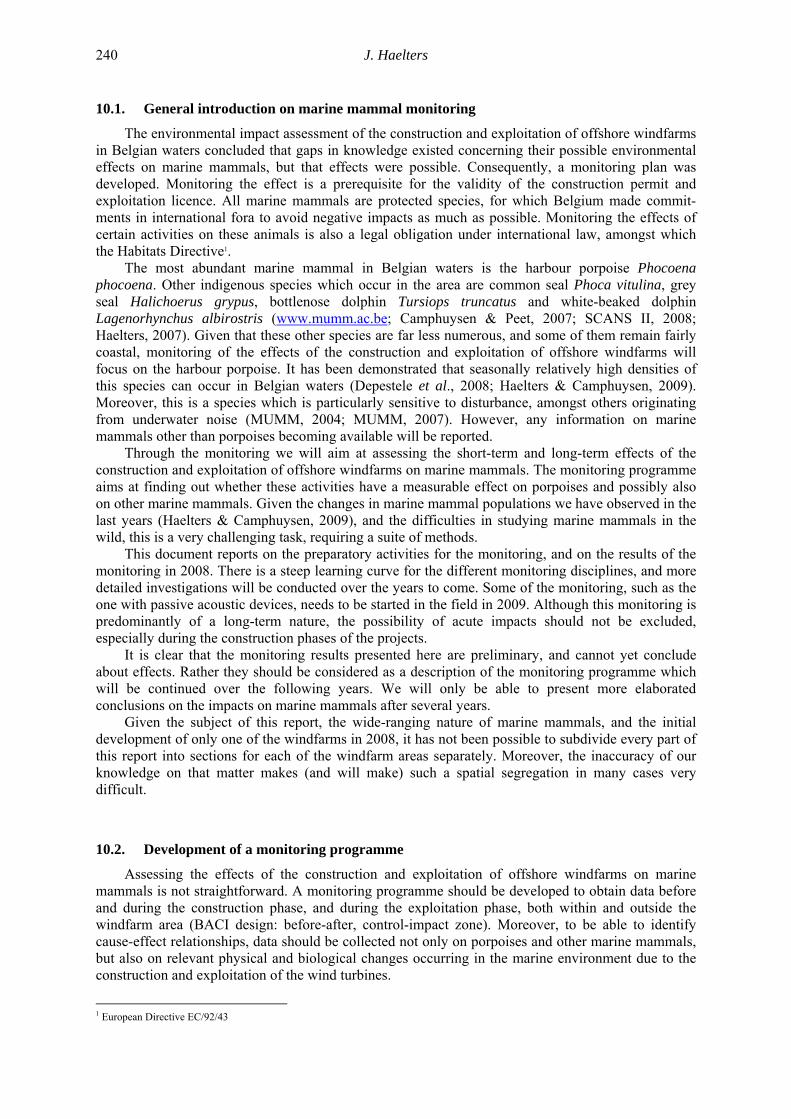
In aerial line transect sampling (figure 1), a series of independent tracks (line transects) are flown, during which sightings are recorded at non-predefined distances from the track line. The length of each transect is carefully recorded, together with the distances of sighted animals from the track line.
Figure 1. The principle of line transect sampling: determining perpendicular distances from the aircraft. To determine the perpendicular distance to the trackline, the altitude is recorded, and the angle θ
between the horizon and the perpendicular line to the animal(s) is measured. The perpendicular distance x is then given by:
( )θ−°×= 90tanhx
The largest observation distances may differ at the left and right side of the aircraft. Therefore all
observation distances are made positive, as if they were made on one side of the aircraft (all observations at the negative side are folded over the trackline) – as such, we obtain only one value for the largest observation distance presented by w. The fraction of the survey area covered by observers at the left and right side of the aircraft is 2wL, in which L indicates the total survey length and w the largest detection distance.
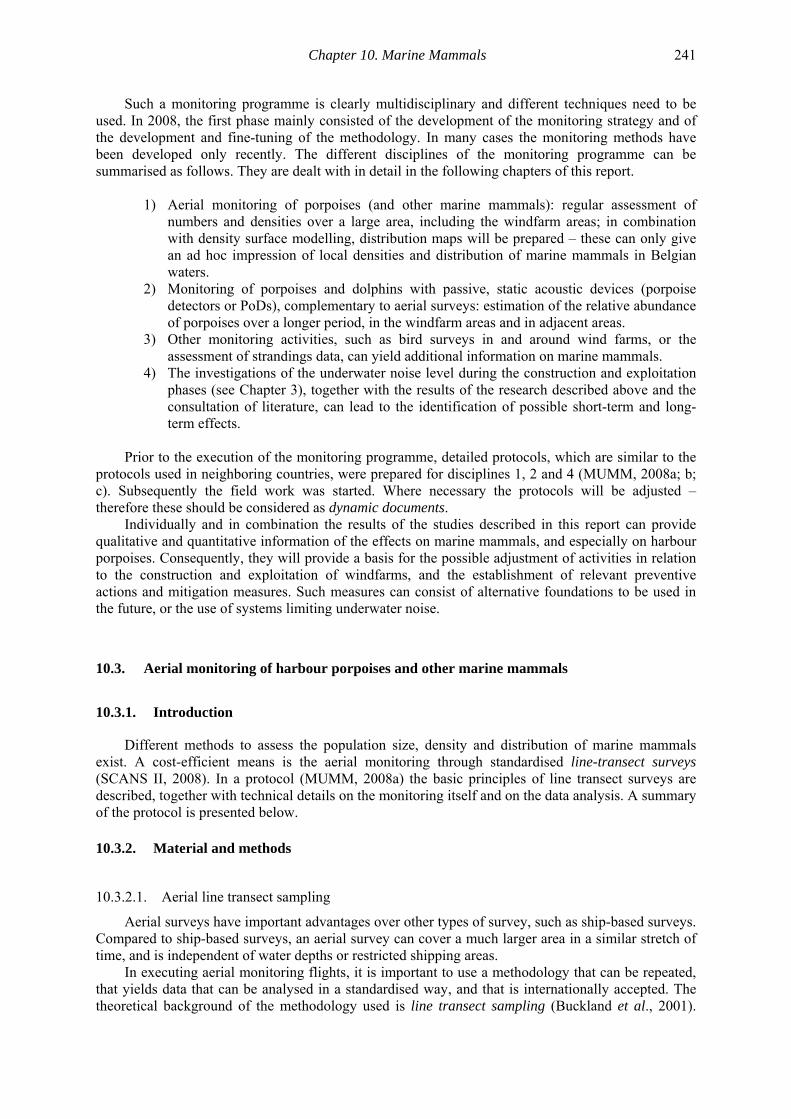
Not all animals are detected between distance 0 (underneath the aircraft) and w, even if we assume that all are at the surface. The probability of detection decreases with the increase in distance between the trackline and the animal(s). If enough observations are made in a survey, the probability of detecting a porpoise or a group of porpoises at a given distance x from the trackline can be described with a detection probability function g(x), in which we assume that g(0)=1 and 0 ≤ g(x) ≤ 1 (figure 2). This function can be used to estimate the proportion of animals missed.
Chapter 10. Marine Mammals 243
Figure 2. Illustration of the theoretical background of line transect sampling (simulated data): number of animals counted per distance interval (black boxes, left y-axis), detection probability function (red line, right y-axis); the detection probability function g(x) is forced through 1, and is strictly declining. The areas marked in blue have
the same surface (see text). The probability aP
) of detecting an animal would then be described as:
w
dxxg
gletanrecundersurfacecurveundersurfaceP
w
a ⋅==∫
1
)(0
) (1)
We define the effective half strip width µ (ESW) as the theoretical width of the track in which as many animals are not detected, as are detected outside this width (figure 2). For the ESW µ we can write:
∫=⋅w
xdxgµ0
)()(1 (2)
Equation (1) thus becomes:
wµPa =
) (3)
And the fraction of the survey area covered can be written as:
aPµLwL 22 = or µLwLPa 22 = (4)
In figure 2 and in the above equations we presumed that g(0)=1. This is not correct, as some visible animals on the track are missed by the observers - therefore g(0) will be smaller than 1. This deviation from g(0)=1 will be influenced by many factors, including the experience of the observer, and the length of time since the start of the flight (Southwell et al., 2007). Secondly, other animals are missed because they were not visible from above (e.g. diving). Therefore a second correction factor needs to be considered for g(0), which will be dependent on weather and monitoring conditions.
Taking account of g(0), and the above equations, the total number of animals N)
in the survey area A can be estimated as follows, with n as the total number of animals observed:
)0(1
2 gµLnAN =
) (5)
The density can be estimated accordingly. We assume that the detection probability of a group of porpoises and of a solitary porpoise are equal, and that the detection function is independent of the density of animals, their position in the survey area, and their activity.
J. Haelters
244
Although a double-observer line transect, in which two observers work independently at the same side of the aircraft, would be able to indicate the level of deviation from g(0)=1 for animals missed by observers, this would not be possible during the monitoring described here for technical reasons, and this bias is not further taken account of. The limited monitoring programme did not allow for an assessment of g(0) for animals missed given they were not visible from above: this would need a survey with two aircraft, or the systematic return to each sighted animal on the trackline.
10.3.2.2. Aerial platform
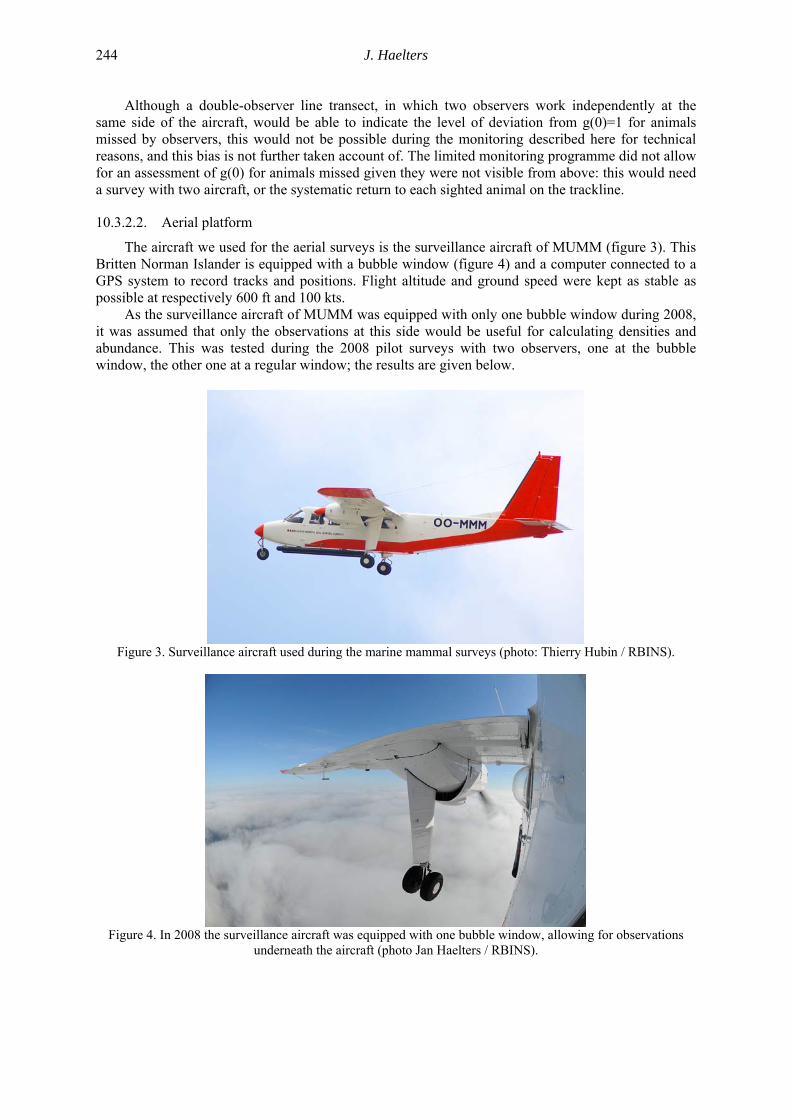
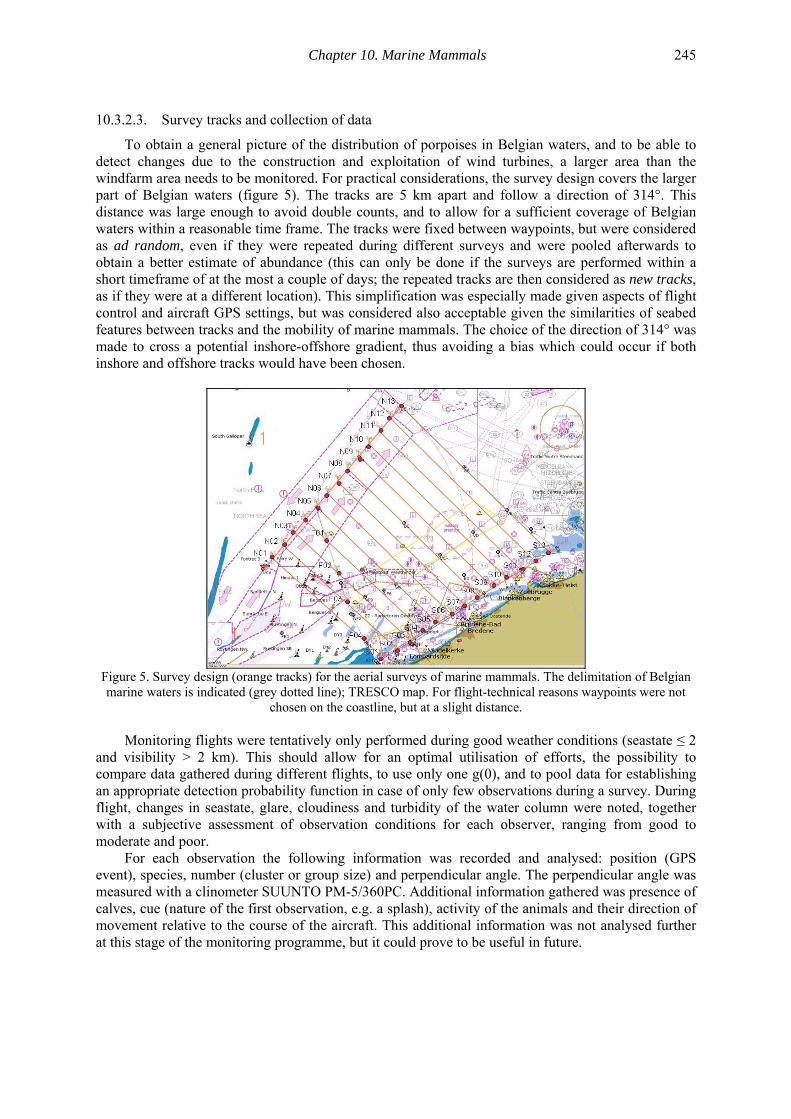
The aircraft we used for the aerial surveys is the surveillance aircraft of MUMM (figure 3). This Britten Norman Islander is equipped with a bubble window (figure 4) and a computer connected to a GPS system to record tracks and positions. Flight altitude and ground speed were kept as stable as possible at respectively 600 ft and 100 kts.
As the surveillance aircraft of MUMM was equipped with only one bubble window during 2008, it was assumed that only the observations at this side would be useful for calculating densities and abundance. This was tested during the 2008 pilot surveys with two observers, one at the bubble window, the other one at a regular window; the results are given below.
Figure 3. Surveillance aircraft used during the marine mammal surveys (photo: Thierry Hubin / RBINS).
Figure 4. In 2008 the surveillance aircraft was equipped with one bubble window, allowing for observations
underneath the aircraft (photo Jan Haelters / RBINS).
Chapter 10. Marine Mammals 245
10.3.2.3. Survey tracks and collection of data
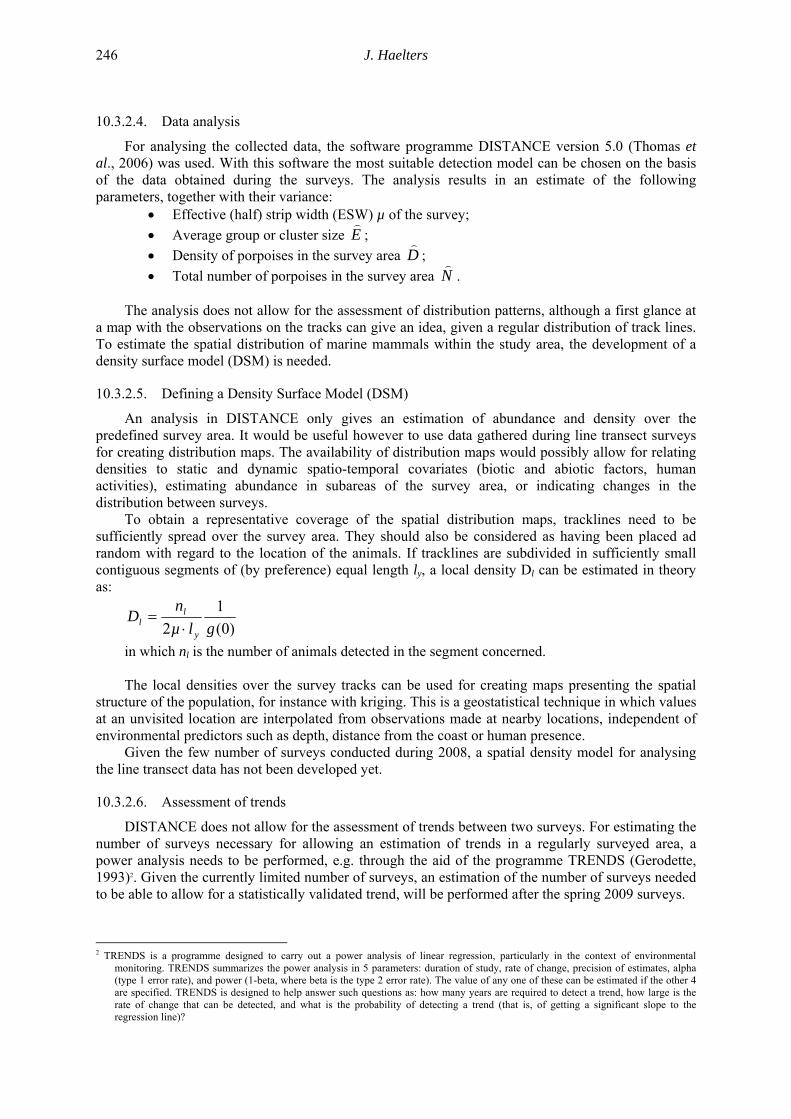
To obtain a general picture of the distribution of porpoises in Belgian waters, and to be able to detect changes due to the construction and exploitation of wind turbines, a larger area than the windfarm area needs to be monitored. For practical considerations, the survey design covers the larger part of Belgian waters (figure 5). The tracks are 5 km apart and follow a direction of 314°. This distance was large enough to avoid double counts, and to allow for a sufficient coverage of Belgian waters within a reasonable time frame. The tracks were fixed between waypoints, but were considered as ad random, even if they were repeated during different surveys and were pooled afterwards to obtain a better estimate of abundance (this can only be done if the surveys are performed within a short timeframe of at the most a couple of days; the repeated tracks are then considered as new tracks, as if they were at a different location). This simplification was especially made given aspects of flight control and aircraft GPS settings, but was considered also acceptable given the similarities of seabed features between tracks and the mobility of marine mammals. The choice of the direction of 314° was made to cross a potential inshore-offshore gradient, thus avoiding a bias which could occur if both inshore and offshore tracks would have been chosen.
Figure 5. Survey design (orange tracks) for the aerial surveys of marine mammals. The delimitation of Belgian marine waters is indicated (grey dotted line); TRESCO map. For flight-technical reasons waypoints were not
chosen on the coastline, but at a slight distance. Monitoring flights were tentatively only performed during good weather conditions (seastate ≤ 2
and visibility > 2 km). This should allow for an optimal utilisation of efforts, the possibility to compare data gathered during different flights, to use only one g(0), and to pool data for establishing an appropriate detection probability function in case of only few observations during a survey. During flight, changes in seastate, glare, cloudiness and turbidity of the water column were noted, together with a subjective assessment of observation conditions for each observer, ranging from good to moderate and poor.
For each observation the following information was recorded and analysed: position (GPS event), species, number (cluster or group size) and perpendicular angle. The perpendicular angle was measured with a clinometer SUUNTO PM-5/360PC. Additional information gathered was presence of calves, cue (nature of the first observation, e.g. a splash), activity of the animals and their direction of movement relative to the course of the aircraft. This additional information was not analysed further at this stage of the monitoring programme, but it could prove to be useful in future.
J. Haelters
246
10.3.2.4. Data analysis
For analysing the collected data, the software programme DISTANCE version 5.0 (Thomas et al., 2006) was used. With this software the most suitable detection model can be chosen on the basis of the data obtained during the surveys. The analysis results in an estimate of the following parameters, together with their variance:
• Effective (half) strip width (ESW) µ of the survey; • Average group or cluster size E
);
• Density of porpoises in the survey area D)
; • Total number of porpoises in the survey area N
).
The analysis does not allow for the assessment of distribution patterns, although a first glance at
a map with the observations on the tracks can give an idea, given a regular distribution of track lines. To estimate the spatial distribution of marine mammals within the study area, the development of a density surface model (DSM) is needed.
10.3.2.5. Defining a Density Surface Model (DSM)
An analysis in DISTANCE only gives an estimation of abundance and density over the predefined survey area. It would be useful however to use data gathered during line transect surveys for creating distribution maps. The availability of distribution maps would possibly allow for relating densities to static and dynamic spatio-temporal covariates (biotic and abiotic factors, human activities), estimating abundance in subareas of the survey area, or indicating changes in the distribution between surveys.
To obtain a representative coverage of the spatial distribution maps, tracklines need to be sufficiently spread over the survey area. They should also be considered as having been placed ad random with regard to the location of the animals. If tracklines are subdivided in sufficiently small contiguous segments of (by preference) equal length ly, a local density Dl can be estimated in theory as:
)0(1
2 glµn
Dy
ll ⋅=
in which nl is the number of animals detected in the segment concerned. The local densities over the survey tracks can be used for creating maps presenting the spatial
structure of the population, for instance with kriging. This is a geostatistical technique in which values at an unvisited location are interpolated from observations made at nearby locations, independent of environmental predictors such as depth, distance from the coast or human presence.
Given the few number of surveys conducted during 2008, a spatial density model for analysing the line transect data has not been developed yet.
10.3.2.6. Assessment of trends
DISTANCE does not allow for the assessment of trends between two surveys. For estimating the number of surveys necessary for allowing an estimation of trends in a regularly surveyed area, a power analysis needs to be performed, e.g. through the aid of the programme TRENDS (Gerodette, 1993)2. Given the currently limited number of surveys, an estimation of the number of surveys needed to be able to allow for a statistically validated trend, will be performed after the spring 2009 surveys.
2 TRENDS is a programme designed to carry out a power analysis of linear regression, particularly in the context of environmental
monitoring. TRENDS summarizes the power analysis in 5 parameters: duration of study, rate of change, precision of estimates, alpha (type 1 error rate), and power (1-beta, where beta is the type 2 error rate). The value of any one of these can be estimated if the other 4 are specified. TRENDS is designed to help answer such questions as: how many years are required to detect a trend, how large is the rate of change that can be detected, and what is the probability of detecting a trend (that is, of getting a significant slope to the regression line)?
Chapter 10. Marine Mammals 247
10.3.3. Results
10.3.3.1. Surveys
During 2008, five surveys were performed. At that moment some construction works were already ongoing on the Thornton Bank (the first foundation was placed on the seabed on 26 April 2008). These surveys should be considered as pilot surveys, in which it was important to test techniques, and if necessary adjust the protocol. An overview of the 2008 surveys is given in table 1.
Table 1 Overview of the 2008 aerial surveys for marine mammals. Time is given in UTC.
Flight number Date Take-off Start survey
Stop survey Landing Total flight
time Total survey
time
08077 8 Apr 2008 14:46 14:59 16:57 17:06 2:20 1:58 08079 9 Apr 2008 7:05 7:10 9:02 9:17 2:12 1:52 08095 5 May 2008 13:13 13:46 15:16 15:27 2:14 1:30 08098 7 May 2008 12:18 12:34 13:48 14:19 2:01 1:14 08157 29 Jul 2008 13:25 13:39 14:41 15:10 1:45 1:02 Table 2 presents the sighting conditions during these surveys (see protocol). Wind speed and
direction were recorded during take-off and landing, as communicated by Ostend flight control. The visibility was assessed at one point at sea, and concerns a subjective estimate of the almost horizontal distance in which the coastline or ships are still visible with the naked eye. Cloud coverage is expressed as oktas: 8 oktas concern a completely covered sky, while a completely open sky has 0 oktas. Subjective sighting conditions were assessed by each observer independently. These can be considered as an integration of all factors influencing sighting conditions (glare, seastate, …), of which the individual assessments would not allow for expressing how good conditions were for observing porpoises.
Table 2 Flight conditions during the 2008 surveys.
Dat
e
Seas
tate
Win
d sp
eed
(kts
) – ta
ke
off/l
andi
ng
Win
d di
rect
ion
– ta
ke
off/l
andi
ng
visi
bilit
y (k
m)
Clo
ud
cove
rage
(a
bove
/bel
ow
)
Subj
ectiv
e si
ghtin
g co
nditi
ons
8 april 1-2 8/7 350°/020° +10 4-0/0 Good
9 april 0-1 0 - +10 0/0 Good
5 May 2-3 14 070° +10 1/0 Good to average
7 May 2-3 9/10 030° 5-10 5/0 Average to poor
29 July 2-3 6 360°/310° +10 0/0 Average
During the surveys of 7 May (flight 08098) and 29 July (flight 08157) the number of observed
porpoises was very low (1 animal during each survey). While sighting conditions were good on 8 and 9 April, and good to average on 5 May, they were average to poor on 7 May and 29 July. Given the number of sightings and the sighting conditions, it is not possible to analyse the data gathered during these two surveys. In the framework of the monitoring of the effects of offshore windfarms, a
J. Haelters
248
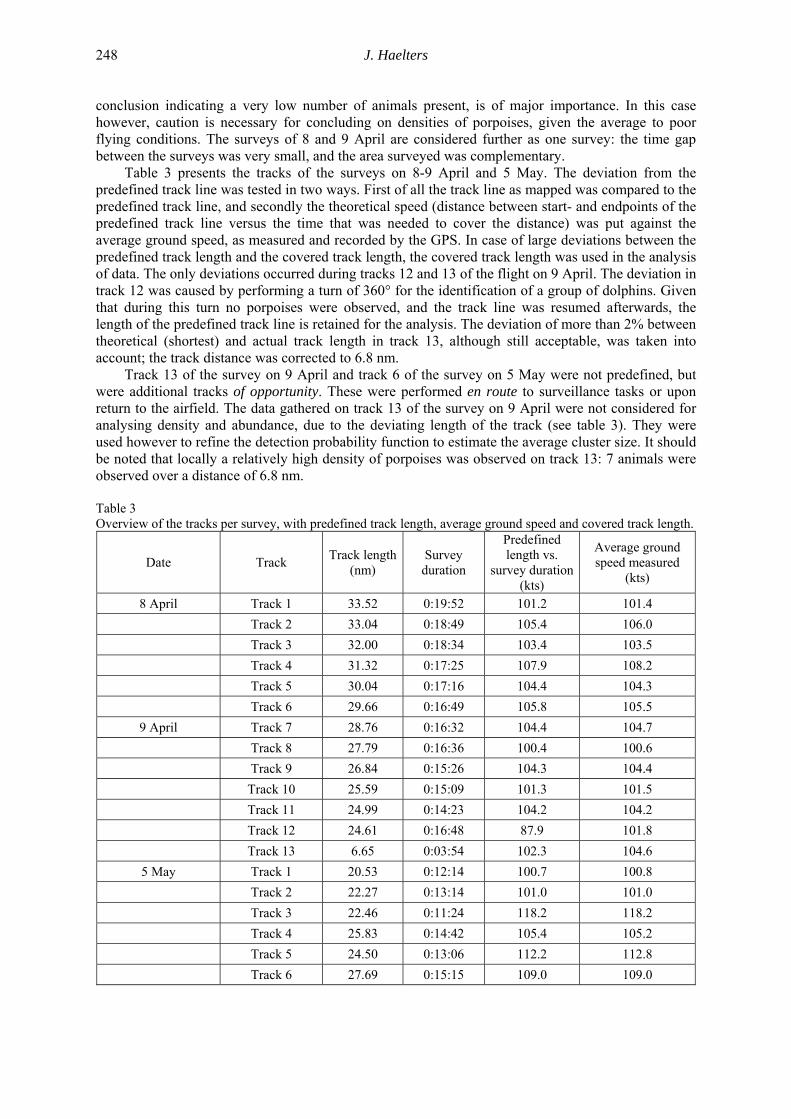
conclusion indicating a very low number of animals present, is of major importance. In this case however, caution is necessary for concluding on densities of porpoises, given the average to poor flying conditions. The surveys of 8 and 9 April are considered further as one survey: the time gap between the surveys was very small, and the area surveyed was complementary.
Table 3 presents the tracks of the surveys on 8-9 April and 5 May. The deviation from the predefined track line was tested in two ways. First of all the track line as mapped was compared to the predefined track line, and secondly the theoretical speed (distance between start- and endpoints of the predefined track line versus the time that was needed to cover the distance) was put against the average ground speed, as measured and recorded by the GPS. In case of large deviations between the predefined track length and the covered track length, the covered track length was used in the analysis of data. The only deviations occurred during tracks 12 and 13 of the flight on 9 April. The deviation in track 12 was caused by performing a turn of 360° for the identification of a group of dolphins. Given that during this turn no porpoises were observed, and the track line was resumed afterwards, the length of the predefined track line is retained for the analysis. The deviation of more than 2% between theoretical (shortest) and actual track length in track 13, although still acceptable, was taken into account; the track distance was corrected to 6.8 nm.
Track 13 of the survey on 9 April and track 6 of the survey on 5 May were not predefined, but were additional tracks of opportunity. These were performed en route to surveillance tasks or upon return to the airfield. The data gathered on track 13 of the survey on 9 April were not considered for analysing density and abundance, due to the deviating length of the track (see table 3). They were used however to refine the detection probability function to estimate the average cluster size. It should be noted that locally a relatively high density of porpoises was observed on track 13: 7 animals were observed over a distance of 6.8 nm.
Table 3 Overview of the tracks per survey, with predefined track length, average ground speed and covered track length.
Date Track Track length (nm)
Survey duration
Predefined length vs.
survey duration (kts)
Average ground speed measured
(kts)
8 April Track 1 33.52 0:19:52 101.2 101.4 Track 2 33.04 0:18:49 105.4 106.0 Track 3 32.00 0:18:34 103.4 103.5 Track 4 31.32 0:17:25 107.9 108.2 Track 5 30.04 0:17:16 104.4 104.3 Track 6 29.66 0:16:49 105.8 105.5
9 April Track 7 28.76 0:16:32 104.4 104.7 Track 8 27.79 0:16:36 100.4 100.6 Track 9 26.84 0:15:26 104.3 104.4 Track 10 25.59 0:15:09 101.3 101.5 Track 11 24.99 0:14:23 104.2 104.2 Track 12 24.61 0:16:48 87.9 101.8 Track 13 6.65 0:03:54 102.3 104.6
5 May Track 1 20.53 0:12:14 100.7 100.8 Track 2 22.27 0:13:14 101.0 101.0 Track 3 22.46 0:11:24 118.2 118.2 Track 4 25.83 0:14:42 105.4 105.2 Track 5 24.50 0:13:06 112.2 112.8 Track 6 27.69 0:15:15 109.0 109.0
Chapter 10. Marine Mammals 249
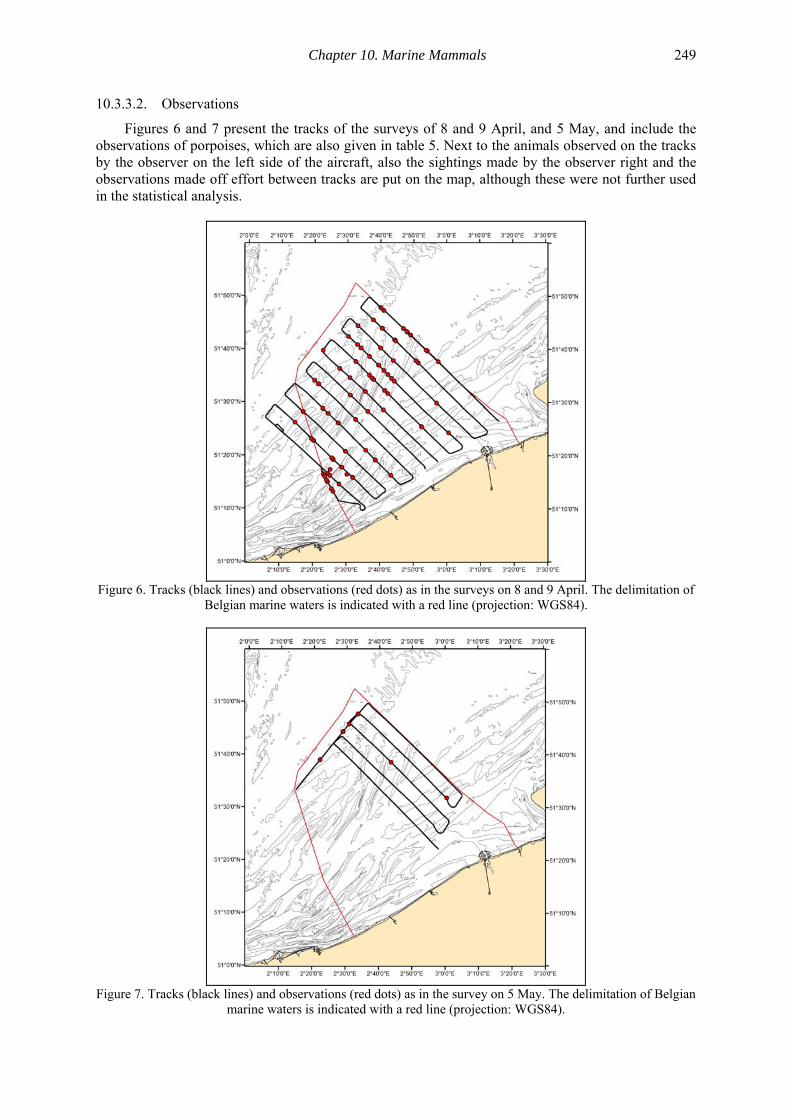
10.3.3.2. Observations
Figures 6 and 7 present the tracks of the surveys of 8 and 9 April, and 5 May, and include the observations of porpoises, which are also given in table 5. Next to the animals observed on the tracks by the observer on the left side of the aircraft, also the sightings made by the observer right and the observations made off effort between tracks are put on the map, although these were not further used in the statistical analysis.
Figure 6. Tracks (black lines) and observations (red dots) as in the surveys on 8 and 9 April. The delimitation of
Belgian marine waters is indicated with a red line (projection: WGS84).
Figure 7. Tracks (black lines) and observations (red dots) as in the survey on 5 May. The delimitation of Belgian
marine waters is indicated with a red line (projection: WGS84).
J. Haelters
250
Table 4 The number of sightings of groups of porpoises and the number of porpoises observed by observer (L left and R right).
Date Number of sightings of groups on effort
Number of observed animals
on effort
Total number of animals observed
L R L R
Number of animals
observed off effort
8 April 25 17 27 22 1 50 9 April 20 10 23 10 3 36 5 May 5 1 5 1 0 6
10.3.3.3. Analysis of the observations
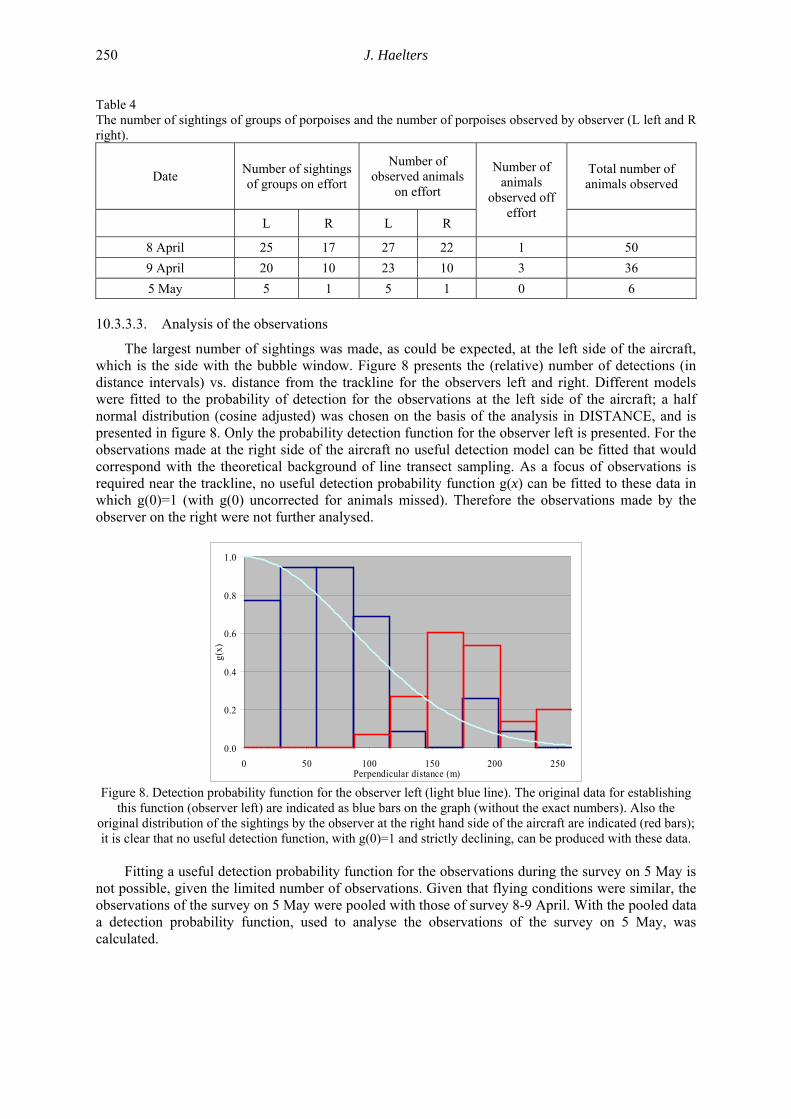
The largest number of sightings was made, as could be expected, at the left side of the aircraft, which is the side with the bubble window. Figure 8 presents the (relative) number of detections (in distance intervals) vs. distance from the trackline for the observers left and right. Different models were fitted to the probability of detection for the observations at the left side of the aircraft; a half normal distribution (cosine adjusted) was chosen on the basis of the analysis in DISTANCE, and is presented in figure 8. Only the probability detection function for the observer left is presented. For the observations made at the right side of the aircraft no useful detection model can be fitted that would correspond with the theoretical background of line transect sampling. As a focus of observations is required near the trackline, no useful detection probability function g(x) can be fitted to these data in which g(0)=1 (with g(0) uncorrected for animals missed). Therefore the observations made by the observer on the right were not further analysed.
0.0
0.2
0.4
0.6
0.8
1.0
0 50 100 150 200 250Perpendicular distance (m)
g(x)
Figure 8. Detection probability function for the observer left (light blue line). The original data for establishing
this function (observer left) are indicated as blue bars on the graph (without the exact numbers). Also the original distribution of the sightings by the observer at the right hand side of the aircraft are indicated (red bars); it is clear that no useful detection function, with g(0)=1 and strictly declining, can be produced with these data.
Fitting a useful detection probability function for the observations during the survey on 5 May is
not possible, given the limited number of observations. Given that flying conditions were similar, the observations of the survey on 5 May were pooled with those of survey 8-9 April. With the pooled data a detection probability function, used to analyse the observations of the survey on 5 May, was calculated.

Chapter 10. Marine Mammals 251
10.3.3.4. Density, abundance and average group size
The survey area as in the survey on 8-9 April overlaps for the larger part with the marine waters under Belgian jurisdiction. The size of the area between survey points S01-N01-N13-S13 is 3,216 km², which is approximately equivalent to the surface of Belgian marine waters (3,600 km²). Therefore the estimated abundance in Belgian waters in survey 8-9 April can be extrapolated from the estimated density in the survey area. The area covered in the survey on 5 May was set at 1,450 km². For the analysis, the parameters used, and the assumptions made, were the following:
• Extreme values were not eliminated; • After testing a number of models, a half normal cosine adjusted model was chosen for
the detection probability function; the adjustment was limited in order not to allow for an increase in the function;
• The detection probability function for the survey on 8-9 April was modelled independently of the survey on 5 May; the detection probability function for the survey on 5 May was prepared using the pooled data of the surveys of 8-9 April and 5 May; both detection probability functions will thus differ slightly, and consequently also the ESW values;
• As g(0) for good/average weather conditions we assumed a value of 0.45, which is the value calculated for similar surveys (porpoises, good conditions) by Hiby (2008). In practice this indicates that slightly more than half of the animals are missed on the trackline, most of these given they were at a depth beyond visibility. An additional simplification of the analysis of collected data concerns the application of g(0) without confidence intervals. As more exact values of g(0) might become available in the future, after more surveys, the data gathered may be revisited, and a more precise estimate of abundance might possibly be made.
The ESW and group sizes for the surveys on 8-9 April and 5 May are presented in table 5. The
ESW for the survey on 5 May (151 m; pooled detection probability function) is larger than the one for the survey on 8-9 April (140 m). This is due to the relatively large distances from the track line of the few observations. No confidence values for the group size in the survey of 5 May are given: all observations concerned solitary animals.
For the analysis of data gathered in the survey of 5 May, a non-parametric bootstrap was used. In this analytical technique, the survey is resampled in which each resample has a number of transects of equal size as the original dataset, and is obtained by random sampling of the original dataset. The assumption is made that the transects are independent, and that the population is distributed fairly evenly. Each resample, numbering 999 in total, is analysed in a similar way as the original data. This technique yields detection function estimations and densities for each resampled dataset, and provides for estimates with a lower variance.
J. Haelters
252
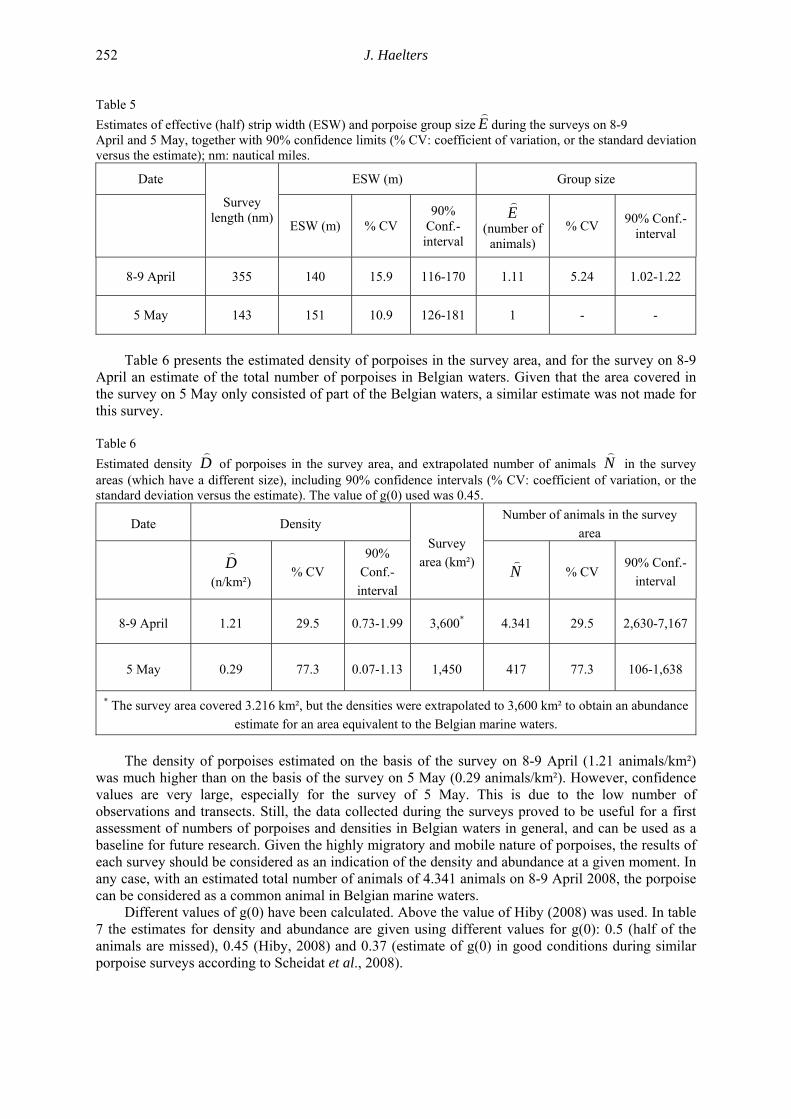
Table 5 Estimates of effective (half) strip width (ESW) and porpoise group size E
)during the surveys on 8-9
April and 5 May, together with 90% confidence limits (% CV: coefficient of variation, or the standard deviation versus the estimate); nm: nautical miles.
Date ESW (m) Group size
Survey length (nm) ESW (m) % CV
90% Conf.-interval
E)
(number of
animals) % CV 90% Conf.-
interval
8-9 April 355 140 15.9 116-170 1.11 5.24 1.02-1.22
5 May 143 151 10.9 126-181 1 - -
Table 6 presents the estimated density of porpoises in the survey area, and for the survey on 8-9
April an estimate of the total number of porpoises in Belgian waters. Given that the area covered in the survey on 5 May only consisted of part of the Belgian waters, a similar estimate was not made for this survey.
Table 6 Estimated density D
) of porpoises in the survey area, and extrapolated number of animals N
) in the survey
areas (which have a different size), including 90% confidence intervals (% CV: coefficient of variation, or the standard deviation versus the estimate). The value of g(0) used was 0.45.
Date Density Number of animals in the survey
area
D)
(n/km²)
% CV 90%
Conf.-interval
Survey area (km²) N
) % CV
90% Conf.-interval
8-9 April 1.21 29.5 0.73-1.99 3,600* 4.341 29.5 2,630-7,167
5 May 0.29 77.3 0.07-1.13 1,450 417 77.3 106-1,638
* The survey area covered 3.216 km², but the densities were extrapolated to 3,600 km² to obtain an abundance estimate for an area equivalent to the Belgian marine waters.
The density of porpoises estimated on the basis of the survey on 8-9 April (1.21 animals/km²)
was much higher than on the basis of the survey on 5 May (0.29 animals/km²). However, confidence values are very large, especially for the survey of 5 May. This is due to the low number of observations and transects. Still, the data collected during the surveys proved to be useful for a first assessment of numbers of porpoises and densities in Belgian waters in general, and can be used as a baseline for future research. Given the highly migratory and mobile nature of porpoises, the results of each survey should be considered as an indication of the density and abundance at a given moment. In any case, with an estimated total number of animals of 4.341 animals on 8-9 April 2008, the porpoise can be considered as a common animal in Belgian marine waters.
Different values of g(0) have been calculated. Above the value of Hiby (2008) was used. In table 7 the estimates for density and abundance are given using different values for g(0): 0.5 (half of the animals are missed), 0.45 (Hiby, 2008) and 0.37 (estimate of g(0) in good conditions during similar porpoise surveys according to Scheidat et al., 2008).
Chapter 10. Marine Mammals 253
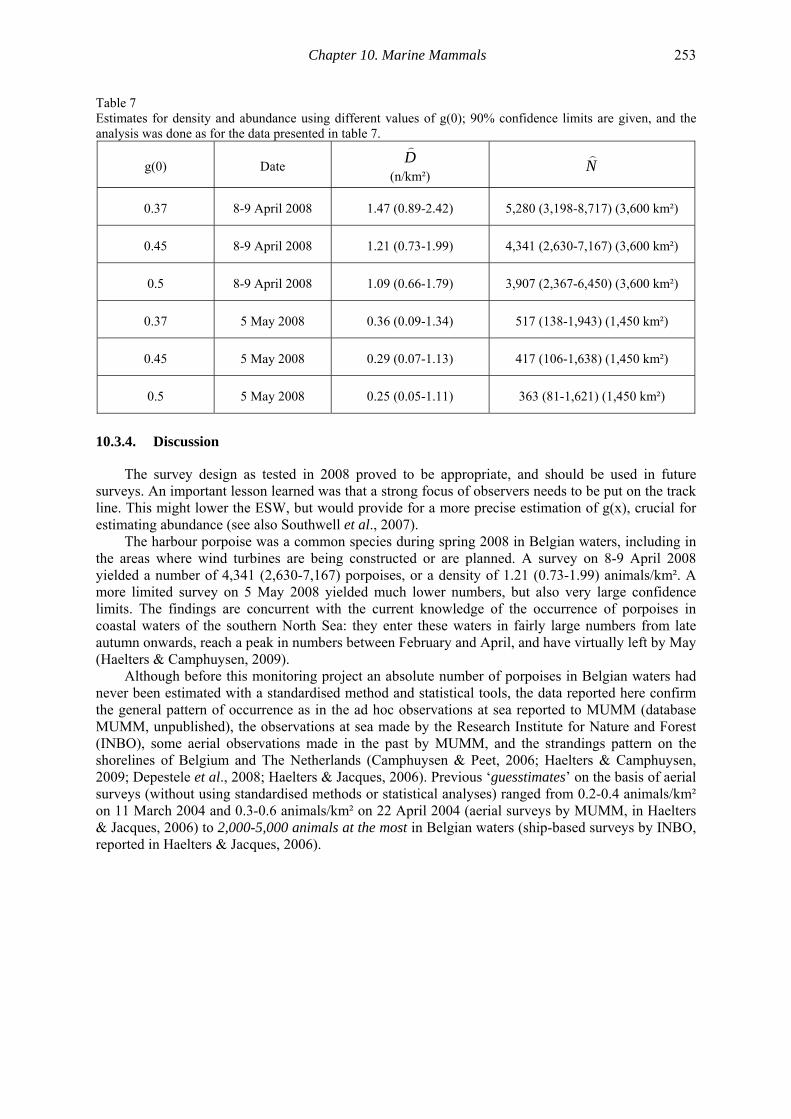
Table 7 Estimates for density and abundance using different values of g(0); 90% confidence limits are given, and the analysis was done as for the data presented in table 7.
g(0) Date D)
(n/km²)
N)
0.37 8-9 April 2008 1.47 (0.89-2.42) 5,280 (3,198-8,717) (3,600 km²)
0.45 8-9 April 2008 1.21 (0.73-1.99) 4,341 (2,630-7,167) (3,600 km²)
0.5 8-9 April 2008 1.09 (0.66-1.79) 3,907 (2,367-6,450) (3,600 km²)
0.37 5 May 2008 0.36 (0.09-1.34) 517 (138-1,943) (1,450 km²)
0.45 5 May 2008 0.29 (0.07-1.13) 417 (106-1,638) (1,450 km²)
0.5 5 May 2008 0.25 (0.05-1.11) 363 (81-1,621) (1,450 km²)
10.3.4. Discussion
The survey design as tested in 2008 proved to be appropriate, and should be used in future surveys. An important lesson learned was that a strong focus of observers needs to be put on the track line. This might lower the ESW, but would provide for a more precise estimation of g(x), crucial for estimating abundance (see also Southwell et al., 2007).
The harbour porpoise was a common species during spring 2008 in Belgian waters, including in the areas where wind turbines are being constructed or are planned. A survey on 8-9 April 2008 yielded a number of 4,341 (2,630-7,167) porpoises, or a density of 1.21 (0.73-1.99) animals/km². A more limited survey on 5 May 2008 yielded much lower numbers, but also very large confidence limits. The findings are concurrent with the current knowledge of the occurrence of porpoises in coastal waters of the southern North Sea: they enter these waters in fairly large numbers from late autumn onwards, reach a peak in numbers between February and April, and have virtually left by May (Haelters & Camphuysen, 2009).
Although before this monitoring project an absolute number of porpoises in Belgian waters had never been estimated with a standardised method and statistical tools, the data reported here confirm the general pattern of occurrence as in the ad hoc observations at sea reported to MUMM (database MUMM, unpublished), the observations at sea made by the Research Institute for Nature and Forest (INBO), some aerial observations made in the past by MUMM, and the strandings pattern on the shorelines of Belgium and The Netherlands (Camphuysen & Peet, 2006; Haelters & Camphuysen, 2009; Depestele et al., 2008; Haelters & Jacques, 2006). Previous ‘guesstimates’ on the basis of aerial surveys (without using standardised methods or statistical analyses) ranged from 0.2-0.4 animals/km² on 11 March 2004 and 0.3-0.6 animals/km² on 22 April 2004 (aerial surveys by MUMM, in Haelters & Jacques, 2006) to 2,000-5,000 animals at the most in Belgian waters (ship-based surveys by INBO, reported in Haelters & Jacques, 2006).
J. Haelters
254
10.3.5. Conclusions and recommendations for future research and preparatory work
For monitoring marine mammals at sea, aerial line transect surveys proved to be a very cost-efficient method. This is confirmed by the extensive assessments made in the SCANS II survey report, published in 2008 (SCANS II, 2008). The methodology of gathering and analysing data is standardised, and has a strong theoretical basis. The statistical analysis is made possible with dedicated software (DISTANCE 5.0.), widely used in line transect surveys.
In the analysis a number of assumptions are made, which make the estimates less reliable. An important assumption is to use g(0)=0.45, and applying it without confidence intervals. Within the current monitoring programme, estimating a value for g(0) in different weather conditions and for different observers was not feasible from a technical and budgetary point of view. In order to be able to compare results, aerial monitoring should only be executed during good observer conditions in future surveys. A ‘flexible’ availability of a suitable aircraft is necessary for this.
We have demonstrated that bubble windows are a prerequisite for acquiring useful data: a detection probability function necessary for analysing data could only be obtained on the basis of the data gathered at the bubble window. As a consequence, administrative steps are being taken to equip the aircraft with a second bubble window (at the right hand side of the aircraft) in 2009.
Although in theory the total survey length should not affect the estimate of abundance, more aerial surveys should be undertaken to obtain smaller confidence limits for abundance, density and groups size. Surveys should aim at covering the whole of the Belgian waters, given that the number of transects is close to a minimum still useful for statistical analysis. This is also necessary for developing density surface models, which may reveal areas where porpoises aggregate, or may reveal inshore–offshore gradients or habitat preferences. Density surface models will be necessary to create distribution maps, which will yield information about the variability in the distribution of porpoises in space and time. Density distribution maps, together with the results obtained from the other disciplines, will provide for the basis for the assessment of possible effects of the construction and operation of offshore wind farms. A weakness is that the area of concern is very open, with ‘uncontrolled’ inflows and outflows of animals.
In future the collected data might be re-analysed, for instance when a better detection function would be made on the on the basis of more observations, with a better estimate of g(0), or with new analysis software being available.
10.4. Monitoring of porpoises and other small cetaceans with PoDs
10.4.1. Introduction
A Porpoise Detector (PoD) is an autonomous, static and passive device used for monitoring ultrasound originating from cetaceans (see protocol: MUMM, 2008b). Porpoise sounds can be distinguished from other noise or sounds from other animals, while with the devices available in 2008, dolphins cannot be identified up to the species level. Due to technical innovations and an increased ease of use, these systems are being used ever more frequently for long-term monitoring of selected populations of small cetaceans, for instance in the framework of environmental impact assessments (Carstensen et al., 2006; Leeney & Tregenza, 2006; Mellinger et al, 2007). Anchored PoDs can demonstrate the presence of porpoises and other toothed whales in a small area around the device during several months. The size of this area depends on the species of cetaceans, the type of PoD and the environment. While aerial surveys can give us an ad hoc image of the distribution and abundance of cetaceans over a large area, the use of PoDs provides for information over a longer period in a cost-efficient way (Depestele et al., 2008).
The information on PoDs given below is summarised from the information obtained from Chelonia Ltd., the company developing and manufacturing PoDs (http://www.chelonia.co.uk/). It proved not feasible to deploy PoDs in 2008 for monitoring the effects of the construction and
Chapter 10. Marine Mammals 255
exploitation of offshore windfarms in Belgian waters. In 2009 and during the following years a newly developed type of PoD, available from January 2009 onwards, will be used. In 2008 the most cost-efficient method to anchor the PoDs in the framework of offshore windfarm monitoring was investigated, building on experience gained in the project WAKO (Depestele et al., 2008).
10.4.2. Material and methods
10.4.2.1. T-PoDs and C-PoDs
A PoD consists of a hydrophone, a processor, batteries and a digital timing and logging system. These are put together in a watertight tube (PVC or polypropylene) of around 60 cms in length. PoDs are moored at sea for a period of days to months.
PoDs analyse ambient noise in real-time, and log clicks resembling those originating from small cetaceans. Such ‘clicks’ can also originate from sand movement, boat sonar, crustaceans or rain. The repetition, duration and frequency of these clicks is analysed with dedicated software, and click sequences are categorised into different probabilities of origin: cetacean, probably cetacean, unknown and boat sonar. Cetacean click-trains indicate the presence of cetaceans, and can also provide some information about behaviour. Besides visualising information about detections (and pulse repetition frequency, interclick interval or click duration) for the whole period, the software allows for several export options, summarising information about a.o. total number of clicks, the number of detection positive minutes per day, the click intensity (number of clicks versus number of positive detection minutes), or the number of encounters per day.
The type of PoD that has been used most frequently for monitoring cetaceans in the North Sea is the T-PoD. T-PoDs are not available on the market anymore since the end of 2007. They are replaced by a technically improved version: the C-PoD. Data collected by T-PoDs cannot be compared easily to those collected by C-PoDs, given different technical specifications. C-PoDs have a number of technical advances over T-Pods, which include a better autonomy, a lower number of false detections, a memory card that can be replaced at sea, and a more limited need to enter specific settings. For these reasons C-PoDs are chosen for the monitoring of the effects of offshore windfarms on marine mammals for the duration of the monitoring projects. Given that in 2008 no C-PoDs were available on the market yet, no PoDs have been deployed in 2008. From 2009 onwards C-PoDs will be used. Data gathered by these PoDs will be used to optimise the C-PoD software by Chelonia Ltd. It will be possible to analyse gathered data retrospectively with updated versions of the software, and data used to optimise the software will remain confidential.
10.4.2.2. Technical specifications of C-PoDs
C-PoDs (will) have the following specifications (adapted from the information provided by Chelonia ltd.; www.chelonia.co.uk):
• Working depth up to at least 100 m; • Powered by 8 (or 10) alkaline D cells; • Autonomy at least 3 months – to be verified; • Length: 535 mm (8 alkaline D-cell version); • Weight: 1.7 kg – 2.9 kg (without – with batteries); • Buoyancy: 0.5 kg (8 alkaline D-cell version); • Omnidirectional hydrophone, 20 kHz to 150 kHz; • Removable Secure Digital (SD) memory card; • Detection radius up to 300 m for porpoises (100 % detection within 70 to 100 m), and at
least 1200 m for dolphins; • Angle sensing: an angle sensor and PoD settings allow for the PoD to be set and
transported (e.g. upside down) without logging; while logging the angle is recorded each minute;
• The temperature is recorded each minute.
J. Haelters
256
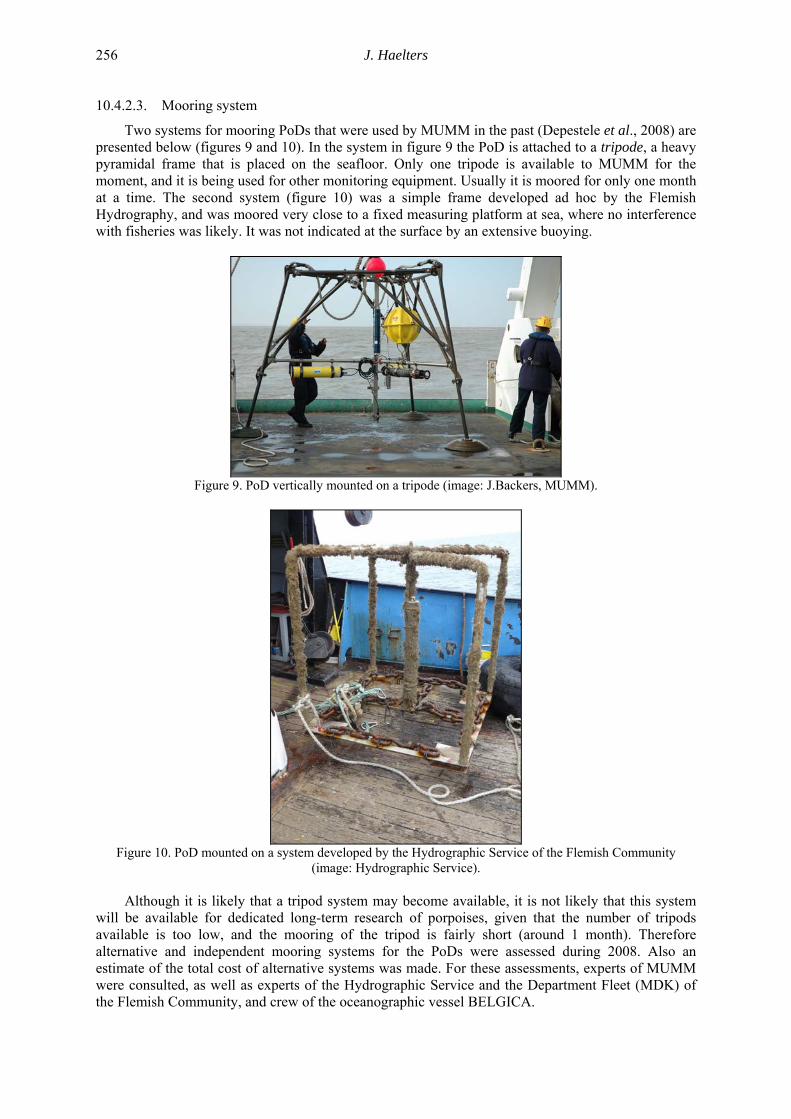
10.4.2.3. Mooring system
Two systems for mooring PoDs that were used by MUMM in the past (Depestele et al., 2008) are presented below (figures 9 and 10). In the system in figure 9 the PoD is attached to a tripode, a heavy pyramidal frame that is placed on the seafloor. Only one tripode is available to MUMM for the moment, and it is being used for other monitoring equipment. Usually it is moored for only one month at a time. The second system (figure 10) was a simple frame developed ad hoc by the Flemish Hydrography, and was moored very close to a fixed measuring platform at sea, where no interference with fisheries was likely. It was not indicated at the surface by an extensive buoying.
Figure 9. PoD vertically mounted on a tripode (image: J.Backers, MUMM).
Figure 10. PoD mounted on a system developed by the Hydrographic Service of the Flemish Community
(image: Hydrographic Service). Although it is likely that a tripod system may become available, it is not likely that this system
will be available for dedicated long-term research of porpoises, given that the number of tripods available is too low, and the mooring of the tripod is fairly short (around 1 month). Therefore alternative and independent mooring systems for the PoDs were assessed during 2008. Also an estimate of the total cost of alternative systems was made. For these assessments, experts of MUMM were consulted, as well as experts of the Hydrographic Service and the Department Fleet (MDK) of the Flemish Community, and crew of the oceanographic vessel BELGICA.
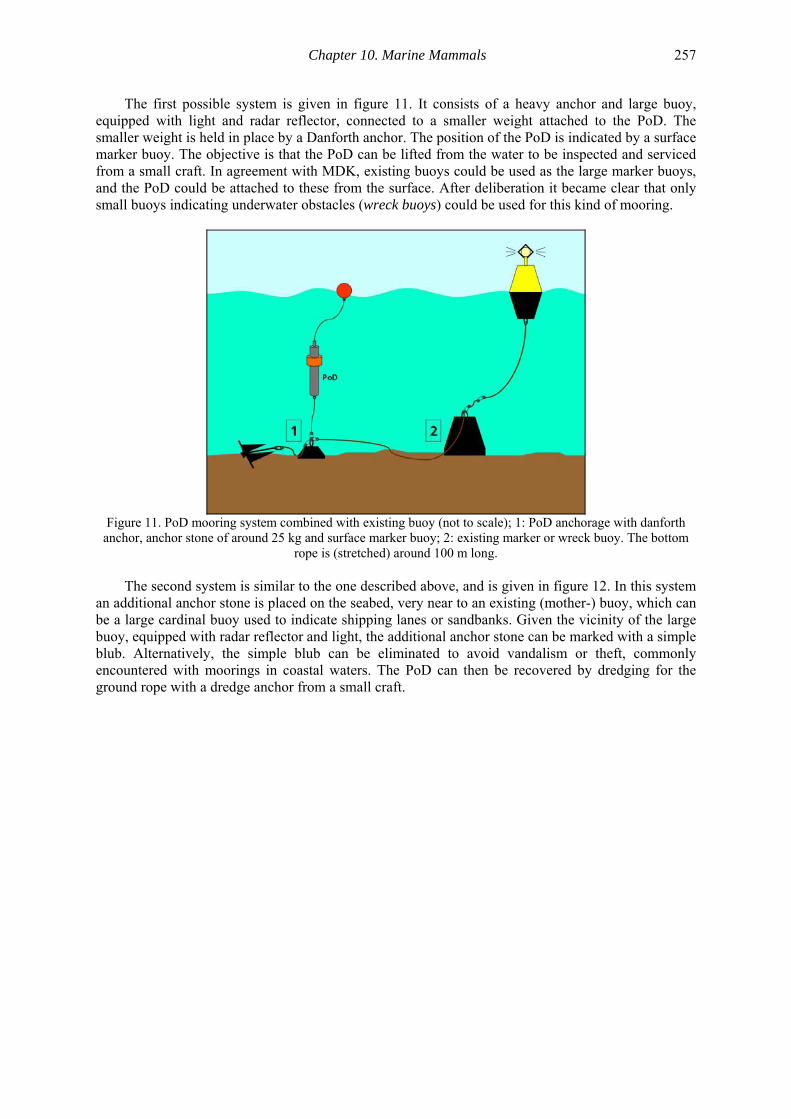
Chapter 10. Marine Mammals 257
The first possible system is given in figure 11. It consists of a heavy anchor and large buoy, equipped with light and radar reflector, connected to a smaller weight attached to the PoD. The smaller weight is held in place by a Danforth anchor. The position of the PoD is indicated by a surface marker buoy. The objective is that the PoD can be lifted from the water to be inspected and serviced from a small craft. In agreement with MDK, existing buoys could be used as the large marker buoys, and the PoD could be attached to these from the surface. After deliberation it became clear that only small buoys indicating underwater obstacles (wreck buoys) could be used for this kind of mooring.
Figure 11. PoD mooring system combined with existing buoy (not to scale); 1: PoD anchorage with danforth
anchor, anchor stone of around 25 kg and surface marker buoy; 2: existing marker or wreck buoy. The bottom rope is (stretched) around 100 m long.
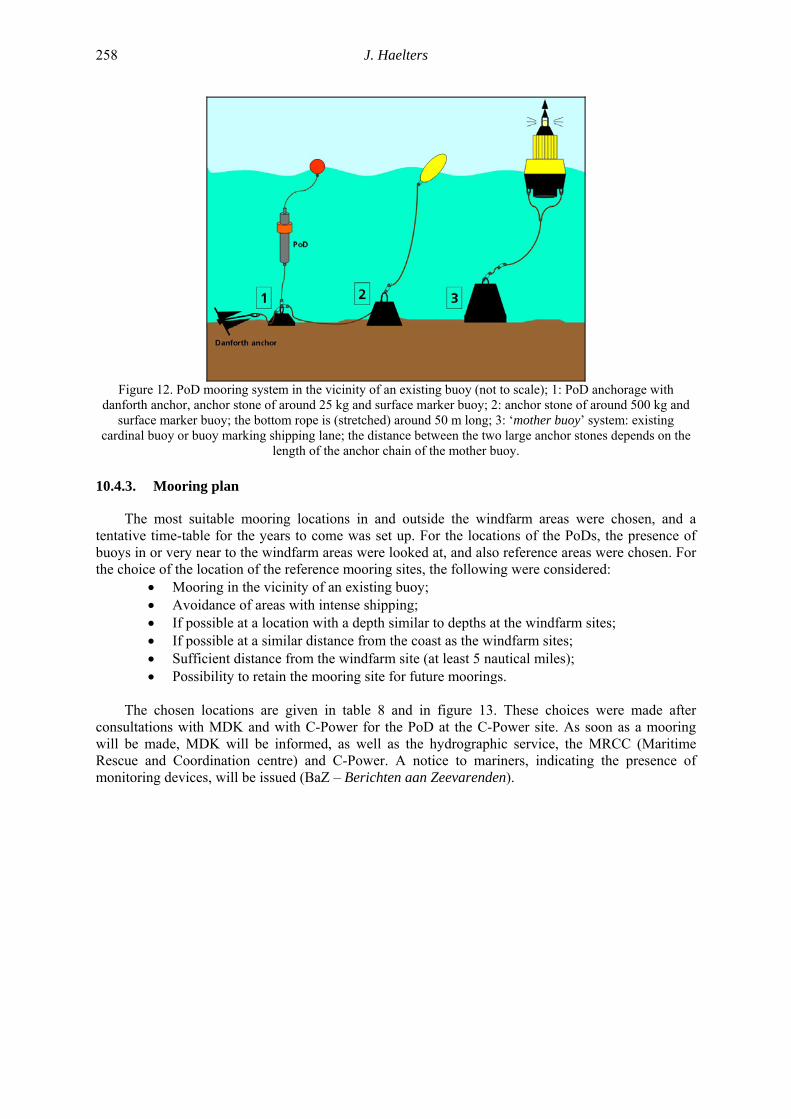
The second system is similar to the one described above, and is given in figure 12. In this system
an additional anchor stone is placed on the seabed, very near to an existing (mother-) buoy, which can be a large cardinal buoy used to indicate shipping lanes or sandbanks. Given the vicinity of the large buoy, equipped with radar reflector and light, the additional anchor stone can be marked with a simple blub. Alternatively, the simple blub can be eliminated to avoid vandalism or theft, commonly encountered with moorings in coastal waters. The PoD can then be recovered by dredging for the ground rope with a dredge anchor from a small craft.
J. Haelters
258
Figure 12. PoD mooring system in the vicinity of an existing buoy (not to scale); 1: PoD anchorage with
danforth anchor, anchor stone of around 25 kg and surface marker buoy; 2: anchor stone of around 500 kg and surface marker buoy; the bottom rope is (stretched) around 50 m long; 3: ‘mother buoy’ system: existing
cardinal buoy or buoy marking shipping lane; the distance between the two large anchor stones depends on the length of the anchor chain of the mother buoy.
10.4.3. Mooring plan
The most suitable mooring locations in and outside the windfarm areas were chosen, and a tentative time-table for the years to come was set up. For the locations of the PoDs, the presence of buoys in or very near to the windfarm areas were looked at, and also reference areas were chosen. For the choice of the location of the reference mooring sites, the following were considered:
• Mooring in the vicinity of an existing buoy; • Avoidance of areas with intense shipping; • If possible at a location with a depth similar to depths at the windfarm sites; • If possible at a similar distance from the coast as the windfarm sites; • Sufficient distance from the windfarm site (at least 5 nautical miles); • Possibility to retain the mooring site for future moorings.
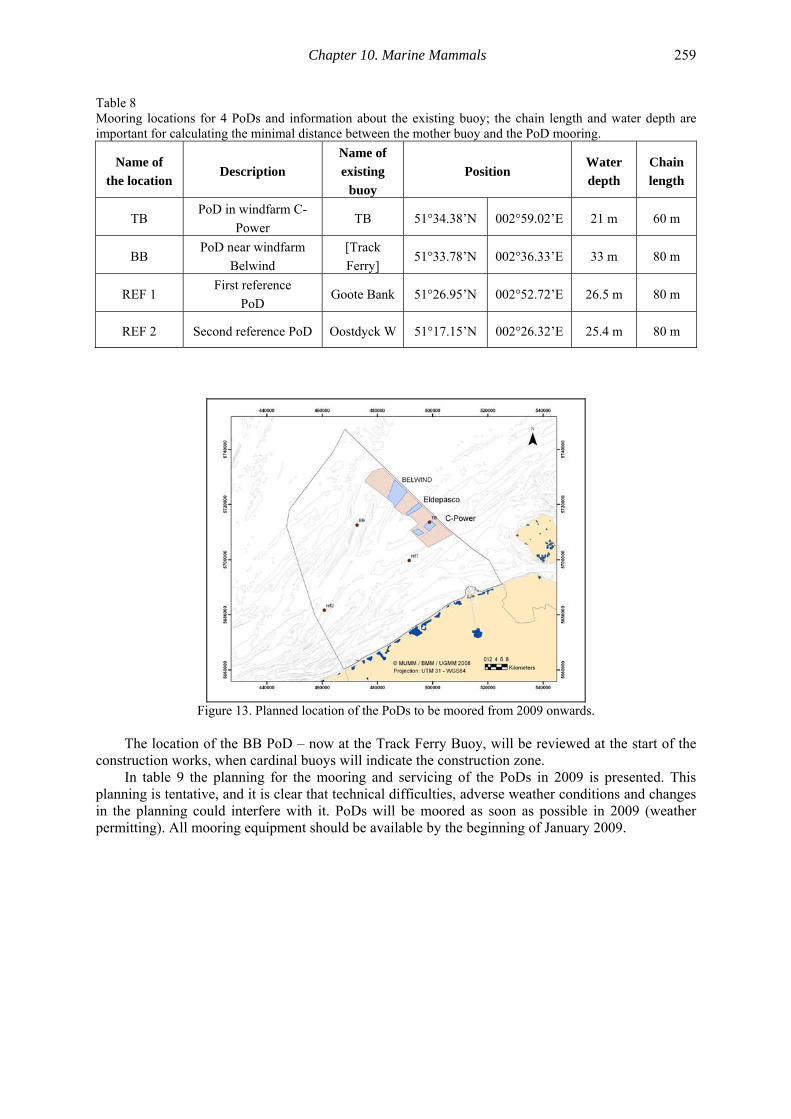
The chosen locations are given in table 8 and in figure 13. These choices were made after
consultations with MDK and with C-Power for the PoD at the C-Power site. As soon as a mooring will be made, MDK will be informed, as well as the hydrographic service, the MRCC (Maritime Rescue and Coordination centre) and C-Power. A notice to mariners, indicating the presence of monitoring devices, will be issued (BaZ – Berichten aan Zeevarenden).
Chapter 10. Marine Mammals 259
Table 8 Mooring locations for 4 PoDs and information about the existing buoy; the chain length and water depth are important for calculating the minimal distance between the mother buoy and the PoD mooring.
Name of the location
Description Name of existing
buoy Position
Water depth
Chain length
TB PoD in windfarm C-
Power TB 51°34.38’N 002°59.02’E 21 m 60 m
BB PoD near windfarm
Belwind [Track Ferry]
51°33.78’N 002°36.33’E 33 m 80 m
REF 1 First reference
PoD Goote Bank 51°26.95’N 002°52.72’E 26.5 m 80 m
REF 2 Second reference PoD Oostdyck W 51°17.15’N 002°26.32’E 25.4 m 80 m
Figure 13. Planned location of the PoDs to be moored from 2009 onwards.
The location of the BB PoD – now at the Track Ferry Buoy, will be reviewed at the start of the
construction works, when cardinal buoys will indicate the construction zone. In table 9 the planning for the mooring and servicing of the PoDs in 2009 is presented. This
planning is tentative, and it is clear that technical difficulties, adverse weather conditions and changes in the planning could interfere with it. PoDs will be moored as soon as possible in 2009 (weather permitting). All mooring equipment should be available by the beginning of January 2009.
J. Haelters
260
Table 9 Planning of the mooring of PoDs during 2009 and indication of the ship that will be used (BELGICA: oceanographic vessel; TUIMELAAR: Rigid Inflatable Boat – RIB).
Late winter - spring 2009 Late winter -spring 2009 Late spring 2009 Summer 2009
Placement of 4 anchorage systems (TB,
BB, REF 1, REF 2) – OV BELGICA
If placing of anchoring systems was successful, check of these systems,
and placement of 4 PoDs (TB, BB, REF 1, REF 2)
- TUIMELAAR
Depending on the success of the February
campaigns: servicing of the PoDs: replacement of
batteries and memory card, removal of fouling -
TUIMELAAR
Depending on the success of the
previous campaigns Retrieval of PoDs (TUIMELAAR –
BELGICA)
If the PoDs are available by the end of January 2009, the placement of the anchorage system and
the PoDs will be combined. Depending on the quality of the mooring system and the activities in the windfarm areas, it is possible that the PoDs will be left at sea for a longer period of time, and be serviced more often.
10.4.4. Conclusions
Using passive acoustic devices is considered as an elegant method for monitoring the effects of the construction and exploitation of offshore windfarms on marine mammals, given that marine mammals, and especially porpoises, are very difficult to monitor in the wild. During 2008, a mooring system was developed, in which existing buoys are used to reduce costs. A choice was made for the locations of the two windpark PoDs and the two reference PoDs that will be deployed from the beginning of 2009 onwards. Given that the existing buoys of choice are all large cardinal buoys or buoys marking shipping lanes, a mooring system as in figure 12 will tentatively be used. For the mooring, a very good coordination with MDK will be necessary. The experiences in 2009 should indicate whether this mooring system works in practice, or whether a mooring system used exclusively for marking the PoDs should be used instead. Given that loss of PoDs or vandalism cannot be excluded with this fairly modest mooring system, one or more spare PoDs should be obtained.
10.5. Collection of additional data
10.5.1. Introduction
Several additional sources of information on marine mammals in Belgian waters exist. These include strandings data, sightings data reported by the public, by authorities at sea or by the constructor of wind turbines, and sightings data collected by the Research Institute on Nature and Forest (INBO) during seabird censuses.
The strandings data reported here can be considered as effort-related, given that we believe that the majority of washed ashore porpoises are reported, and most are collected by MUMM for research purposes. The sightings data only concern ad hoc sightings reported by the public, and are not effort related. Given that the harbour porpoise has been common in spring during the last years, we suspect that they increasingly are perceived as of little interest, and that as such many of them are not reported anymore. The data collected by INBO are reported in the report of the monitoring of seabirds.
Also in this section an overview is given of strandings and sightings of other marine mammals.
Chapter 10. Marine Mammals 261
10.5.2. Material and methods
All marine mammals are protected species, for which a specific legislation exists. Stranded animals need to be dealt with accordingly. To cope with the legislation, and in order to contribute to specific obligations of the Belgian authorities in the framework of international conventions, a network was established to organise the scientific research of stranded and bycaught animals. This network is coordinated by MUMM. In practice, MUMM takes care of the interventions in case of strandings and bycatches, and makes sure carcasses are recovered for scientific research. Trends in numbers of stranded animals can indicate trends in abundance at sea, and the investigation of the washed ashore animals can indicate problems the population is facing, such as bycatch in fishing gear.
Next to gathering strandings data, MUMM also maintains a database on sightings. These sightings are directly reported to MUMM, or indirectly through websites such as www.zeezoogdieren.org or www.waarnemingen.be. Also these ad hoc (non effort related) sightings can yield interesting information (Haelters & Camphuysen, 2009).
10.5.3. Results
10.5.3.1. The harbour porpoise
The harbour porpoise has not always been a common animal in Belgian waters. It was virtually absent from southern North Sea waters from the mid-1950s up to the early 1990s. In the early 1990s a gradual increase in strandings indicated a return of the species to these waters. Reasons for the decline and return are unclear, but certainly the return may have been caused by altered feeding conditions in the central and northern North Sea (Camphuysen, 2004; Haelters & Camphuysen, 2009).
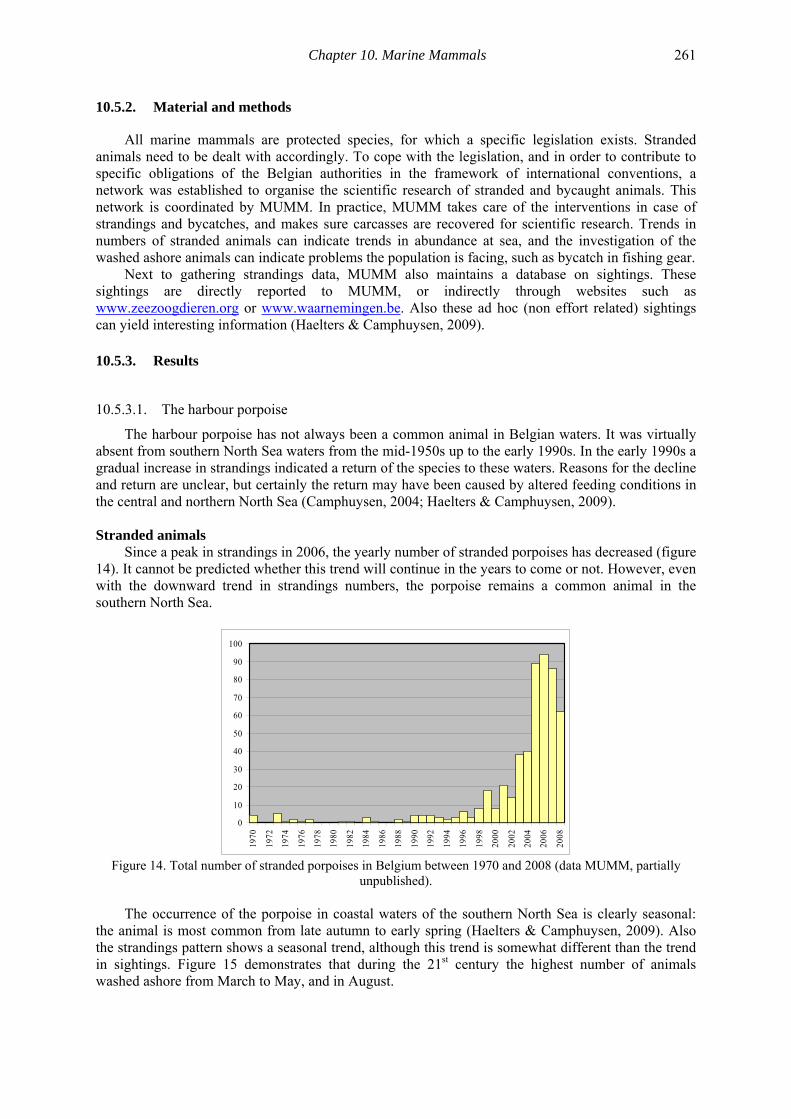
Stranded animals
Since a peak in strandings in 2006, the yearly number of stranded porpoises has decreased (figure 14). It cannot be predicted whether this trend will continue in the years to come or not. However, even with the downward trend in strandings numbers, the porpoise remains a common animal in the southern North Sea.
0
10
20
30
40
50
60
70
80
90
100
1970
1972
1974
1976
1978
1980
1982
1984
1986
1988
1990
1992
1994
1996
1998
2000
2002
2004
2006
2008
Figure 14. Total number of stranded porpoises in Belgium between 1970 and 2008 (data MUMM, partially
unpublished).
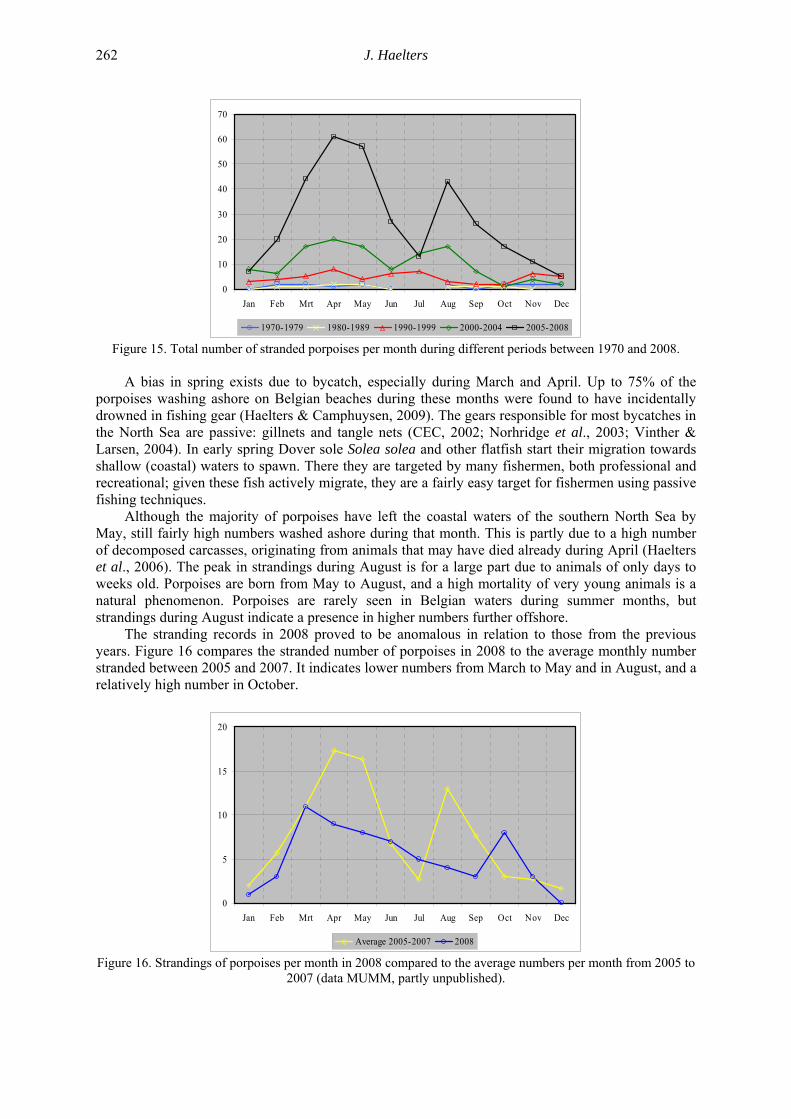
The occurrence of the porpoise in coastal waters of the southern North Sea is clearly seasonal: the animal is most common from late autumn to early spring (Haelters & Camphuysen, 2009). Also the strandings pattern shows a seasonal trend, although this trend is somewhat different than the trend in sightings. Figure 15 demonstrates that during the 21st century the highest number of animals washed ashore from March to May, and in August.
J. Haelters
262
0
10
20
30
40
50
60
70
Jan Feb Mrt Apr May Jun Jul Aug Sep Oct Nov Dec
1970-1979 1980-1989 1990-1999 2000-2004 2005-2008
Figure 15. Total number of stranded porpoises per month during different periods between 1970 and 2008. A bias in spring exists due to bycatch, especially during March and April. Up to 75% of the
porpoises washing ashore on Belgian beaches during these months were found to have incidentally drowned in fishing gear (Haelters & Camphuysen, 2009). The gears responsible for most bycatches in the North Sea are passive: gillnets and tangle nets (CEC, 2002; Norhridge et al., 2003; Vinther & Larsen, 2004). In early spring Dover sole Solea solea and other flatfish start their migration towards shallow (coastal) waters to spawn. There they are targeted by many fishermen, both professional and recreational; given these fish actively migrate, they are a fairly easy target for fishermen using passive fishing techniques.
Although the majority of porpoises have left the coastal waters of the southern North Sea by May, still fairly high numbers washed ashore during that month. This is partly due to a high number of decomposed carcasses, originating from animals that may have died already during April (Haelters et al., 2006). The peak in strandings during August is for a large part due to animals of only days to weeks old. Porpoises are born from May to August, and a high mortality of very young animals is a natural phenomenon. Porpoises are rarely seen in Belgian waters during summer months, but strandings during August indicate a presence in higher numbers further offshore.
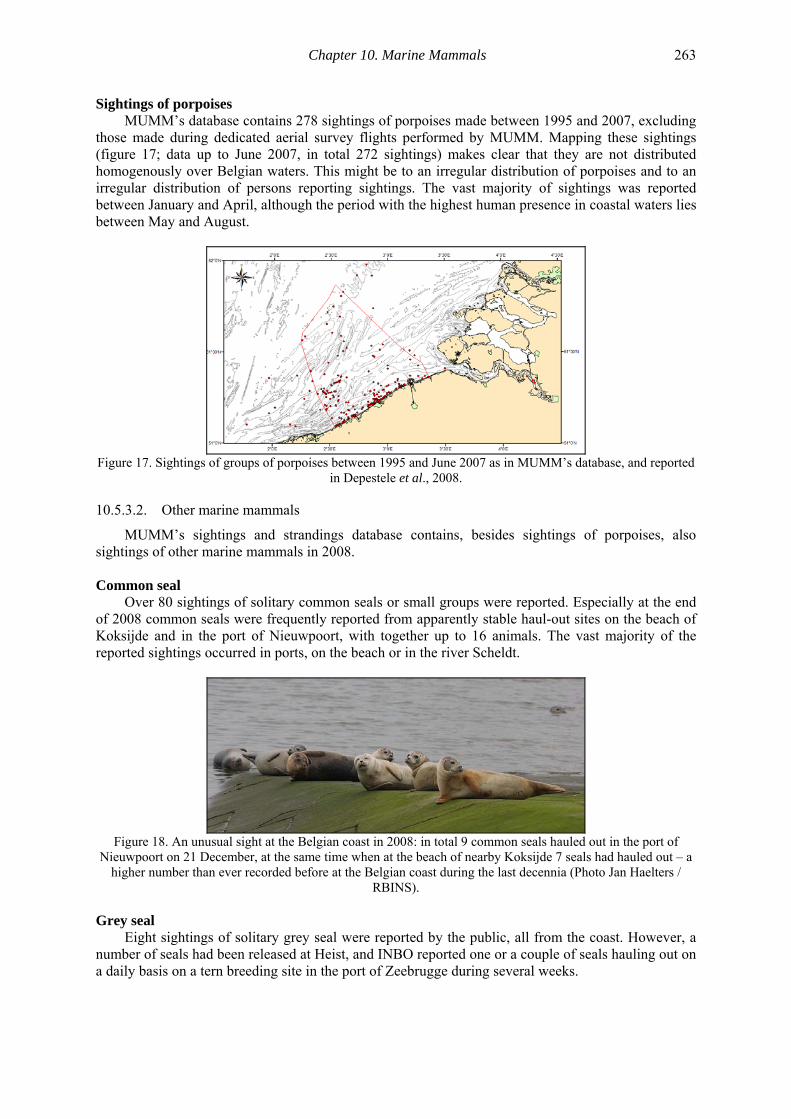
The stranding records in 2008 proved to be anomalous in relation to those from the previous years. Figure 16 compares the stranded number of porpoises in 2008 to the average monthly number stranded between 2005 and 2007. It indicates lower numbers from March to May and in August, and a relatively high number in October.
0
5
10
15
20
Jan Feb Mrt Apr May Jun Jul Aug Sep Oct Nov Dec
Average 2005-2007 2008
Figure 16. Strandings of porpoises per month in 2008 compared to the average numbers per month from 2005 to 2007 (data MUMM, partly unpublished).
Chapter 10. Marine Mammals 263
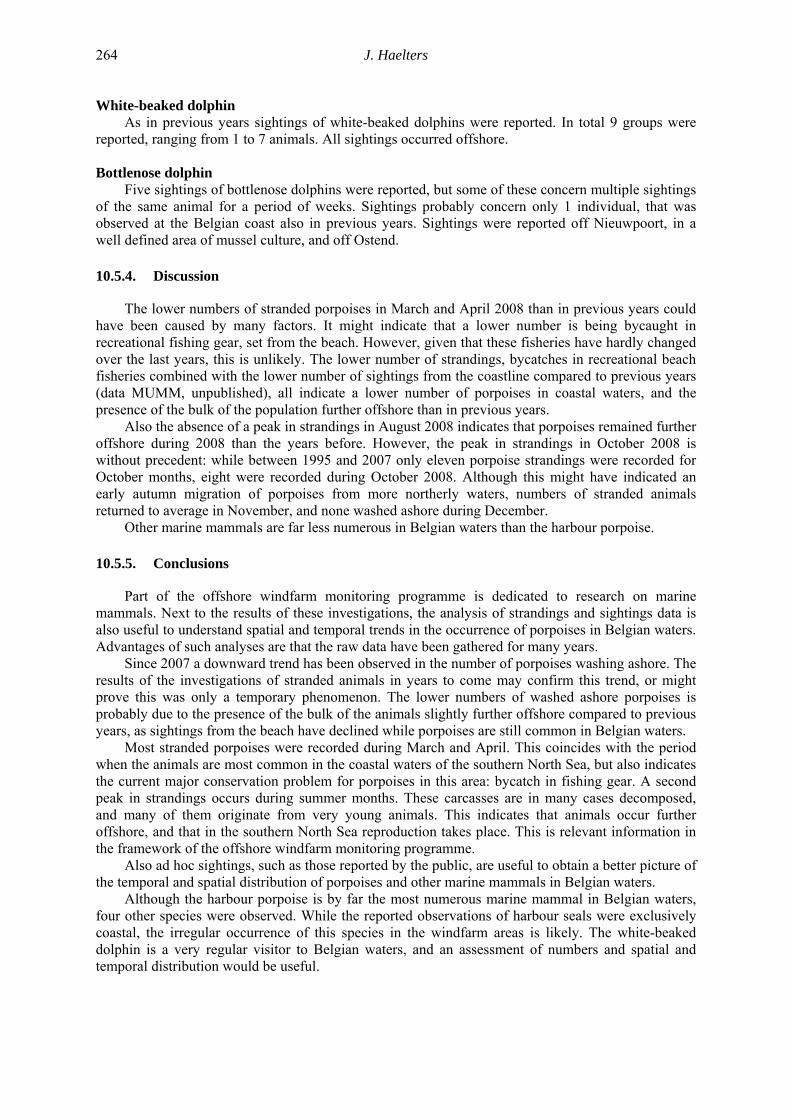
Sightings of porpoises MUMM’s database contains 278 sightings of porpoises made between 1995 and 2007, excluding
those made during dedicated aerial survey flights performed by MUMM. Mapping these sightings (figure 17; data up to June 2007, in total 272 sightings) makes clear that they are not distributed homogenously over Belgian waters. This might be to an irregular distribution of porpoises and to an irregular distribution of persons reporting sightings. The vast majority of sightings was reported between January and April, although the period with the highest human presence in coastal waters lies between May and August.
Figure 17. Sightings of groups of porpoises between 1995 and June 2007 as in MUMM’s database, and reported
in Depestele et al., 2008.
10.5.3.2. Other marine mammals
MUMM’s sightings and strandings database contains, besides sightings of porpoises, also sightings of other marine mammals in 2008.
Common seal
Over 80 sightings of solitary common seals or small groups were reported. Especially at the end of 2008 common seals were frequently reported from apparently stable haul-out sites on the beach of Koksijde and in the port of Nieuwpoort, with together up to 16 animals. The vast majority of the reported sightings occurred in ports, on the beach or in the river Scheldt.
Figure 18. An unusual sight at the Belgian coast in 2008: in total 9 common seals hauled out in the port of
Nieuwpoort on 21 December, at the same time when at the beach of nearby Koksijde 7 seals had hauled out – a higher number than ever recorded before at the Belgian coast during the last decennia (Photo Jan Haelters /
RBINS).
Grey seal Eight sightings of solitary grey seal were reported by the public, all from the coast. However, a
number of seals had been released at Heist, and INBO reported one or a couple of seals hauling out on a daily basis on a tern breeding site in the port of Zeebrugge during several weeks.
J. Haelters
264
White-beaked dolphin As in previous years sightings of white-beaked dolphins were reported. In total 9 groups were
reported, ranging from 1 to 7 animals. All sightings occurred offshore.
Bottlenose dolphin Five sightings of bottlenose dolphins were reported, but some of these concern multiple sightings
of the same animal for a period of weeks. Sightings probably concern only 1 individual, that was observed at the Belgian coast also in previous years. Sightings were reported off Nieuwpoort, in a well defined area of mussel culture, and off Ostend.
10.5.4. Discussion
The lower numbers of stranded porpoises in March and April 2008 than in previous years could have been caused by many factors. It might indicate that a lower number is being bycaught in recreational fishing gear, set from the beach. However, given that these fisheries have hardly changed over the last years, this is unlikely. The lower number of strandings, bycatches in recreational beach fisheries combined with the lower number of sightings from the coastline compared to previous years (data MUMM, unpublished), all indicate a lower number of porpoises in coastal waters, and the presence of the bulk of the population further offshore than in previous years.
Also the absence of a peak in strandings in August 2008 indicates that porpoises remained further offshore during 2008 than the years before. However, the peak in strandings in October 2008 is without precedent: while between 1995 and 2007 only eleven porpoise strandings were recorded for October months, eight were recorded during October 2008. Although this might have indicated an early autumn migration of porpoises from more northerly waters, numbers of stranded animals returned to average in November, and none washed ashore during December.
Other marine mammals are far less numerous in Belgian waters than the harbour porpoise.
10.5.5. Conclusions
Part of the offshore windfarm monitoring programme is dedicated to research on marine mammals. Next to the results of these investigations, the analysis of strandings and sightings data is also useful to understand spatial and temporal trends in the occurrence of porpoises in Belgian waters. Advantages of such analyses are that the raw data have been gathered for many years.
Since 2007 a downward trend has been observed in the number of porpoises washing ashore. The results of the investigations of stranded animals in years to come may confirm this trend, or might prove this was only a temporary phenomenon. The lower numbers of washed ashore porpoises is probably due to the presence of the bulk of the animals slightly further offshore compared to previous years, as sightings from the beach have declined while porpoises are still common in Belgian waters.
Most stranded porpoises were recorded during March and April. This coincides with the period when the animals are most common in the coastal waters of the southern North Sea, but also indicates the current major conservation problem for porpoises in this area: bycatch in fishing gear. A second peak in strandings occurs during summer months. These carcasses are in many cases decomposed, and many of them originate from very young animals. This indicates that animals occur further offshore, and that in the southern North Sea reproduction takes place. This is relevant information in the framework of the offshore windfarm monitoring programme.
Also ad hoc sightings, such as those reported by the public, are useful to obtain a better picture of the temporal and spatial distribution of porpoises and other marine mammals in Belgian waters.
Although the harbour porpoise is by far the most numerous marine mammal in Belgian waters, four other species were observed. While the reported observations of harbour seals were exclusively coastal, the irregular occurrence of this species in the windfarm areas is likely. The white-beaked dolphin is a very regular visitor to Belgian waters, and an assessment of numbers and spatial and temporal distribution would be useful.

Chapter 10. Marine Mammals 265
10.6. Results of the monitoring of underwater noise relevant to marine mammals
The investigation of effects of increased underwater noise on biota is so complex, that it is impossible to undertake in the current monitoring programme. However, the results of the underwater noise monitoring programme can indicate a possible relevance for cetaceans.
The results of the underwater noise monitoring at the Thorntonbank construction site did not yield levels which would have potentially significant effects on porpoises or other marine mammals. The noise levels were comparable with those originating from shipping activities, already omnipresent in the area. It should not be expected that porpoises remain in the immediate vicinity of the construction works, as they usually avoid motorised vessels.
However, only a few underwater noise measurements were performed, and the noise level of some of the activities, including the placement of gravity foundations or scour protection, still needs to be measured. The objective is to perform such measurements during 2009 and consecutive years. For projects in which piles will be driven, the main objective is to measure the noise levels associated with this activity, and to assess potential impacts.
10.7. References
Buckland, S.T., Anderson, D.R., Burnham, K.P., Laake, J.L., Borchers, D.L. & Thomas, L. (2001) Introduction to Distance Sampling: estimating abundance of biological populations. Oxford University Press, 432 p.
Camphuysen, C.J. (2004) The return of the harbour porpoise (Phocoena phocoena) in Dutch coastal waters. Lutra 47(2): 113-122.
Camphuysen, K & Peet, G. (2006) Walvissen in de zuidelijke Noordzee – Whales and dolphins of the North Sea. Fontaine Uitgevers BV, ‘s Graveland, Nederland. 160 pp.
Carstensen, J., Henriksen, O.D. & Teilmann, J. (2006) Impacts of offshore wind farm construction on harbour porpoises: acoustic monitoring of echolocation activity using porpoise detectors (T-PODs). Marine Ecology Progress Series 321: 295-308.
CEC (2002) Incidental catches of small cetaceans. Report of the Subgroup on Fishery and Environment (SGFEN) of the Scientific, Technical and Economic Committee for Fisheries (STECF). CEC, Commission Staff Working Paper, Brussels. ESC(2002) 376.
CREEM, (2008) Introduction to DISTANCE sampling. Centre for research into Ecological and Environmental Modelling, University of St.-Andrews, Scotland.
Depestele, J., Courtens, W., Degraer, S., Derous, S., Haelters, J., Hostens, K., Moulaert, I., Polet, H., Rabaut, M., Stienen, E. & Vincx, M. (2008) Evaluatie van de milieu-impact van WArrelnet- en boomKOrvisserij op het Belgisch deel van de Noordzee (WAKO). Eindrapport. ILVO Visserij: Oostende, Belgium, 185 pp.
Gerrodette, T. (1993) Trends: software for a power analysis of linear regression. Wildlife Society Bulletin 21:515-516.
Haelters, J., (2007) Walvisachtigen in Belgische wateren: vreemde luizen of toch niet? De Grote Rede 20: 2-7.
Haelters & Camphuysen (2009) The harbour porpoise in the southern North Sea: Abundance, threats, research- and management proposals. RBINS (MUMM) and Royal NIOZ. Report prepared for IFAW. 56 pp.
Haelters, J., Norro A, Deblauwe, J.-P. (2008) Protocol en planning voor de monitoring van onderwatergeluid in het kader van de constructie en exploitatie van offshore windparken. Rapport van de Beheerseenheid van het Mathematisch Model van de Noordzee (BMM), Koninklijk Belgisch Instituut voor Natuurwetenschappen, Brussel. 6 pp.
Haelters, J. & Deblauwe, J.-P (2008) Protocol en planning voor de monitoring van walvisachtigen door middel van PoDs in het kader van de constructie en exploitatie van offshore windparken Rapport van de Beheerseenheid van het Mathematisch Model van de Noordzee (BMM), Koninklijk Belgisch Instituut voor Natuurwetenschappen, Brussel. 7 pp.
J. Haelters
266
Haelters, J. & Vogt, J.-P., (2008) Protocol voor de monitoring van zeezoogdieren vanuit delucht in het kader van windparkprojecten Rapport van de Beheerseenheid van het Mathematisch Model van de Noordzee (BMM), Koninklijk Belgisch Instituut voor Natuurwetenschappen, Brussel. 18 pp.
Haelters, J. & Jacques, T.G. (2006) De Bescherming van Walvisachtigen in Belgische Wateren: bijkomende informatie gericht aan DG Leefmilieu van de federale Overheidsdienst volksgezondheid, veiligheid van de voedselketen en leefmilieu, m.b.t. de uitvoering door België van de Habitatrichtlijn Art. 11 en 12 voor wat betreft walvisachtigen. KBIN (BMM), Brussel, 15 p.
Haelters, J., Jauniaux, T., Kerckhof, F., Ozer, J. & Scory, S. (2006) Using models to investigate a harbour porpoise bycatch problem in the southern North Sea–eastern Channel in spring 2005. ICES CM 2006/L:03. 8pp.
Hedley, S.L. & Buckland, S.T. (2004) Spatial models for line transect sampling. Journal of Agricultural, Biological and Environmental Statistics 9(2): 181-199.
Hiby, L. (2008) Effective strip half-width estimates from aerial survey data. In: SCANS II, 2008. Small Cetaceans in the European Atlantic and North Sea (SCANS II). Final Report to the European Commission. Appendix D3.1.
Leeney, R.H. & Tregenza, N. (Eds.) (2006) Static acoustic monitoring of cetaceans. ECS Newsletter no.46, Special Issue, 57pp.
Mellinger, D.K., Stafford, K.M., Moore, S.E., Dziak, R.P. & Matsumoto, H. (2007) An overview of fixed passive acoustic observation methods for cetaceans. Oceanography 20(4): 36-45.
MUMM (2004) Milieueffectenbeoordeling van het project ingediend door de n.v. C-Power. Rapport van het Koninklijk Belgisch Instituut voor Natuurwetenschappen, departement Beheerseenheid van het Mathematisch Model van de Noordzee (BMM). 155 pp.
MUMM (2007) Milieueffectenbeoordeling van het BELWIND offshore windmolenpark op de Bligh Bank. Rapport van het Koninklijk Belgisch Instituut voor Natuurwetenschappen, departement Beheerseenheid van het Mathematisch Model van de Noordzee (BMM). 183 pp.
Northridge, S., Sanderson, D., Mackay, A. & Hammond, P. (2003). Analysis and mitigation of cetacean bycatch in UK fisheries. Sea Mammal Research Unit (SMRU), Final Report to DEFRA, Project MF0726. 25 pp.
SCANS II (2008) Small Cetaceans in the European Atlantic and North Sea (SCANS II). Final Report to the European Commission under project LIFE04NAT/GB/000245. Available from SMRU, Gatty Marine Laboratory, University of St Andrews, St Andrews, Fife, KY16 8LB, UK.
Scheidat, M., Gilles, A., Kock, K-H. & Siebert, U. (2008) Harbour porpoise Phocoena phocoena abundance in the southwestern Baltic Sea. Endangered Species Research 5: 215-223.
Thomas, L., Laake, J.L., Strindberg, S., Marques, F.F.C., Buckland, S.T., Borchers, D.L., Anderson, D.R., Burnham, K.P., Hedley, S.L., Pollard, J.H., Bishop, J.R.B., & Marques, T.A., (2006) Distance 5.0. Release 2, 20 December 2006. Research Unit for Wildlife Population Assessment, University of St. Andrews, UK. http://www.ruwpa.st-and.ac.uk/distance/
Vinther, M. & Larsen, F. (2004) Updated estimates of harbour porpoise (Phocoena phocoena) bycatch in the Danish North Sea bottom-set gillnet fishery. J. Cetacean Res. Manage. 6(1): 19-24.