Embed Size (px)
Citation preview
1
Chapter 10Progress and Performance
Measurementand Evaluation
2
Project Monitoring System for Control Information System Structure
What data are collected?Current status of project (schedule and cost)
Remaining cost to compete project
Date that project will be complete
Potential problems to be addressed now
Out-of-control activities requiring intervention
Cost and/or schedule overruns and the reasons for them
Forecast of overruns at time of project completion
2
3
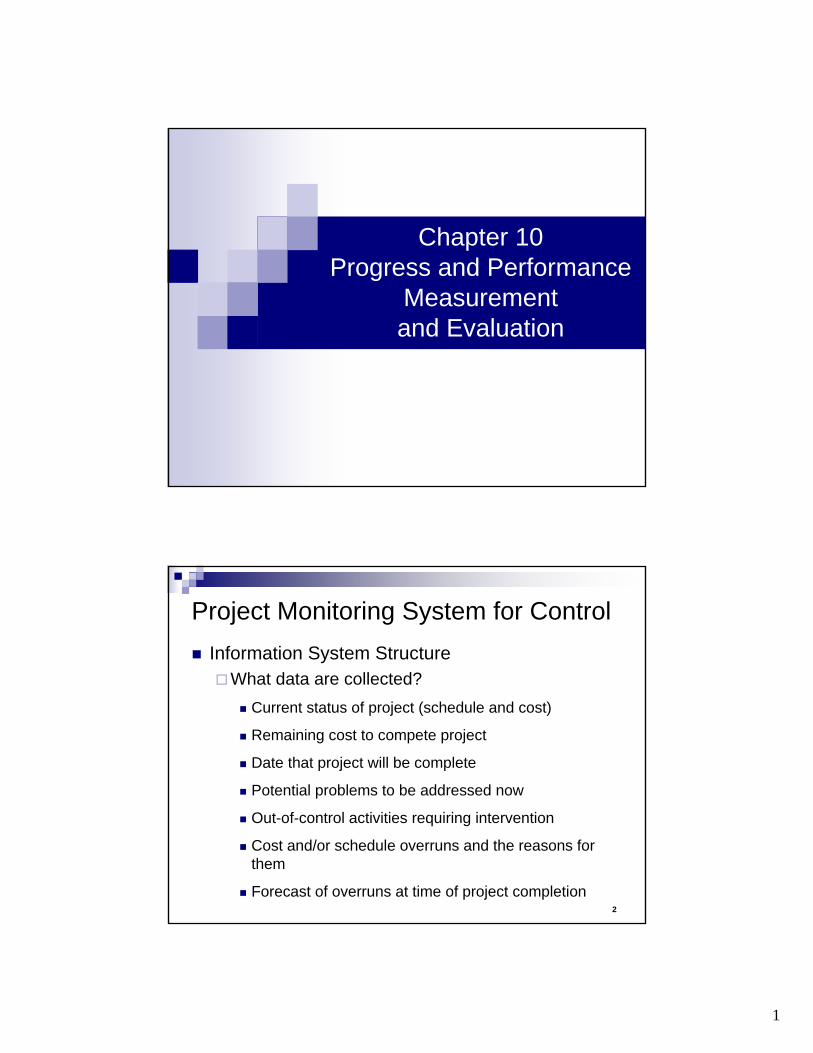
Project Monitoring System…(cont’d)
Information System Structure (cont’d)Collecting data and analysis
Who will collect project data?How will data be collected?When will the data be collected?Who will compile and analyze the data?
Reports and reportingWho will receive the reports?How will the reports be transmitted?When will the reports be distributed?
4
Project Progress Report FormatProgress Since Last ReportCurrent Status of Project
ScheduleCostScope
Cumulative TrendsProblems and Issues Since Last Report
Actions and resolution of earlier problemsNew variances and problems identified
Corrective Action Planned
3
5
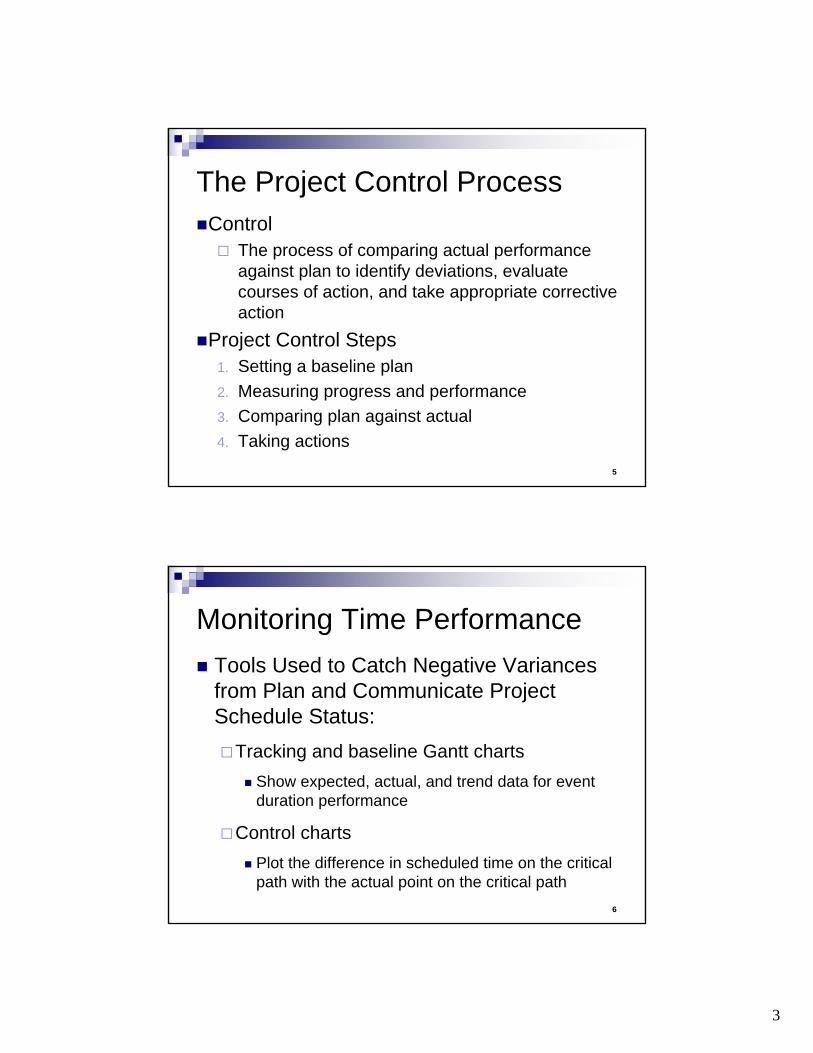
The Project Control ProcessControl
The process of comparing actual performance against plan to identify deviations, evaluate courses of action, and take appropriate corrective action
Project Control Steps1. Setting a baseline plan2. Measuring progress and performance3. Comparing plan against actual4. Taking actions
6
Monitoring Time PerformanceTools Used to Catch Negative Variances from Plan and Communicate Project Schedule Status:
Tracking and baseline Gantt chartsShow expected, actual, and trend data for event duration performance
Control chartsPlot the difference in scheduled time on the critical path with the actual point on the critical path
4
7
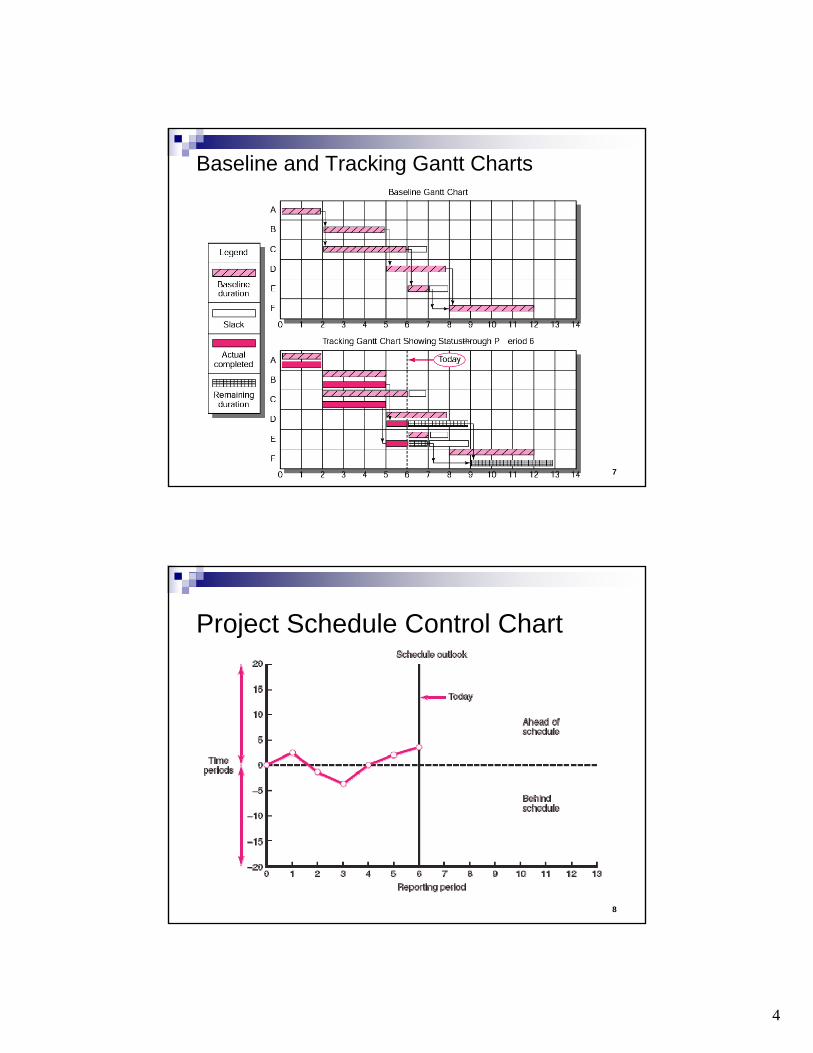
Baseline and Tracking Gantt Charts
8
Project Schedule Control Chart
5
9
Disparity Among Monitoring SystemsTime-Phase Baseline Plan
Corrects the failure of most monitoring systems to connect a project’s actual performance to its schedule and forecast budget
Systems that measure only cost variances do not identify resource and project cost problems associated with falling behind or progressing ahead of schedule.
Earned Value Cost/Schedule SystemAn integrated project management system based on the earned value concept that uses a time-phased budget baseline to compare actual and planned schedule and costs
10
Glossary of TermsEV
The percent complete times its original budget. The percent of the original budget that has been earned by actual work completed. The older acronym for this value was BCWP—budgeted cost of the work performed.
PV (Planned Value)The time-phased baseline of the value of the work scheduled. An approved cost estimate of the resources scheduled in a time-phased cumulative baseline (BCWS—budgeted cost of the work scheduled).
ACThe actual cost of the work completed. The sum of the costs incurred in accomplishing work. (ACWP—actual cost of the work performed).
6
11
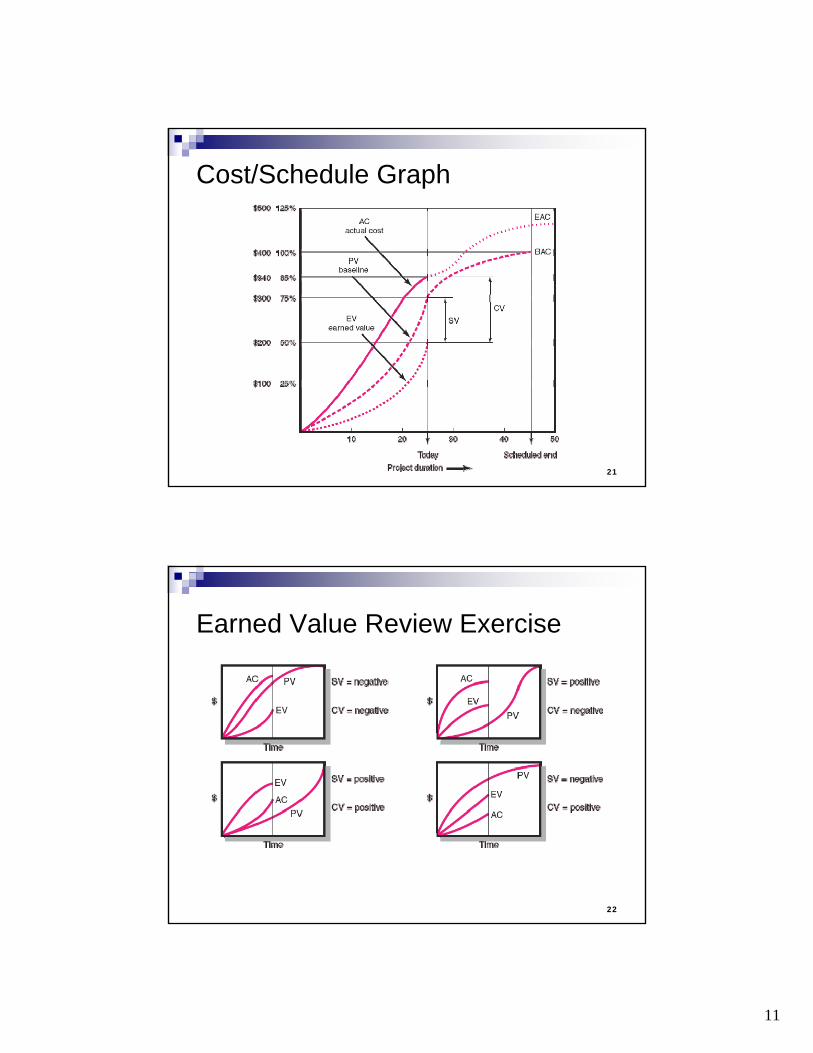
Glossary of TermsCV
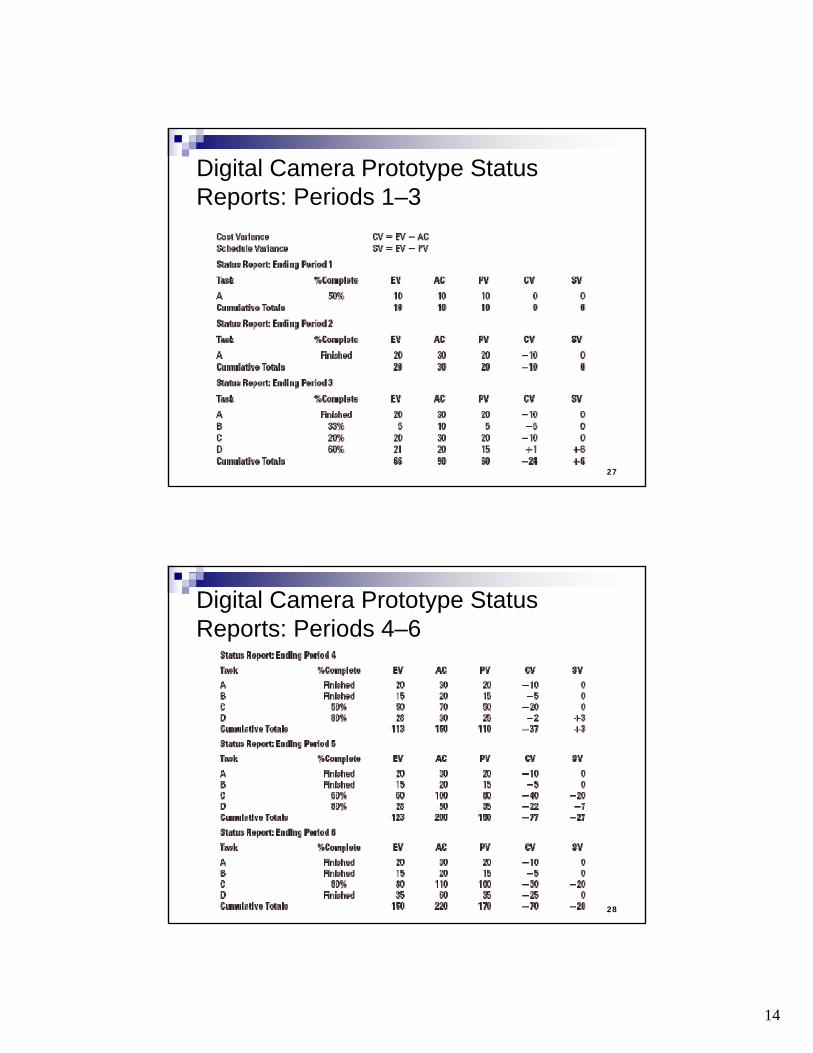
Cost variance is the difference between the earned value and the actual costs for the work completed to date where CV=EV-AC.
SVSchedule variance (SV) is the difference between the earned value and the baseline line to date where SV=EV-PV.
BACBudgeted cost at completion. The total budgeted cost of the baseline or project cost accounts.
EACreEstimated costs at completion. Includes costs to-date plus revised estimated costs for the work remaining.
12
Glossary of TermsETC
Estimate to complete.VAC
Cost variance at completion (BAC-EACre), where EACre is derived by estimators in the field.Or, alternatively, cost variance at completion (BAC-EACf), where EACf is derived from a formula using actual and earned value costs.VAC indicates expected actual over-or underrun cost at completion.
7
13
Developing an Integrated Cost/Schedule System1. Define the work using a WBS.
a. Scopeb. Work packagesc. Deliverablesd. Organization unitse. Resourcesf. Budgets
2. Develop work and resource schedules.a. Schedule resource to activitiesb. Time-phase work packages into a network
3. Develop a time-phased budget using work packages included in an activity.
14
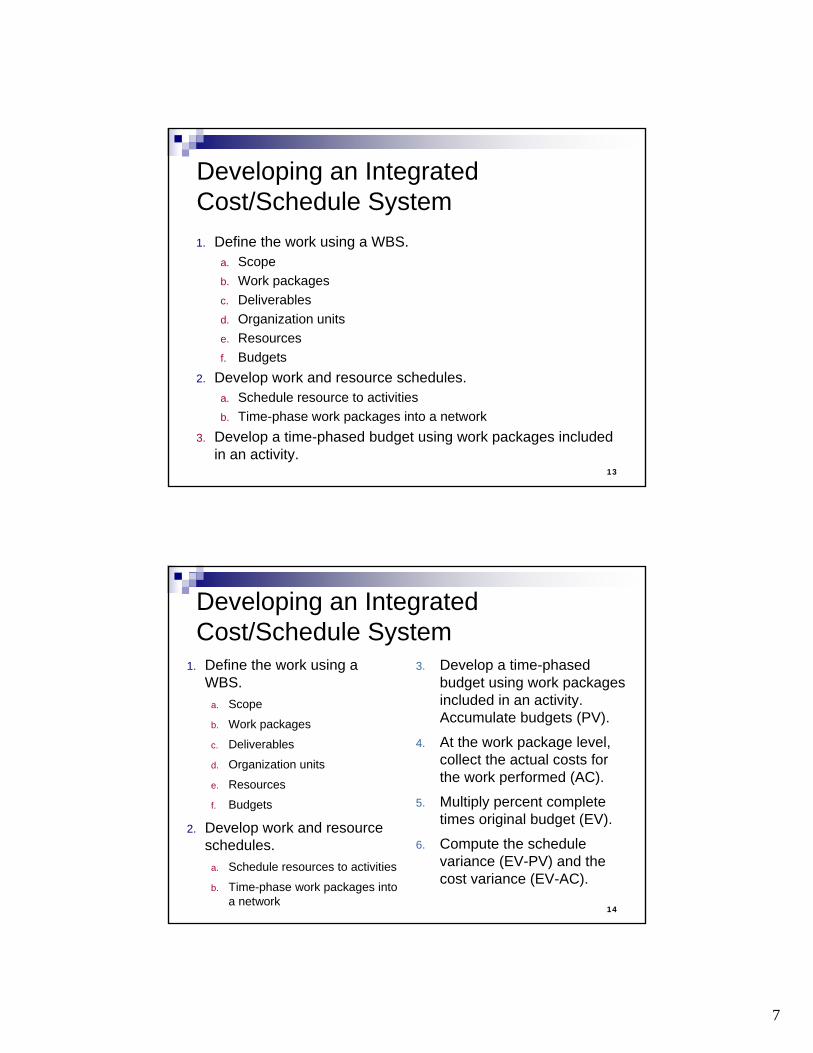
Developing an Integrated Cost/Schedule System
1. Define the work using a WBS.
a. Scope
b. Work packages
c. Deliverables
d. Organization units
e. Resources
f. Budgets
2. Develop work and resource schedules.
a. Schedule resources to activities
b. Time-phase work packages into a network
3. Develop a time-phased budget using work packages included in an activity. Accumulate budgets (PV).
4. At the work package level, collect the actual costs for the work performed (AC).
5. Multiply percent complete times original budget (EV).
6. Compute the schedule variance (EV-PV) and the cost variance (EV-AC).
8
15
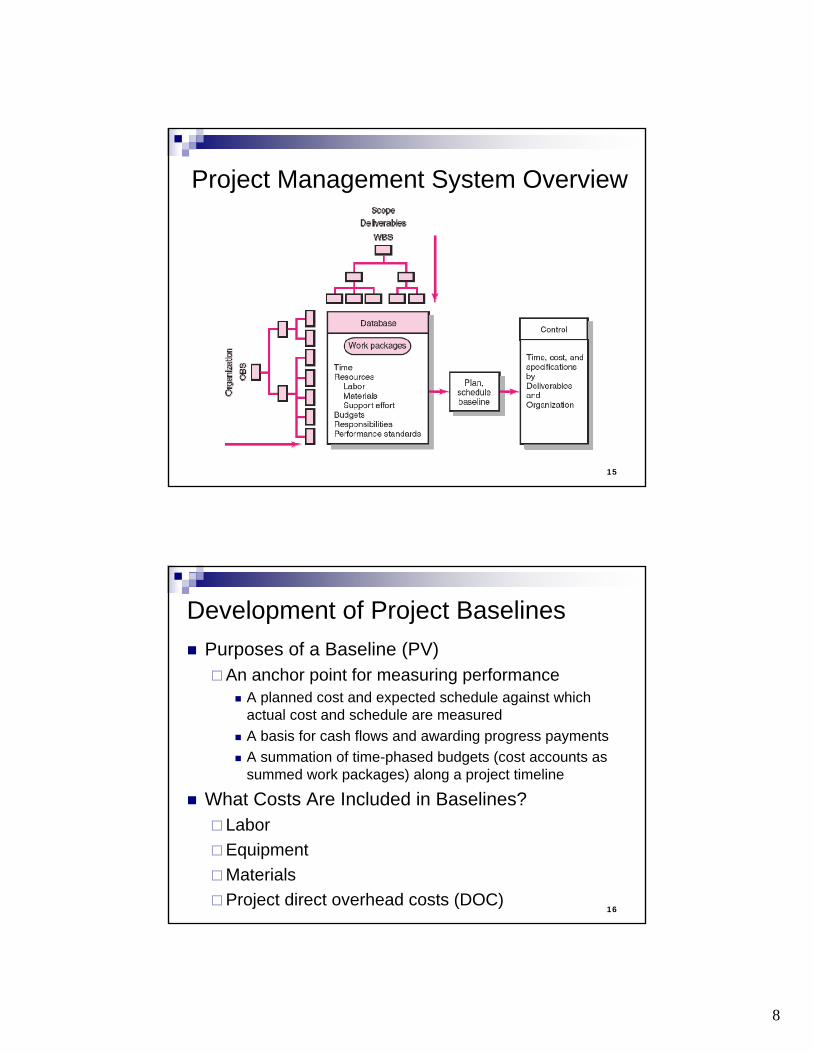
Project Management System Overview
16
Development of Project BaselinesPurposes of a Baseline (PV)
An anchor point for measuring performanceA planned cost and expected schedule against which actual cost and schedule are measuredA basis for cash flows and awarding progress paymentsA summation of time-phased budgets (cost accounts as summed work packages) along a project timeline
What Costs Are Included in Baselines?LaborEquipmentMaterialsProject direct overhead costs (DOC)
9
17
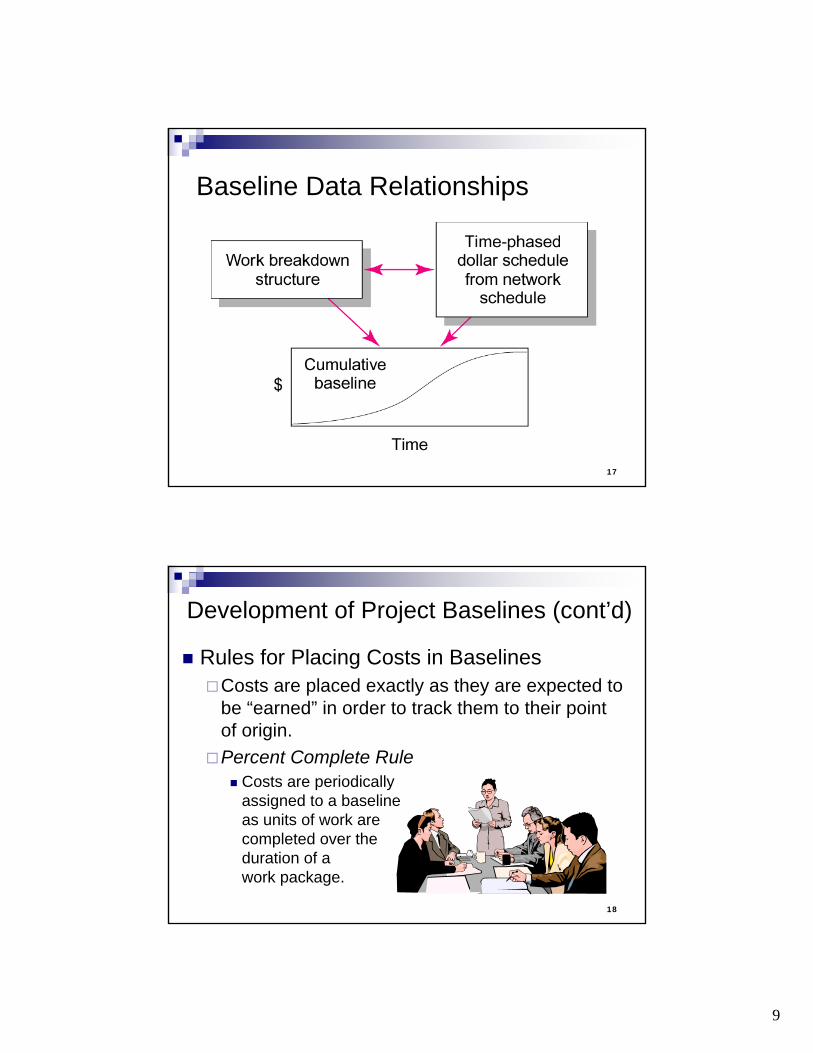
Baseline Data Relationships
18
Development of Project Baselines (cont’d)
Rules for Placing Costs in BaselinesCosts are placed exactly as they are expected to be “earned” in order to track them to their point of origin.Percent Complete Rule
Costs are periodicallyassigned to a baseline as units of work are completed over the duration of a work package.
10
19
Methods of Variance AnalysisComparing Earned Value
With the expected schedule valueWith the actual costs
Assessing Status of a ProjectRequired data elements
Data Budgeted cost of the work scheduled (PV)Budgeted cost of the work completed (EV)Actual cost of the work completed (AC)
Calculate schedule and cost variancesA positive variance indicates a desirable condition, while a negative variance suggests problems or changes that have taken place.
20
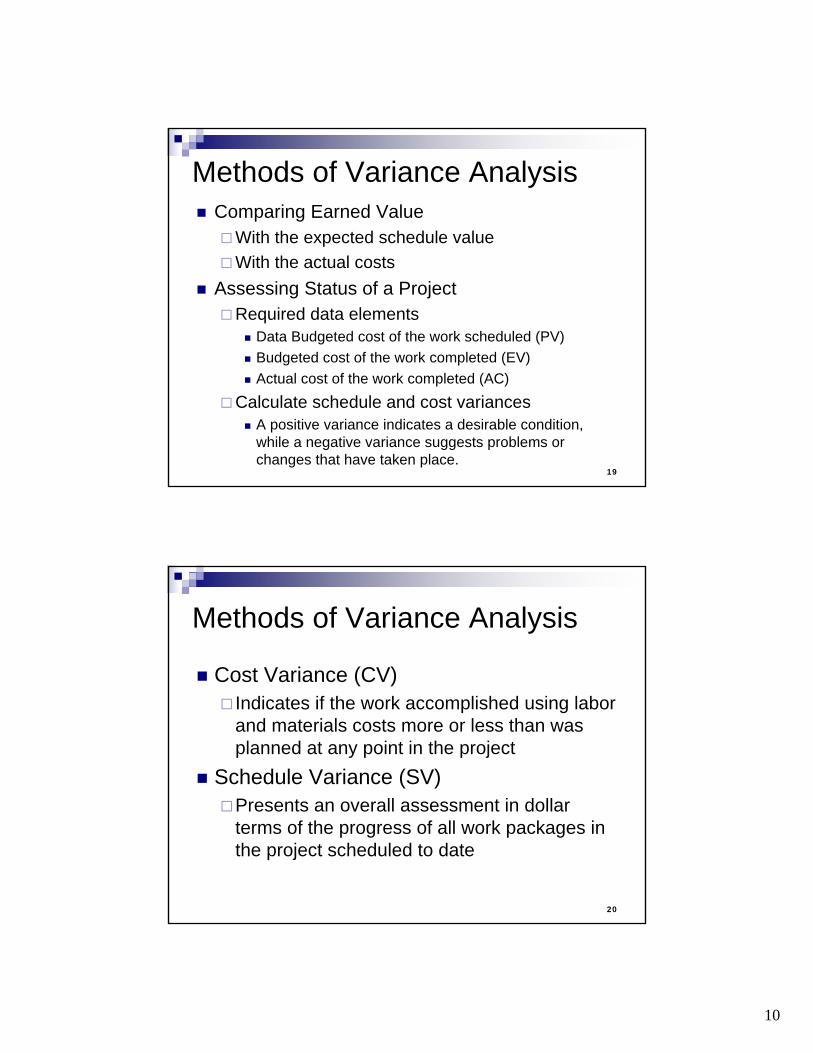
Methods of Variance Analysis
Cost Variance (CV)Indicates if the work accomplished using labor and materials costs more or less than was planned at any point in the project
Schedule Variance (SV)Presents an overall assessment in dollar terms of the progress of all work packages in the project scheduled to date
11
21
Cost/Schedule Graph
22
Earned Value Review Exercise
12
23
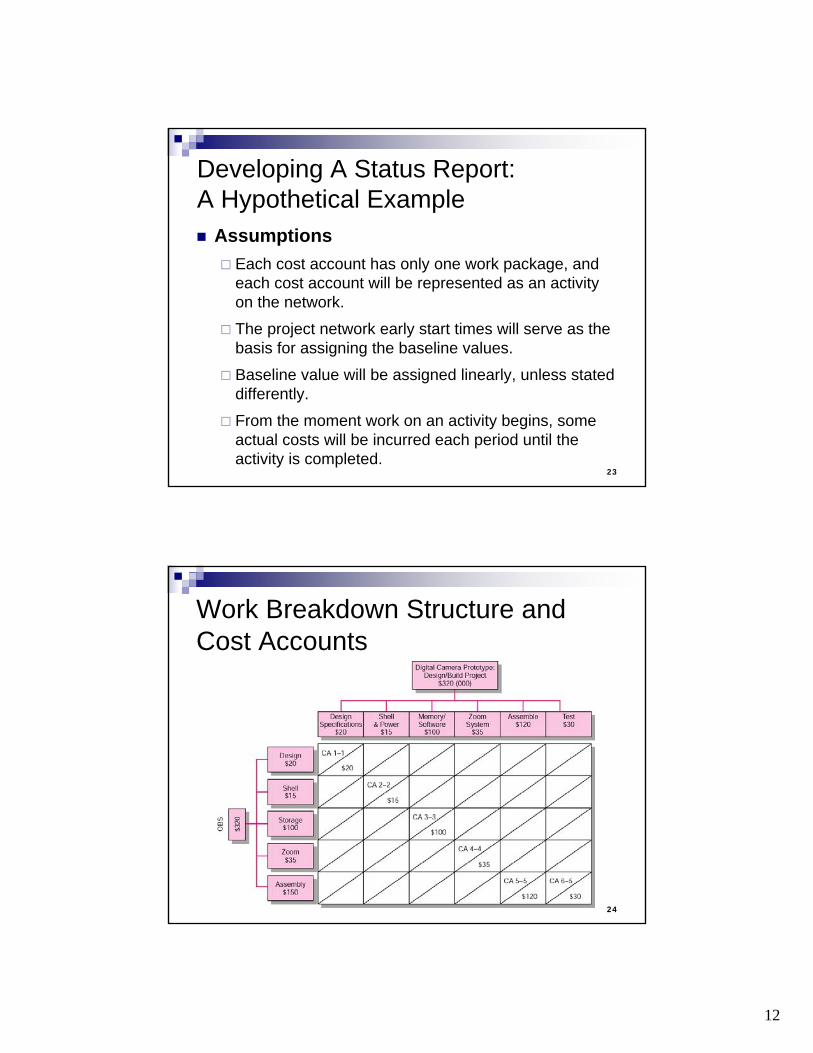
Developing A Status Report:A Hypothetical Example
AssumptionsEach cost account has only one work package, and each cost account will be represented as an activity on the network.
The project network early start times will serve as the basis for assigning the baseline values.
Baseline value will be assigned linearly, unless stated differently.
From the moment work on an activity begins, some actual costs will be incurred each period until the activity is completed.
24
Work Breakdown Structure and Cost Accounts
13
25
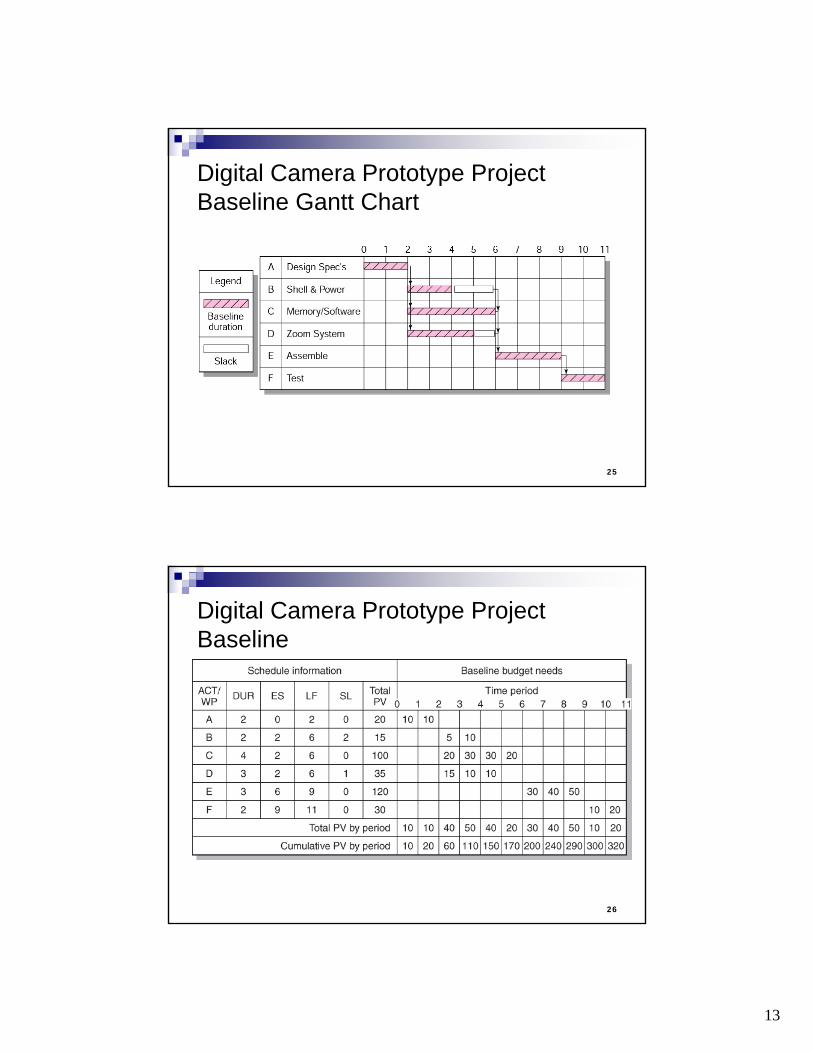
Digital Camera Prototype Project Baseline Gantt Chart
26
Digital Camera Prototype Project Baseline
14
27
Digital Camera Prototype Status Reports: Periods 1–3
28
Digital Camera Prototype Status Reports: Periods 4–6
15
29
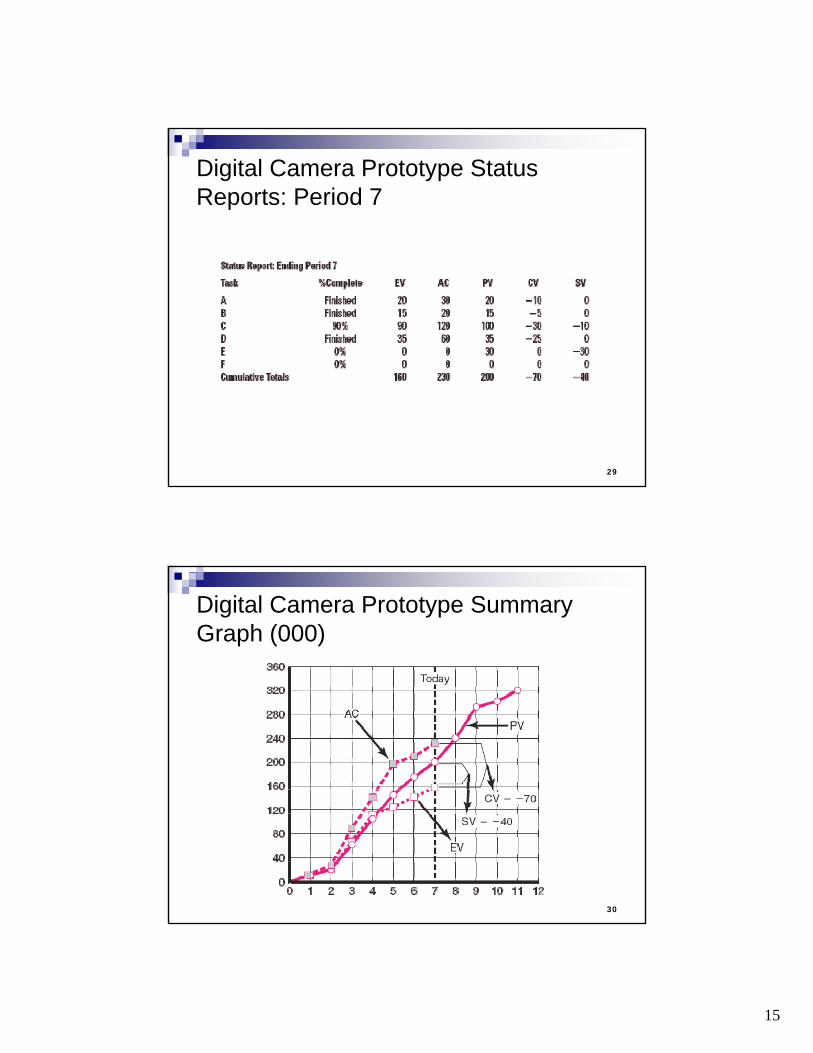
Digital Camera Prototype Status Reports: Period 7
30
Digital Camera Prototype Summary Graph (000)
16
31
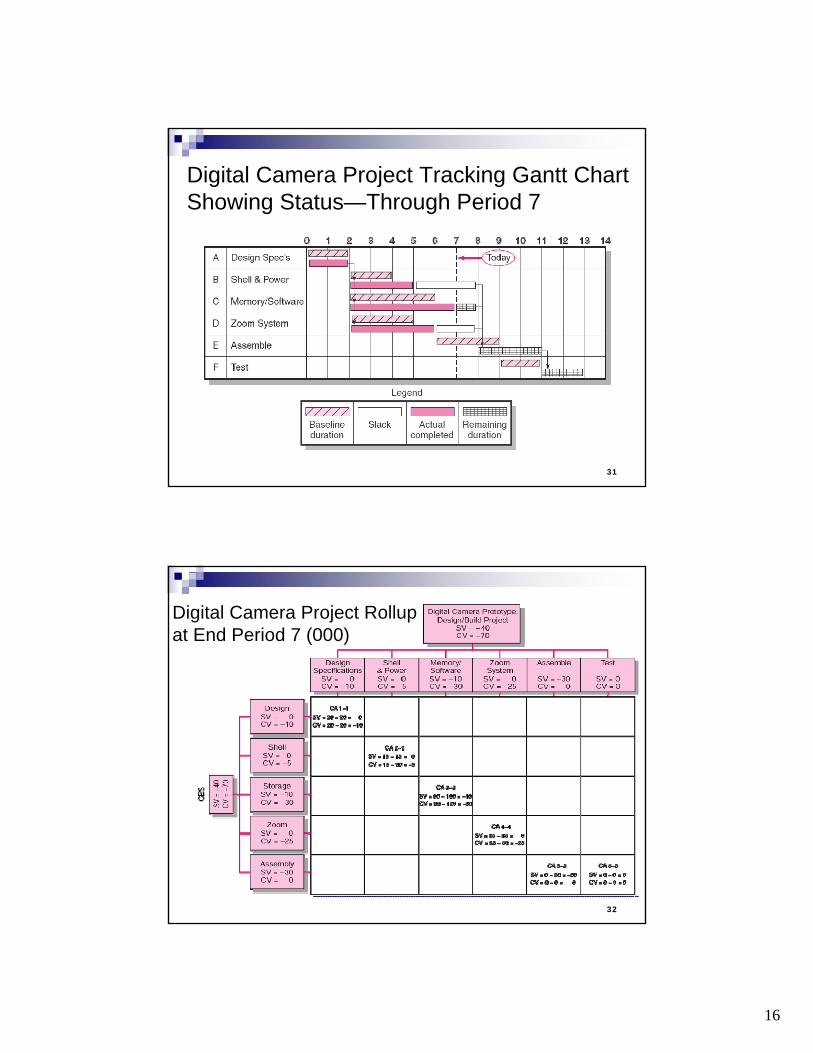
Digital Camera Project Tracking Gantt Chart Showing Status—Through Period 7
32
Digital Camera Project Rollup at End Period 7 (000)
17
33
Indexes to Monitor ProgressPerformance Indexes
Cost Performance Index (CPI)Measures the cost efficiency of work accomplished to dateCPI = EV/AC
Scheduling Performance Index (SPI)Measures scheduling efficiencySPI = EV/PV
Percent Complete IndexesIndicates how much of the work accomplished represents of the total budgeted (BAC) and actual (AC) dollars to datePCIB = EV/BAC PCIC = AC/EAC
34
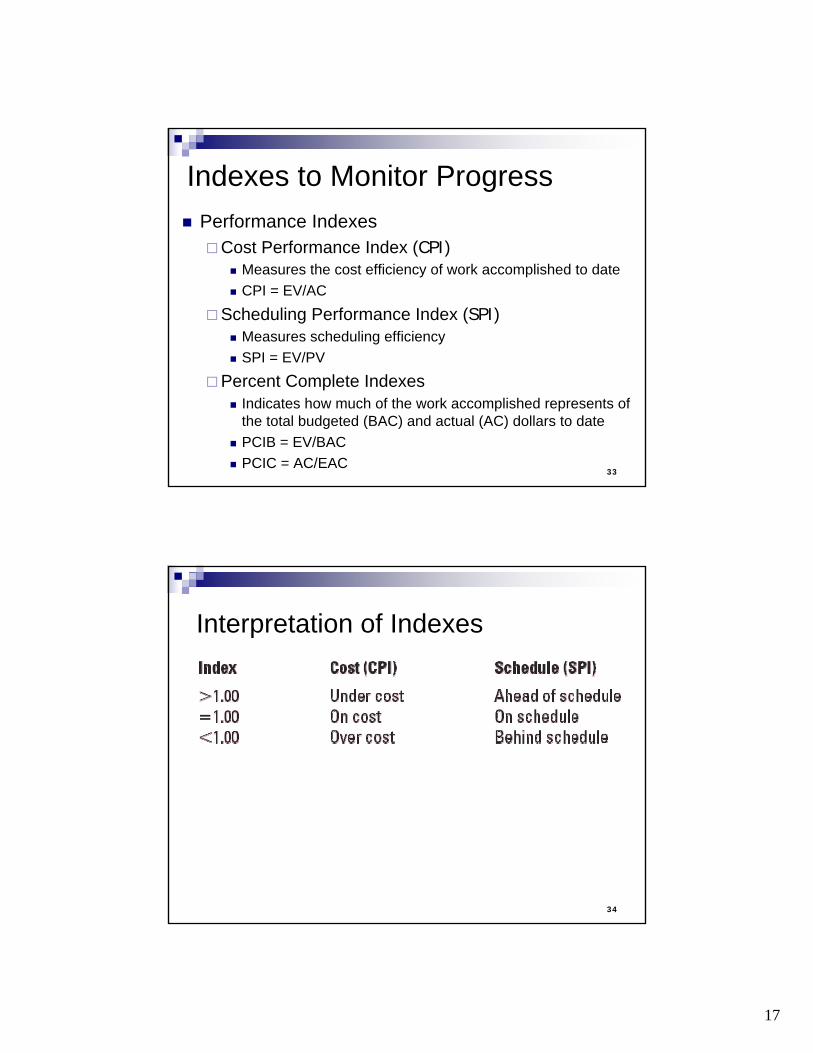
Interpretation of Indexes
TABLE 13.3
18
35
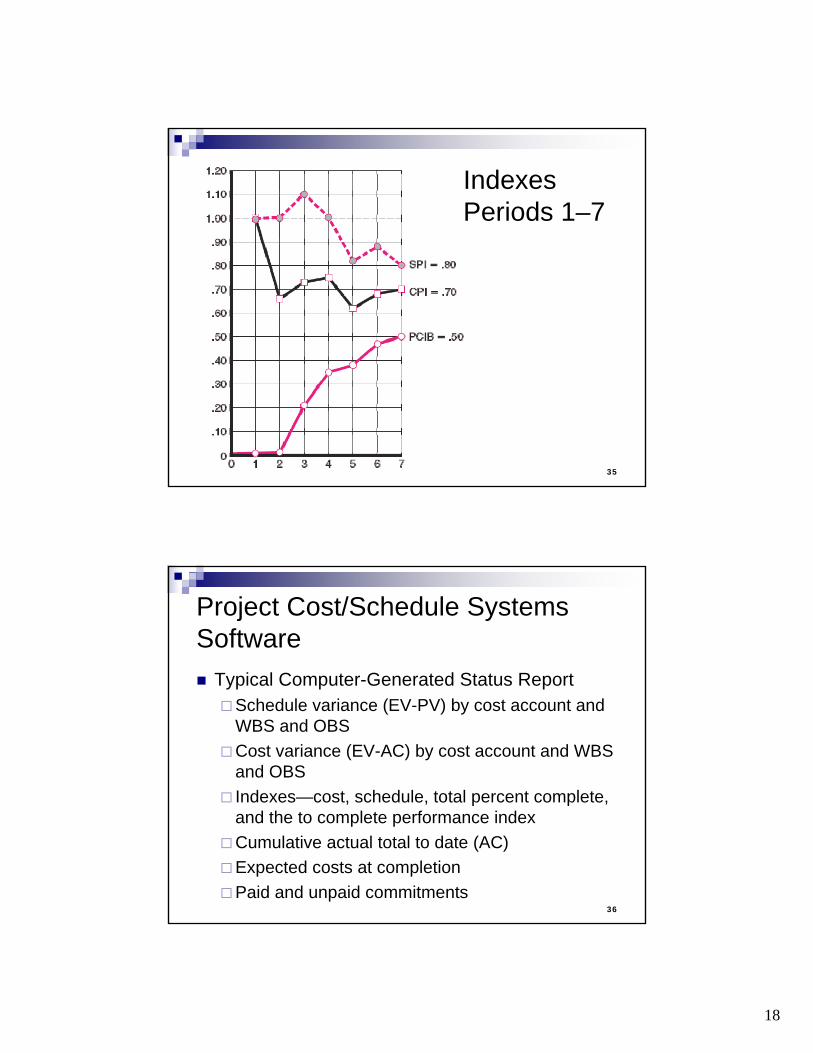
Indexes Periods 1–7
FIGURE 13.12
36
Project Cost/Schedule Systems Software
Typical Computer-Generated Status ReportSchedule variance (EV-PV) by cost account and WBS and OBSCost variance (EV-AC) by cost account and WBS and OBSIndexes—cost, schedule, total percent complete, and the to complete performance indexCumulative actual total to date (AC)Expected costs at completionPaid and unpaid commitments
19
37
Additional Earned Value RulesRules Applied to Short-Duration Activities and/or Small-Cost Activities
0/100 percent ruleAssumes 100 % of budget credit is earned at once and only when the work is completed
50/50 ruleAllows for 50% of the value of the work package budget to be earned when it is started and 50% to be earned when the package is completed
38
Forecasting Final Project CostMethods Used to Revise Estimates of Future Project Costs:
EACreAllows experts in the field to change original baseline durations and costs because new information tells them the original estimates are not accurate
EACfUses actual costs-to-date plus an efficiency index to project final costs in large projects where the original budget is unreliable
20
39
Forecasting Model: EACf
The equation for this forecasting model:
40
To Complete Performance Index (TCPI)
BAC - EVTCPI= BAC – AC
TCPI = the amount of value each remaining dollar in the budget must earn to stay within budget
21
41
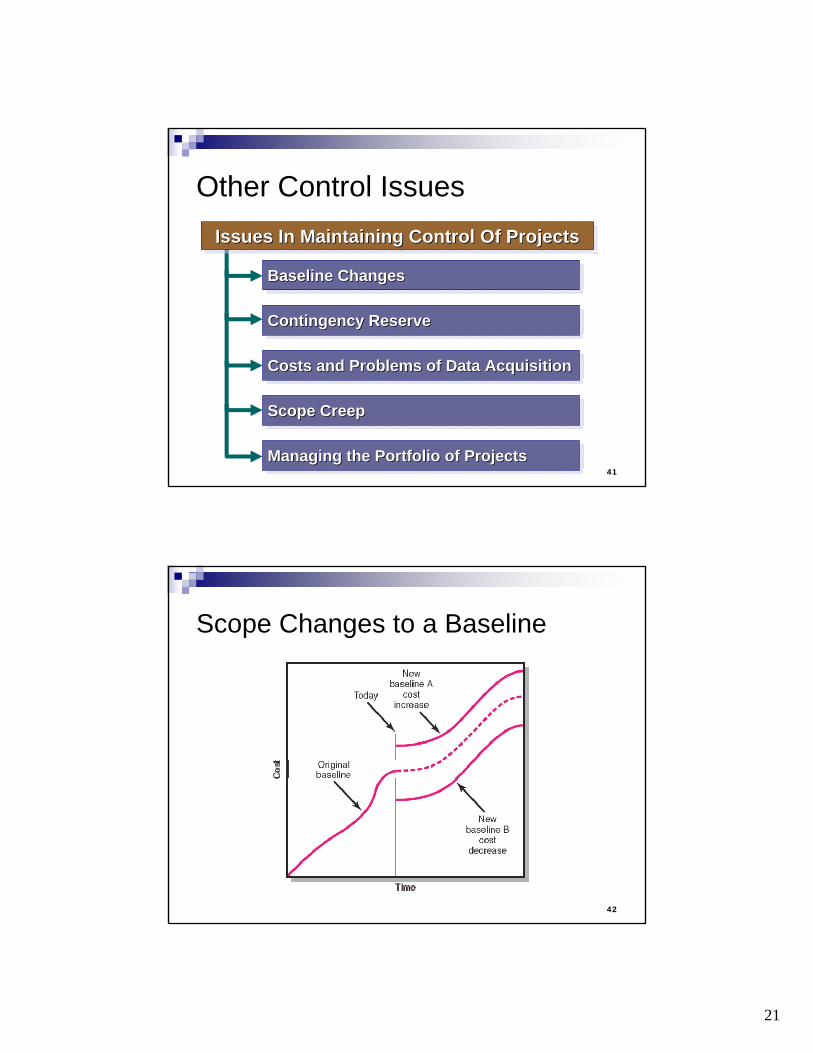
Other Control Issues
Issues In Maintaining Control Of ProjectsIssues In Maintaining Control Of ProjectsIssues In Maintaining Control Of Projects
Baseline ChangesBaseline ChangesBaseline Changes
Contingency ReserveContingency ReserveContingency Reserve
Costs and Problems of Data AcquisitionCosts and Problems of Data AcquisitionCosts and Problems of Data Acquisition
Scope CreepScope CreepScope Creep
Managing the Portfolio of ProjectsManaging the Portfolio of ProjectsManaging the Portfolio of Projects
42
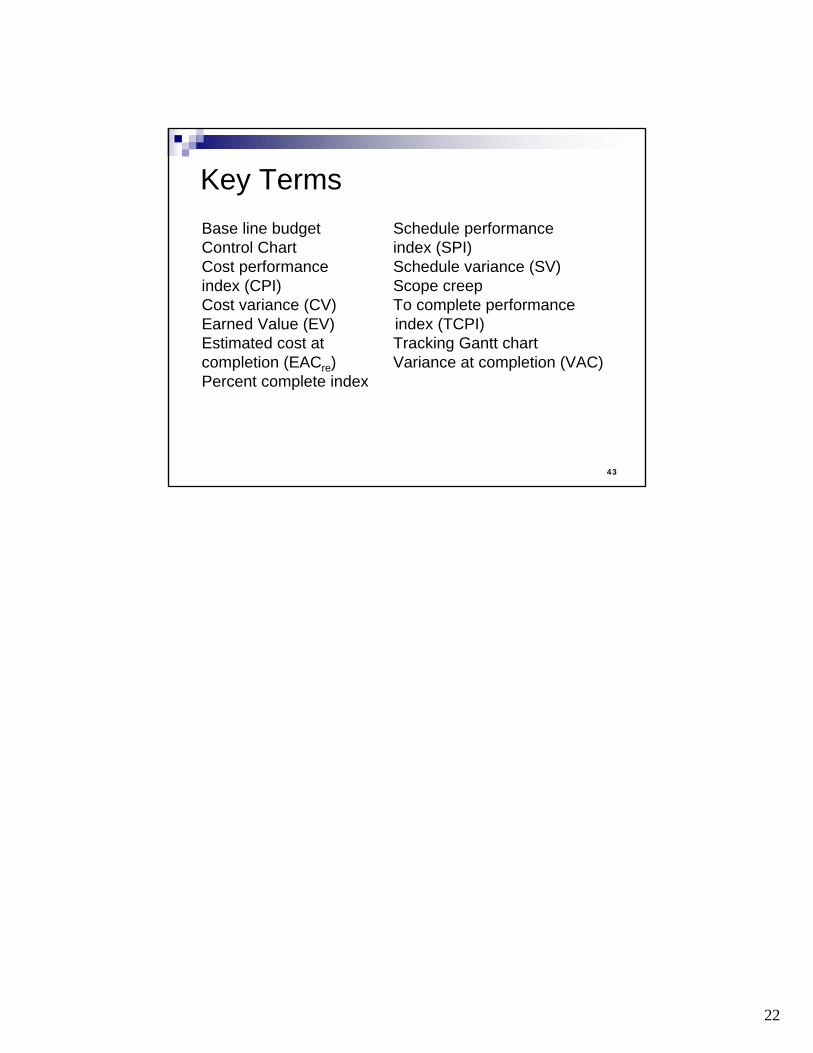
Scope Changes to a Baseline
22
43
Key TermsBase line budget Schedule performance Control Chart index (SPI)Cost performance Schedule variance (SV)index (CPI) Scope creepCost variance (CV) To complete performanceEarned Value (EV) index (TCPI)Estimated cost at Tracking Gantt chartcompletion (EACre) Variance at completion (VAC)Percent complete index


![Measurement & Evaluation [2006_nou Nigeria]](https://img.pdfslide.net/doc/110x75/5447f00cafaf9f41088b4698/measurement-evaluation-2006nou-nigeria.jpg)