Embed Size (px)
Citation preview
Chapter 12 Infrared Spectroscopy and
Mass Spectrometry
Jo BlackburnRichland College, Dallas, TX
Dallas County Community College District© 2006, Prentice Hall
Organic Chemistry, 6th EditionL. G. Wade, Jr.
Introduction
•Spectroscopy is an analytical technique which helps determine structure.
•It destroys little or no sample.•The amount of light absorbed by the
sample is measured as wavelength is varied.
=>
Types of Spectroscopy•Infrared (IR) spectroscopy measures the bond
vibration frequencies in a molecule and is used to determine the functional group.
•Mass spectrometry (MS) fragments the molecule and measures the masses.
•Nuclear magnetic resonance (NMR) spectroscopy detects signals from hydrogen
atoms and can be used to distinguish isomers. •Ultraviolet (UV) spectroscopy uses electron
transitions to determine bonding patterns. =>
Electromagnetic Spectrum
•Examples: X rays, microwaves, radio waves, visible light, IR, and UV.
•Frequency and wavelength are inversely proportional.
•c = λν, where c is the speed of light.•Energy per photon = hν, where h is
Planck’s constant, 6.62 x 10-37 kJ•sec. =>
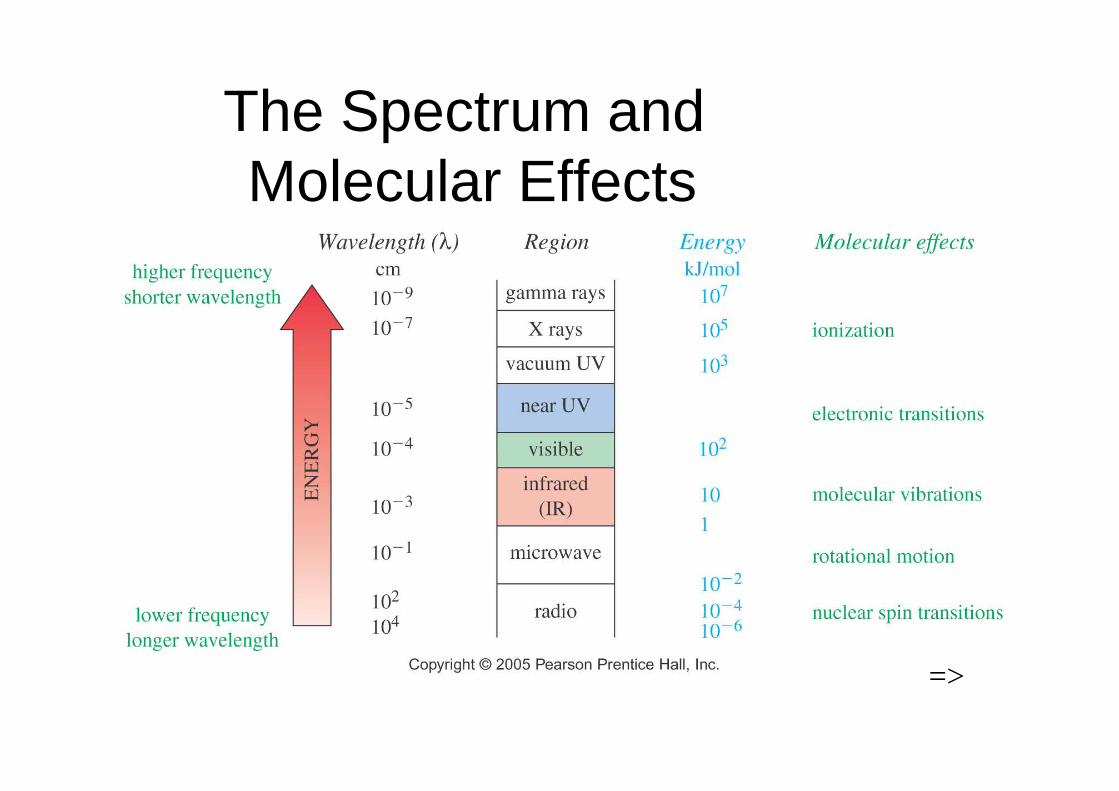
The Spectrum and Molecular Effects
=>
The IR Region•Just below red in the visible region.•Wavelengths usually 2.5-25 µm.•More common units are wavenumbers, or
cm-1, the reciprocal of the wavelength in centimeters.
•Wavenumbers are proportional to frequency and energy. =>
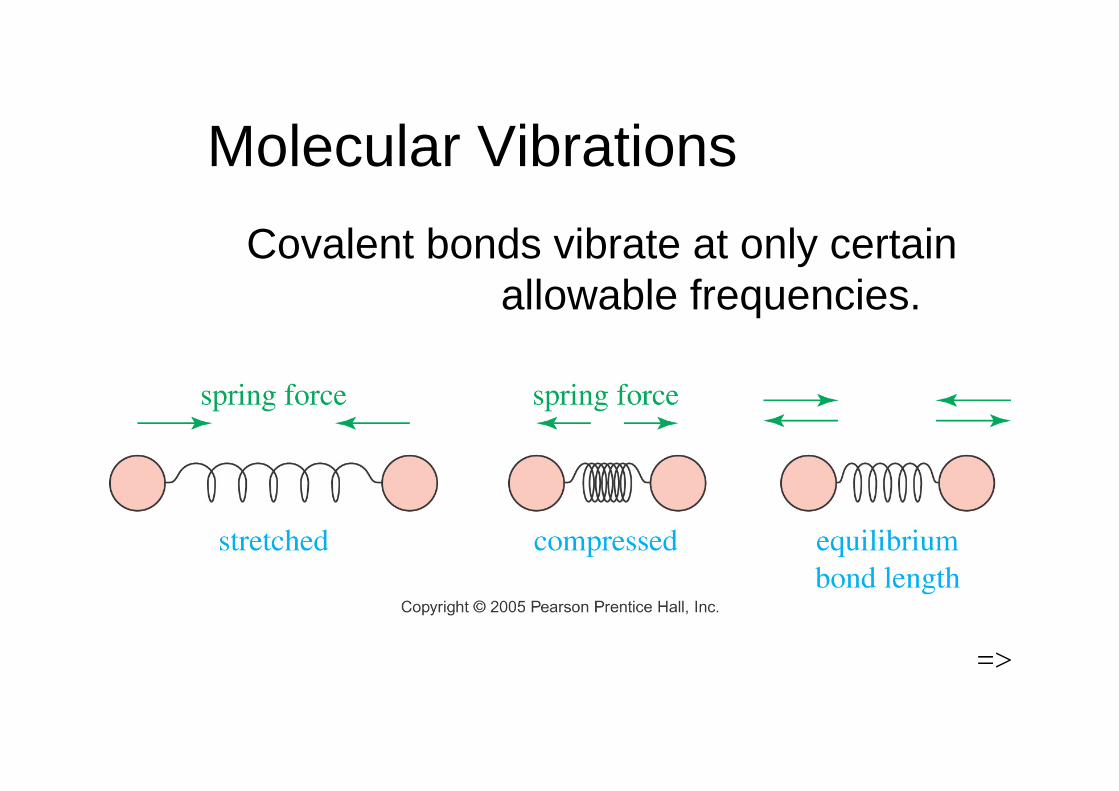
Molecular VibrationsCovalent bonds vibrate at only certain
allowable frequencies.
=>
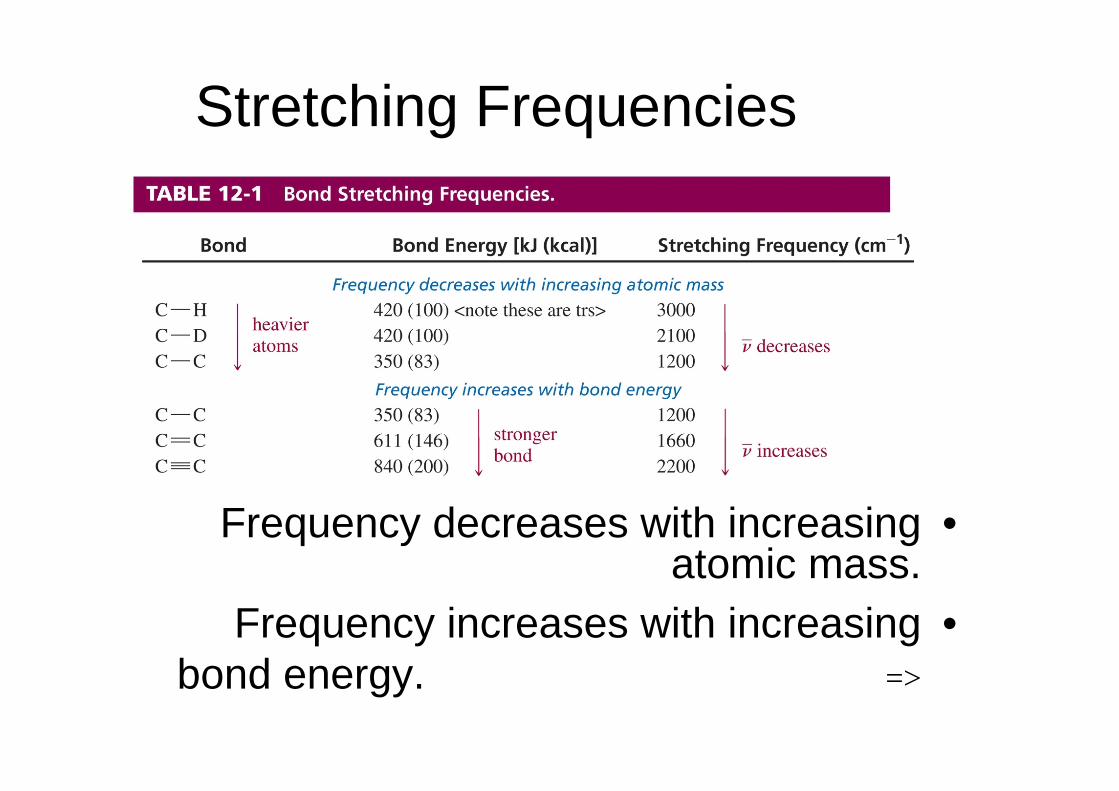
Stretching Frequencies
•Frequency decreases with increasing atomic mass.
•Frequency increases with increasing bond energy. =>
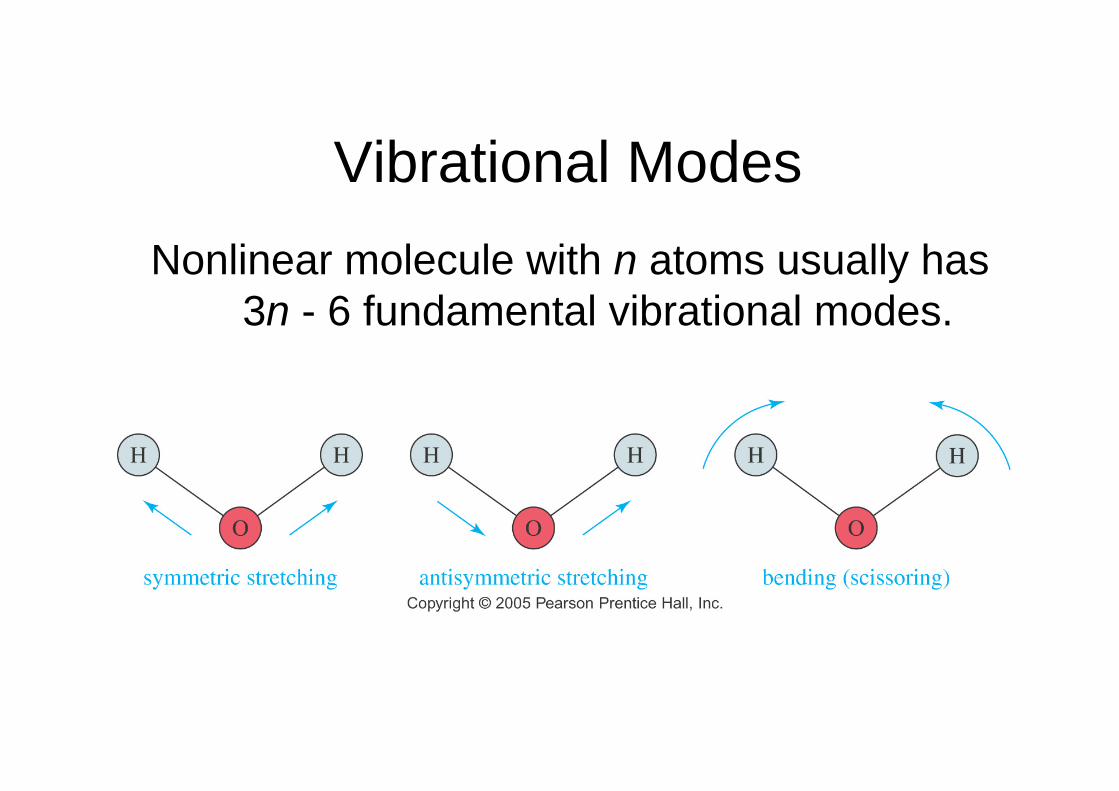
Vibrational ModesNonlinear molecule with n atoms usually has
3n - 6 fundamental vibrational modes.
Fingerprint of Molecule
•Whole-molecule vibrations and bending vibrations are also quantized.
•No two molecules will give exactly the same IR spectrum (except enantiomers).
•Simple stretching: 1600-3500 cm-1.•Complex vibrations: 600-1400 cm-1,
called the “fingerprint region.”=>
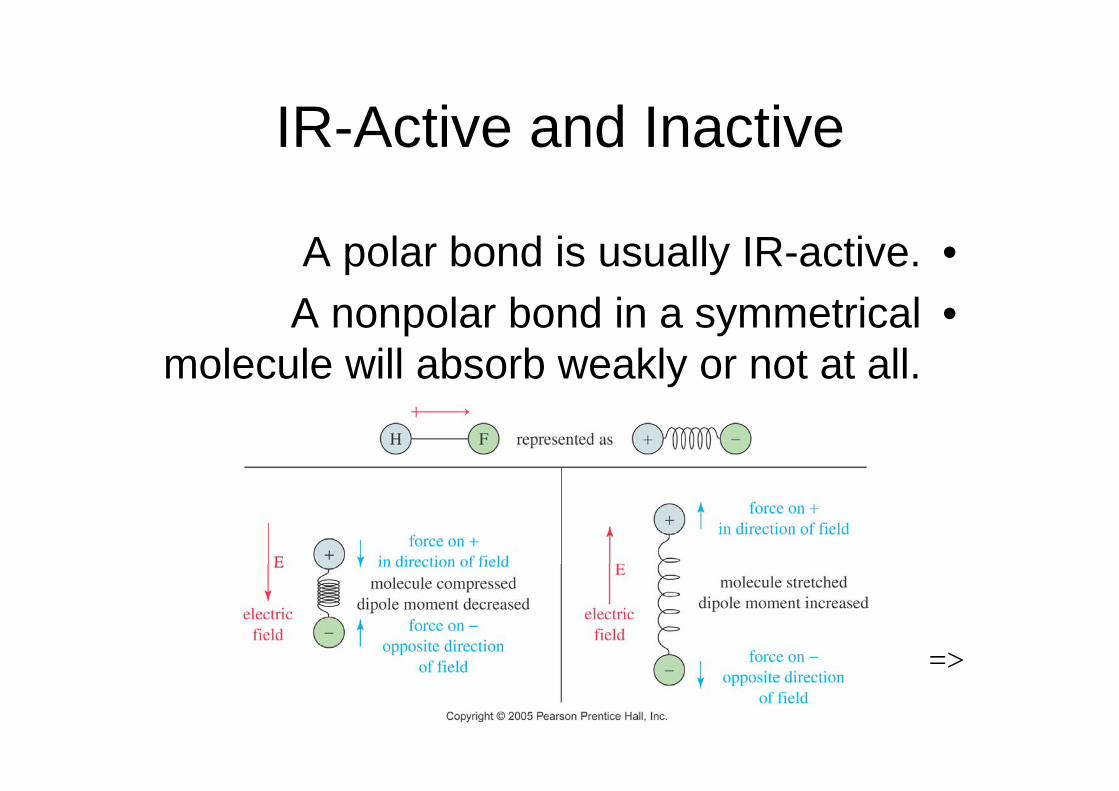
IR-Active and Inactive
•A polar bond is usually IR-active.•A nonpolar bond in a symmetrical
molecule will absorb weakly or not at all.
=>
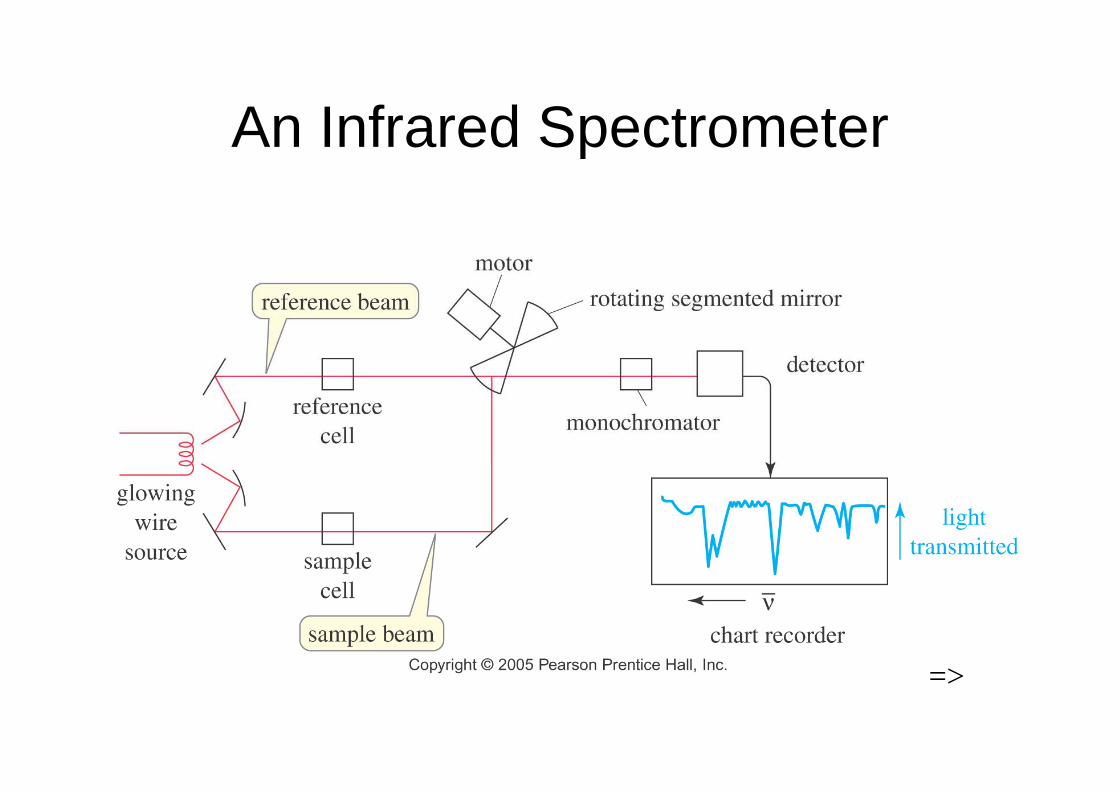
An Infrared Spectrometer
=>
FT-IR Spectrometer
•Has better sensitivity.•Less energy is needed from source.•Completes a scan in 1-2 seconds.•Takes several scans and averages them.•Has a laser beam that keeps the
instrument accurately calibrated. =>
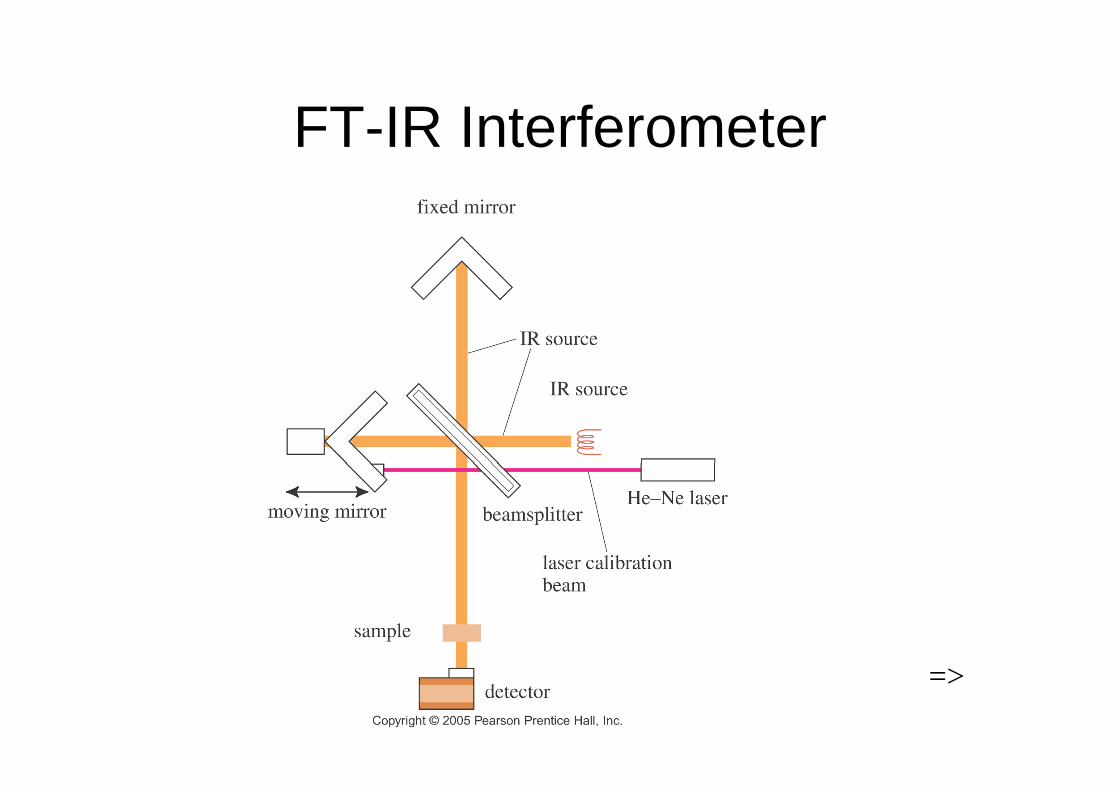
FT-IR Interferometer
=>
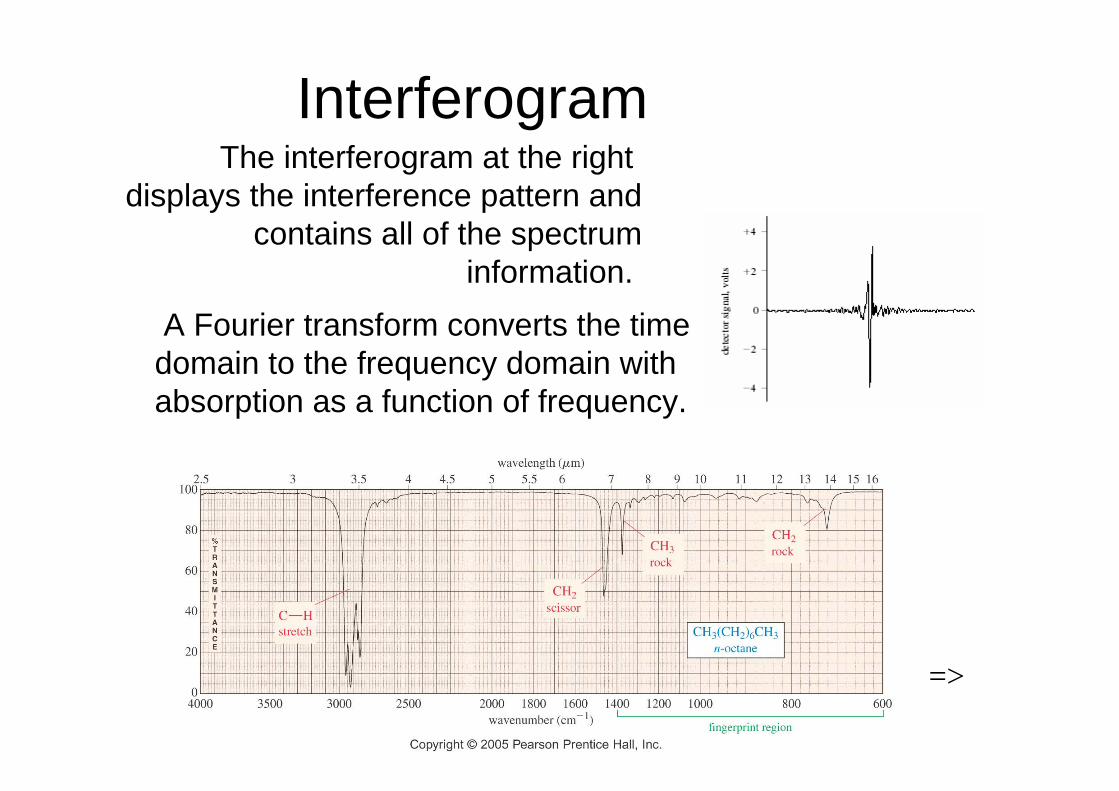
InterferogramThe interferogram at the right
displays the interference pattern and contains all of the spectrum
information.
=>
A Fourier transform converts the time domain to the frequency domain with absorption as a function of frequency.
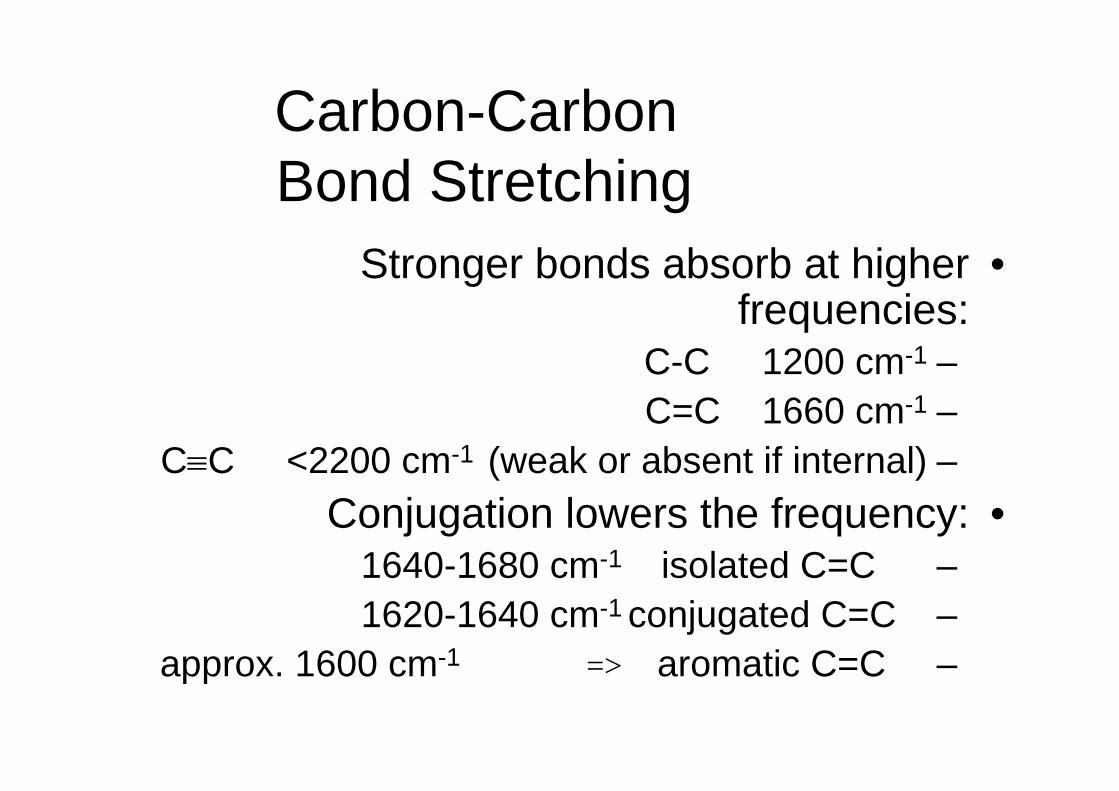
Carbon-Carbon Bond Stretching
•Stronger bonds absorb at higher frequencies:
–C-C 1200 cm-1
–C=C 1660 cm-1
–C≡C <2200 cm-1 (weak or absent if internal)•Conjugation lowers the frequency:
–isolated C=C 1640-1680 cm-1
–conjugated C=C 1620-1640 cm-1
–aromatic C=C approx. 1600 cm-1 =>
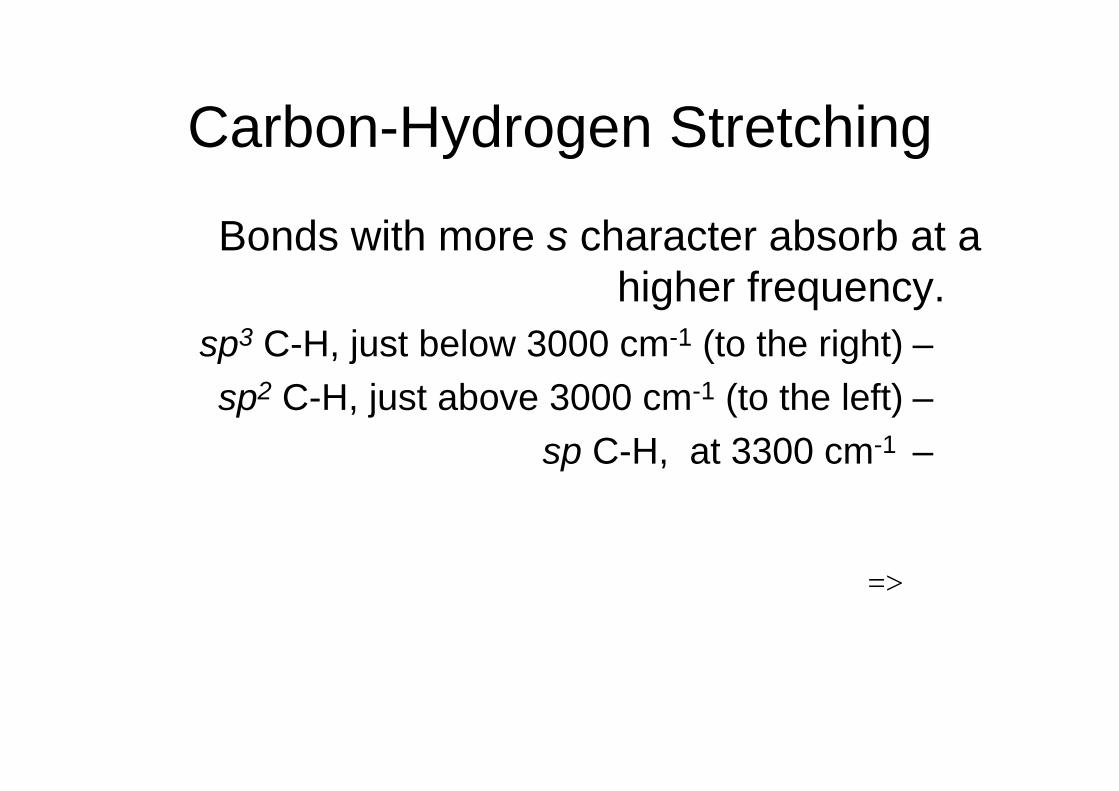
Carbon-Hydrogen Stretching
Bonds with more s character absorb at a higher frequency.
–sp3 C-H, just below 3000 cm-1 (to the right)–sp2 C-H, just above 3000 cm-1 (to the left)–sp C-H, at 3300 cm-1
=>
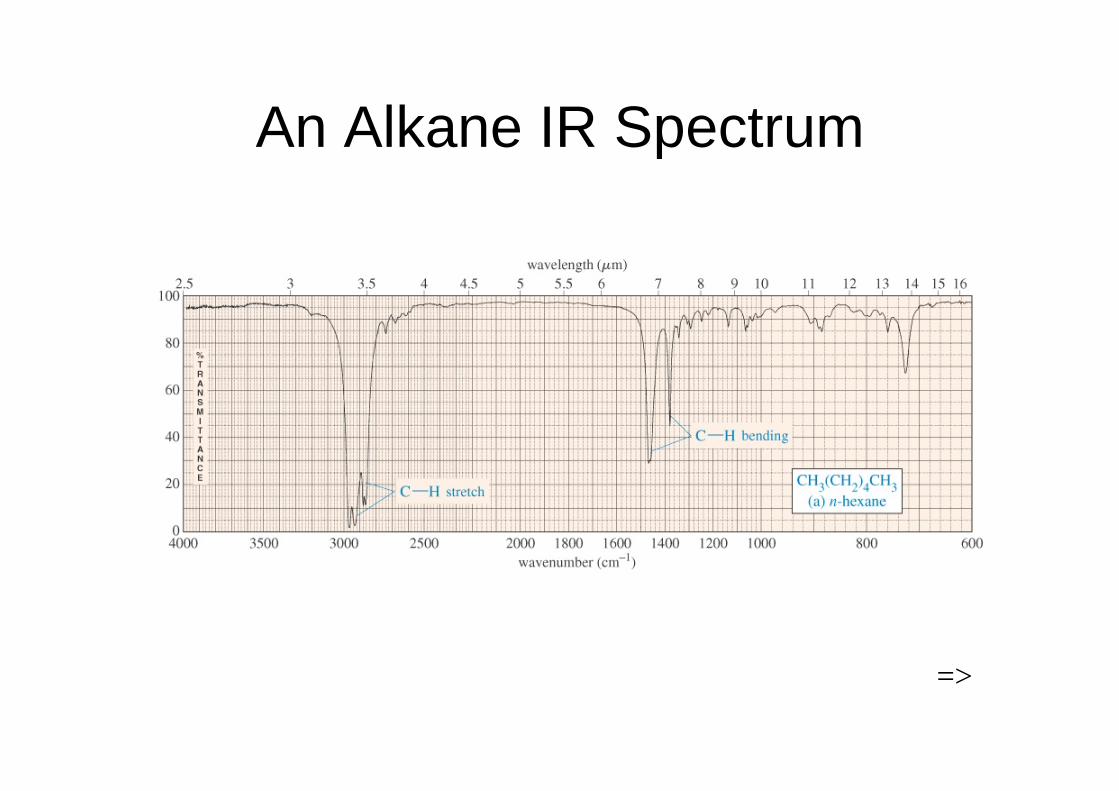
An Alkane IR Spectrum
=>
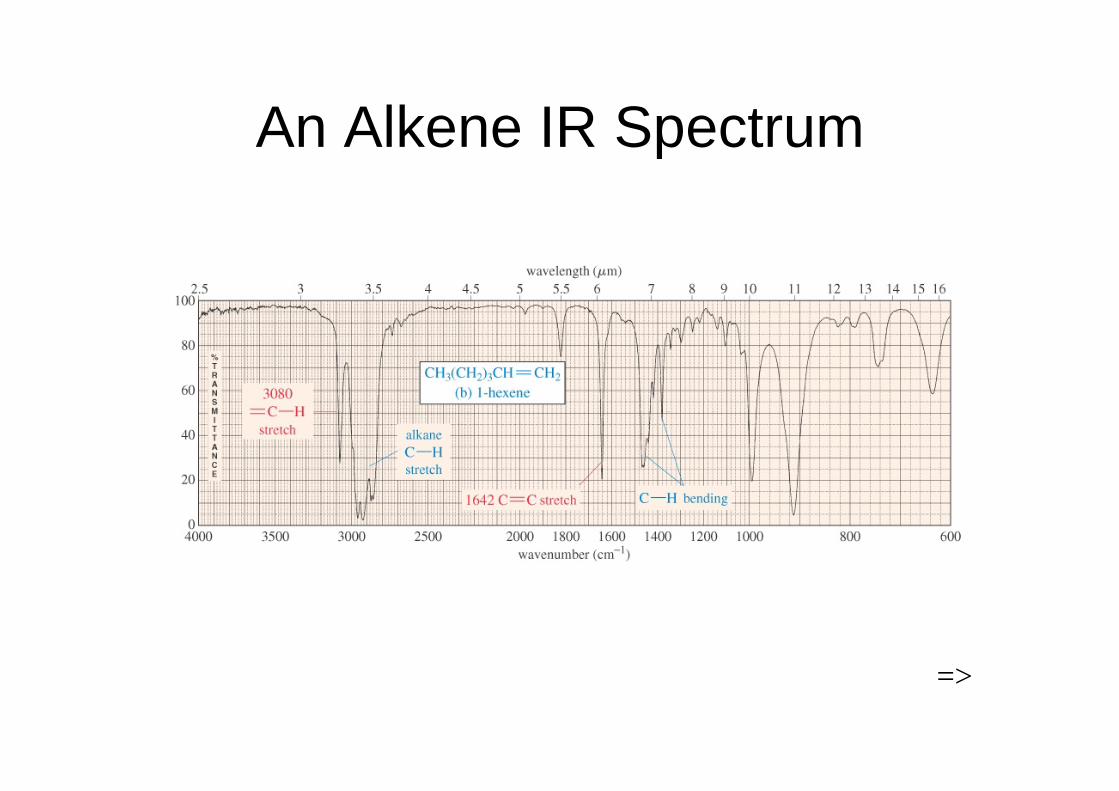
An Alkene IR Spectrum
=>
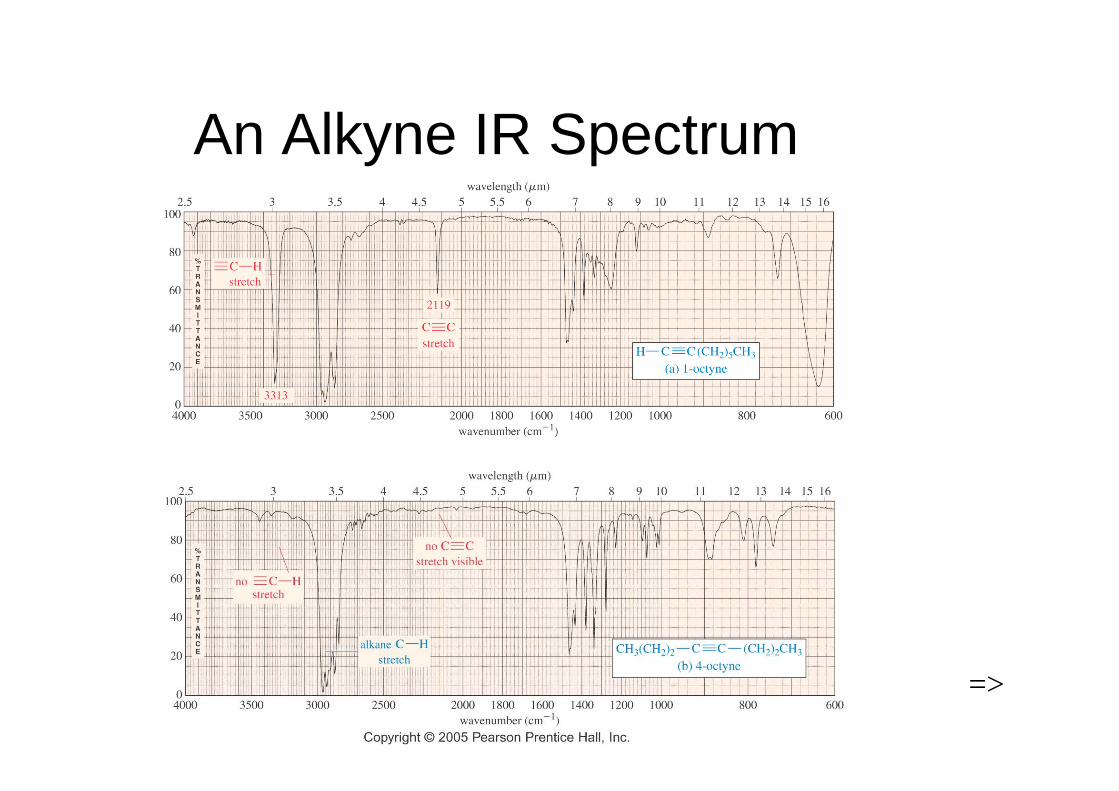
An Alkyne IR Spectrum
=>
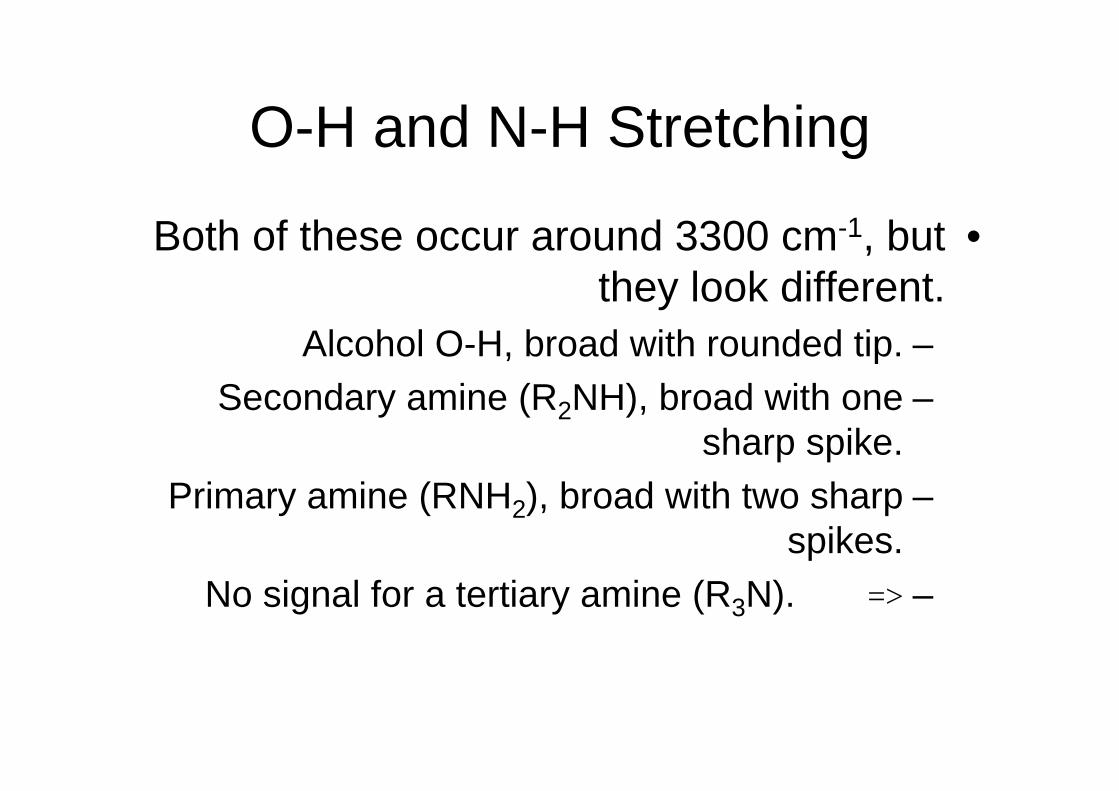
O-H and N-H Stretching
•Both of these occur around 3300 cm-1, but they look different.
–Alcohol O-H, broad with rounded tip.–Secondary amine (R2NH), broad with one
sharp spike.–Primary amine (RNH2), broad with two sharp
spikes.–No signal for a tertiary amine (R3N). =>
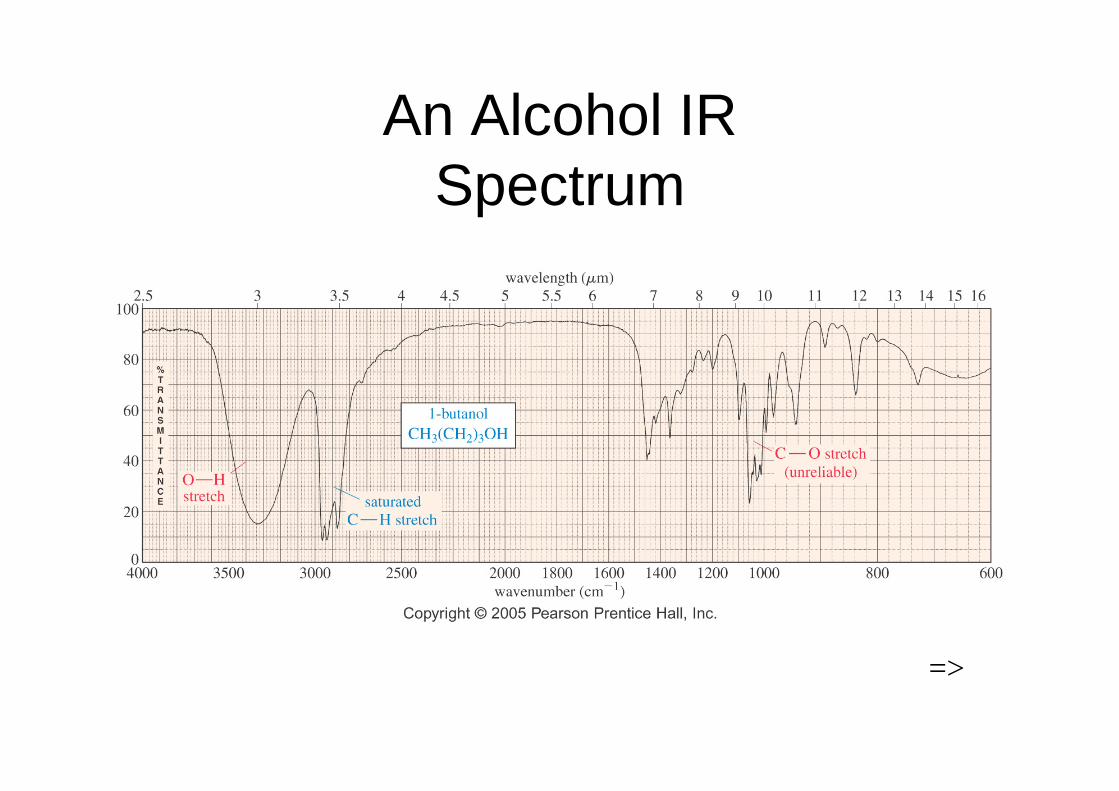
An Alcohol IR Spectrum
=>
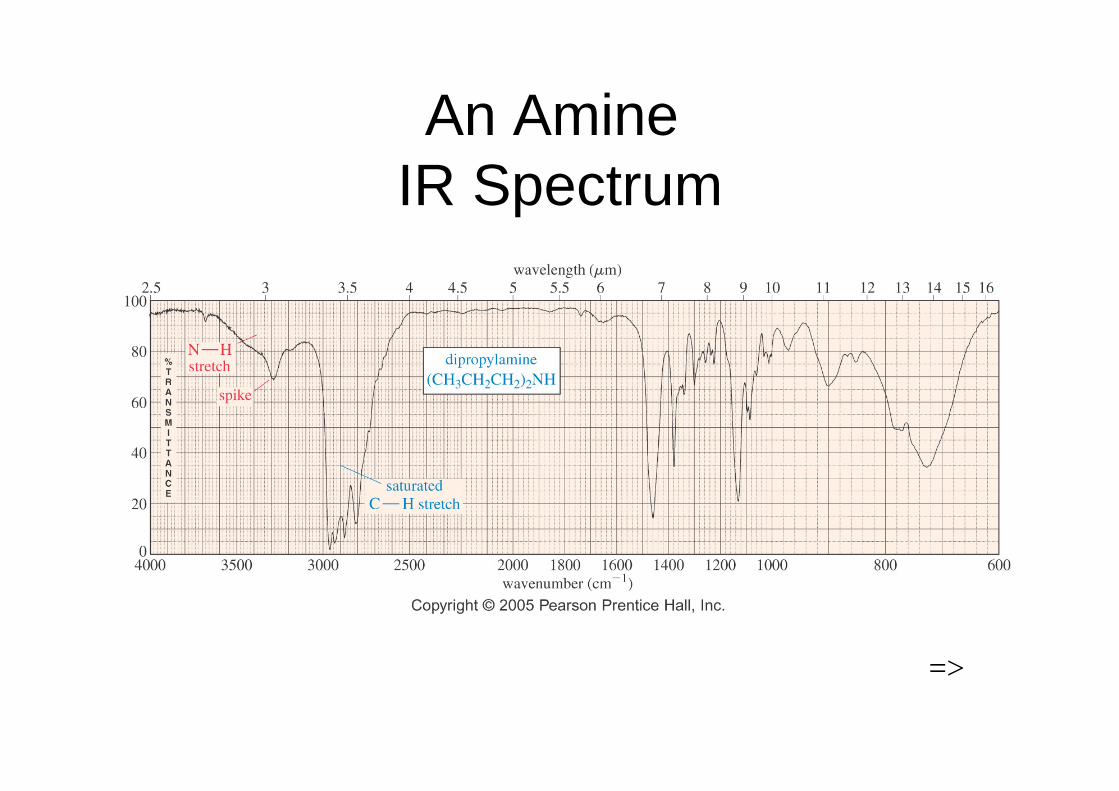
An Amine IR Spectrum
=>
Carbonyl Stretching
•The C=O bond of simple ketones, aldehydes, and carboxylic acids absorb
around 1710 cm-1.•Usually, it’s the strongest IR signal.•Carboxylic acids will have O-H also.•Aldehydes have two C-H signals around
2700 and 2800 cm-1. =>
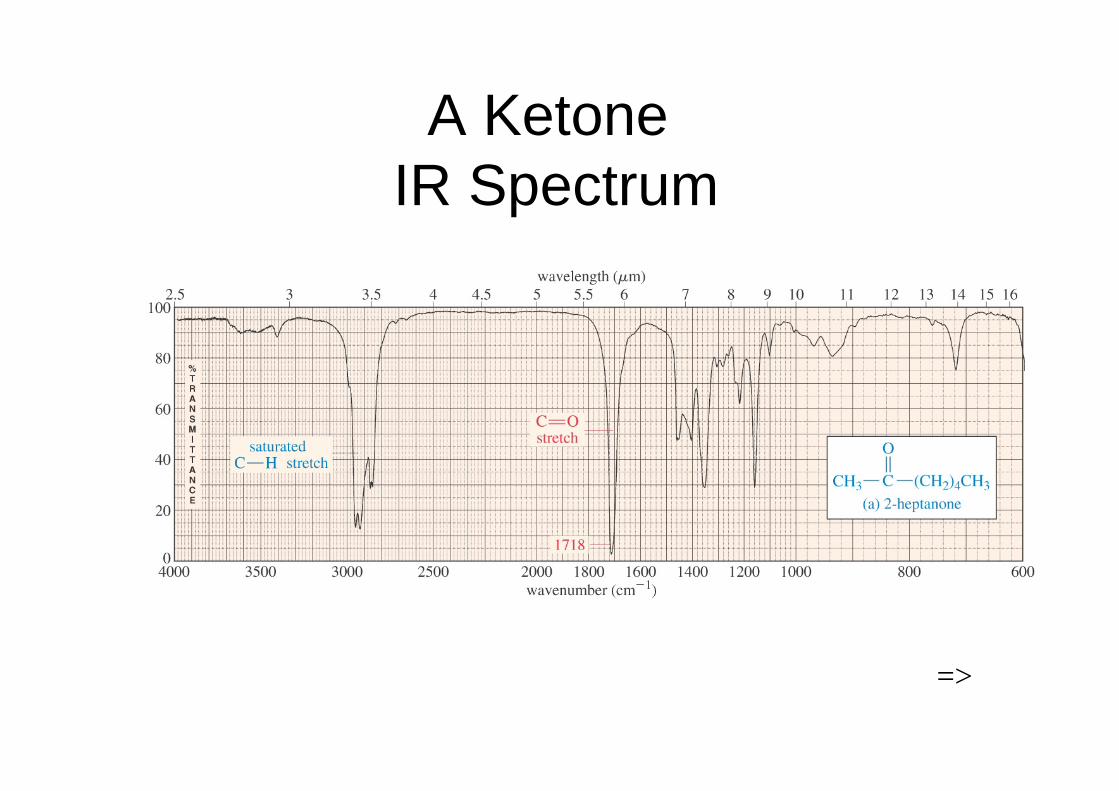
A Ketone IR Spectrum
=>
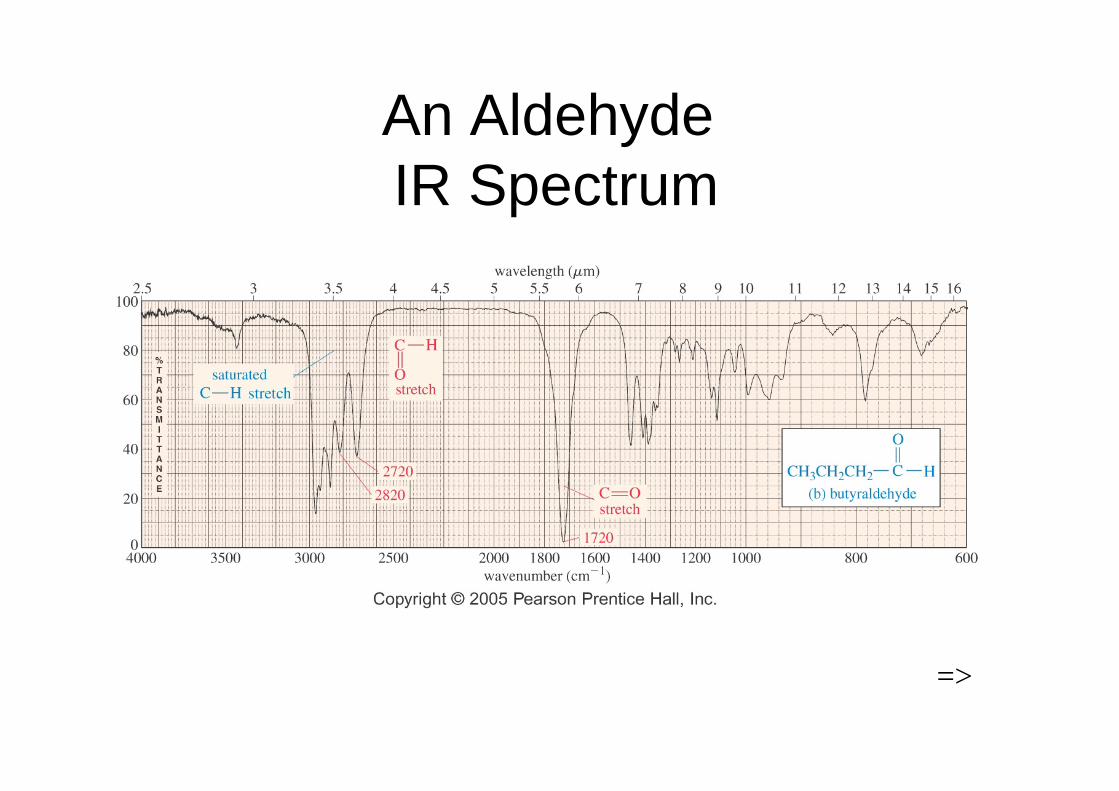
An Aldehyde IR Spectrum
=>
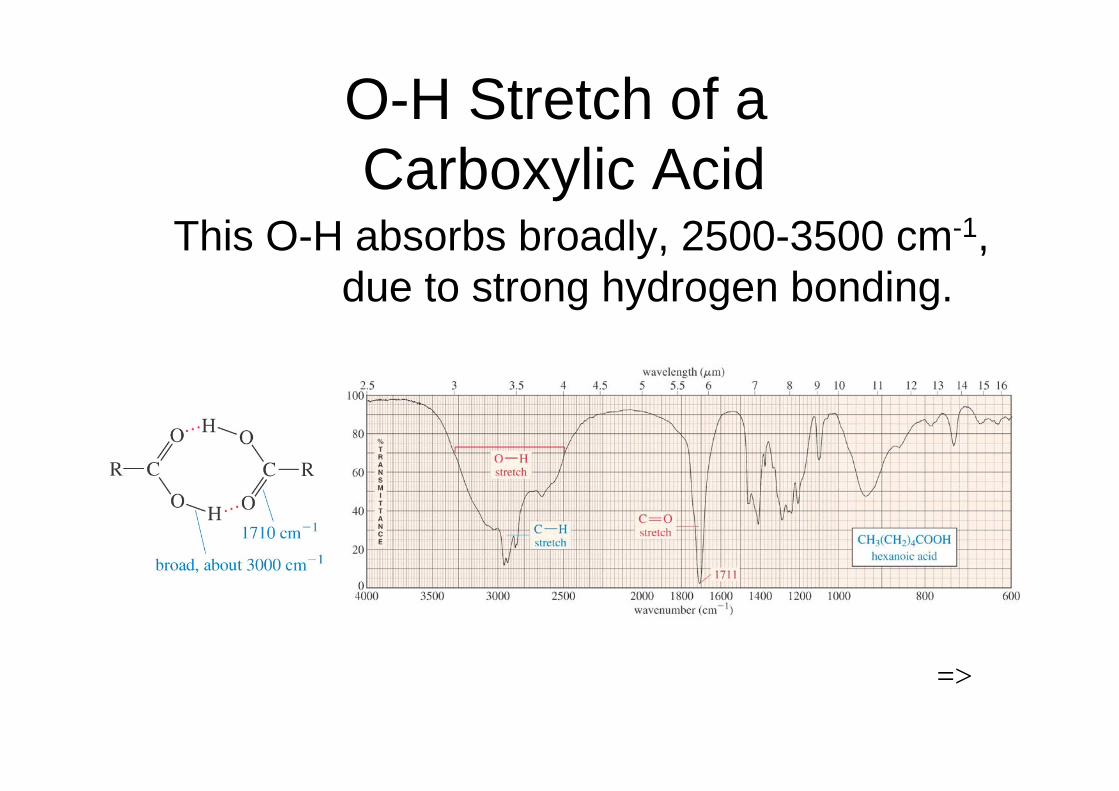
O-H Stretch of a Carboxylic Acid
This O-H absorbs broadly, 2500-3500 cm-1, due to strong hydrogen bonding.
=>
Variations in C=O Absorption
•Conjugation of C=O with C=C lowers the stretching frequency to ~1680 cm-1.
•The C=O group of an amide absorbs at an even lower frequency, 1640-1680 cm-1.
•The C=O of an ester absorbs at a higher frequency, ~1730-1740 cm-1.
•Carbonyl groups in small rings (5 C’s or less) absorb at an even higher frequency. =>
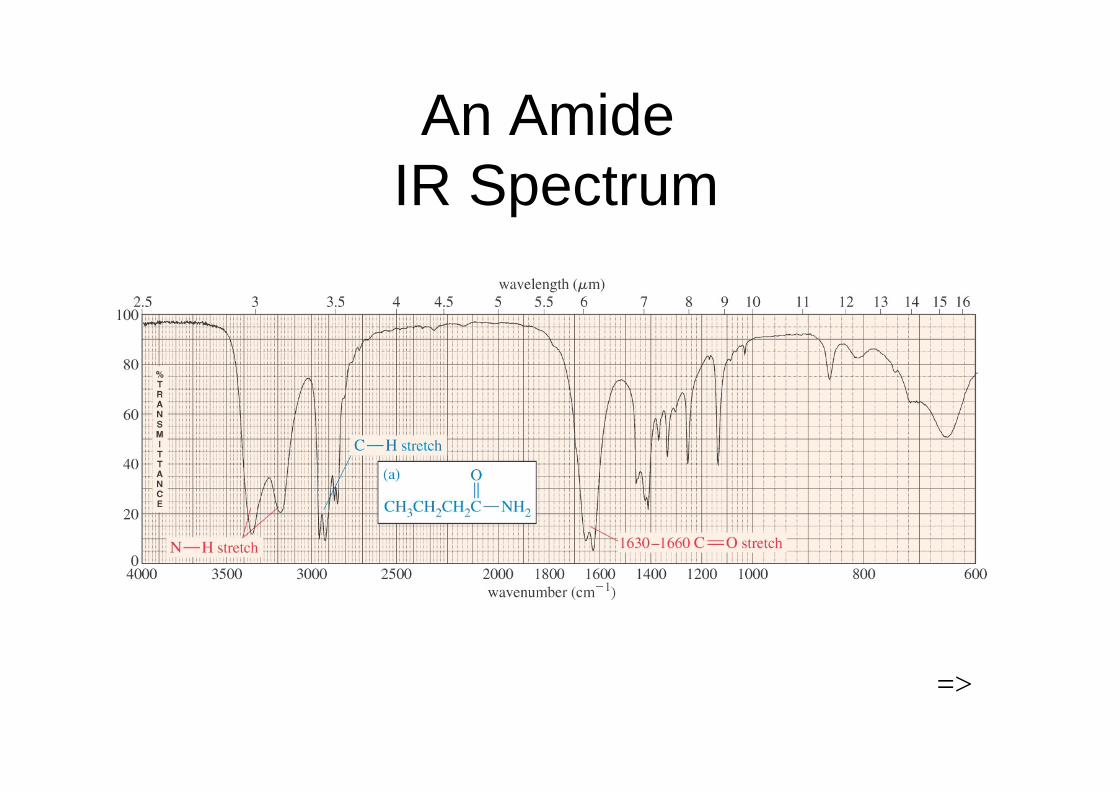
An Amide IR Spectrum
=>
Carbon - Nitrogen Stretching
•C - N absorbs around 1200 cm-1.•C = N absorbs around 1660 cm-1 and is
much stronger than the C = C absorption in the same region.
•C ≡ N absorbs strongly just above 2200 cm-1. The alkyne C ≡ C signal is much
weaker and is just below 2200 cm-1 .=>
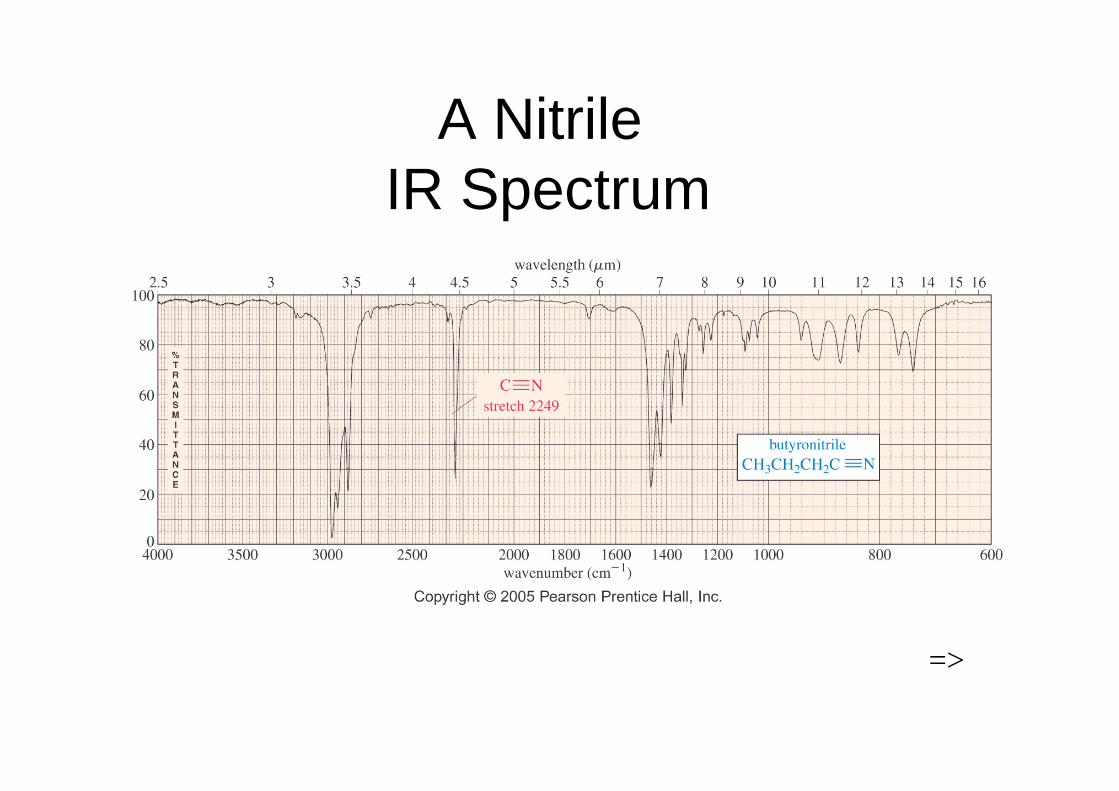
A NitrileIR Spectrum
=>
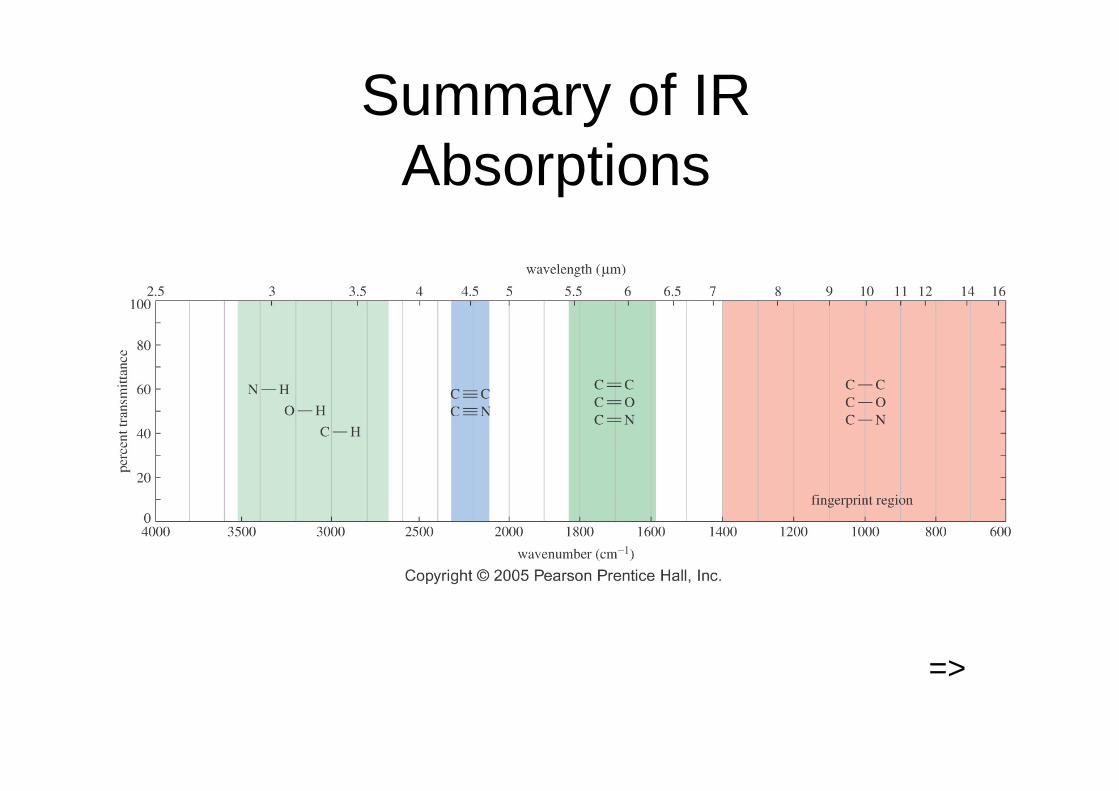
Summary of IR Absorptions
=>
Strengths and Limitations
•IR alone cannot determine a structure.•Some signals may be ambiguous.•The functional group is usually indicated.•The absence of a signal is definite proof
that the functional group is absent.•Correspondence with a known sample’s
IR spectrum confirms the identity of the compound. =>
Mass Spectrometry•Molecular weight can be obtained from a
very small sample.•It does not involve the absorption or
emission of light.•A beam of high-energy electrons breaks
the molecule apart.•The masses of the fragments and their
relative abundance reveal information about the structure of the molecule. =>
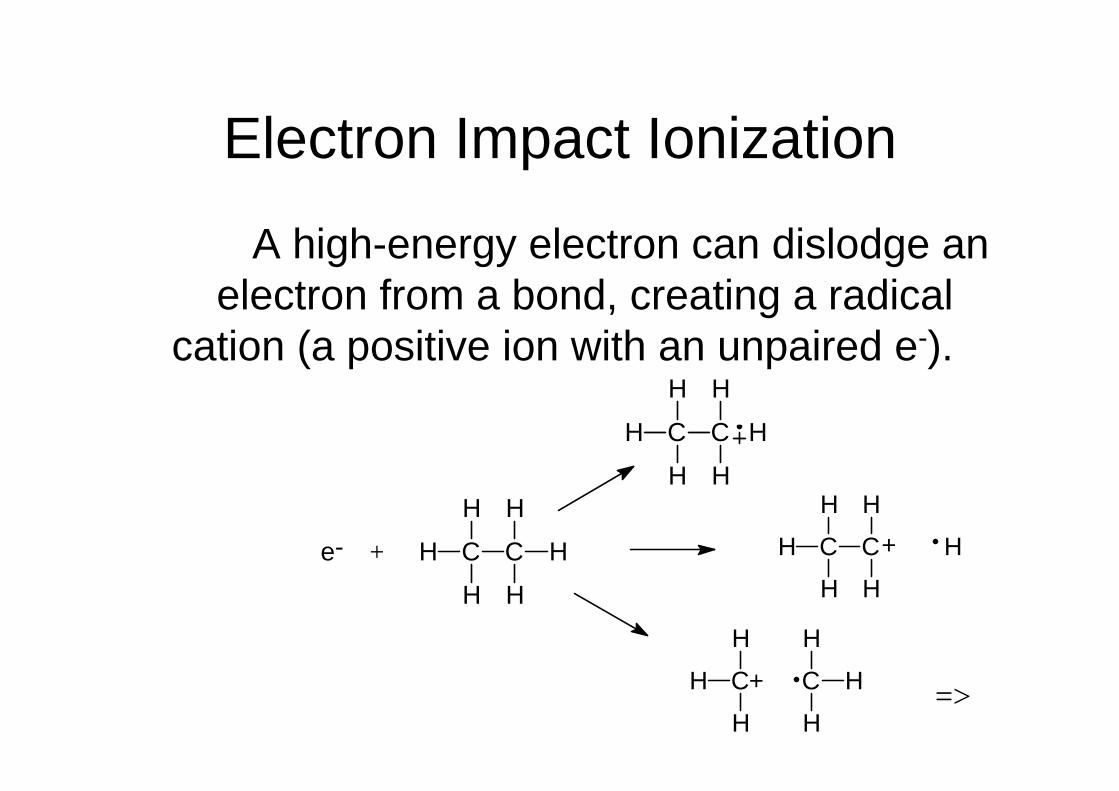
Electron Impact Ionization
A high-energy electron can dislodge an electron from a bond, creating a radical
cation (a positive ion with an unpaired e-).
e- + H C
H
H
C
H
H
H
H C
H
H
C
H
H
H
H C
H
H
C
H
H
+ H
H C
H
H
C
H
H
H
+ =>
Separation of Ions
•Only the cations are deflected by the magnetic field.
•Amount of deflection depends on m/z.•The detector signal is proportional to the
number of ions hitting it.•By varying the magnetic field, ions of all
masses are collected and counted. =>
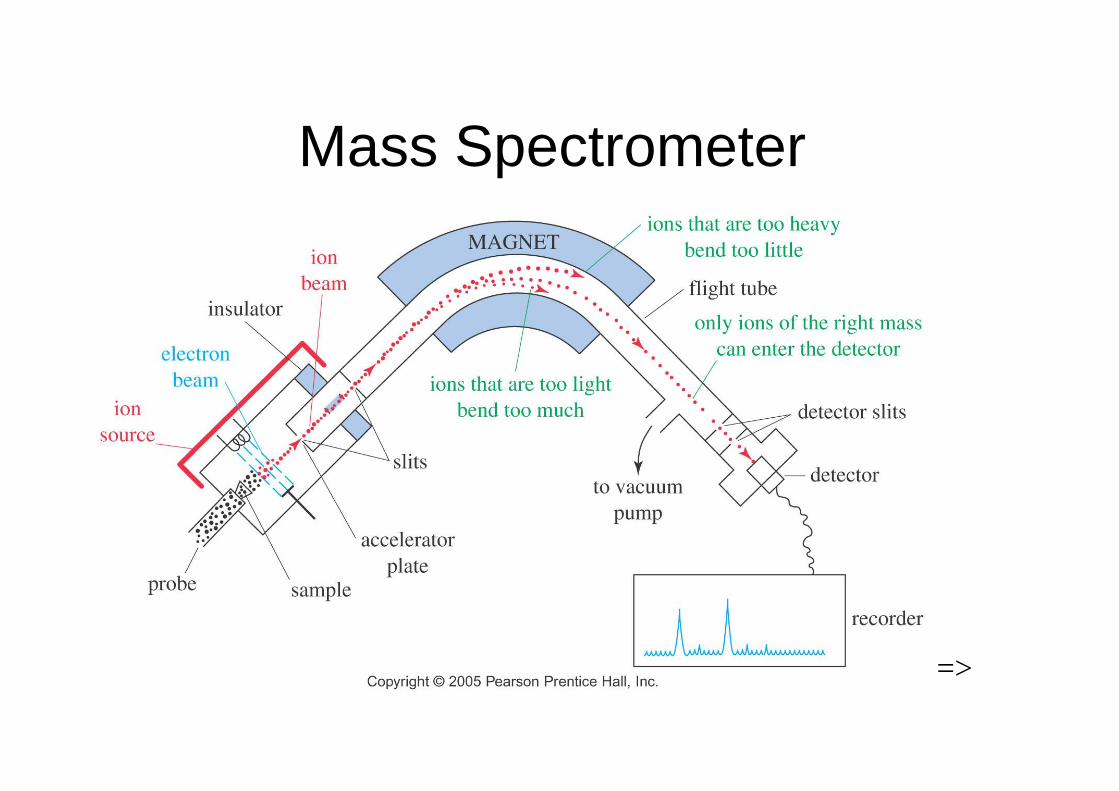
Mass Spectrometer
=>
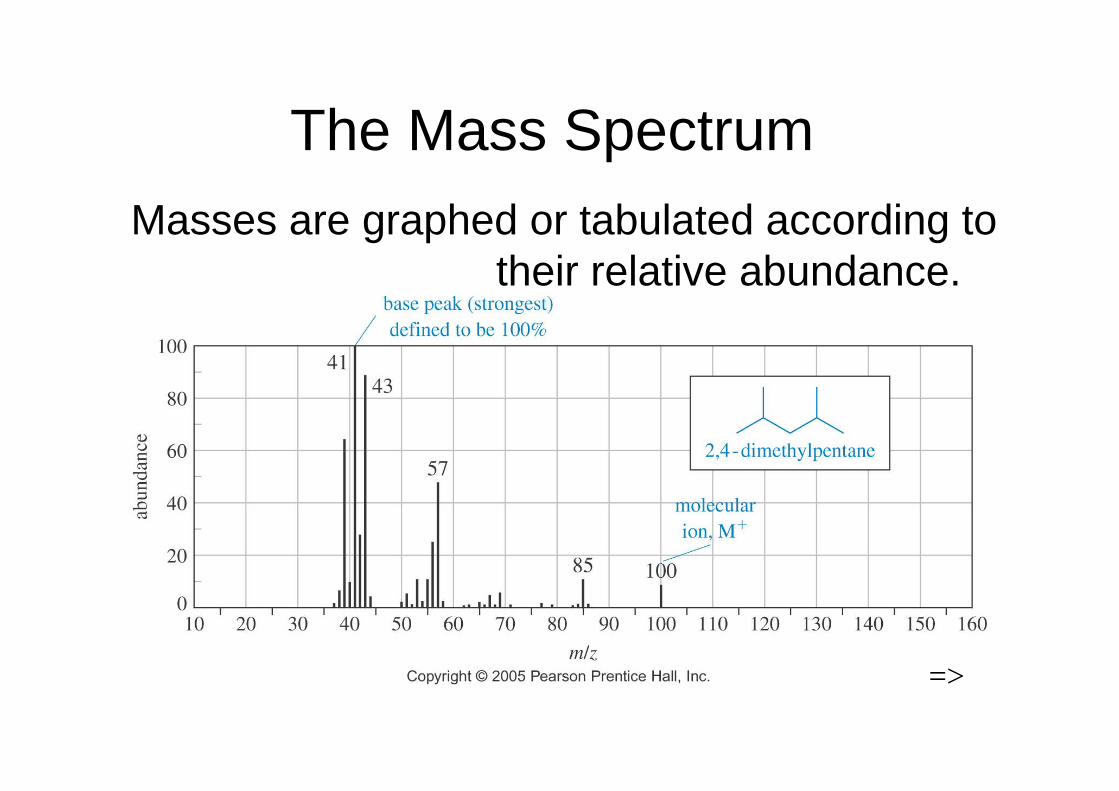
The Mass SpectrumMasses are graphed or tabulated according to
their relative abundance.
=>
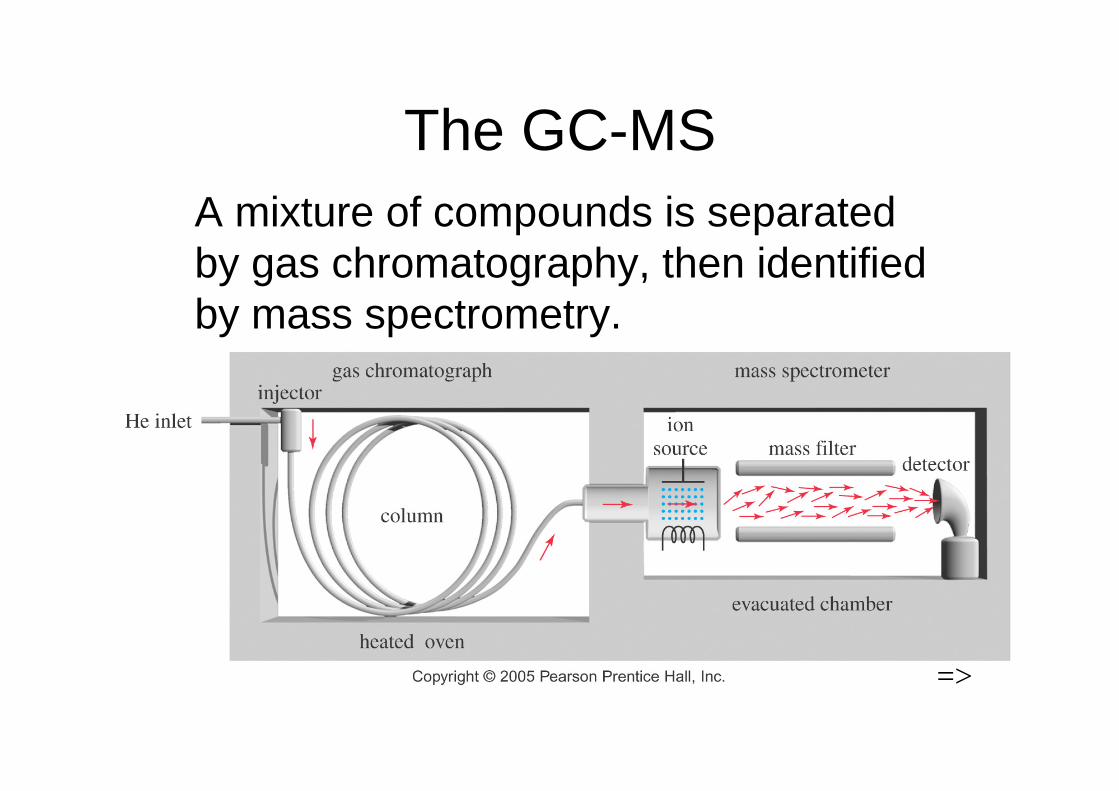
The GC-MS
=>
A mixture of compounds is separatedby gas chromatography, then identifiedby mass spectrometry.
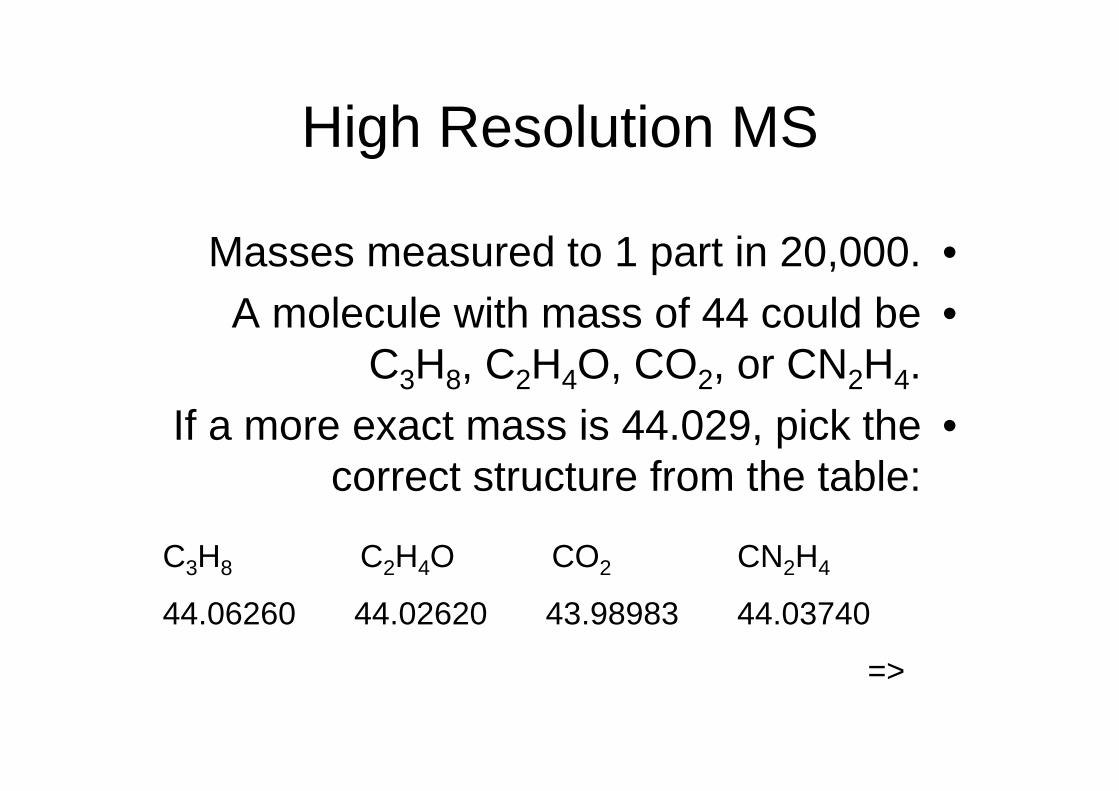
High Resolution MS
•Masses measured to 1 part in 20,000.•A molecule with mass of 44 could be
C3H8, C2H4O, CO2, or CN2H4.•If a more exact mass is 44.029, pick the
correct structure from the table:
C3H8 C2H4O CO2 CN2H4
44.06260 44.02620 43.98983 44.03740
=>
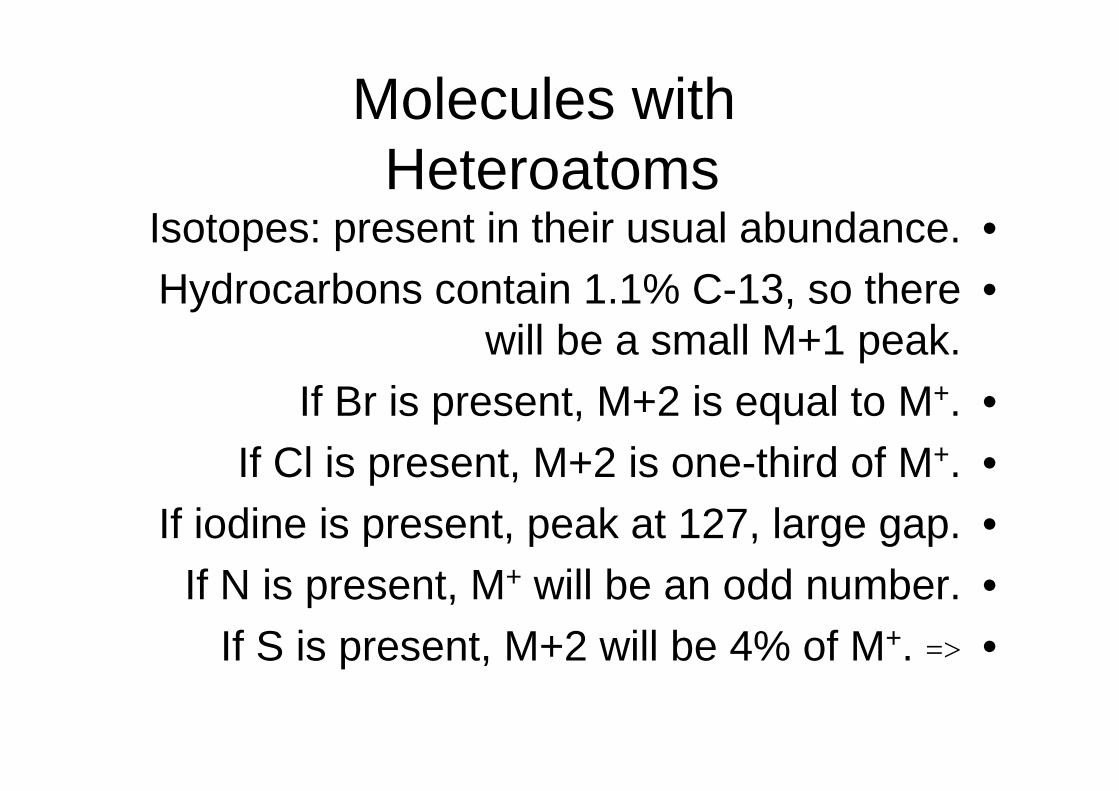
Molecules with Heteroatoms
•Isotopes: present in their usual abundance.•Hydrocarbons contain 1.1% C-13, so there
will be a small M+1 peak.•If Br is present, M+2 is equal to M+.•If Cl is present, M+2 is one-third of M+.•If iodine is present, peak at 127, large gap.•If N is present, M+ will be an odd number.•If S is present, M+2 will be 4% of M+. =>
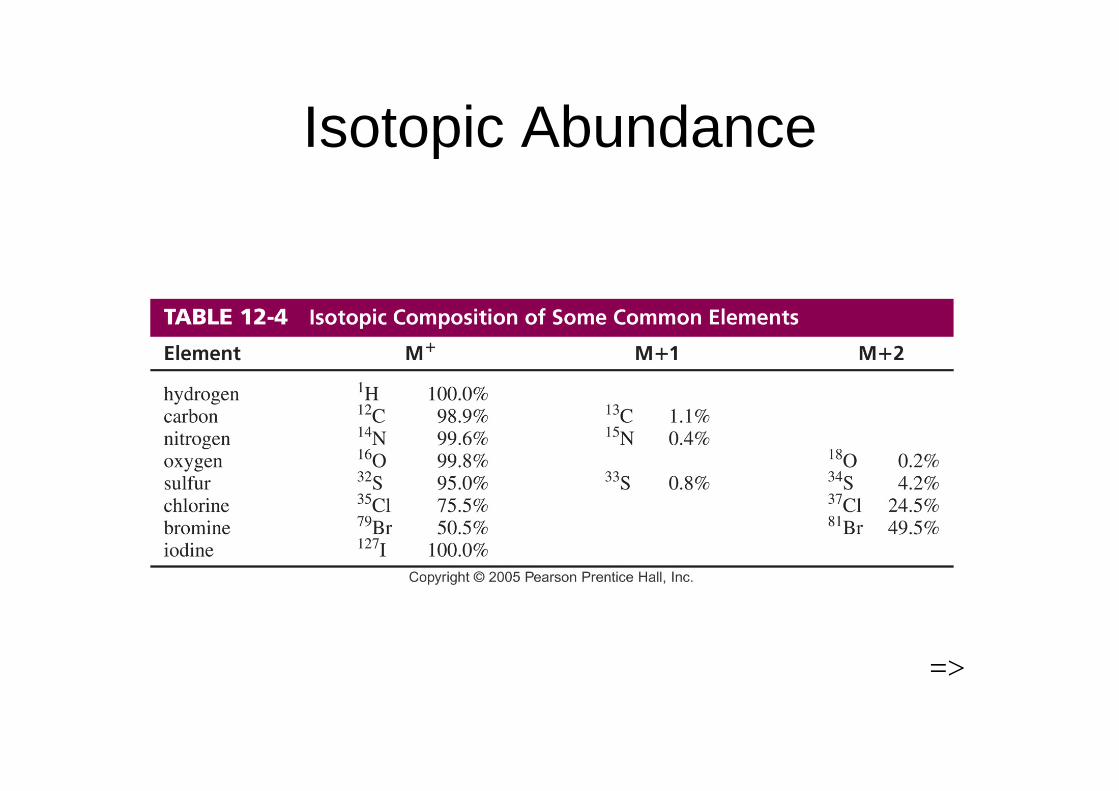
Isotopic Abundance
=>
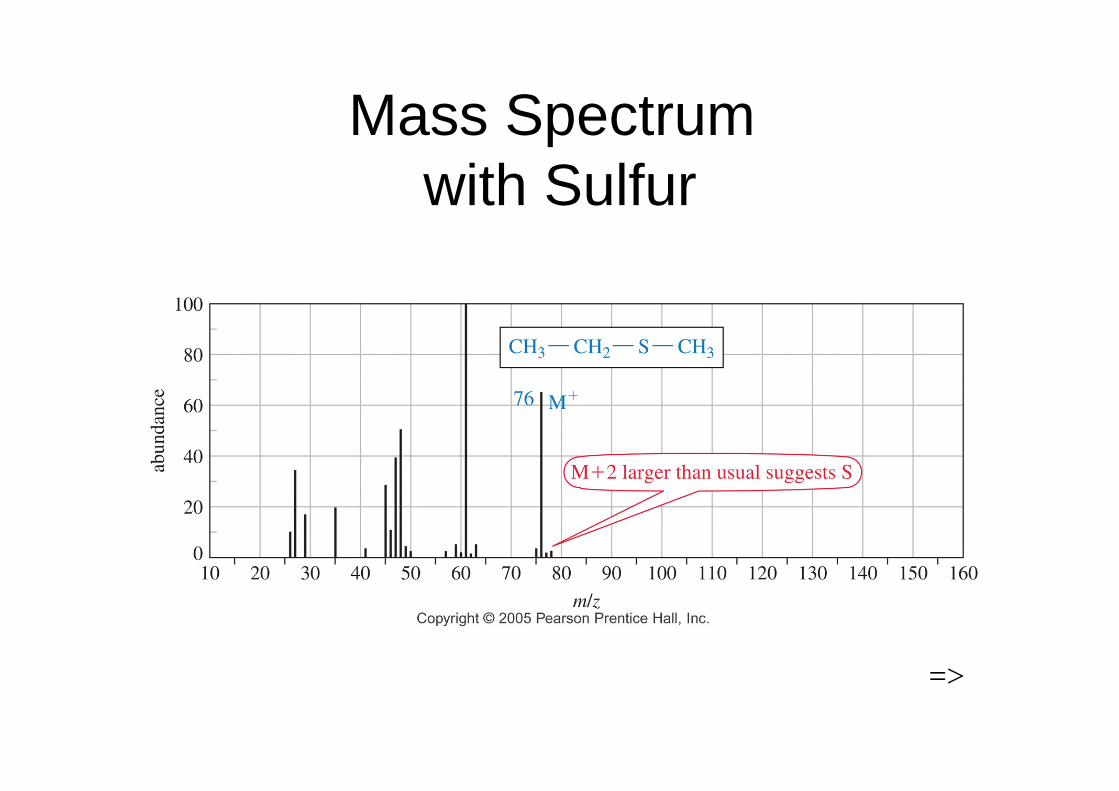
Mass Spectrum with Sulfur
=>
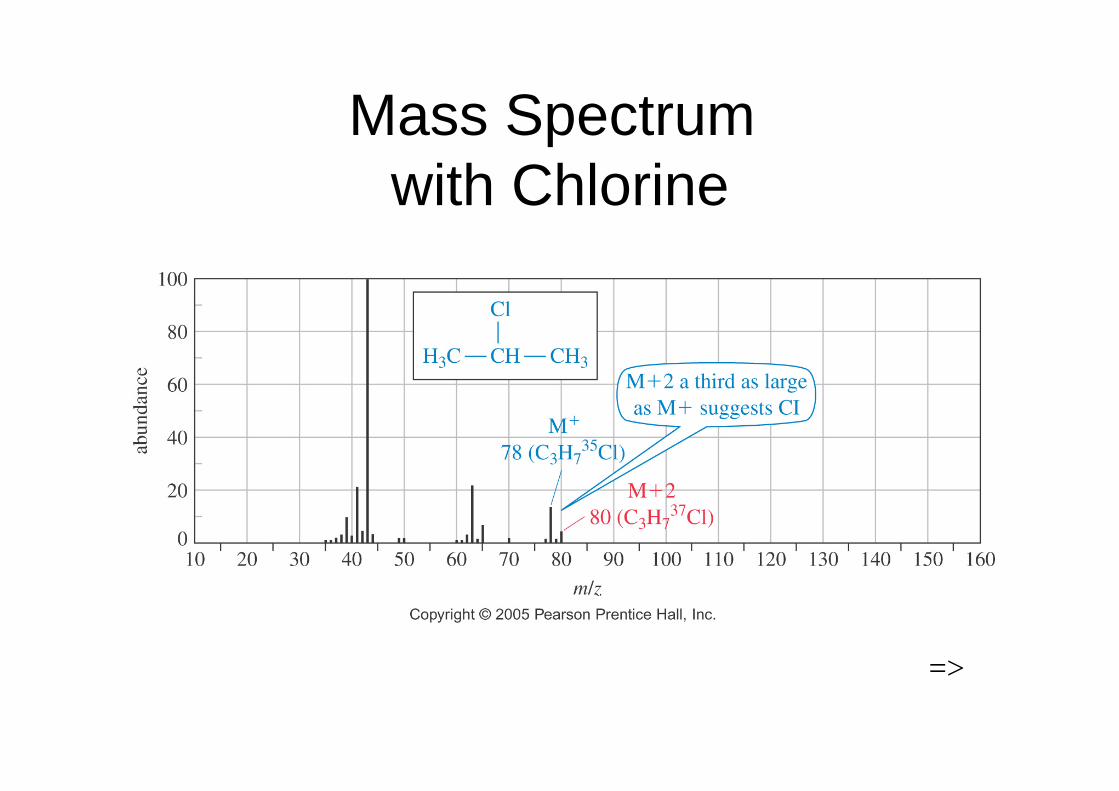
Mass Spectrum with Chlorine
=>
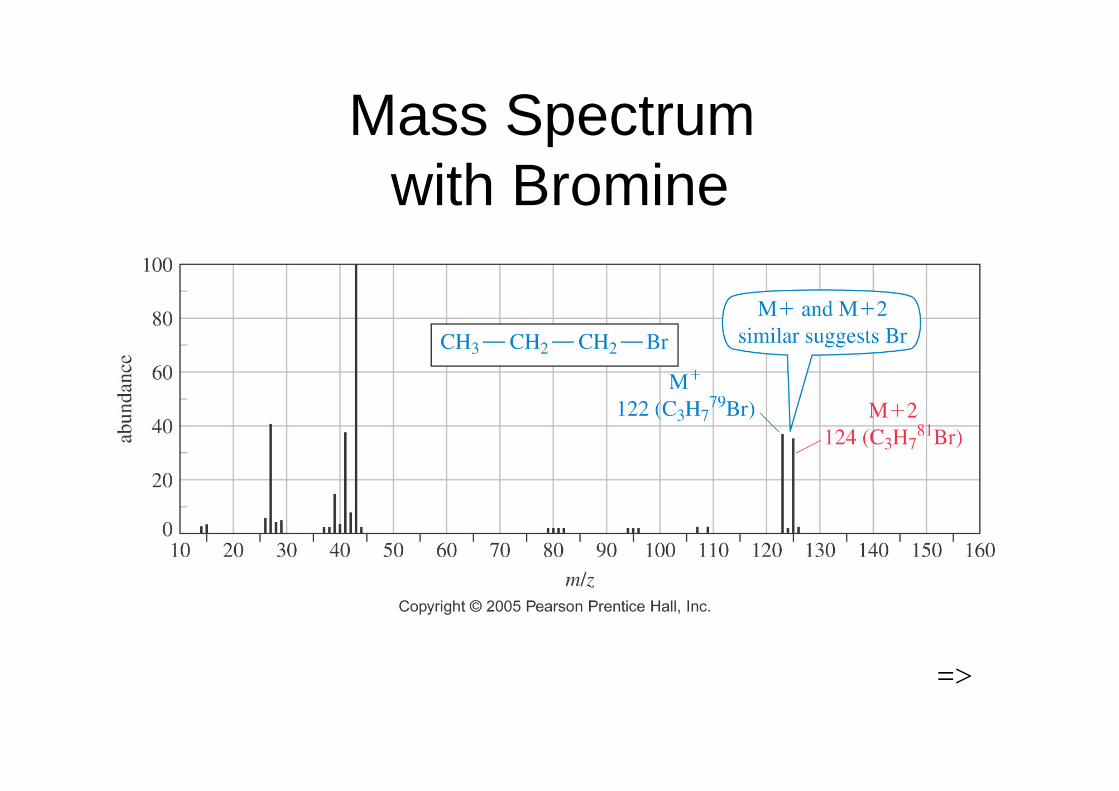
Mass Spectrum with Bromine
=>
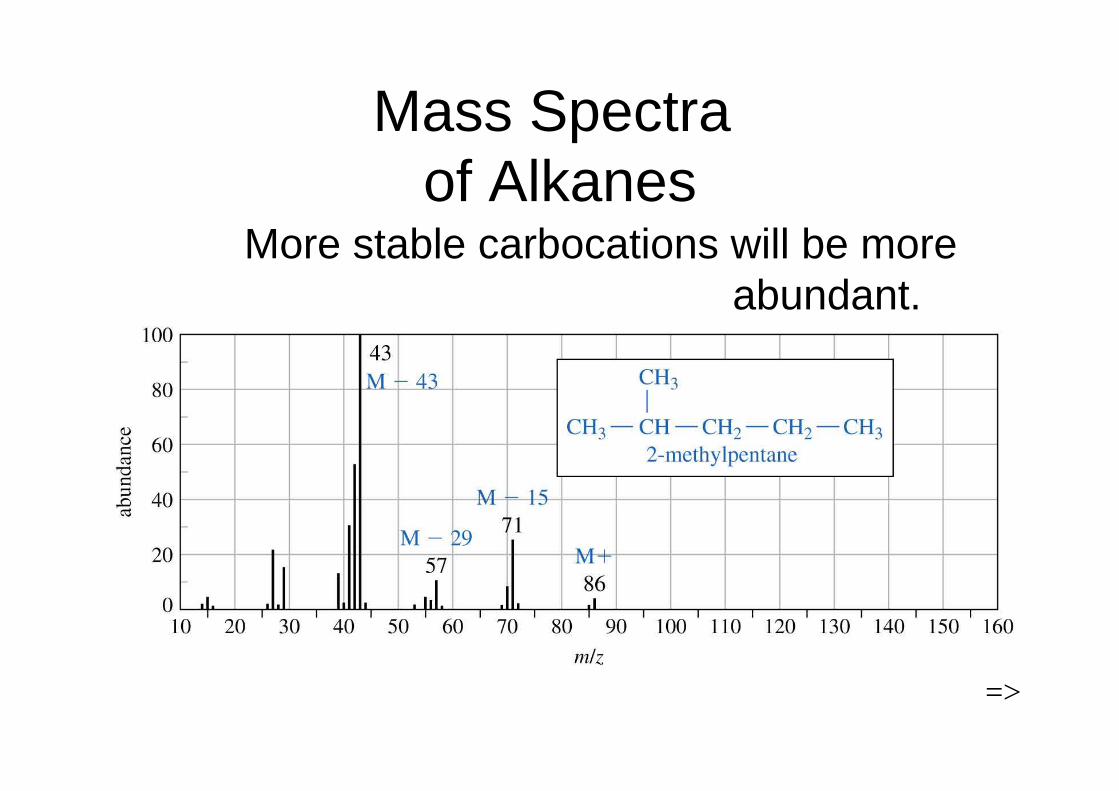
Mass Spectra of Alkanes
More stable carbocations will be more abundant.
=>
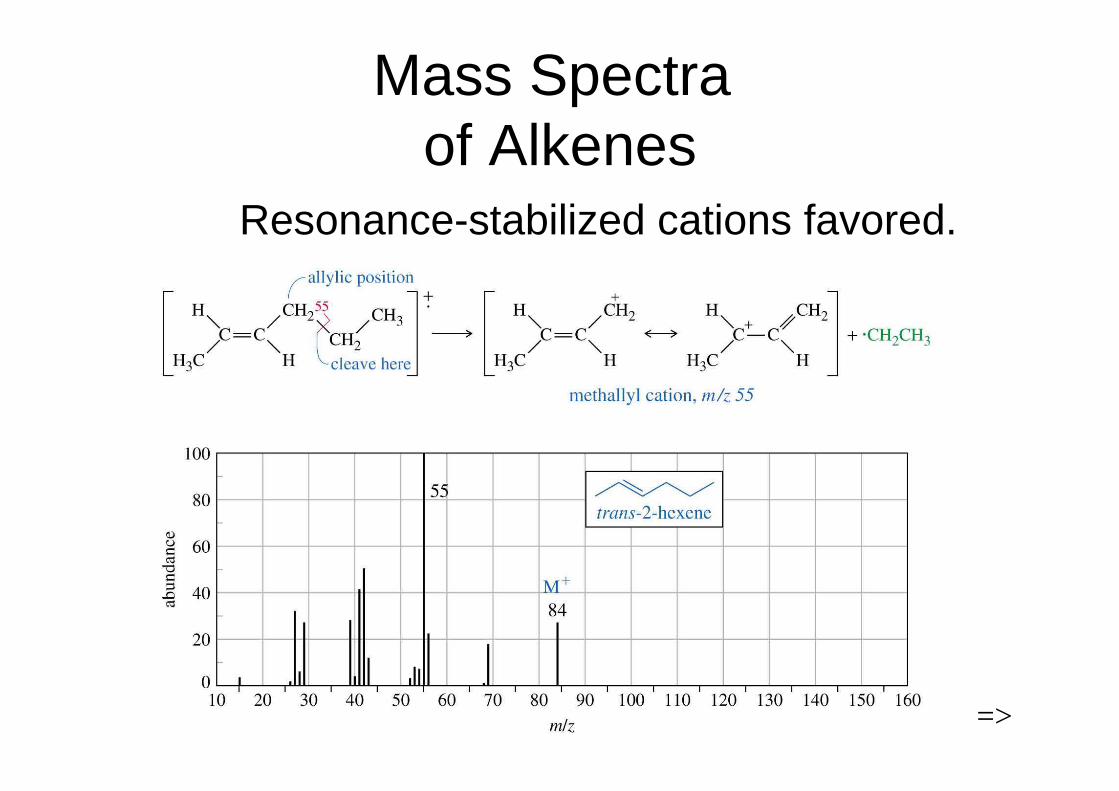
Mass Spectra of Alkenes
Resonance-stabilized cations favored.
=>
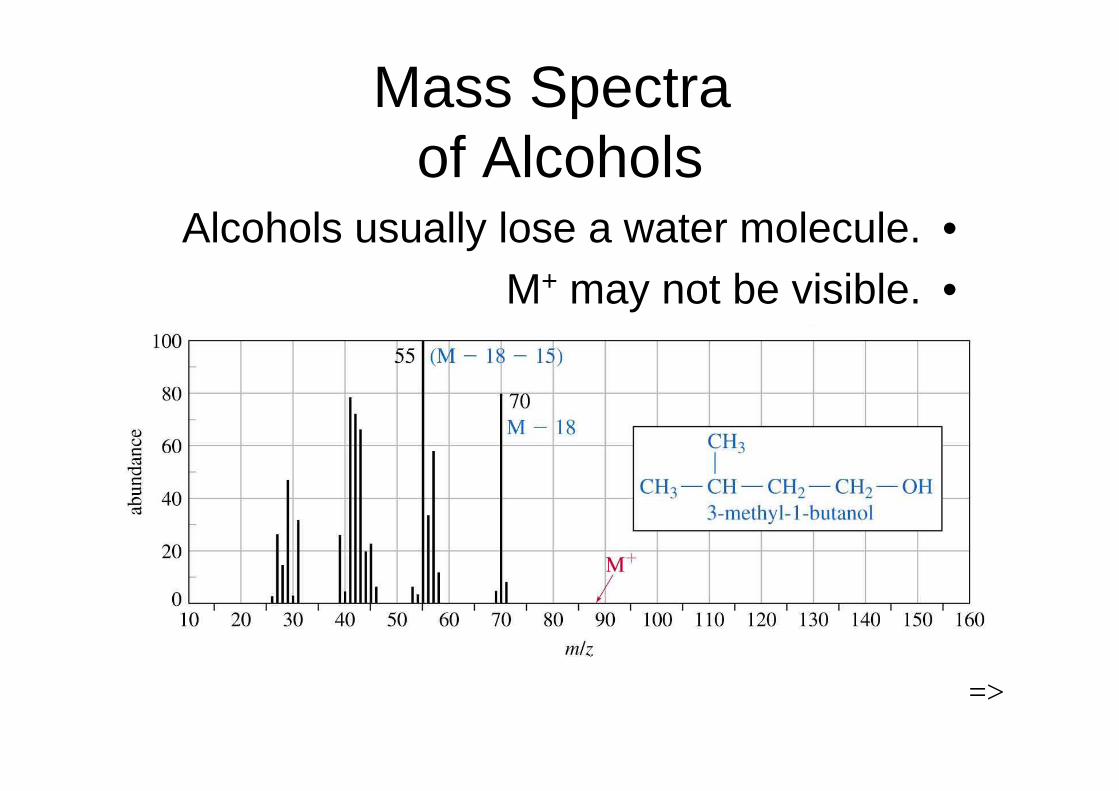
Mass Spectra of Alcohols
•Alcohols usually lose a water molecule.•M+ may not be visible.
=>
End of Chapter 12