Embed Size (px)
Citation preview

Chapter 12
Physical Environments and Their Relationship to Quality of Life
The second major component of the Task Order examined physical environments as they
relate to Quality of Life (QOL). The bulk of the environmental work was based on data
collection in the 40 facilities for Wave 1. This chapter reports on how each of the 1988
resident’s physical environments were assessed at the room, nursing unit, and facility level,
describes the nature of these physical environments, and provides some data on the relationship
between QOL and environment and on how being in a private room affected QOL. The
environment work included detailed case studies of exemplary environments, which have been
sent separately to CMS.
Background
Environmental conditions have long been known to affect human growth and development
and, ultimately, functioning and QOL (Lawton, 1983; Lawton, Brody, & Turner-Massey, 1978).
Many physically or cognitively impaired people have limited ability to manipulate or escape
their immediate physical surroundings, and, therefore, the environment of the nursing home, or
perhaps the even smaller environment of the nursing unit or their own rooms, becomes their
world (Rowles, 1978).
Although criticism of nursing homes as places to live is ubiquitous, little detailed
information is available to describe the physical environments in nursing homes today. Even
scarcer are data describing the way the environment affects outcomes of interest, including
functional status and QOL for residents with various characteristics. Indeed, without the tools to
measure physical environments systematically, such outcome data cannot be generated.
Page 12.1

The first section of this chapter describes how physical environments were conceptualized
for this study, how they were assessed at three levels (facility, nursing unit, and resident’s room
and bathroom), the development of composite measures derived from the assessment instruments
to measure various attributes of the physical environment, and early descriptive results on
variation within and across facilities. Physical environments were to be the independent variable
and QOL the dependent variable for the resulting analyses. Quantitative and qualitative data
include assessments of 1988 room and bath environments, located on 131 nursing units in 40
nursing homes.
The second section provides a brief overview of the ongoing work of developing a typology
of nursing home environments using hierarchical cluster analysis, and will provide preliminary
data on the relationship between private rooms and QOL.
Theoretical Framework
Nursing homes are, most obviously, places where people live. They are also places
where people work and visit. Each user has different priorities for the physical environment.
Although residents are the full time users, traditionally nursing homes have been designed in
typical hospital layouts of multiple-bed rooms located on long double loaded corridors where
the priority is more on supporting the efficiency of nursing services than creating a home
for the residents.
The physical environment has the potential to contribute to the QOL of residents by
capitalizing on resident strengths while reducing demands, or conversely, environments could
create obstacles to residents achieving a higher QOL. As the aging process continues, the gap
between the demands of the environment and the older person’s competence widens to the point
where an environment that once was supportive of limitations is no longer supportive. The
Page 12.2

ecological model developed by Lawton and Nahemow (Lawton & Nahemow, 1973) suggests
behaviors are a function of the interaction of personal factors with the physical environment.
In the spirit of this model, Becker and Steele state that the size, shape, layout, quality,
furnishings and equipment in the physical environment “shape our lives, at the same time as
our behaviors and values shape the nature of that designed environment, how it is used, and
the meaning we attach to it (Becker & Steele, 1995).” Highly competent people can function in
environments that are less supportive of their human limitations, whereas less competent people
will have more difficulty overcoming environmental challenges.
Conversely, environments can place too little demand on residents, as in some nursing
homes where sensory deprivation and lack of control results in boredom, anxiety, and
depression. This is compatible with the observation that learned helplessness results from no
longer perceiving one is able to make decisions or exercise discretionary behavior affecting
one’s life (Langer & Rodin, 1976; Seligman, 1976). The environmental docility hypothesis, an
outcome of the ecological theory, suggests that the lower the level of competence, the greater the
influence of the environment on behavior, although at some point of illness and disability (for
example, a vegetative state), the physical environment is unlikely to influence behavior. While
studying a dementia special care unit, researchers found that residents with higher cognitive
functioning benefited more from an enhanced physical environment than residents in the later
stages of dementia (Cohen-Mansfield & Werner, 1998). On the other hand, the environmental
docility hypothesis would suggest that people challenged by dementia as well as those
challenged by physical conditions such as shortness of breath or extreme mobility difficulties
would particularly benefit by a well-designed physical environment. After a review
of seventy-one studies on therapeutic design of environments for people with
Page 12.3

dementia(Day, Carreon, & Stump, 2000), the authors suggest that the study of environments in
long-term care has been too focused on the goal of identifying the relationship between the
physical environment and troublesome behavior rather than studying the potential of
environmental design to improve general QOL.
Over a lifetime, individuals develop habits or routines in their use of space that provide
a sense of “being in place”(Rowles, 1998). As people age, their reduced physical functioning
requires changes and often downsizing of the environment to allow continued functioning in
a routine or habitual way and continued control over “place,” albeit on a smaller scale
(Rowles, 1983). Community-dwelling elders make such transitions when they limit the space
that they use in their homes, or when they relocate from large homes to small apartments. In the
context of the nursing home, the goal still remains for the nursing home resident to achieve a
sense of his or her own place in that facility through establishing an environment adapted for his
or her routines; it is obviously more challenging to manage one’s new space in a way that affords
continuity when the space is located in a nursing home rather than a private home.
Attention to the physical environments of nursing homes has largely been expressed by
concerns about safety, resulting in regulations mandating minimal expected environmental
features on matters such as railings, corridor width, fire retardant materials, and the like. Here
too there has been discordance between such environmental requirements and the needs of the
users. The weakness of many codes and standards, even as guarantors of safety, is that they are
seldom research based, nor do they consider multiple goals. They tend to take into account
specific disabilities like cognitive impairment, vision problems and mobility problems without
considering the interaction effect of a multitude of frailties common to the elderly person. For
example, a code can pursue a single goal such as safety in the rare event of fire by requiring
Page 12.4

heavy fire doors that are difficult at best for an elderly resident to maneuver, but the code does
not require an automatic door opener, which would enhance functioning all the time.
Thus, we undertook this study with the assumptions that physical environments are critical
in enhancing or impeding well-being, and that these physical environments must both nurture the
individual’s capacity for independence, autonomy, and physical functioning, and also, given that
these environments aspire to be the homes of those who dwell there, afford a sense of security,
enjoyment, interest, and fulfillment. We recognized the diversity of nursing-home residents and
the differing requirements residents might have for their environments. Also given that some
residents are extremely limited to their near environments, we required a tool to look at the most
immediate physical environment as well as the larger physical environment in which it is nested.
Environmental Measurement in Nursing Homes
Systematic, objective, and reliable ways to characterize physical environments are needed so
that they can be studied in relationship to resident outcomes. Instruments available to date have
often depended on subjective, global judgments rather than data that are objective, evaluative,
and discrete (Cutler, 2000). They tend, for example, to record ratings at the unit level (e.g., items
such as “some rooms on the unit are personalized”), which, in turn, makes it impossible to link
that observation to any given individual on the unit (who may or may not have a personalized
room). Also the measures tend to depend on judgments, rendering them inherently prone to poor
reliability, especially when used by persons without specific professional background in design
or extensive training on the use of the particular tool.
The most comprehensive environmental evaluation instrument for use in nursing homes is
really a battery of instruments; the Multiphasic Environmental Assessment Procedure (MEAP
(Moos & Lemke, 1996). This 5-part protocol is designed to evaluate the physical and social
Page 12.5

environments in residential settings; though not originally designed to be used with frail older
people, it is salient for them. Most other environmental rating tools available to assess nursing
homes were designed specifically to study dementia special care units (SCUs). Generally, they
attempt to document presence or absence in the environment of characteristics that have been
conceptually linked to a good QOL for people with dementia. As defined by Calkins & Chafetz,
the major principles for crafting environments on dementia special care units are: regulated
stimulation; maximizing awareness and orientation; supporting personal continuity with past;
providing secure freedom, and enhancing positive social interaction (Calkins & Chafetz, 1996).
Several scales have been developed to examine the extent to which SCU environments
incorporate features thought to be desirable. The Therapeutic Environment Screening Scale
(TESS) (Sloane & Mathew, 1990), in its revised TESS+ form (Sloan, Mitchell, Long, & Lynn,
1995) was used in the cooperative evaluation of dementia SCUs sponsored by the National
Institute on Aging in the 1990s. This observation scale assesses 8 environmental domains:
general design features; maintenance; inventory of spatial amenities and seating capacity;
lighting; noise; amenities; programming; and global environment. Similarly, the Professional
Environmental Assessment Protocol (PEAP) is an 8-dimension instrument specific to dementia
SCUs; it differentiates three levels of the physical setting (fixed or structural features, semi-fixed
features and non-fixed features) as they related to the social, organizational, and policy
environment. Recent work in 43 SCUs shows that the PEAP actually seems to be a single-
dimension scale, which correlates highly with the TESS (Lawton et al., 2000). Although they do
not assess the physical environment precisely, both these observational tools go well beyond
physical environments to assess the programs and practices that are observed within the
environments, and they both require some additional knowledge of policies beyond what is
Page 12.6

acquired from the tool.
Also, the Environment Behavior Model for SCU’s (E-B Model) assesses 8 environment-
behavior concepts (exit control, wandering paths, individual away places, common space,
outdoor freedom, residential scale, autonomy support, and sensory comprehendability
(Zeisel, Hyde, & Levkoff, 1994). The tool has the advantage of being conceptually grounded,
but its use requires extensive training and ultimately rater judgments. For example, exit controls
are rated for their immediacy and their unobtrusiveness, common space for quantity and
variability, and wandering paths for their continuousness and their way-finding properties.
Finally, the Nursing Unit Rating Scale (NURS) is a step further away from direct observation,
since it gathers information about how the environment is used to create a milieu for persons
with dementia through interviewing nursing staff. The NURS results in measures for 6 domains:
separation, stimulation, stability, complexity, control/tolerance, and continuity (Grant, 1996). In
sum, the tools in the literature for assessing nursing homes tend to focus on the nursing unit,
emphasize dementia SCUs (though most nursing home residents who have dementia live outside
dementia SCUs), depend heavily on ratings, and mix assessment of the environment itself and
assessment of behavior observed in that environment.
Measures are needed that allow examination of the environment that any resident
experiences with or without dementia on any unit in the facility. We set out to develop tools that
would allow us to assess the environment of any resident, beginning with his or her own
dedicated space (a bedroom or portion of one and perhaps a portion of a bathroom), the space he
or she shares with others on the nursing unit, and the space he or she shares with all residents in
the facility. In this study, the term environment was defined as referring to the fixed, semi-fixed,
and unfixed components of the physical structure, and the furnishings, fixtures, decor, and
Page 12.7
equipment in the building. Although we appreciate that the staff and other residents also
constitute part of the overall environment that influences any particular resident, we strove to
separate out the physical environment to make it possible to study how different physical
environments affect programming, policy, and staff behavior, on the one hand, and resident
outcomes, on the other.
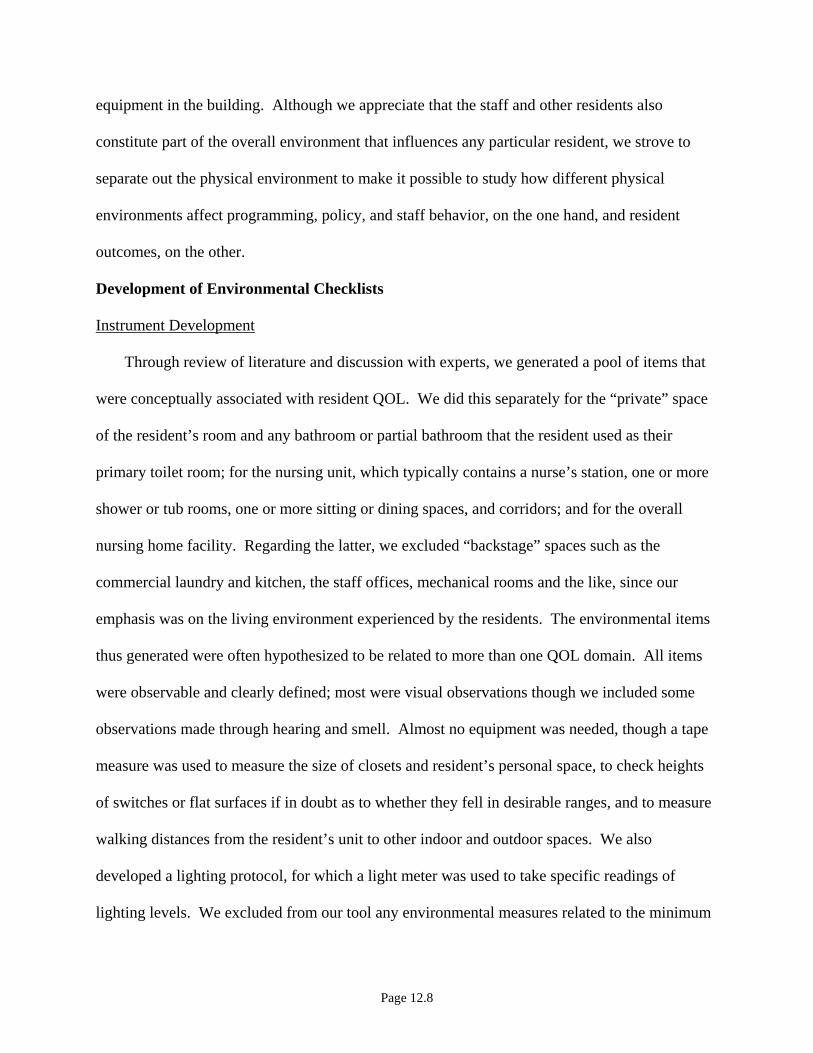
Development of Environmental Checklists
Instrument Development
Through review of literature and discussion with experts, we generated a pool of items that
were conceptually associated with resident QOL. We did this separately for the “private” space
of the resident’s room and any bathroom or partial bathroom that the resident used as their
primary toilet room; for the nursing unit, which typically contains a nurse’s station, one or more
shower or tub rooms, one or more sitting or dining spaces, and corridors; and for the overall
nursing home facility. Regarding the latter, we excluded “backstage” spaces such as the
commercial laundry and kitchen, the staff offices, mechanical rooms and the like, since our
emphasis was on the living environment experienced by the residents. The environmental items
thus generated were often hypothesized to be related to more than one QOL domain. All items
were observable and clearly defined; most were visual observations though we included some
observations made through hearing and smell. Almost no equipment was needed, though a tape
measure was used to measure the size of closets and resident’s personal space, to check heights
of switches or flat surfaces if in doubt as to whether they fell in desirable ranges, and to measure
walking distances from the resident’s unit to other indoor and outdoor spaces. We also
developed a lighting protocol, for which a light meter was used to take specific readings of
lighting levels. We excluded from our tool any environmental measures related to the minimum
Page 12.8

regulatory requirements for nursing homes.
The room and bathroom tool developed through this procedure consists of 114 items,
all of which were assessed for each of the 1988 residents in our sample. (For Room and Bath
Environmental Checklist, see Volume 2, Appendix G). For example, the results for items such
as having a window view, having a bedside chair, the length of the walk to the bathroom or
closet, or whether the resident crossed someone else’s space to get to the bathroom could differ
for residents occupying the same room. Almost all the items required a yes or no answer; some
required choosing from a simple multiple-choice option, providing a measurement, or a count
(e.g. number of other residents using the toilet room). We used the “fist test” to assess light
switches and drawer pulls; that is, if the assessor could operate those controls with a closed fist,
they passed the fist test and were more likely to be able to be controlled by a resident.
The nursing unit tool, which included 229 items, tapped the environments shared by all
residents on the unit. (For Unit Environmental Checklist, see Volume 2, Appendix H.) The tool
took into account the nursing station, corridors, common tub/shower room, lounge and dining
spaces, access to outdoors spaces, noise on the unit, and distances from the unit to the facility
entrance, to the main dining room, to lounges and to the shower/tub room. Again the items are
largely dichotomous–e.g., a feature or characteristic was present or absent, though a few of the
items required a tape measure, or a count (e.g. number of lounges, number of shower/tub rooms).
The protocol for assessing any sitting or dining areas on the unit were repeated for all such areas.
Thus, we had available a simple measure of whether there were dedicated spaces for dining or
recreation or a combination of both on the unit, as well as detailed information about the
features of decoration and furnishings in each space.
The 243-item facility-level measure included all other indoor and outdoor spaces
Page 12.9

potentially used by residents, family members, volunteers and visitors. (For Facility
Environmental Checklist, see Volume 2, Appendix I.) This included detail about the grounds,
the neighborhood, and the parking. Again, if more than one lounge or dining room was
available, each was assessed separately. Special note was made of innovative or exemplary
spaces, for example restaurants or “main streets” that served as community wide gathering
places, contemplation rooms, and nursing units organized and designed as small households.
A separate lighting protocol was done at the same time as the unit and facility assessments
to measure the amount of light in foot candles. This entailed light meter readings in a sample
resident room and bathroom on each of the 131 units as well as 4 readings at each of the
following unit locations; nurse’s station, shower/tub room, main activity space, dining area and
corridors. In addition, facility level measurements were completed in corridors,
reception/entrance area, activity lounge and dining areas where present. Detailed instructions
were used for the protocol to control the circumstances of each measure. The protocols included
features that were commonly expected to be present in nursing homes, less common features
(fireplaces, thermostats to regulate temperature in resident rooms), and features we thought
would be uncommon (e.g. bathrooms in public spaces that were accessible for residents, toilet
rooms that lock from the inside, double beds, or computers in residents’ rooms).
Data Collection
The three environmental checklists were completed for the room and bath, the unit, and the
facility, respectively. The room and bath data were collected by the 40 research interviewers
who also interviewed residents and staff members, and performed a variety of observational
protocols during their approximately 3 weeks in each facility. Typically, the room and bath
protocol was done immediately after the resident interview was completed. The research
Page 12.10

interviewers for each state were trained to almost perfect inter-rater reliability before they went
into the field. This was accomplished in phases, including: classroom training with extensive use
of slides, photographs, and room diagrams that identified items in the assessment tool, and
practical experience in nursing homes. In the final phase of training, the interviewers did a room
and bath observation with the trainer present and independently completing the form. A
condition of training was to achieve a .9 reliability with the trainer as the gold standard before
going into the field. Once the interviewers were in the field, they were able to telephone the lead
environmental investigator to resolve any difficulties that might arise in atypical rooms. As
rulings were made in specific cases, these rules were communicated to the other interviewers.
A formal inter-observer reliability test was conducted for the assessments in 60 rooms in 30
different nursing homes (not shown). This was performed by having a second observer visit the
room and bath at the same time as the assigned observer or on the same day to complete a second
protocol. Kappa statistics were used to measure agreement between measurements obtained by
different observers for most items (excluding dimensions). The kappas were calculated
separately for single and shared rooms, since the assessments are somewhat more challenging in
the latter. Of the 101 single room items tested by 24 pairs of raters, 97 items (96%) yielded
significant kappas. Of the significant kappas, only 1 item was in the poor range (<0.4); 10 items
(10%) were in the range of 0.4-0.6, 29 items (30%) were in the range of 0.6-0.8, 57 items (58%)
were above .8, and for 41 items (42% of the total) we achieved 100% agreement for all pairs of
raters. Test results for shared rooms were slightly lower than for single rooms. Of the 110
shared room items tested with 36 pairs of raters 96 items (87%) yielded significant kappas. Of
the significant kappas, 4 items (4%) fell below .4, 19 items (20%) were in the range of 0.4-0.6,
27 items (28%) were in the range of 0.6-0.8, 47 (48%) were above 0.8, and of these we achieved
Page 12.11

100% agreement among all raters on 31 items (32% of the total) items. The few items with
insignificant kappas or kappas in the poor range were flagged for deletion or revision and
clarification.
The lead environmental investigator (Lois Cutler) visited all 40 facilities and completed the
unit and facility level observational checklists. During that visit, she also conducted a more
qualitative appraisal to identify any innovative designs that might be worthy of a more detailed
evaluation study. After each visit, detailed field notes about each facility were completed to
serve as a basis for identifying exemplary features.
Analysis
To reduce the data for analytic purposes, the environmental team grouped items to develop
composite measures of relevant environmental constructs using the data in the 3 assessment
tools. Prior to the development of these composites, an environmental team (Cutler, Lawton,
Kane, and Grant) developed a rational scheme for coding individual environment features as they
relate to QOL domains. Each rater assigned each item from the assessment tools to a primary
QOL domain and secondary ones, when applicable. Initial concurrence was high, and
discrepancies were resolved in team discussion. After this initial step, the team combined items
to develop composite measures of relevant environmental constructs. For example, items that
were judged to be related to functional competence were incorporated into the composite
measures of function-enhancing features at each of the 3 levels, and clutter items were
incorporated into a measure of clutter at the unit level. Items related to autonomy were
incorporated into the composite measure of features potentially controlled by residents, and
items that we thought were related to meaningful activity, enjoyment, comfort, and relationships
were incorporated into measures of “life-enriching features” at all three levels. Of the QOL
Page 12.12

domains we studied, privacy has the clearest environmental analogue. We employed some
simple measures of privacy (e.g. having a single room, number of people sharing a room,
number of people sharing a bath) but also developed composite measures, including a measure of
visual separation in the resident’s room. In some instances, we could not relate the scales so
readily to a single domain. Similarly, the distance measures and the lighting measures might
impact functional competence and security most directly, but could also affect meaningful
activity, enjoyment, and relationships.
The resultant scales are typically additive, created by assigning a point to each positive
manifestation present without any attempt at present to weight the items according to their
relative importance. Because they were designed to conceptually reflect the items that belong to
a construct (e.g. clutter, function-enhancing features, life enriching features, personalization),
their validity did not rest on Chronbach alpha correlation, which show how the items cluster
together in a facility. We determined alpha reliability of the measures, however, because only
scales with acceptable alpha reliability are likely to show relationships to QOL outcomes. For
some later analytic purposes, therefore, we will need to drop items from the scales. For this
presentation, items are retained to clarify which features were rare in our nursing home sample.
Using single items and scales, we then examined the extent of environmental variation
within and across facilities. We also examined the narrative case study reports to characterize
exemplary features and differing forms of privacy.
Descriptive Findings
The 40 facilities housed from 49 to 274 residents, and the 131 nursing units in the study
housed from 10 to 70 residents; 21 of these nursing units were classified by the facility as a
dementia special care unit. Eighteen facilities were 1 story; 7 facilities had 2 stories, 7 had 3
Page 12.13

storeys, another 7 had 4 stories, and 1 was 6 stories high. The number of residents in these
facilities ranged from 49 to 274 with a mean of 125 residents. Total units in facilities ranged
from 1 to 5 units. Consistent with our over-sample for private rooms, 580 (29%) of the residents
lived in a private room: 1155 (58%) residents shared a 2-bed room, 177 (9%) a 3- bed room and
76 (4%) residents a 4-bed room. The prevalence of residents in rooms with 3 or more beds
varied widely by state. In California, 35% of the sample lived in rooms with 3 or more beds,
compared to 10% for Florida, 8% for New Jersey, 7% for New York and 5% for Minnesota. The
square footage of space per resident in resident rooms ranged from 411 square feet per person to
75 square feet per person.
Privacy and ease of access to bathrooms is a prime consideration for residents and for staff
in their care-giving duties. The number of residents with whom a resident shared a toilet room
ranged from a high of 20 residents to a low of 0 for the 501 residents who had a private
bathroom. All told 26% had a private bathroom (fewer than the 29% with private bedrooms),
42% shared a bathroom with 1 other person, 5% shared with 3 residents, 18% shared 4 other
residents, and 11% shared with 5 to 20 other residents. The distance that residents needed to
travel to use their primary toilet room ranged from 2 to 82 feet. Access to a bathroom for 250
residents required that they travel outside their immediate room to a shared bathroom down the
corridor. A tub or shower was located in 498 of the resident’s toilet rooms, including in those of
235 who shared toilet rooms. We have no data on whether these showers or tubs were in good
working order or whether they were utilized. Many were located in bathrooms too small to
accommodate both a wheelchair and an aide, and many shower stalls had a high shower lip.
Several facilities were initially built as housing for a younger population and then renovated into
nursing homes. These facilities did not have the level of function enhancing features commonly
Page 12.14

found in buildings that were designed as nursing homes.
Lounge space on units varied from 20 units that lacked even a single lounge located directly
on the unit to 7 units that had 4 separate lounges on the unit. One facility with 3 units and all
private rooms also had 4 lounges per unit. This lounge space was infrequently used by residents
as they tended to stay in their own private rooms. At the other extreme, a 152 bed facility with
the majority of 3 plus person rooms (including 6 person rooms) and no private rooms also had
limited shared space.
The residents on 33 units must travel to a different unit or central location for dining,
whereas 83 units contained at least a single dining room and 1 unit had a total of 6 dining
options. When a unit had multiple dining spaces, occasionally residents were assigned to a single
option, but often they could alternate among dining rooms and seating arrangements. In a few
instances, residents could choose to sit in a different dining room for each meal and the food was
delivered to the resident wherever they chose to dine. At the other extreme, capacity in the
dining room of one facility could only accommodate 66% of the residents so residents were
required to eat from trays in their rooms. In another facility, a recently designated SCU unit
lacked dining capacity so tables were placed in the corridor during meal time to accommodate
diners. One of the obstacles to residents eating at times other than scheduled dining times is the
lack of refrigeration and food warming capabilities directly on the unit. One or more full
kitchens were located on 31 of the units, typically those that embraced cluster concepts of care.
One innovative facility was organized into households with 8-10 residents. For administrative
purposes, 4-6 households comprised a nursing unit, and each household had a full kitchen with
refrigerator, stove, oven, dishwasher, and microwave.
Bathing is a common function that is often a source of agitation for both residents and staff
Page 12.15

(Hoeffer, Rader, MeKenzie, & Stewart, 1997; Rader, 1996). Many reasons can cause this
agitation including: inadequate ventilation, low light levels, improperly used as storage areas,
and possibly, it does not receive attention because it is not routinely viewed by visitors. One
hundred and seventy-six tub/shower rooms were deemed functional but many were neglected in
maintenance and lacked decorations. Ten units lacked a shower/tub room directly on their unit
necessitating residents to travel longer distances to a shower/tub room. The distance from the
farthest resident room to the shower/tub room he/she used ranged from 20 feet to 270 feet. Heat
lamps were observed in only 13 percent of the rooms and not a single towel warmer was noted.
Composite Indices
The data set yielded from the procedure described above contains an enormous number of
individual elements. Although some discrete elements (such as being in a private room) are
useful as independent variables hypothetically related to QOL, it was necessary to determine
ways to combine the data into a manageable number of variables. In our first effort to
accomplish this task, we developed 20 composite indices: 8 scales at the room/bathroom level
included personalization, function-enhancing features, life-enriching features, environmental
control, storage, maintenance, visual separation among roommates, and a hierarchical scale for
privacy; 7 scales at the unit level included clutter in corridors, noxious noise, function-enhancing
features, life-enriching features, unpleasant odors, pleasant odors, and maintenance; and 5 scales
at the facility level included function-enhancing features, life-enriching features, outdoor space
and equipment, facility-wide amenities and maintenance. In addition we developed indices for
adequacy of lighting at all three levels. We also worked on summary measures of the dining and
bathing experiences, respectively, but at this point are not satisfied that we have tapped agreed-
upon normative features related to the wide range of dining and bathing arrangements, which
Page 12.16

encompass all 3 levels of organization–room and bath, unit, and facility. Table 12.1 describes
each index.
Table 12. 1. Composite Index Characteristics at 3 Levels
Scale (theoretical score) # Items Median Mean
Standard
Deviation
Room and bath (n = 1988)
Visual separation 5 3 2.72 1.86
Personalization 7 2 2.27 1.55
Room function enhancing features 4 2 2.23 0.79
Bathroom function enhancing features 8 4 4.06 1.42
Life enriching features 15 5 4.82 2.15
Environmental controls 13 6 5.70 2.03
Storage 7 4 3.99 1.11
Maintenance 3 3 2.71 0.58
Unit (n = 131)
Function enhancing features 7 4 3.47 1.20
Life enriching features 16 10 8.82 4.46
Clutter 10 3 3.54 2.53
Outdoor features 10 0 3.33 4.15
Bathing environment 13 8 7.22 3.47
Dining environment 9 4 3.40 2.44
Maintenance 6 6 5.3 1.19
Facility (n = 40)
Function enhancing features 13 8 8.35 2.27
Life enriching features 15 7 7.68 2.72
Facility amenities and services 10 3 3.40 2.20
Outdoor amenities 10 9 8.20 1.87
Maintenance 5 5 4.83 0.45
Tables 12.2, 12.3, and 12.4 present descriptive data at the room, unit, and facility levels
respectively for almost all the environmental elements collected, including those used for the
composite measures.
Page 12.17

Table 12.2. Composite Indices and Frequency of Index Items at the Room Level
Item % Item % Personalization index Bathroom function index Personal photos 84.9 Grab bars next to toilet 86.8 Door personalization 38.6 Min 3' adjacent to toilet 82.8 Resident’s own chair(s) 29.7 Sink has wheelchair clearance 82.4 Individual bedspread 28.6 Toilet seat 17" + from floor 62.3 Resident’s own lamp(s) 18.4 Bathroom door lever style 37.5 Resident’s own bureau 18.4 Sink has lever hardware 31.5 Individual drapes/curtains 8.0 Grab bars extend 4" in front of toilet 12.7 Life enriching feature index Tilted wall mirror 10.0 Outdoor view from bed 91.6 Environmental controls Chair(s) in sleep area 77.0 Environmental controls 98.6 Flowers (natural or artificial 61.3 Adjustable drapes or blinds 96.0 Resident’s own TV 59.8 Call button within 18" of pillow 95.7 Hobbies/ interests 43.2 Window can be opened 75.4 Religious items in room 37.6 Bathroom door can be locked 56.7 Living plant in room 32.7 Adjustable heating in room 52.4 Resident radio, CD, tape deck 32.2 Adjustable air conditioning 45.6 Resident’s telephone 28.5 Light fixture on rheostat 23.0 Desk or flat work space 12.5 Task light switch 18" from pillow 10.7 Resident bird, fish, pet 2.3 Entry door locks from inside 5.4 Refrigerator in room 1.5 Pressure or rocker type light switch 4.4 Bed larger than single 1.0 Heat lamp in bathroom 3.4 Microwave or hot plate .7 Pressure/rocker switch in bathroom 3.0 Personal computer .4 Storage Visual separation Private closet 96.8 Closet w/o crossing other’s space 71.0 Drawer type storage 93.4 Bathroom w/o crossing other’s space 65.4 Night stand by bed 84.0 Entrance w/o crossing other’s space 64.3 Counter space around sink 41.3 Foyer or shared entrance separate the sleeping areas 37.9 Locking storage 37.1 Decorative screens or dividers 33.4 Table or shelf by chair 37.1 Room function index Enclosed storage in bathroom 9.3 Level change at threshold 91.8 Cleanliness/maintenance Min 4 ft’ clearance side of bed 76.2 Floor covering well maintained 94.8 Entry door lever or push style 47.9 Wall covering well maintained 90.3 Closet rods located 3-4' from floor 6.9 Bathroom well maintained 85.7
Page 12.18
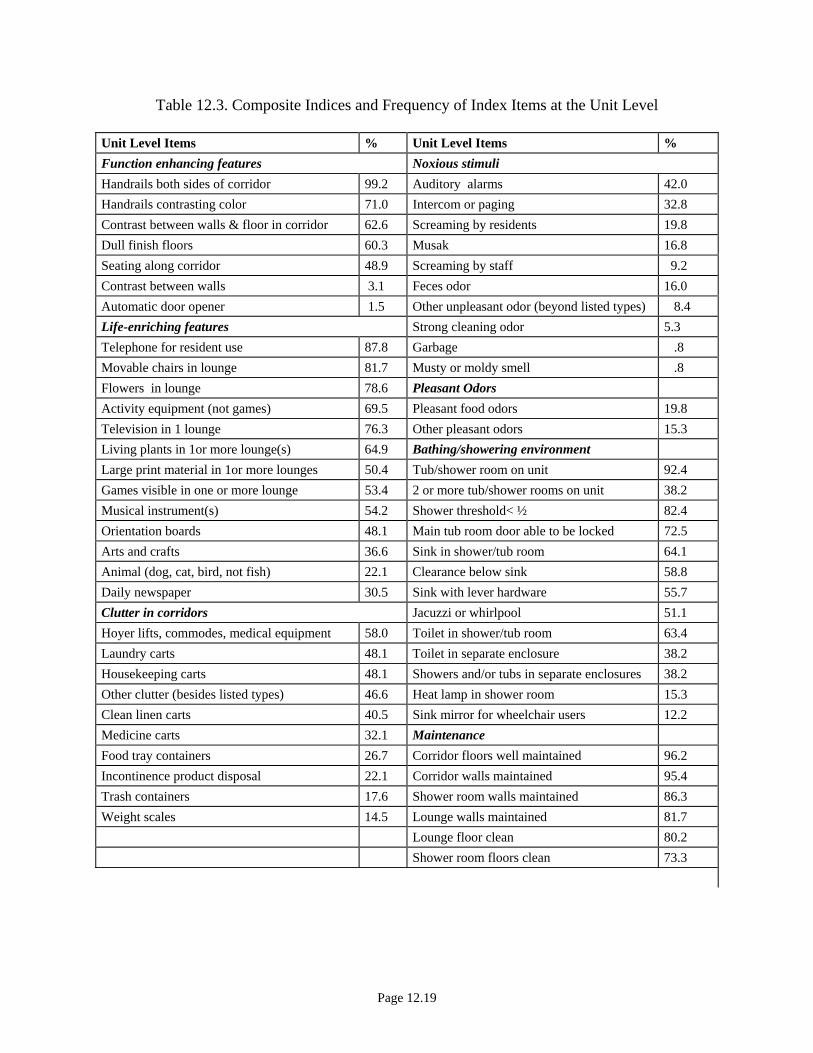
Table 12.3. Composite Indices and Frequency of Index Items at the Unit Level
Unit Level Items % Unit Level Items % Function enhancing features Noxious stimuli Handrails both sides of corridor 99.2 Auditory alarms 42.0 Handrails contrasting color 71.0 Intercom or paging 32.8 Contrast between walls & floor in corridor 62.6 Screaming by residents 19.8 Dull finish floors 60.3 Musak 16.8 Seating along corridor 48.9 Screaming by staff 9.2 Contrast between walls 3.1 Feces odor 16.0 Automatic door opener 1.5 Other unpleasant odor (beyond listed types) 8.4 Life-enriching features Strong cleaning odor 5.3 Telephone for resident use 87.8 Garbage .8 Movable chairs in lounge 81.7 Musty or moldy smell .8 Flowers in lounge 78.6 Pleasant Odors Activity equipment (not games) 69.5 Pleasant food odors 19.8 Television in 1 lounge 76.3 Other pleasant odors 15.3 Living plants in 1or more lounge(s) 64.9 Bathing/showering environment Large print material in 1or more lounges 50.4 Tub/shower room on unit 92.4 Games visible in one or more lounge 53.4 2 or more tub/shower rooms on unit 38.2 Musical instrument(s) 54.2 Shower threshold< ½ 82.4 Orientation boards 48.1 Main tub room door able to be locked 72.5 Arts and crafts 36.6 Sink in shower/tub room 64.1 Animal (dog, cat, bird, not fish) 22.1 Clearance below sink 58.8 Daily newspaper 30.5 Sink with lever hardware 55.7 Clutter in corridors Jacuzzi or whirlpool 51.1 Hoyer lifts, commodes, medical equipment 58.0 Toilet in shower/tub room 63.4 Laundry carts 48.1 Toilet in separate enclosure 38.2 Housekeeping carts 48.1 Showers and/or tubs in separate enclosures 38.2 Other clutter (besides listed types) 46.6 Heat lamp in shower room 15.3 Clean linen carts 40.5 Sink mirror for wheelchair users 12.2 Medicine carts 32.1 Maintenance Food tray containers 26.7 Corridor floors well maintained 96.2 Incontinence product disposal 22.1 Corridor walls maintained 95.4 Trash containers 17.6 Shower room walls maintained 86.3 Weight scales 14.5 Lounge walls maintained 81.7 Lounge floor clean 80.2 Shower room floors clean 73.3
Page 12.19

Table 12.3. Cont’d
Outdoor features Dining environment Outdoor access off unit 44.3 Pictures on wall 72.5
Outdoor seating 39.7 Windows in dining room 69.5 Outdoor table 35.9 Contrast between dishes and table 48.9 Seating covered 33.6 Table cloth or place mats 22.9 Covered patio 33.6 Posted menu 38.2 Outdoor flower garden 33.6 Centerpieces or flowers 26.7 Outdoor area secured 33.6 Kitchen for resident use 23.7 Covered table 32.1 Room used for dining only 11.5 Hard surface walking path 26.0 Menu lettering more than ½ inch 9.9 Raised garden planter 20.6
Page 12.20

Table 12.4. Composite Indices and Frequency of Index Items at the Facility Level
Facility Level Items % Facility Level Items %
Function enhancing features Life-enriching features
Floors avoid high contrast 97.5 Flowers in lounge 97.5
Handrails on both sides of corridor 77.5 Lounge with moveable chairs 95.0
Handrails contrast with wall 75.0 Lounge with window 95.0
Corridor walls contrast with corridor floors 72.5 Musical instruments 77.5
Corridor floors dull finish 70.0 Games and/or cards 60.0
Contrast between chairs and floor in lounge 85.0 Arts and crafts 50.0
Wayfinding signs present 35.0 Daily newspaper 45.0
Large lettered clock present 80.0 Dog or cats 37.5
Handrails extend around corners 50.0 Computers for resident use 30.0
Lobby toilet that may be used by residents 47.5 Orientation board 42.5
Automatic door opener 47.5 Arts and crafts 50.0
Large print material in lounge 67.0 Jigsaw puzzle in use 30.0
Covered drop-off 30.0 Exercise equipment 5.0
Amenities and services Popcorn machine 20.0
Beauty shop/barber shop 97.5 Balls & other large motor skill equipment 32.0
Library, reading room, or book cart 62.5 Outdoor amenities
Chapel or meditation room 40.0 Flower garden 97.5
Gift shop that is accessible to residents in w.c. 32.5 Moveable seating 95.0
Coffee shop or snack bar for residents/ family 30.0 Bird feeder or bird bath 92.5
Children’s play area 30.0 Outdoor table with chairs 92.5
Cafe/restaurant for light meals 15.0 Hard surface wandering path 87.5
Children’s day care on premises 15.0 Recreational activities (e.g. horseshoes) 82.5
Greenhouse/sunroom/solarium 12.5 Covered seating 82.5
Maintenance Covered picnic area 82.5
Corridor floors clean 100 Raised garden planters 52.5
Corridor walls maintained 97.5 Secured outdoor area 65.0
Lounge floors clean 97.5
Lounge walls maintained 97.5
Facility grounds maintained 90.0
Page 12.21

Room and Bath Composite Indices
Visual Separation was developed to reflect the level of privacy and territorial control
afforded by the physical environment for residents in multiple bed- rooms. Only 5% of the
residents in shared rooms experienced all 5 of the visual separation items for a perfect score of 5,
whereas 20% scored 0 on that scale.
Bed Separation is a 5 item hierarchical index that identifies the bed arrangement on a range
from the optimal private room (29.2%) to the least desirable arrangement of 3 or more beds in a
room placed side by side (6%); 46% of the residents were in double rooms with beds placed side
by side.
Personalization refers to the extent of personal belongings, furnishings and decorations
present in the resident room. Clearly, a higher score on this index is a function of individual and
familial resources as well as facility policy; we would expect the latter to be more at play if
almost no residents have individualized personal items in their rooms and if the furnishings,
decor, and room arrangements do not vary within the facility. Other than individualized photos
(present for 85% of the 1988 residents), personalization of space was minimal. Only 18%
brought their own bureau and 30% brought one or more chairs. The mean was 2 on a possible
score of 7 and 10% scored 0. As expected, multi-bed rooms are less personalized than private or
semi-private rooms.
Life-enriching Features identifies 15 items in a resident’s room that have the potential to
provide the resident with meaningful activity, comfort, relationships and/or enjoyment. Most of
the residents (92 %) had a view of the natural environment. At another extreme, only 13% had a
horizontal work or desk surface. Flowers, especially artificial ones were relatively common
(61%), but living plants were less so (33%). Many (41.2%) of the residents did not have a
Page 12.22

television under their control, a high number even considering that some NFs adhered to the
philosophy that no televisions should be available for people on dementia units. A surprising
23% did not have even one chair for their own or a visitor’s use, and only 29% had their own
telephone. Among rarer instances, 3% had a pet (dog, cat, bird or fish), 1.5 % had a refrigerator,
1% had a double bed, 8 residents (.7%) had a personal compute and the same number had a
microwave. Thirteen residents lacked a single life enriching item, 30 percent had less than 4
items and 6 residents (0.3%) had 11 of the 15 items.
Function-enhancing features is a 8-item index which measures how well the resident’s room
and bath supports the needs of frail persons using wheelchairs, walkers, or other devices. The
mean score of 3.6 suggests that the rooms in the sample could be more supportive of resident
functioning. Lever type hardware, was found on only 47% of the entry doors, 38% of bathroom
doors, and 31% of sink faucets. Although the majority of the sample use a wheelchair, only 7%
of the closet rods were located 36 to 48 inches from the floor, a height considered wheelchair
accessible.
The 17 item Environmental Control index measures the degree to which the physical
environment has the potential to be manipulated by the resident (recognizing that some residents
will be unable to manipulate any environmental control); fifty-two (52%) had adjustable heat,
and 46% had adjustable air conditioning. The call button was located within 18 inches of the
bed pillow for 96% of the residents, and the on/off switch for task lighting was located within
easy reach for 75%. Regarding lighting controls, 23% had potential to control the intensity of
the light with a dimmer switch, 68 residents (3%) had control of a heat lamp in the bathroom,
and only 3% of the residents had light wall switches of the pressure or rocker type.
Storage was measured by a 7 item index; the mean for the sample score was 4. Seven
Page 12.23

residents had only one type of storage whereas 18 residents had all 7 items. Private closet type
storage, drawer type storage and a night stand were common to most rooms. Only 37% percent
of the residents had storage space that could be locked. Ample storage space in bathrooms has
the potential of increasing staff efficiency by requiring fewer trips to a central storage location.
Only 41% had counter space available around the bathroom sink, and only 9% had storage space
in the bathroom sufficient to store a supply of incontinence products. Maintenance in resident
rooms was measured by a 3 item scale that included upkeep of the floors, upkeep of walls, and
cleanliness in the bathroom. Overall, maintenance was found to be good with little variation.
We performed an analysis of variance (ANOVA) to test the difference of means on the room
scales between those in single rooms, double rooms, and rooms with 3 or more residents. Table
12.5 shows that in all cases the means are significantly different from each other; those in shared
rooms are likely to have lower scores on the composite scales.
Table 12.5. One-Way ANOVA on Composite Scale Mean Differences between Room Types
Scale Mean in Private Room
Mean 2 Beds
Mean 3+ Beds
Overall F
Personalization - 7 3.17 1.99 1.45 180.60 Life Enrichment - 15 items 6.19 4.51 3.12 261.98 Function Enhancing - 12 items 6.31 5.97 4.67 107.06 Environmental Controls - 17 items 7.70 7.19 5.71 91.95 Storage - 7 items 4.40 3.91 3.38 87.07 Maintenance - 3 items 2.80 2.71 2.47 29.79
All means are significantly different from each other according to Tukey’s HSD statistic.
Unit Composite Indices
Unit level indices were developed from data collected in individual assessments of the
131 units. Function enhancing features largely refers to corridors and items that facilitate ease
of movement within and between units. Even though 99% of the units had handrails on both
Page 12.24

sides of the corridor, they were often obscured by clutter (as shown in a separate scale). Light
levels in the corridors were problematic with only 5% of the unit corridors registering an average
level above 75 foot candles, a level even less than the desired minimum of 100 foot candles.
Automatic door openers to exit the unit were found on only 2 units.
Clutter is measured by presence of 10 types of clutter. No clutter was found on 12 units and
all 10 types were found on 3 units. Hoyer lifts, commodes, and other medical equipment were
the most common type of corridor clutter, found on 58% of the units. Incontinence product
disposal containers were identified in 22% of the unit corridors, often resulting in unpleasant
odors. Items such as animal cages, leg prostheses, clothes hangers, and even a game of bowling
were observed in the corridors.
Noxious noise was measured by 6 different identifiable sounds. A single sound is less
problematic, but when the 6 items are combined the level increases dramatically. This scale does
not address the sustained high level of noise heard on some units, it simply identifies what
sounds were heard during a 2-4 hour span on each unit. It does not address the consistency of
the noise or the possible resident and staff response. On some units an ongoing effort was made
to keep the noise levels low; on others the sound of auditory alarms was constant. For example,
cuckoo clocks and Cockatiel birds announced their presence at regular intervals 24 hours a day,
or Musak continued nonstop for everyone to hear. Resident screaming was heard on 20% of the
units and staff yelling or screaming on 9%.
Life-enriching features included 16 items that might be potentially enjoyable in lounge or
shared spaces that were available to all residents. Large print reading material was found in 40%
of the units, a pet lived on 22% of the units, and residents had access to a daily newspaper on
17% of the units.
Page 12.25
The Outdoor amenities index included 10 items that have the potential to provide an
additional area for residents and family to enjoy. Direct access to outdoor amenities was
available on 44% on the units but only 10% of the areas were secure either by fencing or as an
enclosed courtyard. Raised garden planters were available on 21% of the units.
We developed separate short indices for pleasant odors and noxious stimuli. The former,
such as smells of food or of laundry products, were identified more often than the unpleasant
odors. If a washer and dryer were located directly on the unit, that unit was likely to be
associated with pleasant smells.
The number of shower/tub rooms on individual units varied from 10 units without any such
rooms to 5 units that had 3 such rooms. When multiple shower/tub units were found on the unit,
the assessor completed the instrument for the room that staff indicated was most frequently used.
(For the most part, shower/tub rooms were similar on a unit.) The distance from the furthest
resident room on the unit to the shower/tub room most used ranged from 20 feet to 270 feet.
Thirty-one (31%) of the units had poorly maintained shower room floors. On 80% of the units,
either there was only one shower or tub in the room or the multiple showers and tubs were in
separate enclosures. Toilets were present in 57% of the shower/tub rooms, 37% of them
enclosed. Jacuzzi’s were found in 44% of the units but heat lamps and sink mirrors were rare.
The number of dining rooms on units ranged from 33 units with 0 dining rooms to 4 units
with 3 dining rooms. (Other facilities had central dining rooms, and typically eating occurred at
the unit level as well as in the central dining room.) Place mats or tablecloths were used in 40%
of the units and in 27% flowers or a centerpiece was placed on the tables. At the unit level, 15%
of the dining rooms are devoted strictly to dining with the remainder serving the dual function of
lounge and dining space. In one facility the dining/lounge space was reclassified as a day room
Page 12.26

and residents spend most of their day in that one room. There was food refrigeration and heating
capability in 23% of the unit dining rooms, affording more flexibility in eating times. There was
color contrast between dishes and table tops for 49% of the units. Posted menus were located in
close proximity to the dining room on 38% of units, but unfortunately the menu lettering was
greater than one-half inch for only 13%.
Facility Composite Indices
With the exception of the beauty/barbershop, the 9 items included in the Facility Amenities
scale include amenities that all users (visitors, residents and staff) can use. Almost all (98%) had
a beauty/barber shop, most often leased to outside vendors. (Several facilities have de-licensed
the shop so volunteers can provide hair care for the residents.) Access to books, either through a
library cart or a specified room, was available in 63% of the facilities. One facility located in a
large Continuing Care Retirement Community had a full time librarian and 3 libraries, one for
large print books, one for regular books, and a separate video and book cassette library. Separate
chapels or mediation rooms were found in 40% and 15% of the facilities had a café where light
meals could be purchased.
Regarding outdoor amenities, at the facility level over 90 % provided designated outdoor
space, 65% of which had a secured outdoor area. (Areas were determined to be secure at unit or
facility level if they were enclosed either from the location of an inside courtyard or the area was
fenced.) All 10 of the items in the outdoor amenity scale were found in 50% or more of the
facilities. Maintenance at the facility level achieved a higher score than the room or unit levels.
We itemized 17 Life-enriching Features and 7 Function-enhancing features at the facility
level. Many of these replicate the items examined for unit scales. For example, corridor rails
and way-finding devices in facility-wide space were features of the latter. Also, a common
Page 12.27

concern expressed by residents and confirmed by data is the lack of a toilet for residents to use
when they are away from their rooms. For example, 52% of the facilities did not have lavatories
at the front door that were accessible and permitted for resident use.
Lighting
Lighting in any room is critical to comfort and safety. Most elderly people require 4 to 5
times more light to distinguish a figure from the background than young people with “normal”
vision (Liebrock, 1993). One hundred foot candles (100 fc) is the level of illumination
recommended by the American National Standards Institute. As shown in Table 12.6 lighting
was often inadequate. The lighting in the resident bathrooms was especially problematic.
Attempting to use a toilet with 001 foot candle of light replicates a condition of blindness.
Measurements at head of bed were taken with drapes drawn measuring all light available to a
resident reclining in bed. Measurements in bathroom were taken with the door shut, turning on
all available light fixtures.
Page 12.28

Table 12.6. Light Levels
Location Mean Median Standard deviation Minimum Maximum
Head of bed* 37 fc 35 fc 20.8 fc 4 fc 95 fc Bathroom at sink* 25 fc 20 fc 15.6 fc 1 fc 75 fc Bathroom above commode* 13fc 10 fc 9 fc 1 fc 48 fc Highest tub/shower room 82.8 fc 68 fc 70.8 fc 7 fc 505 fc Lowest tub/shower room 16.6 fc 14 fc 13.3 fc 2 fc 85 fc Highest nurse’s station 91.6 fc 84 fc 53.2 fc 10 fc 410 fc Lowest nurse’s station 33.4 fc 25 fc 24.5 fc 5 fc 140 fc Highest unit corridor 108.7 fc 65 fc 283.8 fc 10 fc 3200 fc Lowest unit corridor 14.5 fc 13 fc 12.5 fc 1 fc 82 fc Highest unit lounge 292 fc 116 fc 530.3 fc 15 fc 3100 fc Lowest unit lounge 24.8 fc 17 fc 27.4 fc 2 fc 132 fc
* Readings taken in one room in unit.
On the units, 3 different light level readings were taken in the shower/tub room, dining
room, corridors, nurse’s station and lounge. The first reading was taken between the main light
fixtures in room or corridor if the area was large and there were several fixtures. If only one
fixture was in the area then the reading was taken to the side of the fixture. In both cases the
intent was to measure the average amount of light that the users - staff and resident - had
available to them as they used the room. The highest level was taken directly under the brightest
fixture. The lowest level reading was often in a corner or in the shower room where it tended to
be directly under the shower head. Table 12.6 illustrates not only the extent of sub-optimal
lighting but also the variation. Although the lowest shower/tub room reading was only 2 foot
candles, one shower/tub room had a high of 505 foot candles, an area that was excessively
bright. Variation was also considerable in corridor readings, where a particular corridor could be
very dark in sections without windows.
Identifying exemplary and innovative environmental features in these 40 facilities was easy;
certain features tended to stand out. Although innovative features were clustered in certain
Page 12.29
facilities (typically new ones), no facility was a “perfect environment” that was exemplary in all
respects. We also found one or more exemplary features worth describing in many facilities with
generally conventional or unimpressive physical environments. We found exemplary shared
spaces that benefited not only users of the facility but the greater outside community as well. A
main street area, complete with a café, ice cream parlor, aviary and gift shop featuring items
crafted by residents, welcomed students from the nearby college and elementary school children
who regularly visit the residents. A few facilities had fully equipped gymnasiums with state of
the art workout equipment that were used by staff and residents. At one facility with an
exemplary outdoor and porch area, a resident took great pride in greeting and activating the
automatic door for visitors. We noted some unique nurse’s stations, which were configured like
hotel concierge desks and another one with long horizontal work space where residents could sit
alongside staff.
In the sample, 3 facilities built 30 years ago had the foresight to provide all private rooms
for the residents; although one of these facilities had dormitory-style toilets and showers that
were shared by large numbers. Also in the sample were 2 facilities with an extraordinary degree
of privacy in their double rooms: in both cases, the corridor door opened to a vestibule area that
contained a shared toilet room, but a floor to ceiling wall separated the remainder of the room.
The two sides had individual temperature controls and each had its own window. There was the
potential to decorate each side distinctly since neither was visible to the roommate.
The most noteworthy facility in the sample was organized in households of 8 to 10 residents.
Each household contained a residential style kitchen, a great room with living and dining area, a
smaller living room for more private gatherings, and a laundry room with a residential style
washer and dryer. The computer for the MDS was located on a kitchen counter and the charts
Page 12.30

were located on a shelf near the recipe books. The nurse’s stations were integrated into the
dining area, not separated behind a counter.
Developing a Typology of Nursing Home Environments
The rich data we collected on a plethora of attributes of the physical environment at the
room, unit and facility level that might be related to QOL posed an analytic challenge. Since
there are potentially more attributes than observations of resident QOL, it is not computationally
possible to include indicators of every attribute in the same analysis. Therefore some method of
data reduction was required. One traditional approach is to use factor analysis. However, in this
situation, the majority of variables were dichotomous and many were highly collinear making
this method unworkable. We therefore used cluster analysis to identify a typology of physical
environments that captured the different constellations of attributes that were associated with one
another. This approach makes maximum use of all of the available data to develop a
parsimonious set of clusters that can be used for further analysis.
Cluster Analysis
A hierarchical cluster analysis was used to group nursing home facilities and their associated
units and rooms into clusters based on the presence or absence of environmental attributes that
are hypothesized to be associated with nursing home resident QOL. We first conducted separate
cluster analysis at the facility, unit and room levels. The relationship between the resulting
cluster solutions revealed that there were associations between room, unit and facility types. We
determined that a combined cluster model would result in a more parsimonious set of clusters,
further simplifying the analysis. The prevalence of each attribute in each cluster was used to
characterize the clusters.
Agglomerative clustering with complete linkage was employed using SPSS Version 11.0.
Page 12.31

The complete linkage method was used to yield highly similar and spatially distinct clusters.
Initially, nursing home facilities (n=40), units (n=131), and room and bath environments
(n=1988) were combined into clusters based on the simple matching similarity measure for
binary coded environmental attributes. Because the absence of an attribute may be as important
as the presence with respect to nursing home QOL, simple matching was chosen over Jaccard's
method to account for and equally weight the joint presence or joint absence of each given
variable. The primary limitation of simple matching is potential misclassification of nursing
home facilities, units or rooms as similar due to the absence of a characteristic.
Dichotomously coded variables were selected to characterize the clusters representing the
presence or absence of various environmental attributes relating to stimuli, amenities and
furnishings in the corridors, lounges, dining rooms, baths and personal spaces. Only attributes
that were present in 15 to 85% of the facilities, units, or rooms were used in the cluster
procedures to avoid attributes that had limited ability to discern different types of nursing home
environments.
Facility Variables. At the facility level, 164 attributes associated with the site, entrance,
lobby/reception area, lounge area, corridors, services/activities/amenities, outdoors, and noxious
stimuli were considered. Using the 15-85% criterion for selection, a subset of 85 variables was
selected for the cluster analysis procedure. Facilities could have more than one lounge or social
space. The average number was 1.3 (range 0 to 3); 1 facility had none and 31 facilities had two
or more. In facilities that had more than one lounge or social space we constructed a set of
aggregate variables that captured whether each attribute was present at all at the facility level in
any lounge or social space.
Unit Variables. At the unit level, a total of 156 attributes associated with baths, lounges,
Page 12.32

corridor, noxious stimuli, and amenities were considered. A total of 89 attributes met the 15-
85% criterion for selection and were used in the cluster analysis. Units could have more than
one lounge or bathing room. The average number of lounges was 1.6 (range 0 to 4); 20 had no
lounge, 62 had 2 or more. The average number of bathing rooms was 1.3 (range 0 to 3); 10 had
no bathing room, 50 had two or more. For lounges and bathing rooms we constructed a set of
aggregate variables that identified whether each attribute was present at all at the given unit.
Room Variables. At the room level, 93 attributes associated with the nursing home resident's
room, its entrance, resting or sleeping space, personal and social space, lighting, furnishings,
personalization, decoration, and toilet facility were considered to cluster the residents' rooms. Of
those variables considered, 47 attributes were used in the room level cluster analysis.
Determination of the Number of Clusters. We combined data from the facility and unit
levels for preliminary cluster analysis. The rationale is that although data were collected
separately at the facility and unit levels, many facility attributes are shared across units and
several facilities have only one unit. This preliminary analysis led to a 5 facility-unit cluster
solution. Separate preliminary analysis was done at the room level, leading to a 6 cluster
solution. Examination of the association between the two sets of clusters revealed that a number
of the cells were sparsely populated. Not every room type was represented in each facility-unit
type, making it impossible to examine the independent effects of each cluster type on QOL. In
order to produce a solution that would allow meaningful analysis, we therefore combined
variables from all three levels into a single cluster analysis. This led to a parsimonious 6 cluster
solution (see Table 12.7) with only one cluster having as few as three facilities.
Page 12.33

Table 12.7 shows the number of residents per room in each cluster (approximately 50 rooms
were sampled per facility). The smallest is Cluster 1, with only 3 facilities; the largest is Cluster
3 with 11 facilities. Selected descriptive statistics for each cluster are shown on Table 12.8.
Table 12.7. Distribution of Clusters
Cluster N % 1 150 7.5 2 250 12.6 3 550 27.7 4 300 15.1 5 488 24.5 6 250 12.6
Total 1988
Table 12.8. Descriptive Statistics for Clusters
Cluster Average 1 2 3 4 5 6
Overall Average
Residents per Room 1.9 1.4 1.7 2.1 2.3 1.5 1.9 Personal Space in Room
per Resident (Square Feet) 141 195 147 126 119 190 148
Total Number of Lounge Areas in Facility 2.7 3.4 2.4 1.8 1.7 3.0 2.4
Total Beds in Facility 148 144 136 101 105 137 125
To aid in interpreting the clusters, we calculated the prevalence of each attribute in each
cluster. The overall prevalence of the different attributes varies widely, thus we used z-scores to
standardize the prevalence figures. Since the standard deviation is a function of the sample size
which varies for facility, unit and room, we used a different criterion for facility, unit and room
attributes. Extreme values were defined as 3 SD above or below the mean for facility level
attributes, 6 SD above or below the mean for unit level attributes and 9 SD above or below the
mean for room level attributes. This is a conservative approach to defining differences that
Page 12.34

focuses on strong contrasts. Facility attributes are presented on Table 12.9, unit attributes on
Table 12.10, and room attributes on Table 12.11. Clusters that had a high prevalence of a given
attribute are marked by a ‘+’ and clusters marked by a low prevalence (greater than 3 SD below
the mean) are marked by a ‘-.’ The following paragraphs describe each Cluster in terms of
selected attributes found on Table12.9- Table 12.11 (Variables not used in the cluster analysis
are not included in these tables.)
Page 12.35

Table 12.9. Internal Facility Attributes Associated With Cluster Membership
Cluster Attribute Overall Prevalence 1 2 3 4 5 6
Category: Site residential 0.60 — — mixed use 0.40 + + covered drop off 0.30 + Category: General one story 0.45 — — + facility level dining available 0.59 — + + dining alternatives 0.16 + dining assistance available 0.42 — Category: Main Entrance automatic door opener 0.48 + + — — + vestibule 0.63 + — — + door unlocked- no staff 0.15 door unlocked- monitoring 0.65 — Category: Lobby/Reception Areas receptionist desk 0.78 + — + directory of residents 0.33 + — visitor sign-in/ sign-out 0.37 — + public toilet 0.48 + — — + wayfinding 0.35 + + — + public telephone in lobby 0.77 + — + Category: Lounge/ Social Space multipurpose room 0.63 + + — separate activity room 0.42 + separate sitting room/ parlor/ living room 0.40 — + other 0.45 — + — — + games and/or cards 0.60 + —arts and crafts 0.50 + + —large motor skills equipment 0.32 + —musical instruments and other equipment 0.77 + popcorn machine/ refreshments laid out 0.20 + + — —jigsaw puzzle 0.30 + —kitchenette in lounge area 0.30 + + — strong color contrast between all chairs and floor 0.85 — — single chair adjacent to table with lamp 0.47 — + — current daily newspaper for shared use 0.45 — + choice of one, two, or multiple person seating 0.78 + at least one piece of reading material is in large print 0.67 + Television 0.70 + —large clock with large lettering 0.80 + + —orientation board that communicates day and date 0.43 living plants in lounge area 0.85 —
Page 12.36

Table 12.9, page 2 Cont’d
Cluster Attribute Overall Prevalence 1 2 3 4 5 6
Category: Corridors/ Stairs window view in corridor 0.77 wall finishes differ between corridors 0.20 — + —floor finishes differ between corridors 0.15 handrails on both sides 0.78 + — + handrails continue around corner 0.50 — handrails contrasting color with walls 0.75 + seating along corridors 0.65 + — — + color contrast between walls & floors 0.73 + — Category: Amenities wheelchair accessible gift shop 0.33 — + — — + coffee or snack bar 0.30 — + + volunteer lounge 0.18 + + café for light meals 0.15 + + laundry room residents can use 0.15 + library 0.57 + — + aviary / birdcage 0.38 + + — aquarium / fish tank 0.50 + dog or cats that live in 0.38 — + — residents cannot be viewed in beauty shop 0.75 + resident access to computer 0.30 — + — + separate chapel or meditation room 0.40 + + — + religious artifacts 0.60 + + — + vigil room 0.18 + + intergenerational activities 0.15 + + provisions to entertain kids 0.30 + — + electric wheelchairs 0.57 + Category: Outdoor Access covered seating 0.82 covered outdoor area 0.73 — + secured outdoor area 0.65 — — + raised garden planters 0.52 outdoor recreational activities 0.82 — Category: Noxious Stimuli auditory alarms 0.18 intercom or paging 0.38 — loud Speaker or musak 0.15 pleasant food smells 0.40 — + +
Page 12.37

Table 12.10. Internal Unit Attributes Associated With Cluster Membership
Cluster Attribute Overall Prevalence 1 2 3 4 5 6
Category: Shower/ Tub Room swing door tub 0.20 + Jacuzzi/ whirlpool bath 0.51 Hoyer lift available with tub 0.52 sink located in tub/shower room 0.65 — clearance below sink for wheelchair access 0.60 — lever faucet meets the fist test 0.55 + — more than one tub or shower in room 0.55 + — individual enclosures for each tub or shower 0.28 — shelves for temporary storage of personal items 0.42 hooks for temporary storage of personal items 0.59 toilet located in tub/shower room 0.64 toilet in tub/shower room is in separate enclosure 0.42 — vertical/horizontal grab bars in shower 0.59 + — —heat lamp for heating in ceiling 0.15 main bathing room door locks from inside 0.74 — threshold level change into shower is <1/2 inch 0.81 — Category: Lounge/Social Space multipurpose room 0.71 — + separate activity room 0.16 + separate sitting room/ parlor/ living room 0.17 kitchenette in lounge area 0.24 + games and/or cards 0.52 — — arts and crafts 0.37 large motor skills equipment 0.22 musical instruments and other equipment 0.53 + floor avoids high contrasting patterns 0.82 some moveable seating is supplied 0.82 — — choice of one, two, or multiple person seating 0.49 — + strong color contrast between all chairs and floor 0.67 — + single chair adjacent to table with lamp 0.31 + current daily newspaper for shared use 0.31 — + at least one piece of reading material is in large print 0.50 — — + television 0.76 + — + one seat in room with out TV 0.47 + television turned off if no one is watching 0.77 — — + large clock with large lettering 0.57 window with view to outdoors 0.82 orientation board that communicates day and date 0.52 — + flowers in lounge area (natural or artificial) 0.79 — living plants in lounge area 0.65 + —
Page 12.38

Table 12.10. Page 2 Cont’d
Cluster Attribute Overall Prevalence 1 2 3 4 5 6
Category: Corridors no door separating 0.65 — + elevator off unit 0.31 + — unit unlocked 0.83 alarm triggered by resident wearing device 0.16 + elevators monitored by staff 0.26 + — window with direct outside view 0.60 handrails continue around corners 0.49 handrails contrasting color with walls 0.72 seating along corridors 0.47 color contrast between walls and floors 0.63 + Hoyer lifts/ commodes/ medical equipment 0.64 — other clutter 0.51 laundry carts 0.53 + —housekeeping carts or equipment 0.51 linen carts 0.44 — large trash containers 0.18 incontinence product disposal 0.28 — + food trays 0.29 — medicine cart 0.34 —Category: Noxious Stimuli auditory alarms 0.46 — screaming or calling out by residents 0.23 TV/radio 0.63 — intercom/paging 0.35 — musak 0.14 feces 0.19 food smells 0.20 + Category: General Amenities staff lounge on unit 0.16 separate examination/ treatment room on unit 0.22 direct access to outdoor amenities 0.49 — + unit has a pet 0.23 dining on unit 0.69 + — special Care Unit 0.14
Page 12.39

Table 12.11. Internal Room Attributes Associated With Cluster Membership
Attribute Overall Prevalence Cluster 1 2 3 4 5 6 Category: Room Type Private room 0.29 + — — + Double room 0.58 — 3 residents in a room 0.09 — — + —4 residents in a room 0.04 — — + + —Category: Room Entrance Signage identifying resident’s name 5/8” or larger. 0.35 + — — Signage identifying Resident’s name in raised or recessed letters
0.15 + — —
Personalized wall or door 0.39 — + Lever type or push release hardware that passes fist test 0.48 + — + — + Category: Resting/ Sleeping Space 4 feet of clearance on either side of Resident’s bed 0.76 + — 2 walls large enough to accommodate bed in room or resident’s section
0.76 — + + — — +
Resident has night stand by bed 0.84 — + Category: Personal and Social Space Chairs in Resident’s sleeping area for own/visitor use 0.77 + — + At least one of Resident’s chairs has armrests 0.73 + + — + Table or shelf unit adjacent to at least one chair 0.37 + — — + Resident has own TV 0.60 + — + More than one TV in room 0.19 Resident has radio/cassette/phonograph/CD player with external speaker next to bed
0.32 + — +
More than one radio/cassette/phonograph/CD player in room
0.18 +
Resident has own lockable storage in room 0.37 + — — + Resident has own telephone in room 0.29 + — — + Resident can operate heating 0.52 — + + — — + Resident’s room is air conditioned 0.78 + + — + Air conditioner in room can be adjusted 0.46 — + — + Category: Lighting On/off switch for fixed task lighting within 18” of resident’s pillow
0.75 + — + —
Moveable task lighting provided at resident’s bed 0.16 + — One or more lighting fixtures on a dimmer switch 0.23 + — Night light in resident’s room 0.52 — + Category: Furnishings/Personalization/Decoration Resident has brought own bureau 0.18 Resident has brought one or more chairs 0.30 + + — — + Resident has brought lamps 0.18 + — — + Resident has individualized bedspread 0.29 + + — Wall has paintings, photos, other items individual to resident
0.85 + —
Signs of hobbies or interests 0.43 — Resident has flowers 0.61 — + Resident has living plants 0.33 + — — + Religious items in room 0.38 —
Page 12.40

Table 12.11., page 2 Cluster Attribute Overall Prevalence
1 2 3 4 5 6 Category: Resident’s Toilet Room Bathroom between 2 resident rooms 0.28 + — —Bathroom door can be locked from inside 0.57 + + —Bathroom door opens outward 0.83 + — + + —Bathroom door is lever type or push release hardware that passes fist test
0.38
Counter space surrounding or near sink for personalization 0.41 — + Sink has single lever faucet that meets that fist test 0.31 + + — Toilet seat about 17” high 0.62 + + — At least 3 feet adjacent or in front of toilet for transferring 0.83 — + + — — + Cloth towels 0.29 — — + Residential fixtures 0.15 + Room has full bath 0.25 — + + — —Floor covered with ceramic tile 0.49 — — + + — +
Cluster 1. Cluster 1 is characterized by a high prevalence of a receptionist desk, wayfinding
and public telephones in the main lobby. There is a high prevalence of separate activity rooms
with games, arts and crafts, large motor skills equipment, musical instruments, popcorn machines
and other refreshments, kitchenettes, jigsaw puzzles, large print reading materials and clocks,
and a television set. In the corridors, there is a low prevalence of handrails that continue around
corners but a high prevalence of handrails in contrasting colors to the walls. There is a high
prevalence of libraries, bird cages, aquariums, chapels, religious artifacts, and intergenerational
activities, but a low prevalence of dogs and cats or wheelchair accessible gift shops. These
facilities are less likely to have outdoor areas that are accessible, covered or secure. Lounges at
the unit level are unlikely to have games, moveable seating, large print reading material, or
flowers. Corridors are unlikely to be cluttered with linen carts or food trays and there is a low
prevalence of intercom or paging sounds. Resident rooms have a high prevalence of large print
signage, dimmer switches on lights, and personalization. Rooms are unlikely to have heating or
air conditioning controls. Bathrooms have a high prevalence of lockable doors, clearance under
the sink, high toilets and lever type faucets. They are unlikely to have space to transfer,
Page 12.41
however. This cluster is about average in terms of the size of the facility, the number of lounges,
the number of residents per room, and the amount of room space per resident.
Cluster 2. Cluster 2 is characterized by a high prevalence of resident directories, and
wayfinding in the facility entrance. Facility level lounges have arts and crafts, popcorn machines
or other refreshments, kitchenettes, and large clocks with large lettering. In the corridors, there
is a high prevalence of handrails on both sides, seating and contrasting colors between walls and
floors. There is a high prevalence of wheelchair accessible gift shops, coffee or snack bars,
lounges for volunteers, aviaries, computers, chapels, religious artifacts, and pleasant aromas.
Bathing rooms have a high prevalence of grab bars, and there are often living plants in lounge
areas. Units in Cluster 2 have a low prevalence of incontinence disposalcontainers in the
corridors, auditory alarms or sounds of television or radios. Resident rooms are likely to be
private, with lever type releases on the doors, seating options, televisions for each resident,
environmental controls, and moveable task lighting at the bedside. There is a high prevalence of
personalization and living plants. Toilet rooms have a high prevalence of lever type hardware,
clearance below sinks, high toilets, and space for transferring. Although this cluster is
characterized by the largest facilities in terms of total beds, this cluster has the fewest residents
per room, the highest amount of space per resident, and the highest number of lounges overall.
Cluster 3. Cluster 3 is characterized by visitor sign books and public toilets but a low
prevalence of wayfinding. These facilities tend to have separate parlor or living rooms at the
facility level, but lack handrails on both sides of corridors, wheelchair accessible gift shops,
libraries, religious symbols, or pleasant odors. Bathing rooms tend to have more than one bath
or shower and lever type faucets. Units tend to have multipurpose rooms for activities with
musical instruments, televisions, and orientation boards. There is a high prevalence of
Page 12.42

incontinence disposal containers along the corridors. Resident rooms have poor signage, and are
unlikely to have lever type door releases or lockable storage. Rooms tend to have chairs with
armrests and heating controls. The toilet rooms have adequate space for transferring. This
cluster tends to have dining available on the unit. Facilities in this cluster are intermediate with
regard to total number of residents, personal space in resident rooms, the number of lounges and
the number of residents per room.
Cluster 4. Cluster 4 is characterized by a low prevalence of public toilets or telephones in
the lobby, lounges are unlikely to have snacks, a kitchenette, or live plants. There is a low
prevalence of seating along corridors. Bathing rooms at the unit level are unlikely to have sinks
or lever type faucets, grab bars or lockable doors. Resident rooms are unlikely to be private,
have poor signage, and a lack of personalization either on the door or in terms of furniture.
There is a lack of radios and telephones in resident rooms, and low prevalence of living plants.
The toilet rooms in resident rooms can be locked from the inside, but are unlikely to have lever
type door releases or sinks, and there is a lack of space for transferring. This cluster has
relatively small facilities in terms of total beds, but has a high number of residents per room, a
low level of personal space and few lounges.
Cluster 5. Cluster 5 is characterized predominantly by low prevalence of many facility level
features such as a reception desk at the main entrance, a directory of residents, birds or fish,
seating options, or a chapel. At the unit level, there is a low prevalence of games or cards in the
lounge, a lack of large print reading material, and seating options. There are secured outdoor
areas. There is a high prevalence of laundry carts, housekeeping carts, medicine carts and weight
scales in the halls as well as the sound of yelling by staff and odors from cleaning solution, urine
and feces (not tabled). There is a low prevalence of private rooms and rooms are unlikely to
Page 12.43

have accessible door releases, lockable storage, environmental controls, moveable lighting near
bed, night lights, personalization, plants. The resident bathrooms have few function enhancing
features. Dining is not available at the unit level, but is available at the facility level. This cluster
has relatively small facilities in terms of total beds, but has the highest number of residents per
room, the smallest amount of space per resident, and the smallest number of lounges.
Cluster 6. Cluster 6 is characterized by a receptionist desk at the main entrance, public
phone and toilet, and wayfinding. There is a choice of seating in the lounge, handrails on both
sides of the corridors, and seating in corridors. There is a high prevalence of wheelchair
accessible gift shops, coffee or snack bars, laundry rooms for residents, access to computers,
chapels, religious artifacts, intergenerational activities, electric wheelchairs, covered outdoor
areas, and pleasant aromas. Units typically have separate activity rooms with kitchenettes,
choices of seating, large print reading material, contrasting colors, and televisions are turned off
when no one is watching. There are good aromas, and a low prevalence of clutter in the unit
corridors. Resident rooms are likely to be private, with personalization on the door, lever type
door releases, choices of seating, environmental controls, night lights, and residents often
brought their own furniture. The bathrooms often had counter space, clearance below sink for a
wheelchair, space near the toilet, cloth towels and residential style fixtures. This cluster has a
low number of residents per room, a large amount of room space per resident, and a large
number of lounges.
QOL and Cluster Membership. We used one-way ANOVA to examine whether cluster
membership was associated with QOL outcomes (See Table12.12). There was a statistically
significant association with each of the 11 domains of QOL and the 14 item short form. We used
Tukey’s HSD statistic to examine each pair of means to identify significant differences. One
Page 12.44

clear finding is that Cluster 5 has lower QOL scores across all domains. This is consistent with
our overview, which suggests that facilities, units and rooms in this cluster have few positive
attributes, low levels of privacy and space. Clusters 1 and 2 tend to have the highest levels of
QOL overall. Cluster 2 has more private rooms and is higher on the Privacy domain, while
Cluster 1 has more activity related features at the facility level and is higher on the Meaningful
Activity domain. Cluster 6, which has a high level of personal space and a high prevalence of
private rooms has the third highest Privacy score.
Table 12.12. Average QOL By Cluster
Cluster Domain
1 2 3 4 5 6
ANOVA (p value)
Comfort 3.05 3.12 (5) 3.09 (5) 2.97 2.90 3.08 (5)
Functional Competence 3.45 (5) 3.25 3.31 3.20 3.16 3.23 0.017
Privacy 3.46 (5) 3.49 (4,5) 3.35 3.29 3.20 3.42 (5) 0.001
Dignity 3.67 3.72 (5) 3.70 (5) 3.69 3.60 3.70 0.017
Meaningful Activities 2.95 (3,5) 2.69 2.65 2.75 2.63 2.69 0.010
Enjoyment 3.39 (5) 3.23 3.25 3.18 3.08 3.35 (5) 0.002
Individuality 3.09 (3,4,5) 2.95 (5) 2.79 2.75 2.68 2.90 0.008
Relationships 3.27 (5) 3.09 3.10 3.04 2.96 3.09 0.001
Security 3.45 (5) 3.44 3.44 3.40 3.25 3.49 (5) 0.001
Spiritual Well-Being 3.35 (5) 3.24 (5) 3.20 3.03 2.98 3.31 (4,5) 0.001
Autonomy 3.34 3.35 (5) 3.37 3.29 3.18 3.34 0.006
QOL-14 3.41 (3,4,5,6) 3.30 (4,5) 3.20 (5) 3.17 3.08 3.20 (5) 0.001 Note: Number in parenthesis indicates significant pair-wise difference p<.05 based on Tukey’s HSD. Differences are only listed once. Summary and Next Steps for Cluster Analysis
We used cluster analysis to identify 6 distinct types of nursing home environment based on
facility, unit and room attributes. These 6 clusters have distinguishing characteristics, such as
the amount of personal space, prevalence of private rooms and availability of activities. There is
a significant association between cluster membership and resident QOL, validating our approach.
Page 12.45

We believe that this analysis will lead to the identification of specific environmental attributes
that are associated with higher levels of resident QOL.
We selected a 6 cluster solution based on the goal of retaining a large number of facilities
per cluster. Only one cluster has as few as three facilities, thus assuring that each cluster has
a large sample of residents. However, this may have led to heterogeneous clusters with regard
to facility attributes. Even though the clusters are distinct in many ways, facilities may be
grouped together in ways that obscure other differences that may be relevant to QOL.
Preliminary analysis suggests that an 11 cluster solution has no clusters with fewer than three
facilities per cluster, while a 12 cluster solution results in one cluster with only one facility.
Further analysis will examine the 11 cluster solution to determine if there are meaningful
differences between the clusters.
As this report goes to press we have begun a different and more promising approach to
cluster analysis using the composite indices rather than individual items as variables and adding
some of the continuous variables such as distances. We expect this effort to generate more
workable clusters.
Privacy
In Wave 1, 29% of the residents were in private rooms and in Wave 2, 20% were in private
rooms; 13% of the Wave 1 and 14% of the Wave 2 residents lived in rooms that housed 2 or
more residents. Table 12.13 shows that distribution. We already showed that residents in private
rooms were more likely to experience function enhancing and life-enriching environmental
features and were more likely to be able to exercise control over their lives.
Page 12.46

Table 12.13. Prevalence of Private Rooms and Number of Roommates
Wave 1 Wave 2 Both Waves
n % N % n %
Private room
No 1392 71 1338 80 2730 75
Yes 576 29 329 20 905 25
Number of Roommates
0 576 29 329 20 905 25
1 1139 58 1101 66 2240 62
2 175 9 187 11 362 10
3 + 78 4 50 3 128 4
Table 12.14 combines both Wave 1 and Wave 2 samples to examine how being in a private
room and number of roommates affected QOL. The analyses presented control for a very large
number of resident characteristics that might affect QOL. Even after those controls, being in a
private room and having fewer roommates were associated with better QOL on three of the
domains. More analyses are planned on this topic.
Page 12.47

Table 12.14 Effect of Private Room and Number of Roommates on Quality of Life
Private Room Number of Roommates
Domain Coeff. P Coeff. P
Comfort (n=2967) 0.04 0.13 -0.02 0.20
Privacy (n = 2765) 0.31 <.0001 -0.17 <.0001
Functional Competence (n = 2844) 0.09 0.01 -0.05 0.03
Autonomy (n = 2849) 0.04 0.14 -0.02 0.41
Dignity (n = 2833) 0.02 0.44 -0.02 0.14
Security (n = 2757) 0.01 0.64 -0.03 0.10
Relationships (n = 2770) -0.03 0.44 0.01 0.78
Individuality (n = 2669) 0.00 0.90 0.00 0.95
Meaningful Activities (n = 2727) -0.08 0.03 0.05 0.05
Enjoyment (n = 2675) -0.05 0.17 0.01 0.69
Spiritual Well-Being (n = 2767) -0.05 0.13 0.01 0.71 Note: Analyses control for age, gender, race, visual impairment, cognitive function, physical function, length of stay, bladder and bowel continence, depression, hip fracture, and restraints. Analysis was done using hierarchical modeling to adjust for unmeasured facility level random effects. Sample includes both Wave 1 and Wave 2.
Discussion
We have described the instruments used to assess physical environments for 1988 resident
room and baths in 131 units in 40 facilities, and the way the resultant data was combined into
composite indices. First, the work demonstrates that it was possible for persons not expert in
environmental design to reliably assess physical environments using largely objective items.
This large-scale application pointed to several areas where the protocols need to be refined,
especially to gather accurate information about the dining and bathing environment that can
be assigned to the individual resident. Generally, however, we were able to assemble rich
information about these nursing homes and to describe a given resident’s environment at
three levels.
Together, the descriptive findings tell of 40 varied physical environments, and of 131 units
that vary within them. The caveat, of course, is that the 40 nursing homes described here cannot
Page 12.48

be generalized back to the nursing homes in their states, not only because of the small sample
size in any state but also because of the method of selection, where we deliberately over-sampled
some facilities with high proportions of private rooms.
Nonetheless, the environmental deficits described in this sample are all the more
discouraging because the sample was designed to capture at least some better-than-average
environments. The problems include low light levels, lack of lounge space, bathrooms shared by
up to 20 residents, long distances to reach some of them, corridor clutter, noise, and general
absence of life-enhancing features. The findings also highlight the disparity in amenities found
in a private room versus shared rooms. Yet in the same group of facilities, we also identified
positive environmental features well worth further detailed study.
We also presented early cluster analysis and showed some relationships between those
environmental clusters and resident QOL. Finally, we showed a relationship between private
rooms and QOL.
Work is ongoing to refine the cluster analysis protocols using composite scales rather than
individual items, and also adding other variables such as continuous variables measuring
distances and square footage. In all this work, we will continue to take into account the nested
features of the environment (rooms in units in facilities) and take advantage of hierarchical
analysis tools. Also of interest is to examine how resident characteristics might interact with
environmental characteristics to generate resident outcomes. For example, some residents may
depend much more than others on their immediate environment and some may be able to glean
little benefit from improved environments.
Page 12.49

References
Becker, F., & Steele, F. (1995). Workplace by Design. San Francisco, CA: Wadsworth Publishing Company.
Calkins, M. P., & Chafetz, P. K. (1996). Structuring environments for patients with dementia. In
Cohen-Mansfield, J., & Werner, P. (1998). The effects of an enhanced environment on nursing home residents who pace. The Gerontologist, 38, 199-208.
Cutler, L. (2000). Assessing the environment of older adults. In R. L. Kane & R. A. Kane (Eds.),
Assessing Older People: Measures, Meaning, and Practical Applications (pp. 360-382). New York: Oxford University Press.
Day, K., Carreon, D., & Stump, C. (2000). The therapeutic design of environments for people
with dementia: A review of the empirical research. The Gerontologist, 40, 397-416.
Hoeffer, B., Rader, J., McKenzie, D., & Stewart, B. (1997). Reducing aggressive behavior during bathing cognitively impaired nursing home residents. Journal of Gerontological Nursing, 23(5), 16-23.
Langer, E., & Rodin, J. (1976). The effects of choice and enhanced personal responsibility for
the aged. A Field Experiment in an Institutional Setting. Journal of Personality & Social Psychology, 34, 191-198.
Lawton, M. P. (1983). Environment and other determinants of well-being in older people. .
Gerontologist, 23(4), 349-357.
Lawton, M. P., Brody, E. M., & Turner-Massey, P. (1978). The relationships of environmental factors to changes in well-being. Gerontologist, 18(2), 133-137.
Lawton, M. P., & Nahemow, L. (1973). Ecology and the aging process. In C. Eisdorfer & M. P.
Lawton (Eds.), Psychology of Adult Development and Aging (pp. 619-674). Washington, DC: American Psychological Association.
Lawton, M. P., Weisman, G. D., Sloane, P. D., Norris-Baker, C., Caulkins, M., & Zimmerman, S. I. (2000). Professional Environment Assessment Procedure for special care units for elders with dementing illness and its relationship to the therapeutic environment schedule. Alzheimer's Disease and Associated Disorders, 14(1), 23-38.
Moos, R. H., & Lemke, S. (1996). Evaluating Residential Facilities. Thousand Oaks, CA: Sage
Publications.
Phillips, CD, Sloane, PD, Hawes, C, Koch, G, Han, J, Spry, K, Dunteman, G, Williams, RL. (1997). Effects of residence in Alzheimer disease special care units on functional
outcomes. The Journal of the American Medical Association. 278(16), 1340-1344.
Page 12.50

Preiser, Rabinowitz & White. (1988). Post occupancy evaluation. New York: Van Nostrand Reinhold.
Rader, J., Lavelle, M., McKenzie, D. (1996). Maintaining cleanliness: An individualized
approach. Journal of Gerontological Nursing, 22(3), 32-38.
Rowles, G. D. (1978). Prisoners of Space? Exploring the Geographical Experience of Older People. Boulder, CO: Westview Press.
Rowles, G. D. (1998). Habituation and being in place. American Journal of Occupational
Therapy, 45(3), 265-271.
Rowles, G. D. (Ed.). (1983). Aging and milieu: Environmental Perspectives on Growing Old. New York: Academic Press.
Rowles, GD. (1991). Beyond performance: being in place as a component of occupational
therapy. American Journal of Occupational Therapy. 45(3), 265-71.
Seligman, M. E. P. (1976). Learned Helplessness and Depression in Animals and Men. Morristown, NJ: General Learning Press.
Sloane, P. D., & Mathew, L. J. (1990). Therapeutic environment screen scale. American Journal
of Alzheimer's Disease and Associated Disorder, 5, 22-26.
Sloane, P. D., Mitchell, C. M., Long, K., & Lynn, M. (1995). Tess + Instrument B: Unit Observation Checklist (A report on the psychometric properties of individual items and initial recommendations on scaling.). Chapel Hill, NC: University of North Carolina at Chapel Hill.
Zeisel, J., Hyde, J., & Levkoff, S. (1994). Best practices: An environment - behavior (E-B)
model for Alzheimer special care units. American Journal of Alzheimer's Care and Related Disorders and Research, March/April, 4-21.
Page 12.51