Embed Size (px)
Citation preview
Chapter 12:
Watershed Hydrology
Acknowledgement: Guo-Yue Niu

The Processes to Generate Surface Runoff
Infiltration excess
P P
P
qo
f
f
Saturation excess
P P
P
qr qs
qo
zwt
Urban area
Frozen surface
Severe storms
Dominant
contributor

History of Formulating Runoff in Climate
Models
Bucket or Leaky Bucket Models 1960s-1970s (Manabe 1969)
~100km
Soil Vegetation Atmosphere Transfer Schemes (SVATs) 1980s-1990s (BATS and SiB)
150mm “Big Bucket” “Big Leaf”

Recent Developments in Modeling
Runoff in GCMs – TOPMODEL concepts
Saturation in zones of convergent
topography
1. Representing topographic effects on subgrid distribution of soil moisture and its impacts on runoff generation
(Famiglietti and Wood, 1994; Stieglitz et al. 1997; Koster et al. 2000; Chen and Kumar, 2002, Niu and Yang, 2003; Niu et al., 2005)
2. Representing groundwater and its impacts on runoff generation, soil moisture, and ET
(Liang et al., 2003; Maxwell and Miller, 2005; Yeh and Eltahir 2005; Niu et al., 2007; Fan et al., 2007)
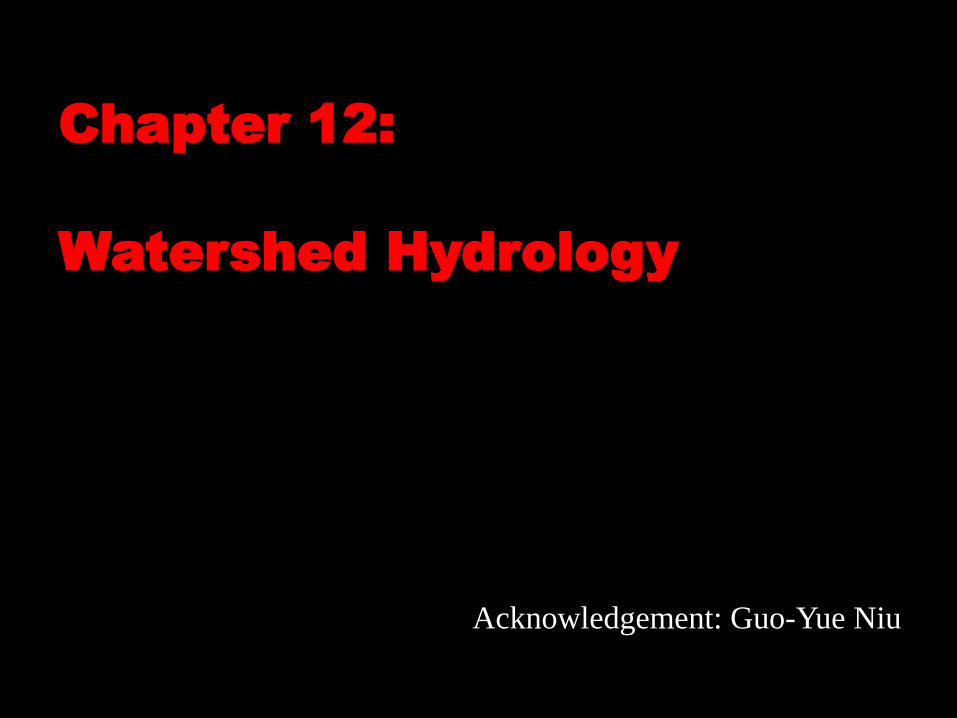
Relationship Between the Saturated Area
and Water Table Depth
The saturated area showing expansion during a single rainstorm. [Dunne and Leopold, 1978]
zwt
fsat
fsat
fsat = F (zwt, λ) = Fmax (λ) e—0.5 f zwt
λ – wetness index derived from DEM

DEM –Digital Elevation Model
ln(a) – contribution area
ln(S) – local slope
WI = ln(a) – ln(S)
DEM (1km) to Wetness Index (WI)
The higher the wetness index, the potentially wetter the pixel
1˚x 1˚

Surface Runoff Formulation
1˚
1˚
The Maximum Saturated Fraction of the Grid-Cell:
Fmax = CDF { λi > λm }
zm λm
Lowland upland
zi, λi
λ
PD
F
0.1
0.2
λm
Fmax
C
DF
1.0
0.5
λ λm
λi – λm = f *zm TOPMODEL (Beven and Kirkby, 1979)

Surface Runoff Formulation
A 1 ˚x 1˚ grid-cell in the Amazon River basin
Both Gamma and exponential functions fit for the lowland part (λi > λm)
fsat = Fmaxe – C (λi – λm) fsat = Fmaxe – C f zwt
Fmax = 0.45; C = 0.6
λi – λm = f *zwt TOPMODEL
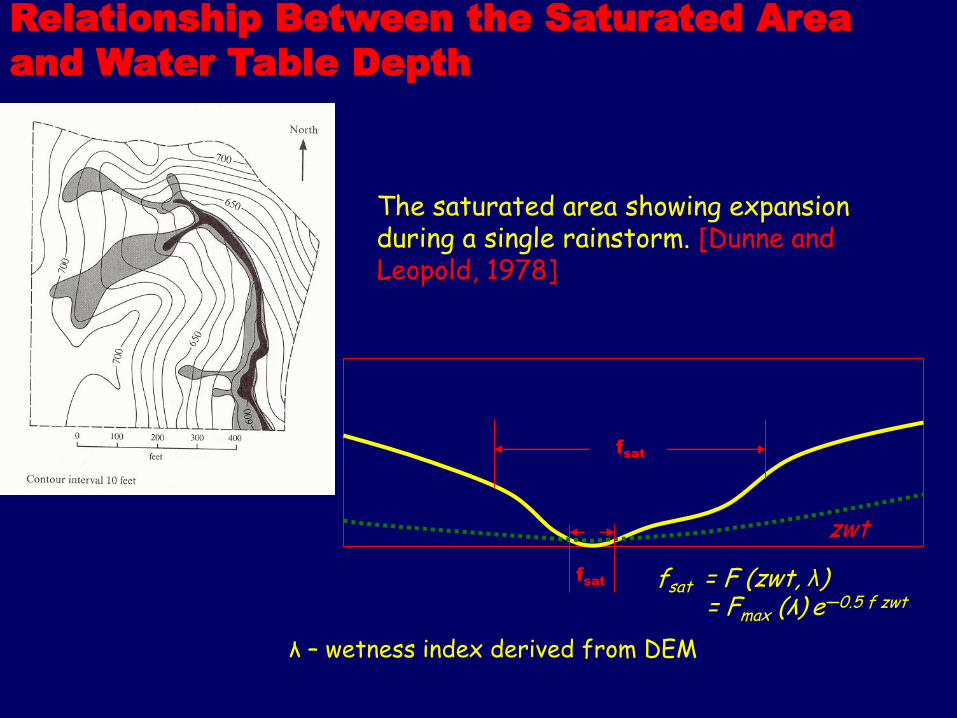
Surface Runoff Formulation
A 1 ˚x 1˚ grid-cell in Northern Rocky Mountain
Gamma function fails, while exponential function works.
Fmax = 0.30; C = 0.5 fsat = Fmaxe – C f zwt

Fmax derived from Hydro1k data
fsat = Fmaxe – C f zwt (Niu et al., 2005)
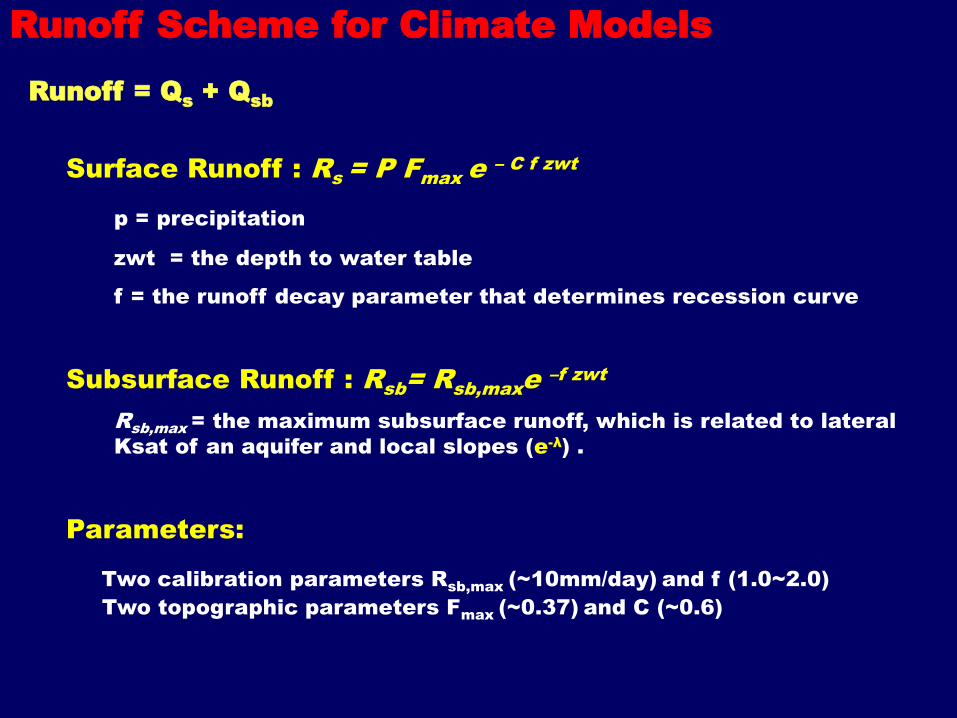
Runoff = Qs + Q
sb
Runoff Scheme for Climate Models
Surface Runoff : Rs = P F
max e
– C f zwt
p = precipitation
zwt = the depth to water table
f = the runoff decay parameter that determines recession curve
Subsurface Runoff : Rsb
= Rsb,max
e –f zwt
R
sb,max = the maximum subsurface runoff, which is related to lateral
Ksat of an aquifer and local slopes (e-λ) .
Parameters:
Two calibration parameters Rsb,max
(~10mm/day) and f (1.0~2.0)
Two topographic parameters Fmax
(~0.37) and C (~0.6)

Prognostic Water Table depth: A Simple
Groundwater Model (Niu et al. 2007 JGR)
bot
botbota
zz
zzKQ
)(
Water storage in an unconfined aquifer:
Recharge Rate:
)1(bot
bota
zzK
Gravitational
Drainage
sba RQ
dt
dW ya SWz /
Upward Flow
under capillary
forces
Buffer Zone
3.4m

Basins for Model
Validation Torne/Kalix
- river basin
-small or middle
watershed,
research site
Rhone
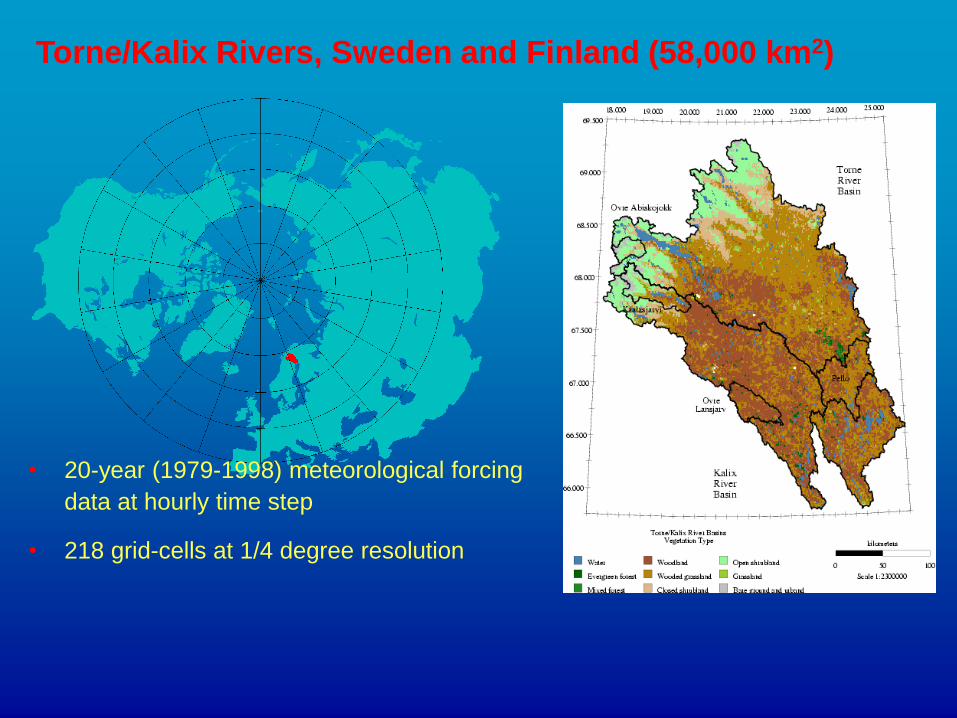
• 20-year (1979-1998) meteorological forcing
data at hourly time step
• 218 grid-cells at 1/4 degree resolution
Torne/Kalix Rivers, Sweden and Finland (58,000 km2)

Modeled Runoff in Comparison with Observed
Streamflow

Model intercomparison:
– 20 models from 11 different countries (Australia, Canada, China, France,
Germany, Japan, Netherlands, Russia, Sweden, U.K., U.S.A.)
VISA – Versatile Integrator of Surface and Atmospheric processes
From Bowling et al. (2003)
OBS
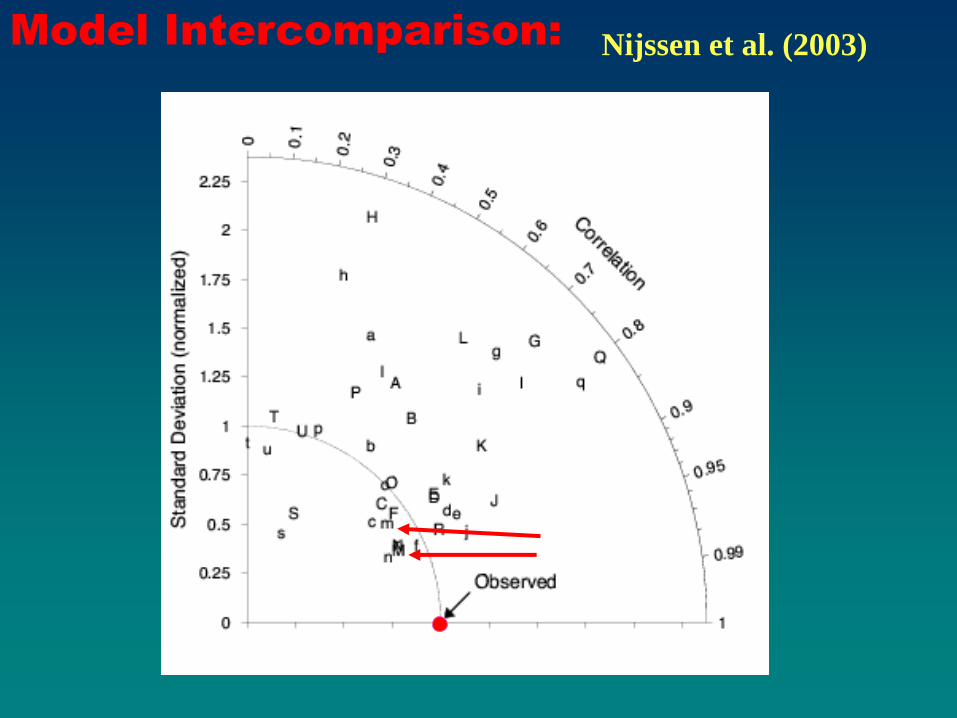
Model Intercomparison: Nijssen et al. (2003)

Outline
Global water storages and fluxes
Tools for prediction
Precipitation
Evapotranspiration (ET)
Surface water, groundwater, and runoff
Land surface modeling
International water programs

Inputs & outputs
Forcing Data
•Precipitation
•Radiation
•Wind
•Humidity
•Air Temperature
Inputs
Parameters •Soil Properties
•Vegetation Properties
Spatial-Scales : Point, Catchment, Regional, or Global
Time step: 30 mins to 3 hours
Online: coupled with atmospheric models
Offline: decoupled; forcing data; testing model
Outputs
Water storage (soil moisture,
snow mass, GW, etc.)
ET (evaporation &
transpiration)
Runoff (surface & groundwater
discharge)
Energy fluxes (heat &
radiation)
Temperature
Carbon fluxes (CO2 & BVOC,
GPP, NPP etc)
Carbon storage (veg. & soil)
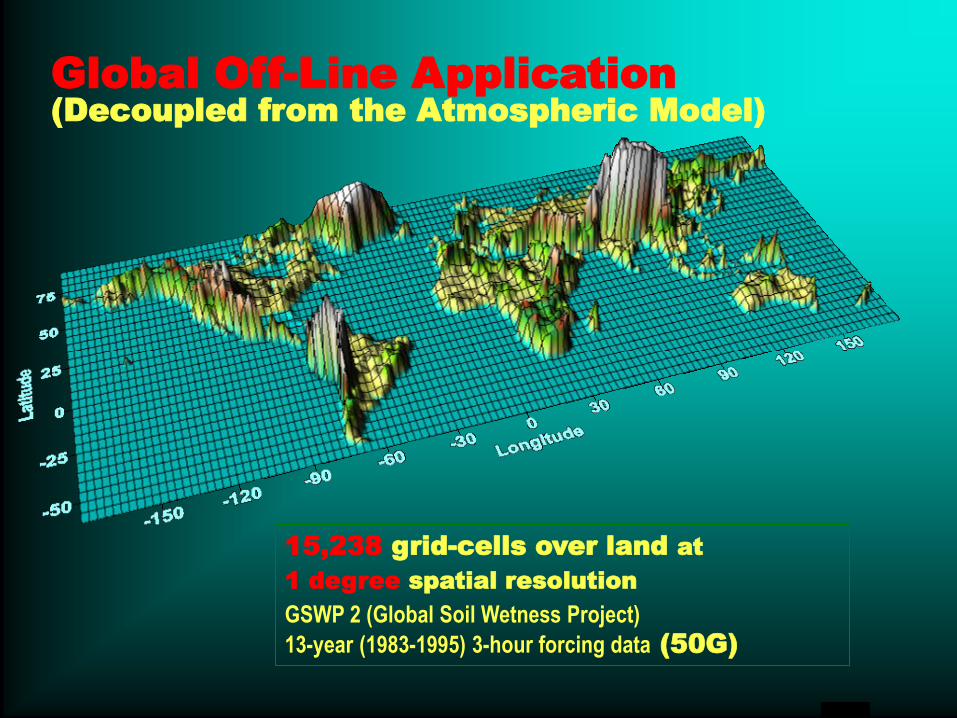
Global Off-Line Application
(Decoupled from the Atmospheric Model)
15,238 grid-cells over land at
1 degree spatial resolution
GSWP 2 (Global Soil Wetness Project)
13-year (1983-1995) 3-hour forcing data (50G)

Global distribution
of annual mean
temperature, oC
-30
-25
-20
-15
-10
-5
0
5
10
15
20
25
30
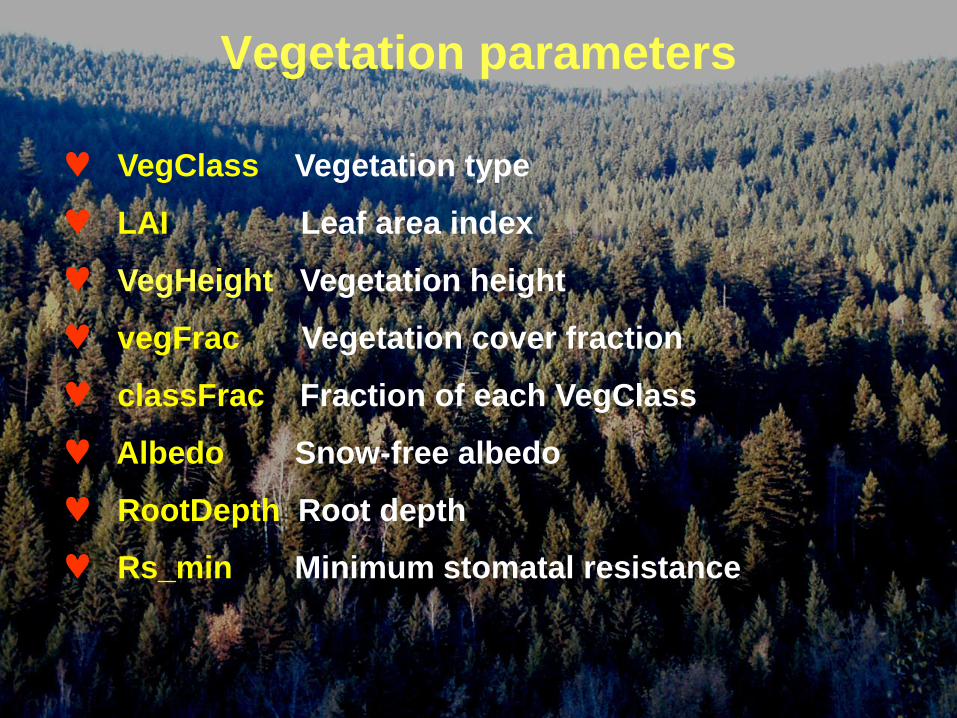
Vegetation parameters
VegClass Vegetation type
LAI Leaf area index
VegHeight Vegetation height
vegFrac Vegetation cover fraction
classFrac Fraction of each VegClass
Albedo Snow-free albedo
RootDepth Root depth
Rs_min Minimum stomatal resistance

Global distribution of vegetation Height, m
Estimated by modelers
0
4
8
12
16
20

0
1
2
3
4
5
6
7
Global distribution of the many-year averaged
leaf area index (LAI)
The International Satellite Land-Surface Climatology
Project (ISLSCP) Initiative II data sets

0
0.2
0.4
0.6
0.8
1
1.2
1.4
Global distribution of the root depth, m
International Satellite Land-Surface Climatology
Project (ISLSCP) Initiative II data sets

Soil parameter data:
Soil texture (IGBP: Global Soil Data Task, 2000)
Clay / Sand / Silt / Organic
Wilting point
Porosity
Saturated hydraulic conductivity
Saturated matric potential
Soil color index (Zeng et al. 2002) satellite data
Visible albedo of soil
Near-infrared albedo

GRDC (Global Runoff Data Center) Estimated Runoff http://www.grdc.sr.unh.edu/html/station.html
Please select a continent
663 gauging stations with
catchment area > 25,000km2
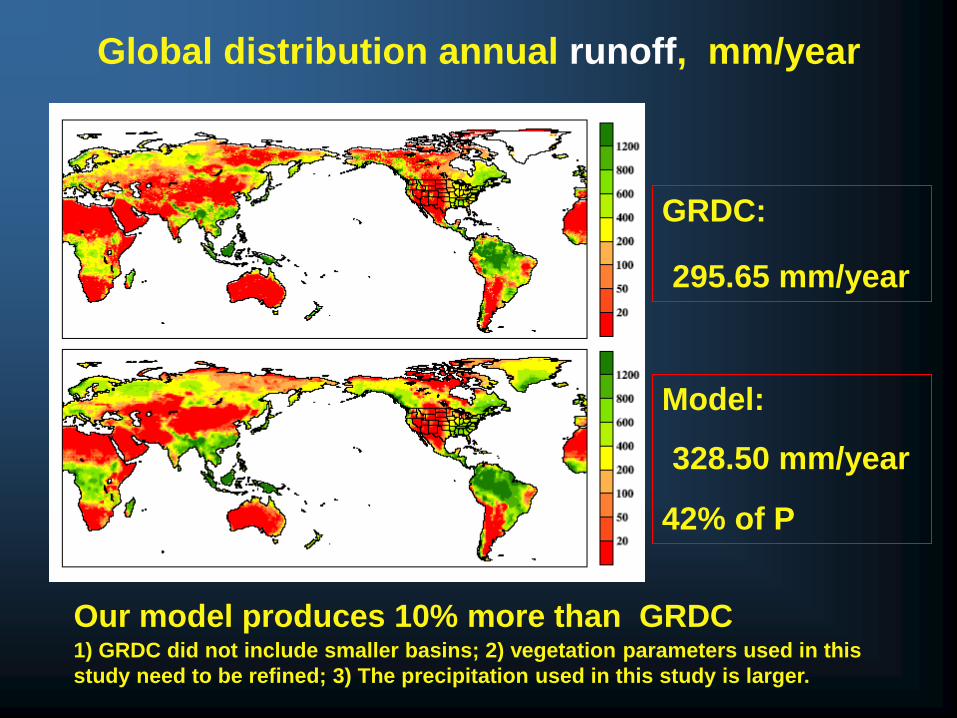
Global distribution annual runoff, mm/year
GRDC:
295.65 mm/year
Model:
328.50 mm/year
42% of P
Our model produces 10% more than GRDC 1) GRDC did not include smaller basins; 2) vegetation parameters used in this
study need to be refined; 3) The precipitation used in this study is larger.

Averaged Annual Global River Discharge (kg/yr)
2.00E+16
2.50E+16
3.00E+16
3.50E+16
4.00E+16
4.50E+16
5.00E+16
5.50E+16
6.00E+16
Bru
cker
, 190
5
Fritsc
he, 1
906
Sch
midt,
1915
Kam
insk
y, 1
925
Che
rubim
, 193
1
Meina
rdus
, 193
4
Halbf
ass, 1
934
Wun
dt, 1
938
Moe
ller,
1951
Reich
el, 1
952
Wus
t, 19
54
Albre
cht,
1960
Wor
ld A
tlas, 1
964
Sellers
, 196
5
Nac
e, 1
968
Kes
sler
, 196
9
Lvov
ich,
196
9
Mat
er, 1
970
Bud
yko,
197
0
Peixo
to &
Ket
tani, 1
973
Bau
mga
rtner
& R
eich
el, 1
975
Jaeg
er, 1
976
Kor
zun,
197
8
NRC, 1
986
Kay
ane,
198
6
Ber
ner a
nd B
erne
r, 19
87
Spied
el &
Agn
ew, 1
988
Brit
annica
, 199
4
UNESCO, 1
999
USGCRP, 2
001
Oki, 1
999
Feket
e et
al., 2
000
Trenb
erth
and
Dai, 2
002
This stud
y
GRDC
Global River Discharge (kg/year)
Our
estimation

Outline
Global water storages and fluxes
Tools for prediction
Precipitation
Evapotranspiration (ET)
Surface water, groundwater, and runoff
Land surface modeling
International water programs
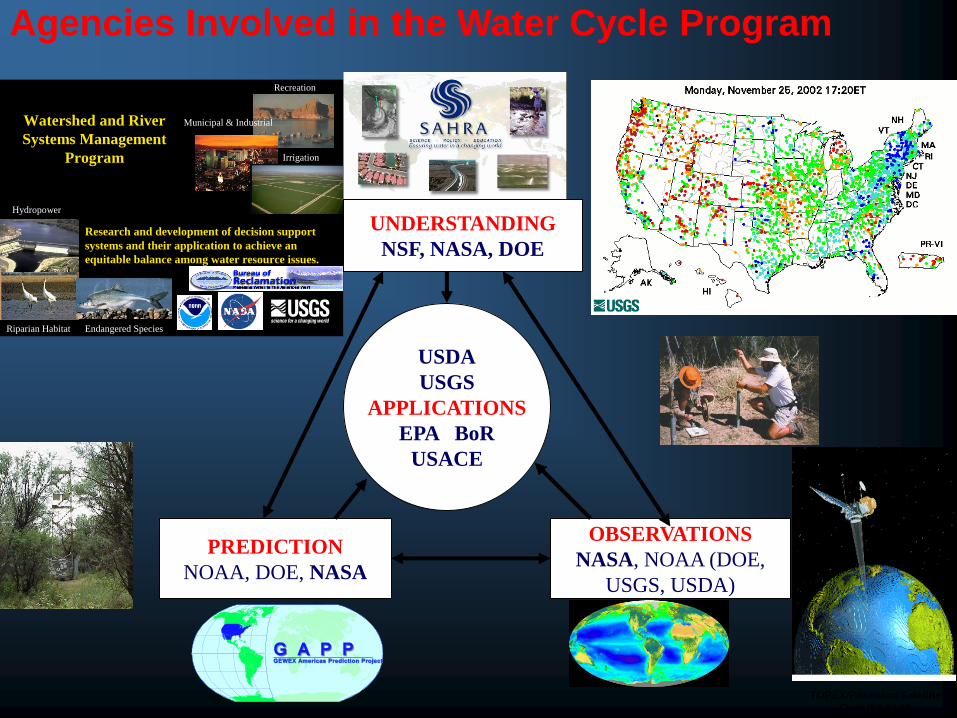
USDA
USGS
APPLICATIONS
EPA BoR
USACE
UNDERSTANDING
NSF, NASA, DOE
PREDICTION
NOAA, DOE, NASA
OBSERVATIONS
NASA, NOAA (DOE,
USGS, USDA)
Agencies Involved in the Water Cycle Program
Watershed and River
Systems Management
Program
Recreation
Municipal & Industrial
Riparian Habitat
Hydropower
Irrigation
Endangered Species
Research and development of decision support
systems and their application to achieve an
equitable balance among water resource issues.
TOPEX/Poseidon Satellite
Over the earth

Terrestrial
Bio/Geo/Chemo
Hydrology
Ocean
Science
Atmosphere
Science
Interdisciplinary Research
Water Research Plans
What are the causes of water cycle variations?
Are variations in the global and regional water cycle predictable?
How are water and nutrient cycles linked?
Interdisciplinary Linkages:
• Aerosols: link to precipitation development, interaction with energy/radiation cycles
• Carbon: link to transpiration and radiation absorption
• Weather and Climate: water and energy are at the heart of weather and climate
physics
• Modeling, Assimilation, and Computing: essential tools for integration and
prediction
• Technology: development of new observation technology
• Applications: consequences of change delivered through water & energy cycle

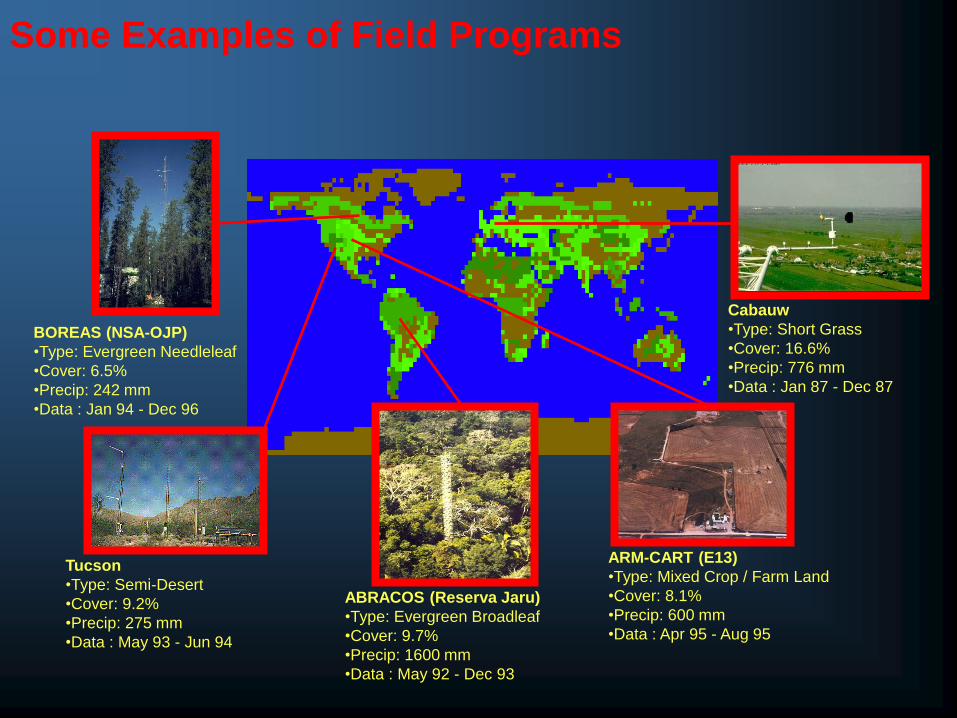
Some Examples of Field Programs
Tucson
•Type: Semi-Desert
•Cover: 9.2%
•Precip: 275 mm
•Data : May 93 - Jun 94
ABRACOS (Reserva Jaru)
•Type: Evergreen Broadleaf
•Cover: 9.7%
•Precip: 1600 mm
•Data : May 92 - Dec 93
ARM-CART (E13)
•Type: Mixed Crop / Farm Land
•Cover: 8.1%
•Precip: 600 mm
•Data : Apr 95 - Aug 95
Cabauw
•Type: Short Grass
•Cover: 16.6%
•Precip: 776 mm
•Data : Jan 87 - Dec 87
BOREAS (NSA-OJP)
•Type: Evergreen Needleleaf
•Cover: 6.5%
•Precip: 242 mm
•Data : Jan 94 - Dec 96
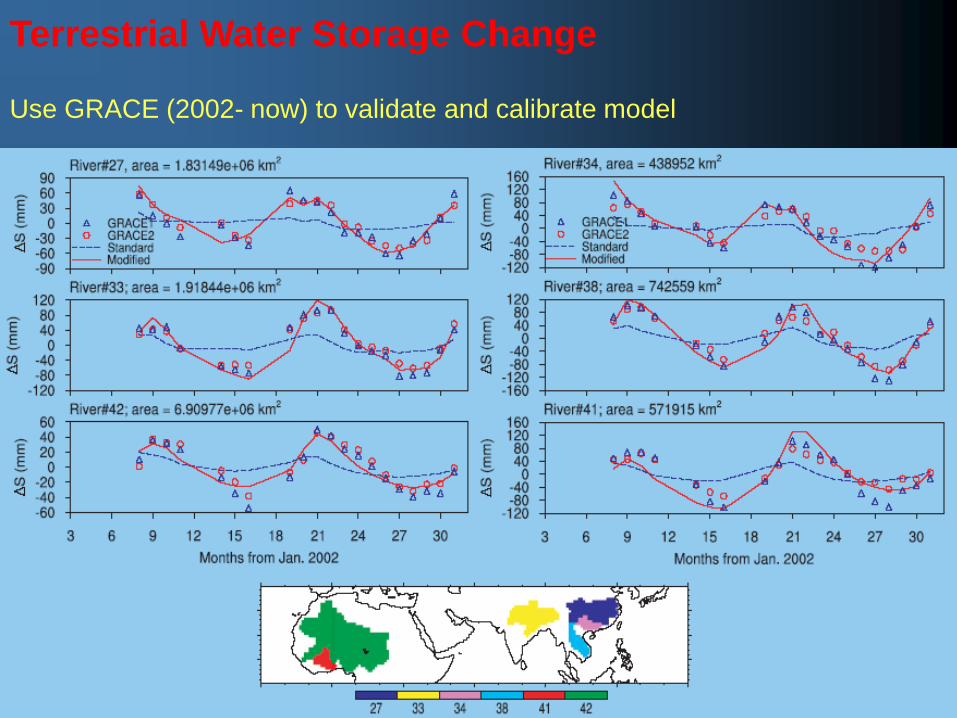
Terrestrial Water Storage Change
Use GRACE (2002- now) to validate and calibrate model
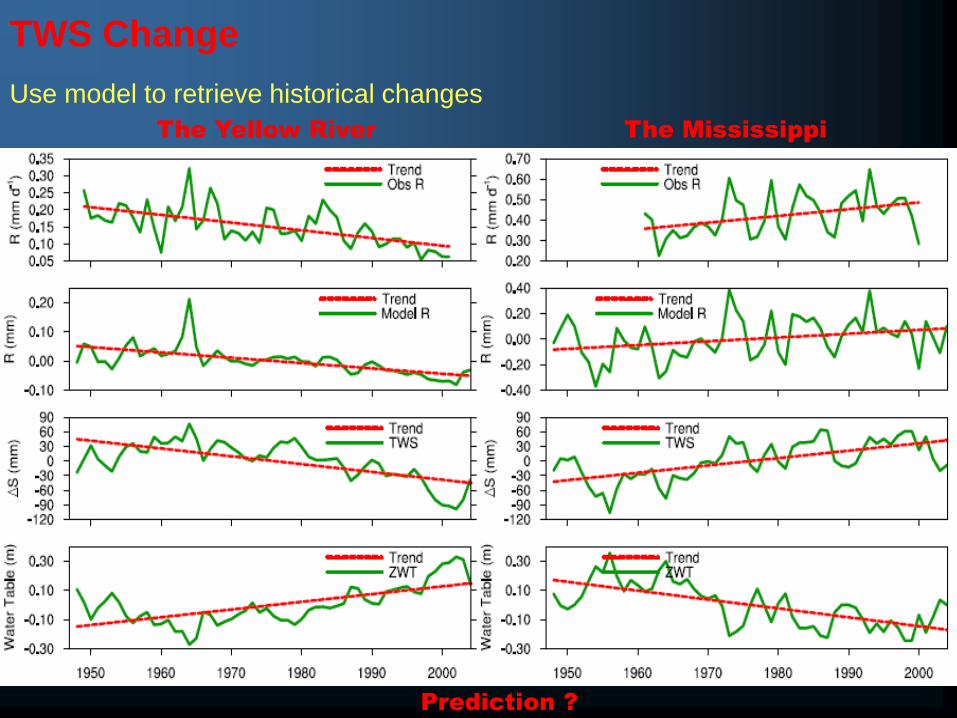
TWS Change
Use model to retrieve historical changes
The Yellow River The Mississippi
Prediction ?

Regional Environmental Model System –
An Integrated Framework for modeling and Assessment
Global Climate Change and
Variability
P
E
Qs
D Ss
D Sg Qg
Ig
Coupled
Ocean-Atmosphere
Models
Hydrologic/Routing
Models
In Situ Data
Regional
Models
Air Quality Models
Land Models
Remotely Sensing
and GIS
Water Resources
Population growth
Agricultural Irrigation
Industrial water use
Land use/land cover
Climate change


![[Hydrology] Research and Development of Remote Sensing Methods](https://img.pdfslide.net/doc/110x75/577cdbf01a28ab9e78a97d52/hydrology-research-and-development-of-remote-sensing-methods.jpg)