Embed Size (px)
Citation preview

INTRODUCTION
Why Scheduling is ImportantScheduling is the process that converts the project work planinto a road map, that if followed, will assure timely projectcompletion. Scheduling is one of the tools used for monitor-ing and controlling projects to ensure the objectives of cost,quality, and time are met. Schedules provide the baselineagainst which progress is measured. Schedules are used toassess time impact of changes to the work scope.
Effective project management involves coordinating activitiessuch as planning, organizing, implementing, and controllingtime and cost. Time control is usually achieved by preparingand using schedules to make the most efficient use of availabletime. Scheduling is an important and integral part of the over-all planning effort, since the scheduling process forces peopleto quantify their effort in discrete terms and to place activitiesin proper relationship to each other. The planning (as dis-cussed in Chapter 12) and scheduling functions are usuallyperformed iteratively in order to accomplish all required taskswithin the specified time frames.
Benefits of SchedulingScheduling provides a basis for management of the work,improves communications, and facilitates coordination.Using a schedule improves the effective use of resources. Theproject schedule gives the user a baseline to monitor and con-trol the work.
Scheduling provides a way of contributing input during proj-ect execution concerning means, methods, techniques,sequences, or other conditions affecting the plan’s outcome.Scheduling provides a means for obtaining feedback sincethe development and use is a team effort incorporating theideas and objectives of those responsible for the work.Schedules are good motivational tools providing intendedwork plans to those having to perform the work and report-ing progress against them.
Schedules provide a baseline for measurement and a meansfor collecting and recording progress. Budgets, costs, andresources can be integrated into project schedule activitiesproviding a basis for measuring cost as well as time per-formance.
Schedules may be used as a basis for payment applicationssupporting work completed. Critical path schedules are usedand relied upon by courts for amending contract completiondates. When projects are faced with significant cost and timeoverruns, schedules are used as analytical tools to supportassessments of labor efficiencies resulting from compressionor extension of time, congested work areas, and disruption toplanned work.
The cost engineer must have an understanding of the impor-tance of using schedules effectively. Knowing only the costand cost estimating functions limits the ability of the costengineer to perform as a true project controls professional.
LEARNING OBJECTIVES
The purpose of this chapter is to provide a basic understand-ing of scheduling for seasoned, as well as new, project staffand other department personnel who rely on timely projectcompletion. The objectives are as follows:
• Become familiar with scheduling terms.• Gain an understanding of scheduling methods and tech-
niques including each one’s benefits and risks.• Become familiar with the most commonly used method
and technique that will meet your project objectives.• Obtain an understanding of work breakdown structures
(WBS) and the dependencies between work tasks toenhance team efficiencies.
• Apply overlapping schedule techniques and calculationsthat reflect real-world management applications.
• Become familiar with managing changes to the schedule.
13.1
AACE INTERNATIONAL SCHEDULING
Chapter 13
Scheduling
Anthony J. Werderitsch, PE CCE

SCHEDULE DEVELOPMENT
Tools for Developing SchedulesComputer software for developing, progressing, and updat-ing schedules is affordable and readily available. Althoughcomputers are the tools, and software provides the means fordeveloping schedules, the individual user must understandwhat the computer is performing.
While numerous scheduling methodologies exist for develop-ing project schedules, two of the most common are bar chartsand critical path. A third method, project evaluation reviewtechnique (PERT), is mostly used by government agencies forcalculating the most likely duration for networks.
Bar Chart (Gantt Chart) MethodThe bar chart, also called a Gantt chart, is primarily meant tocontrol only time elements of a program or project. However,since there are no relationships between the activities, it isnot possible to assess the impact of one activity on anothernor on the time of completion of the project.
When preparing a bar chart, the work effort must be dividedinto components, which are then scheduled against time.Preparing a bar chart involves several steps:
1. Analyze the program or project and specify the basicapproach to be used in its execution.
2. Segment the program or project into a reasonable num-ber of activities that can be scheduled.
3. Estimate the time required to perform each activity.4. Place the activities in time order, considering both
sequential and parallel performance.5. Adjust the diagram until the specified completion date,
if one exists, is satisfied.
Figure 13.1 below depicts a typical bar chart.
The primary advantage of using a bar chart is that it is simpleto read. The plan, schedule, and progress of the program orproject can be depicted graphically on a single chart. Figure13.1 shows the six-activity plan, 15-week schedule, and cur-rent status. The current status shows that Activity B has notstarted and is behind schedule (by 5 weeks), Activity C isslightly ahead of schedule (by 1 week), Activity E is slightlybehind schedule (by 2 weeks), and all other activities are onschedule. However, it cannot be determined if Activity B orActivity E will have an impact on another activity or on theproject completion. This graphical representation of workversus time is easy to read and provides a simple, under-standable way to schedule small undertakings.
Bar charts have not been used successfully for large-scope,one-time-through projects primarily due to the followingreasons:
• The inherent simplicity precludes including sufficientdetail to enable timely detection of schedule slippageson activities of relatively long duration.
• The dependent relationships between activities cannotadequately be shown; thus, it is difficult to determinehow progress delays in individual activities affect proj-ect completion.
• Developing bar charts is essentially a manual, graphical procedure, which makes them difficult to establish andmaintain for large projects; they also tend to becomequickly outdated, thus diminishing their usefulness.
Many large and technically demanding undertakings, suchas developing weapons systems or constructing powerplants, require schedules showing thousands of activitiesthat take place in widely dispersed locations. Manuallydeveloped bar charts cannot adequately display this data,and are thus unsuitable for anything other than a summarydisplay of information. With today’s computer technology, however, if a network
13.2
SCHEDULING AACE INTERNATIONAL
Figure 13.1—Typical Bar Chart.

diagram (as discussed in the following sections) is preparedand the work scheduled, the display of relationships betweenthe activities can be turned off or masked. This masking pro-duces a bar chart, at any level of the project schedule, whichcan be used as a communication tool for the most complexand largest of projects.
Critical Path Method (CPM)The disadvantages of manually developed bar charts, cou-pled with other disadvantages that became evident duringthe mid-1950s, set the stage for development of network-based project management methodology. One of the meth-ods that emerged to overcome these weaknesses was criticalpath scheduling. The critical path method (CPM) is a sched-uling technique using arrow, precedence, or PERT diagram-ming methods to determine the length of a project and toidentify the activities and constraints on the critical path.
The critical path method enables a scheduler to do the fol-lowing:
• Determine the shortest time in which a program or proj-ect can be completed.
• Identify those activities that are critical and that cannotbe slipped or delayed.
• Show the potential slippage or delay (known as float)available for activities that are not critical.
The critical path method (CPM) was designed for, and is use-ful on, projects where the duration of each activity can beestimated with reasonable certainty; it predicts how long anendeavor will take to complete. It also identifies the activitiesthat control the overall length of the project. CPM is widelyused in the process industries, construction, single industrialprojects, prototype development, and for controlling plantoutages and shutdowns.
CPM computer software, known also as project managementsoftware, allows for the assignment of resources to activities.Assigning resources to the activities and allowing theresources to accomplish their assigned work based on theiravailability provides another variable in the overall projectduration. Since the software has this capability, CPM net-working is also used by industries with fixed pools ofresources such as maintenance and information technologyprojects.
Project Evaluation Review Technique (PERT)Project evaluation review technique (PERT) is a probabilistictechnique, used mostly by government agencies, for calculat-ing the “most likely” durations for network activities.
During development of the Navy’s Polaris Missile Programin the late 1950s, the team had no historical basis to drawupon when estimating the length of time it would take toaccomplish certain tasks. For each of the activities, the devel-
opers of PERT estimated a best or shortest time, worst orlongest time, and the most probable time to accomplish thetasks defined. Concurrent with the PERT network develop-ment, the team also developed computer software to run aprobability analysis to arrive at a “most likely” duration foreach activity and the overall project.
PERT is considered an indeterminate process for activity andproject durations, while CPM is considered a deterministicprocess.
The network of activities developed for PERT are similar tothe arrow diagramming method (ADM) and precedence dia-gramming method (PDM) networks. Because of the similari-ty and resemblance of a CPM network to PERT, the termPERT has been used as a synonym for CPM.
Discussion of CPMThe most commonly used scheduling method and the tech-nique that will meet your project objectives is CPM incorpo-rating overlapping logic.
CPM is a scheduling technique using arrow or precedencediagrams (networks) to determine the length of a project andto identify the activities and constraints on the critical path.The critical path is defined as the longest chain or chains ofactivities, in terms of time or duration, through a network.
Two basic methods of critical path scheduling are the following:
• the arrow diagramming method (ADM) (also calledactivity-on-arrow, or the “i” - “j” method), and
• the precedence diagramming method (PDM) (also calledactivity-on-node).
Arrow Diagramming Method (ADM)In arrow diagramming, the nodes in the network are the
13.3
AACE INTERNATIONAL SCHEDULING
GLOSSARY TERMS IN THIS CHAPTER
activity ◆ activity description ◆ activity identificationarrow diagramming method (ADM) ◆ backward passbar chart ◆ calendar days ◆ constraints ◆critical path
critical path method (CPM) ◆ early finish (EF) early start (ES) ◆ forward pass ◆ free float ◆ gantt chart late finish (LF) ◆ late start (LS) ◆ original duration (OD)
overlapping scheduling technique ◆ PERT diagram planning ◆ precedence diagramming method (PDM)
network ◆ milestone ◆ relationships; remaining durationschedule calendar ◆ schedule update ◆ scheduling
scheduling levels ◆ status ◆ target schedule time scaled network ◆ total float
work breakdown structure (WBS) ◆ work days (WD)
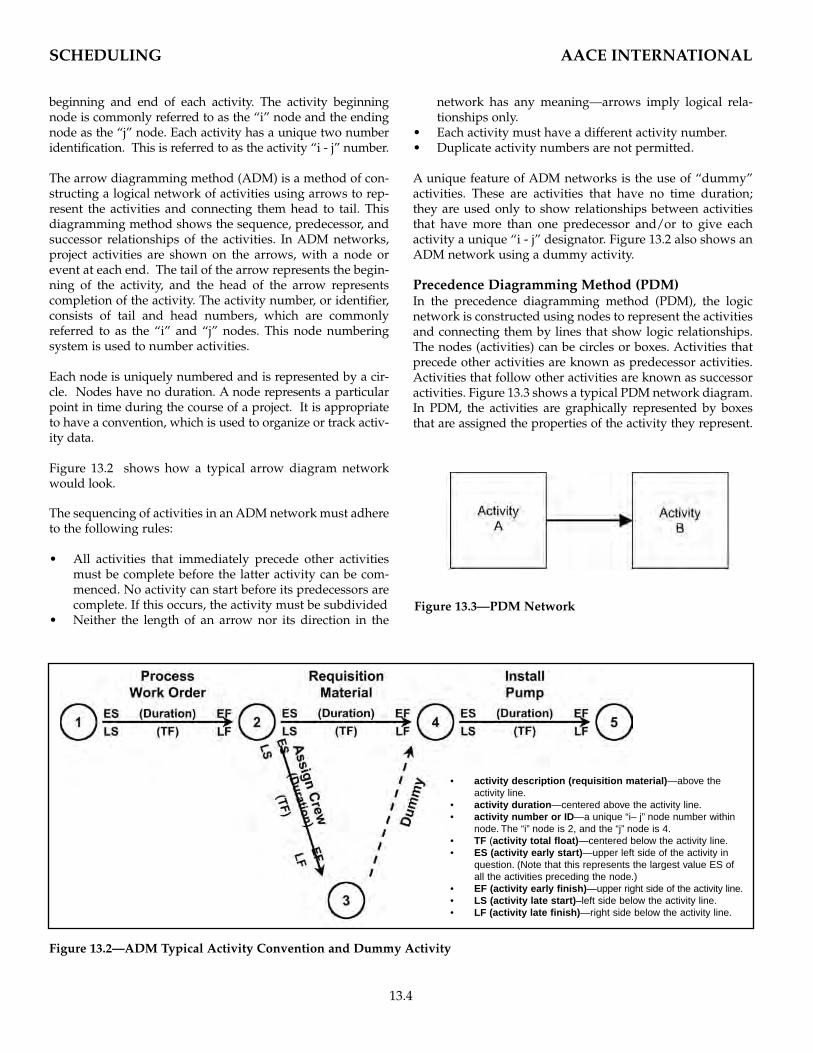
beginning and end of each activity. The activity beginningnode is commonly referred to as the “i” node and the endingnode as the “j” node. Each activity has a unique two numberidentification. This is referred to as the activity “i - j” number.
The arrow diagramming method (ADM) is a method of con-structing a logical network of activities using arrows to rep-resent the activities and connecting them head to tail. Thisdiagramming method shows the sequence, predecessor, andsuccessor relationships of the activities. In ADM networks,project activities are shown on the arrows, with a node orevent at each end. The tail of the arrow represents the begin-ning of the activity, and the head of the arrow representscompletion of the activity. The activity number, or identifier,consists of tail and head numbers, which are commonlyreferred to as the “i” and “j” nodes. This node numberingsystem is used to number activities.
Each node is uniquely numbered and is represented by a cir-cle. Nodes have no duration. A node represents a particularpoint in time during the course of a project. It is appropriateto have a convention, which is used to organize or track activ-ity data.
Figure 13.2 shows how a typical arrow diagram networkwould look.
The sequencing of activities in an ADM network must adhereto the following rules:
• All activities that immediately precede other activitiesmust be complete before the latter activity can be com-menced. No activity can start before its predecessors arecomplete. If this occurs, the activity must be subdivided
• Neither the length of an arrow nor its direction in the
network has any meaning—arrows imply logical rela-tionships only.
• Each activity must have a different activity number.• Duplicate activity numbers are not permitted.
A unique feature of ADM networks is the use of “dummy”activities. These are activities that have no time duration;they are used only to show relationships between activitiesthat have more than one predecessor and/or to give eachactivity a unique “i - j” designator. Figure 13.2 also shows anADM network using a dummy activity.
Precedence Diagramming Method (PDM)In the precedence diagramming method (PDM), the logicnetwork is constructed using nodes to represent the activitiesand connecting them by lines that show logic relationships.The nodes (activities) can be circles or boxes. Activities thatprecede other activities are known as predecessor activities.Activities that follow other activities are known as successoractivities. Figure 13.3 shows a typical PDM network diagram.In PDM, the activities are graphically represented by boxesthat are assigned the properties of the activity they represent.
13.4
SCHEDULING AACE INTERNATIONAL
Figure 13.2—ADM Typical Activity Convention and Dummy Activity
Figure 13.3—PDM Network
• activity description (requisition material)—above theactivity line.
• activity duration—centered above the activity line.• activity number or ID—a unique “i– j” node number within
node. The “i” node is 2, and the “j” node is 4.• TF (activity total float)—centered below the activity line.• ES (activity early start)—upper left side of the activity in
question. (Note that this represents the largest value ES ofall the activities preceding the node.)
• EF (activity early finish)—upper right side of the activity line.• LS (activity late start)–left side below the activity line.• LF (activity late finish)—right side below the activity line.

The lines in the network represent the interrelationshipsbetween activities. These relationships are referred to as links,or constraints. Arrows are not needed; however, arrows aremore descriptive than lines.
The nodes are sketched large enough to include certain infor-mation about the activity. This practice follows a conventionso that others may easily understand the network.
It is common to show the following information for an activ-ity within the PDM node:
• activity description.• activity ID—a unique activity number for identification
and computer usage.• activity duration—number of work days required to
accomplish the activity. Figure 13.4 refers to the OD,original duration.
• activity schedule dates—typically both early and latedates are shown.
• ES (early start)—earliest point in time that an activitycan start based on the network relationships.
• EF (early finish)—earliest point in time that an activitycan finish based on the network relationships.
• LS (late start)—latest point in time that an activity muststart in order to avoid delaying the project’s completion.
• LF (late finish)—latest point in time that an activitymust finish in order to avoid delaying the project’s com-pletion.
• activity float values—typically total float (TF) is shownas in Figure 13.4. Total float is the amount of time that thecompletion of an activity can be delayed without delay-ing the project’s completion. Total float is equal to thelate finish minus the early finish or the late start minusthe early start of the activity.
Optional data that may be depicted within the node includeresource requirements, codes, and percent complete.
The development of the network involves the identificationof the project activities and the relationship between these
activities. It is recommended that an activity list be initiallydeveloped which identifies the intended relationships. Theactivity list serves as the tool to be used in the developmentof the network. Table 13.1 is a typical activity list identifyingthe project activities and the relationships between theseactivities. It is common to modify or expand upon this list asthe network is developed.
Development of a precedence network diagram represents agraphical depiction of the work plan. The network shown in
Figure 13.5 is based on finish to start (FS) relationships.
The successor cannot start until the predecessor is finished.For example, there are five activities, ASTART, AFINISH, B, C,and D. Activity ASTART is the first activity and can start any-time, Activity ASTART must be finished before ActivityAFINISH and Activity B can start. Activity C cannot start untilActivity AFINISH is complete. Activity D cannot start untilActivity B and Activity C are finished. Figure 13.6 representsthe network of this work plan.
The benefit of using the PDM for networking and schedul-ing is the ease of applying overlapping techniques to theactivity relationships.
13.5
AACE INTERNATIONAL SCHEDULING
Figure 13.4—Typical Precedence Diagram Activity
Table 13.1—Precedence Network Activity List
Figure 13.5—Precedence Network Diagram

Overlapping Networks TechniquesThe use of overlapping network techniques is common inPDM applications. Overlapping network techniques allowactivities to be grouped together, which reduces the numberof activities in a network and can reduce the overall time ofperformance.
The overlapping scheduling technique allows for the develop-ment of a schedule, which more closely represents how a plan-ner visualizes actual field conditions. For example, rather thanwait for an activity to complete before starting the succeedingactivity, it can be said that a successor activity can start a num-ber of days after the start of its predecessor, or that it can finisha number of days after the finish of its predecessor.
Overlapping consists of two parts: a relationship and a lagvalue or constraint. Four types of overlapping relationshipsexist:
1. finish-to-start + lag (FS + N) Where “N” is lag,2. finish-to-finish + lag (FF + N),3. start-to-start + lag (SS +N), and 4. start-to-finish + lag (SF + N).
In each case, a number of days (work periods) “N” are indi-cated that define the overlapped time frame, or the lead-time,between the activities in question. Lags can be either positiveor negative, but are assumed to be zero if not specified.
A finish-to-start + lag (FS + N) links the finish of the precedingactivity with the start of the succeeding activity and indicatesthat the successor activity cannot begin until the precedingactivity is complete. A lag “N” can be placed on the relationshipto indicate that the succeeding activity cannot begin until agiven time after the preceding activity has finished. A finish-to-start relationship with a lag value of zero is considered thedefault if no other value is specified. For example, in Figure
13.6, Activity 20 cannot start until “N” work periods afterActivity 10 is complete.Typical applications include cure time between the place-ment of concrete and the stripping of formwork, queuing
time between a request for action and when the action takesplace, and time for the approval process after a report hasbeen submitted and the action is taken following approval.The alternate approach to this problem would be to includean activity in the network called “concrete cure,” “reviewrequest,” or “review and approval,” and assign the addedactivity a duration of “N” days.
A start-to-start + lag (SS+N) relationship links the start of thepreceding activity with the start of the following or succeed-ing activity. It indicates that the successor activity cannotbegin until the preceding activity has been started and thespecified work periods (lag) or overlap time after the start ofthe preceding activity has elapsed. For example, in Figure
13.7, Activity 20 cannot start until “N” work periods after thestart of activity 10.
Typical applications include the relationship between thepulling wire and cable and wire terminations, or starting thereport preparation before all the research information has beencompleted. These relationships assume that if the work canbegin before the preceding activities are complete, an SS + Nrelationship between them can be utilized. The schedule com-putations will indicate that the start of the succeeding activitiescan begin “N” days after the preceding activity has started.The alternate approach to this problem would be to includeadditional activities in the network to show the start and fin-ish of both the predecessor and successor activities.
A finish-to-finish + lag (FF + N) relationship links the finishof the preceding activity with the finish of the following orsucceeding activity and indicates that the latter activity can-not be completed until the preceding activity has been com-pleted and the specified work periods (lag) or overlap timehas elapsed. For example, in Figure 13.8, Activity 20 cannotfinish until “N” work periods after Activity 10 is finished.
Typical finish-to-finish applications include the relationshipbetween the finish of wire terminations and the finish of testequipment, or between finish of research information andfinishing the report preparation. These relationships assumethat if the successor work can finish “N” work periods afterthe finish of the preceding activities, an FF + N relationship
13.6
SCHEDULING AACE INTERNATIONAL
Figure 13.6—Finish to Start + Lag Relationship
Figure 13.7—Start-to-Start + Lag Relationship.

between them can be utilized. The schedule computations willindicate that the finish of the succeeding activities requires “N”days after the finish of the preceding activity. The alternateapproach to this problem would be to include additional activ-ities in the network to show the start and finish of both thepredecessor and successor activities.
A start-to-finish + lag (SF + N) relationship links the start ofthe preceding activity with the finish of the following or suc-ceeding activity and indicates that the successor activity cannotfinish until the preceding activity has started and the specifiedwork periods (lag) or overlap time has elapsed. For example, inFigure 13.9, Activity 20 cannot finish until “N” work periodsafter Activity 10 is started. This relationship is seldom usedbecause of inherent problems associated with the start of thesuccessor activity and the finish of the predecessor activity.Generally, computer software will not allow this relationship.
The development of an overlapping network involves the
same efforts as discussed previously for precedence net-works. The difference is that during the development of theactivity list, overlapping relationships and lead time periods,where applicable, are shown.
The activity list that illustrates overlapping is shown in Table13.2. It is similar to the network previously used. The differ-ences are that certain activities have been combined and over-lapped and overlapping relationships are included. Note thatwhere no overlapping relationship exists, a FS relationshipwith a lag of zero is assumed.
Figure 13.10 demonstrates that by using overlapping network
techniques, we can combine the two activities “ASTART” and“AFINISH” into one Activity “A” and show a relationship thatActivity “B” can start 10 days after the start of Activity “A”.Other changes to the network include that Activity “D” canfinish 3 days after the finish of Activity “C”.
Figure 13.10—Overlapping Network
Overlapping network techniques, in turn, reduce the numberof schedule computations required.
WORK BREAKDOWN STRUCTURE
The most effective tool to use in ensuring that all work scopeis planned is the work breakdown structure (WBS). The WBSis a valuable management tool for planning, organizing,implementing, and controlling projects. The WBS is a treestructure of successively further breakdowns of work scopeinto component parts for planning, assigning responsibility,managing, controlling, and reporting project progress. Thetop of the tree represents the whole. Subsequent levels repre-sent divisions of the whole on a level by level basis until thesmallest element desired is defined.
Defining Work Breakdown StructureThe best approach to developing a WBS (Figure 13.11 on page13.8) is to first choose the desired hierarchy (process, organiza-tion, or product) and represent the entire project by a specific“project” block. The next step is to branch out beneath the
“project” block into several levels and components, which are
13.7
AACE INTERNATIONAL SCHEDULING
Figure 13.8—Finish-to-Finish + Lag Relationship.
Figure 13.9—Start-to-Finish + Lag Relationship
Table 13.2—Overlapping Network Activity List

equivalent to the “project” block when combined.
For example, structure and services define the second level ofthe process hierarchy for the project. All project process infor-mation can be further defined by these two classifications. Forprototype development, other systems classifications mayinclude research and manufacturing.
WBS techniques are valuable tools because they allow projectdetails to be summarized into different groupings for analysisand control purposes.
It is not necessary that all WBS have the same number of lev-els. For example, the sample breakdown has five levels and aproduct based WBS may have four levels.
Coding TechniquesMost computer software provides a function for WBS codingthat is based on the previously discussed hierarchical structure.
The fundamental element of any WBS is the detailed workactivity. What enables the WBS technique to function is prop-er coding of detailed work activities. Activity definition andcoding is best accomplished by numbering from the highestlevel of each WBS to the lowest level.
The project process-based WBS (Figure 13.11) is used for illus-tration purposes to demonstrate the method of developing aWBS and its coding structure in detail from top to bottom. Asstated previously, the Level II breakdown (structure, and
services) is completely representative of the Level I total proj-ect process activity. For illustration purposes, the structurecomponent of the project process is selected for further hier-archy definition, and the line through structure is darkenedto show the breakdown process.
Figure 13.11 shows that the Level II structure component isfurther defined by Level III. The Level III components aresubstructure and superstructure.
This technique of WBS development is very important.Without utilizing it, the development process usually getsunnecessarily bogged down with efforts to achieve perfec-tion before proceeding to subsequent levels.
The Level III substructure component is further defined byLevel IV, consisting of specific processes related to the sub-structure. One of those, concrete, is selected for further defi-nition of the structure process.
In Level IV, concrete is further defined by three Level V com-ponents: Foundations, Foundation Walls Area A, andFoundation Walls Area B.
Once the levels and their components have been defined, it isbest to begin numbering them. Count the number of levelsand establish a code scheme with an equal number of digits.For example, there are five levels to the process WBS, and,consequently, a five-digit number is used. The number 20000is the highest level for the process WBS. Working downwardand across in the WBS, the Level II components are num-
13.8
SCHEDULING AACE INTERNATIONAL
Figure 13.11—Process WBS

bered 21000 and 22000. Summarizing on WBS 2, where thefirst digit is equal to 2, provides the total project processinformation.The lowest level of any WBS of the project constitutes thedetailed work activities. Higher levels constitute summariesof the detailed activities.
Activity CodingTable 13.3 illustrates a listing of detailed schedule activities.Included in Table 13.3 is the process WBS coding. The codefor each WBS can be input into one of many activity codefields when using computer-based project management sys-tems. It is necessary that every activity have a uniquealphanumeric identifier. It is generally better to use theprocess-based WBS since it is usually the most detailed WBS.
The WBS for any particular project is usually prepared by proj-ect control personnel. However, project control personnel donot perform the actual work. Consequently, it is imperativethat project control personnel and the project personnel whoactually do the work reach an agreement concerning the WBS.
In addition to the previous construction example, Figure13.12 is provided to display a nonconstruction WBS example.
SCHEDULING TECHNIQUES
Making Time CalculationsOnce a network has been created and the duration of eachactivity has been established, both the total time required toreach project completion and the individual start and finishtimes for each activity can be calculated. The four time valuesas associated with each activity are Early Start (ES), EarlyFinish (EF), Late Start (LS), and Late Finish (LF).
The computations required to calculate the above timesinvolve simple addition and subtraction. Manual computa-tion is easy and logical, but it can become tedious and timeconsuming when done for large networks.
Forward and Backward PassThe forward pass through the network determines eachactivity’s ES and EF and the project’s duration or the earliestdate a project can finish. The backward pass through the net-work determines each activity’s LS and LF. The calculationsassume that activities begin on the morning of the scheduledstart date and end in the evening of the scheduled finish dateand that an event or milestone occurs on the evening of theday its last predecessor finished.
Before starting the network calculation, the precedence net-work list of activities is revisited to include the activity dura-tion as shown in Table 13.4. The activity duration is the
13.9
AACE INTERNATIONAL SCHEDULING
Table 13.3—Detailed Activity List with WBS Coding
Figure 13.12—Nonconstruction WBS

length of time from start to finish of an activity, estimated oractual, generally quantified in working day or calendar day
time units. Activity duration estimates are developed fromhistorical experience or estimated time to perform the work.
The durations are assigned to the activities as shown in Figure13.13. In the forward pass, the earliest start and finish times foreach activity are calculated, observing the following rules:
• Day 1 is the earliest start date for Activity 100. • The ES of Activity 100 (ASTART) is equal to 1. • The EF of the activity is equal to the ES of that activity
plus the duration minus 1.• The ES of any succeeding activity is the EF of the prede-
cessor activity plus 1.• The ES of an activity is equal to the largest of the EF
times of the activities merging to the activity in questionplus 1.
The early finish date for Activity ASTART is day 10 (ESASTART
+ D -1). Day 11 is the early start date for Activities B andAFINISH.
The early start for Activity D is day 36 since Activity D’s earlystart is controlled by the largest early finish date of all prede-cessors (B and C), which is Activity C.
The total project duration is forty-five days.
If the total project duration exceeds the available time, plan-ners must reevaluate their work and take whatever action isneeded to meet time objectives: perhaps optional activitiescan be dropped and others can be shortened by applyingmore resources or other schedule compression techniques.
In the backward pass, the latest allowable start and finish timesfor each activity are calculated, observing the following rules:
• The LF of the terminal activity in the network is eitherassigned as being equal to its EF or assigned the valueestablished by the contract documents.
• The LS of an activity is its LF minus its duration plus 1.• The LF for all other activities is equal to the numerically
smallest LS of succeeding activities minus one day.
Where two or more activities burst from or leave an activ-ity, the numerically smallest LS of the successor activitiesminus one day is the LF of the activity in question.
Figure 13.14 depicts the results of the backward pass throughthe network. Note that Activity ASTART’s late start is con-trolled by Activity AFINISH’s late finish.
Work Days and Calendar DaysThe calculated dates are shown in consecutive calendar days.This calculation is used for all examples. However, it must beunderstood that most projects are worked on a five-dayworkweek with weekends and certain recognized holidaysnot worked. These nonworking days must be accounted forin the total project duration. Most contracts that stipulatecontract time do so in total calendar days including weekendand holidays.
13.10
SCHEDULING AACE INTERNATIONAL
Figure 13.14—Backward Pass Precedence Network FSRelationships
Figure 13.13—Forward-Pass Network FS Relationships
ESASTART = 1
EFA = ESA + DA - 1
ESSUC = EFPRED + 1
In finish to start relationships, the early startof an activity is equal to the largest of the earlyfinish times of the activities merging to theactivity in question plus 1.
Table 13.4—Precedence Network Activity List withDurations

Computerized scheduling applications allow for setting cal-endars and automatically accounting for weekends and holi-days. Also, the dates provided by computerized schedulesmay, by choice, be in calendar days or dates.
Forward and Backward Passes for OverlappingRelationshipsThe forward and backward passes for the OverlappingRelationships are shown in Figures 13.15 and 13.16 respec-tively. The rules discussed earlier are shown with each figure.
In Figure 13.15, the total project duration is forty days, fivedays shorter than Figure 13.16.
From Figure 13.13, Activity ASTART and AFINISH were com-bined into Activity A. To account for the overlapped time, therelationship between Activity A and Activity B was changedto SS+10. The FS relationship between Activity A andActivity C remained unchanged. These changes result in thesame EF for Activities B and C in Figure 13.15 as in Figure13.13.
Changing the relationship between Activity C and Activity Dfrom FS to FF + 3 allows Activity B to control the finish ofActivity D, which results in a savings of 5 days.Note Activity A’s late start and late finish dates are controlledby the late start of Activity B.
FloatFree float is defined as the amount of time that the comple-tion of an activity can be delayed without delaying any otherfollowing or succeeding activity.
Free float is equal to the difference between an activity’s EFand the ES of the following or succeeding activity minus 1. Inthe event that two or more activities succeed or follow anactivity, the succeeding activity with the smallest ES is usedto determine the activity free float amount. The free float ofan activity is equal to the smallest value between the activityin question and all succeeding activities minus 1.
Free float belongs solely to the activity. Due to the nature ofthe computations, free float is reserved for only the last activ-ity in a chain of activities. Custom or preference may dictatewhether free float is shown on the network or included incomputerized reports.
Total float (TF) is defined as the amount of time that the com-pletion of an activity can be delayed without delaying thecompletion of the project’s terminal activity.
Total float is equal to the difference between the activity’s LFand EF, or the difference between the activity’s LS and ES.
Total float is shared by the activities in a chain. For this rea-son, it is a better indicator of the float time an activity pos-sesses. It is cautioned, however, that TF is shared. If a chainof activities possess 15 days of TF and there are four activitiesin the chain, each activity does not possess 15 days of TFindependent of the other activities in the chain. If the firstactivity in the chain uses all 15 days, the TF along the chainis reduced to zero. Any further delays to any activities in thischain will result in a delay to the project’s completion.
Figures 13.17 and 13.18 on page 13.12 depict the networkswith the TF values shown.
Critical PathTotal float defines the critical path of the project. The criticalpath is defined as the longest chain or chains of activities, interms of time or duration, through a network. It is the chainor chains of activities through a network with the smallesttotal float value. If the network is continuous, there will be atleast one continuous chain through the network. A discontin-uous network is one where an imposed activity time con-straint has disrupted the chain of activity date calculations.
Figures 13.17 and 13.18 also depict the networks with the crit-
13.11
AACE INTERNATIONAL SCHEDULING
Figure 13.16—Backward-Pass Overlapping TechniqueRelationships
Figure 13.15—Forward-Pass Overlapping TechniqueRelationships

SCHEDULING AACE INTERNATIONAL
13.12
ical path identified. It is shown as the heavier lined path.
The late finish for Activity A is controlled by the late start ofActivity A. The late start of Activity A is critical and con-trolled by the critical path coming from Activity B. ActivityA’s late start is LSA = LSB†– SS: (LSA = 11 - 10. LSA = 1.)LFA = LSA + D - 1.
ConstraintsThe start and finish of certain activities, at times, must be con-strained in order to represent what will actually occur. Forexample, based on network logic, the installation of a pump isscheduled to begin on September 17, but the actual pumpdelivery from the vendor is not scheduled until October 23.Therefore, the installation of the pump is constrained by thedelivery of the pump.
There are six major types of constraints:
1. start-on,2. start-no-earlier than,3. start-no-later than,4. finish-on,5. finish-no-earlier-than, and
6. finish-no-later-than.
Each of the above constraints affects the schedule differently.“No-earlier-than” (NET) constraints affect only the forwardpass calculation in the network. “No-later-than” (NLT) affectsonly the backward pass calculation. “On” is a combination ofNET and NLT and affects both the forward and backward pass.
A constraint may or may not be upheld, depending on net-work logic. For example, a “Start NET April 7” constraintwill control the network calculations if the early start time isbefore April 7. If, however, the network logic produces anearly start time on or after April 7, the network logic will beobserved and the constraint will be ignored.
Similarly, if the constraint is “Start NLT April 7” and networklogic dictates a late start on or before April 7, the networklogic again will control and again the constraint will beignored. If the network logic produces a late start date afterApril 7, then the constraint will be observed, and the activitywill be scheduled to have a late start date of April 7.
SCHEDULING LEVELS AND REPORTING
Scheduling Levels are schedules used by various manage-ment echelons to manage the project. Senior managementmay require a very summary level referred to as a milestoneschedule. Project management and key department interfacemay only require a summary level of the project activitieswhile hands-on managers require detailed project schedulesand short-interval schedules for day-to-day management.Each level is an integral subdivision of the previous level andpresents more detailed activities and relationships.
Level 1–Milestone Level ScheduleLevel 1 schedules comprise key events or major milestonesselected as a result of coordination between the client’s and thecontractor’s management. These events are generally criticalaccomplishments planned at time intervals throughout theproject and used as a basis to monitor overall project perform-ance. The format may be a list, summary network, or bar chartand may contain minimal detail at a highly summarized level. Significant events may include begin program definition,preliminary design complete, purchase major equipment,mobilization, foundations complete, delivery of major equip-ment components, installation complete. Company manage-ment is usually apprised of the project’s implementationprogress with milestone level schedules.
Level 2—Project Summary Level ScheduleLevel 2 schedules are composed of summary project activi-ties depicting critical work and other management selectedactivities generally indicating the activities’ ES and EF dates.Key restraints and relationships between activities are identi-fied and defined. This level of planning is represented by
Figure 13.17—Precedence Network FS RelationshipsTotal Float and Critical Path Shown
Figure 13.18—Overlapping Technique RelationshipsTotal Float and Critical Path Shown

AACE INTERNATIONAL SCHEDULING
13.13
level 2 schedules and provides an integral plan of the projectactivities for project management. Milestone schedule datesare compared to those derived from the project summaryschedule. Upon review (making adjustments, if necessary)and acceptance, the dates from the project summary are usedfor the milestone schedule.
When using a network-based schedule, the detailed activitiescan be rolled up to a summary level and milestone levelschedule. As the detailed schedule is developed, it must besummarized to replace the independently developed projectsummary and milestone schedules. Typical summary level activities include engineering anddesign, procurement, major equipment fabrication and deliv-ery, major structures, installation, start-up, and commissioning.
Figure 13.19 shows both a level 1 and 2 schedule.
Level 3—Project Detailed ScheduleLevel 3 schedules (Figure 13.20) display the lowest level ofdetail necessary to control the project through job comple-tion. The intent of this schedule is to finalize remainingrequirements for the total project. Detailed scheduling iden-tifies and defines activities that are more detailed than the
project summary level. For example, an activity in the proj-ect summary level, such as structural steel engineering anddesign, would be represented by more meaningful detailedactivities of shorter durations such as: define and collectloads, perform analysis, prepare drawings and specifications,and issue documents for procurement. This level of planningalso provides better networking capabilities. This level 3schedule supports the planning effort for determining andassigning resources.
Level 4—Short-Interval ScheduleA Level 4 schedule is a two-to-six week look-ahead schedulethat shows resource assigned, detailed, and work activities,and is used for planning and progress reporting purposes,review and assignment of current week work plans, andadvance planning for near-term future week work (Figure13.21). This level is sometimes referred to as short-cycleschedule since the process for its use is a weekly cycle of col-lecting progress, working the current week, and planningfuture work assignments.
Short-interval Level 4 schedules are derived from thedetailed Level 3 schedule network. These schedules are usu-ally bar charts as they are best used for communicating infor-
Figure 13.19—Level 1 and Level 2 Schedule

SCHEDULING AACE INTERNATIONAL
13.14
mation and are developed by masking the relationships. It isone of the best tools for conveying the planning requirementsto those performing the work. Schedule ReportingThe following discussion of reports is provided to familiarizeplanners and schedulers with selected types of computerizedreport products. These are basic reports. There are numerousother reports of interest to planners, supervisors, and projectmanagers. Schedules comprised of hundreds or thousands ofactivities can be made manageable and meaningful.Schedules can be selected for each party involved in the proj-ect to minimize the number of pages for review that mayseem to be overwhelming.
Early Start Dates Report: A listing of activities sorted byearly start dates. This listing provides the scheduler andmanagement with the activities that are scheduled to start byascending dates. Short interval planning uses these lists toprepare for current period and future look-ahead periods.The same report for the overlapping activity schedule identi-fies the lead time relationships.
Total Float Report: The activities are sorted by total float inascending value beginning with values of TF = 0. The reportfirst lists all activities that are on the critical path (TF = 0), andthen lists all other activities grouped by total float values.
Precedence Report: This is a listing by activity early start dates.However, the significance is the identification of all predecessorand successor activities for each activity. This report is used byplanners for debugging schedules and comparing relationshipson the network diagrams to those in the schedule reports.
Schedule PlotsLogic Diagrams: These have been used in the sample problems.
Time-scaled Logic Diagram: This type of plot shows activityrelationships and displays the activities in their scheduledplace in time. (See Figure 13.20)
Early Start Date Schedule: Bar Chart: Bar charts withoutlogic relationships shown. These types of charts are usedmore frequently by supervision and management to trackwork. An example of this is the six week look ahead in
Figure 13.20—Level 3 Schedule
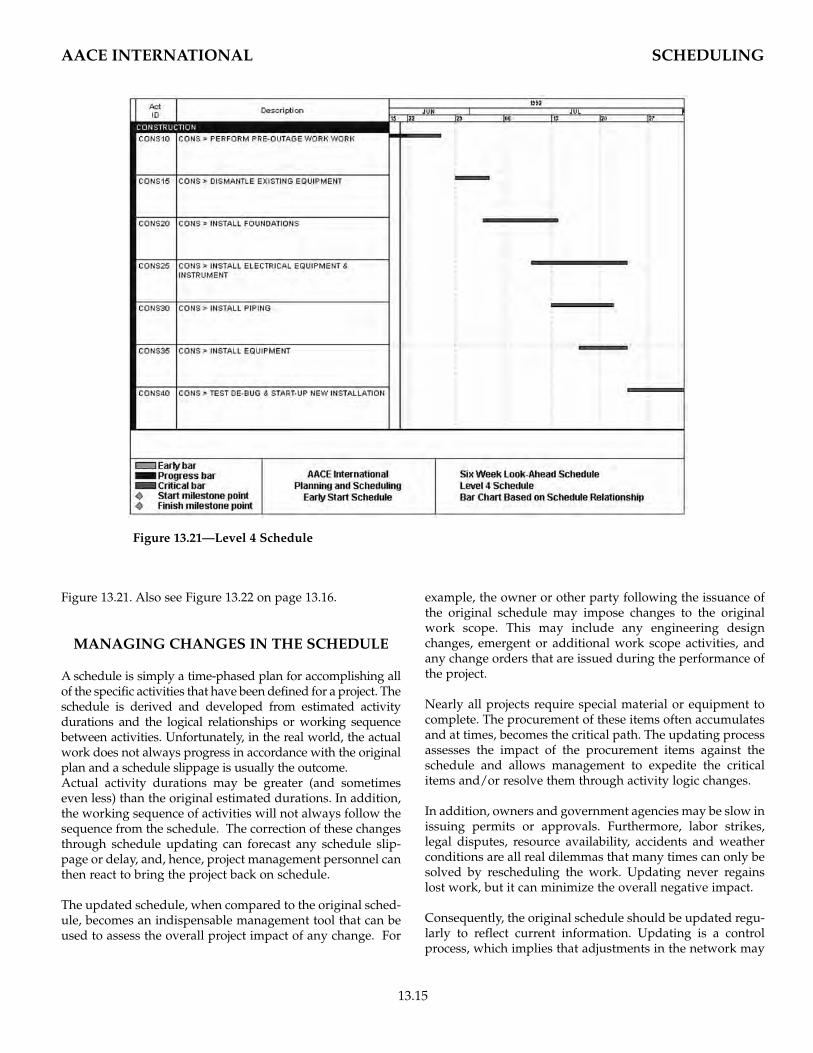
Figure 13.21. Also see Figure 13.22 on page 13.16.
MANAGING CHANGES IN THE SCHEDULE
A schedule is simply a time-phased plan for accomplishing allof the specific activities that have been defined for a project. Theschedule is derived and developed from estimated activitydurations and the logical relationships or working sequencebetween activities. Unfortunately, in the real world, the actualwork does not always progress in accordance with the originalplan and a schedule slippage is usually the outcome. Actual activity durations may be greater (and sometimeseven less) than the original estimated durations. In addition,the working sequence of activities will not always follow thesequence from the schedule. The correction of these changesthrough schedule updating can forecast any schedule slip-page or delay, and, hence, project management personnel canthen react to bring the project back on schedule.
The updated schedule, when compared to the original sched-ule, becomes an indispensable management tool that can beused to assess the overall project impact of any change. For
example, the owner or other party following the issuance ofthe original schedule may impose changes to the originalwork scope. This may include any engineering designchanges, emergent or additional work scope activities, andany change orders that are issued during the performance ofthe project.
Nearly all projects require special material or equipment tocomplete. The procurement of these items often accumulatesand at times, becomes the critical path. The updating processassesses the impact of the procurement items against theschedule and allows management to expedite the criticalitems and/or resolve them through activity logic changes.
In addition, owners and government agencies may be slow inissuing permits or approvals. Furthermore, labor strikes,legal disputes, resource availability, accidents and weatherconditions are all real dilemmas that many times can only besolved by rescheduling the work. Updating never regainslost work, but it can minimize the overall negative impact.
Consequently, the original schedule should be updated regu-larly to reflect current information. Updating is a controlprocess, which implies that adjustments in the network may
13.15
AACE INTERNATIONAL SCHEDULING
Figure 13.21—Level 4 Schedule
be necessary and forewarns of potential revisions of majorconsequences.
Reasons for UpdatingThere are four major reasons a schedule should be updatedregularly:
1. to reflect current project status,2. to keep the schedule as an effective management tool,3. to document performance4. Documentation to plan for changes and support delay
analysis
The contractor and owner need to be aware of the current sta-tus throughout the project duration. Contractors are con-cerned with status of their submittals, delivery of equipmentand materials, resource availability, coordination and per-formance of subcontractors, and timely payment for progresscompleted. Owners are concerned with the status of workincluding quality and whether the contractor’s progress isadequate to meet “turnovers” and completion dates. Bothparties need to be aware of changes or delays as they occurand how they affect the project completion date. This willminimize any “surprises” and allow the parties to take nec-essary actions to get the project back on schedule.
An updated schedule is a tool that provides the project’s sta-tus at a given time and is used to assess the performance of
the owner, designer, and contractor to meet schedule com-mitments. It provides a record of the accomplishments as totimeliness and completeness. Changes to the work scope ormethods of performance need to be included in the scheduleupdates. This provides management the opportunity toassess impact and plan remedial measures if necessary. Indeveloping a project history, the causes for delays can beidentified and measured from the updated schedules to sup-port delay analysis and negotiations.
Updating Intervals for Managing ChangesGenerally, project management requires updates to be per-formed at least monthly and it is not unusual to requireweekly status and updates. Most projects facilitate the needto update somewhere between the two extremes. These inter-vals generally coincide with routine business reporting peri-ods such as monthly progress reports, loan payment sched-ules, and other fixed reporting requirements. The project sta-tus and progress should also be reported periodically withthese update reports to provide complete decision makinginformation. Although periodic updates may support busi-ness and financial needs, the project manager needs more fre-quent and routine updating to perform effective manage-ment of changes.
Updating Procedures for Managing ChangesUpdating and revising a schedule may require several itera-tions before management and supervision decides on an
13.16
SCHEDULING AACE INTERNATIONAL
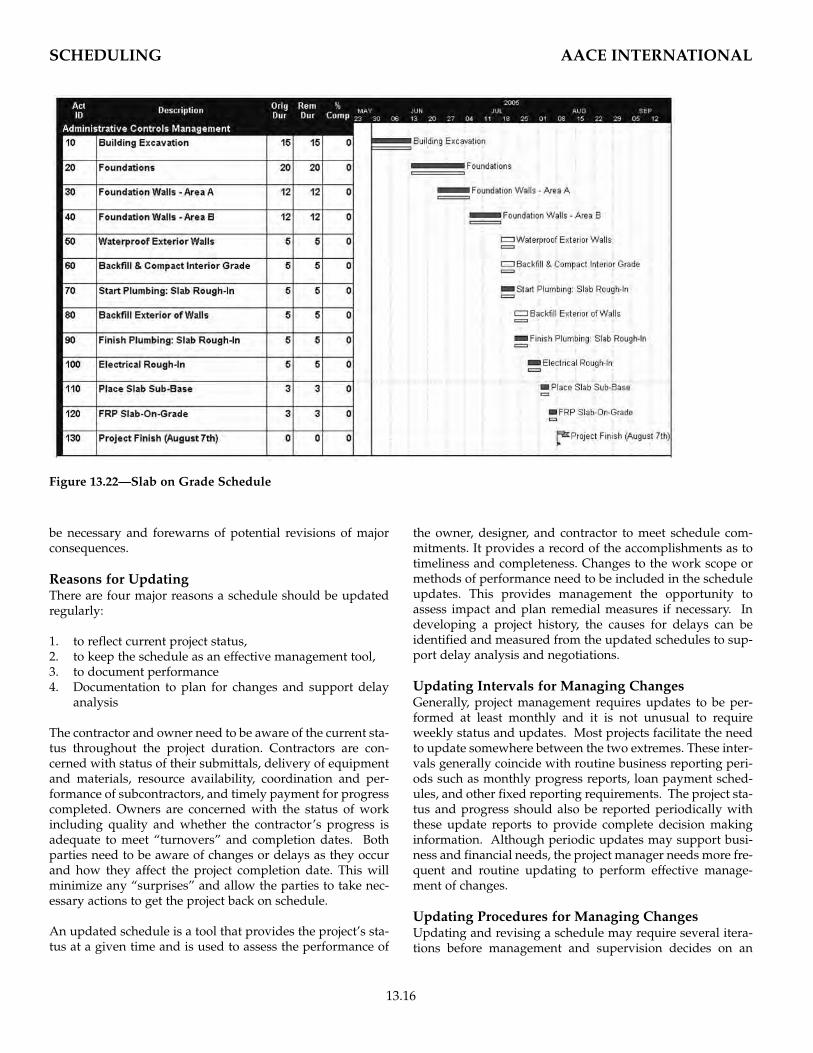
Figure 13.22—Slab on Grade Schedule


13.19
AACE INTERNATIONAL SCHEDULING
CONCLUSION
The project schedule represents a communication tool that pres-ents the project plan (complete work scope), the order in whichit will be worked, and the length of time it will take to completethe activities and the project. The schedule represents the earli-est dates the activities and project can occur and the latest datesfor activities and project completion that must occur.
PRACTICE PROBLEMS AND QUESTIONS
1. What is meant by early and late start and finish?2. Define the critical path of a project.3. What is total float and what does negative total float
mean?4. What is a great tool for communicating the work and
why?5. What are the benefits of progress collection and sched-
ule updates?
REFERENCES
1. Callahan, Michael T., Daniel G. Quackenbush, and JamesE. Rowings. 1992. Construction Project Scheduling. NewYork: McGraw-Hill, 1992.
2. Werderitsch, Anthony, PE, CCE. 1992. Planning …Scheduling. Ann Arbor, Michigan: AdministrativeControls Management, Inc.
3. Lewis, James. 2000. Project Manager’s Desk Reference, 2ndEdition. New York: McGraw Hill.
Portions of this chapter are from previous editions authoredby Dr. Brisbane H. Brown, Jr.; Dr. James M. Neil, PE, CCE;
and Jennifer Bates, CCE.
Problem 1—Draw a Precedence Diagram Network, andcalculate early dates, late dates, and total float for eachactivity based on the information in the table below.
Problem 2—Draw a precedence diagram network, and cal-culate early dates, late dates, and total float for each activ-ity based on the information in the following table: