Embed Size (px)
Citation preview
1
2004 Deitel & Associates, Inc. All rights reserved.
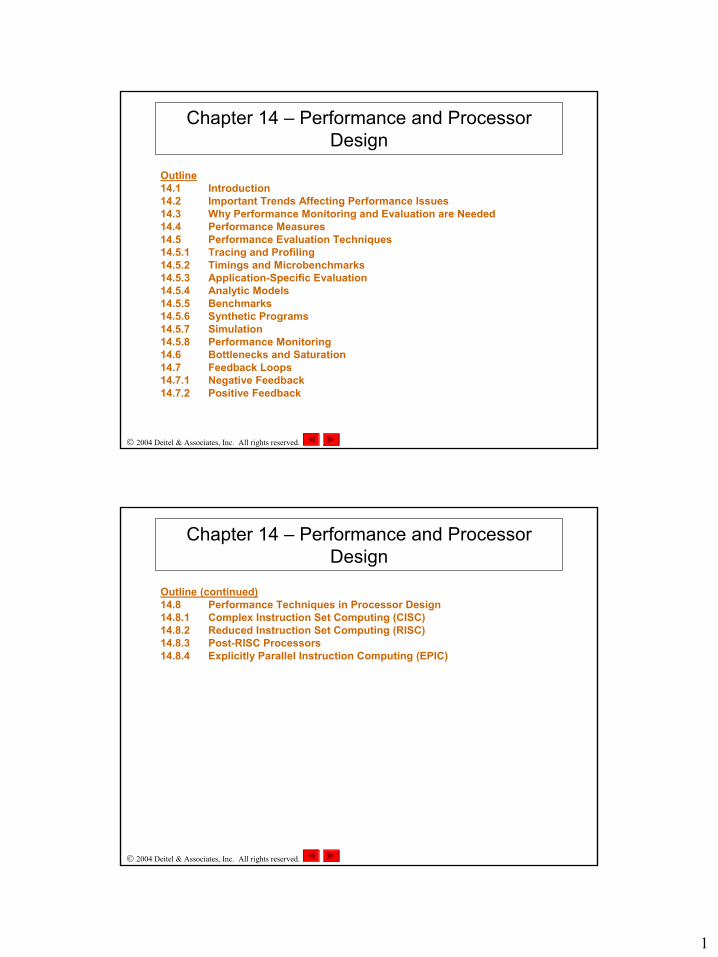
Chapter 14 – Performance and Processor Design
Outline14.1 Introduction14.2 Important Trends Affecting Performance Issues14.3 Why Performance Monitoring and Evaluation are Needed14.4 Performance Measures14.5 Performance Evaluation Techniques14.5.1 Tracing and Profiling14.5.2 Timings and Microbenchmarks14.5.3 Application-Specific Evaluation14.5.4 Analytic Models14.5.5 Benchmarks14.5.6 Synthetic Programs14.5.7 Simulation14.5.8 Performance Monitoring14.6 Bottlenecks and Saturation14.7 Feedback Loops14.7.1 Negative Feedback14.7.2 Positive Feedback
2004 Deitel & Associates, Inc. All rights reserved.
Chapter 14 – Performance and Processor Design
Outline (continued)14.8 Performance Techniques in Processor Design14.8.1 Complex Instruction Set Computing (CISC)14.8.2 Reduced Instruction Set Computing (RISC)14.8.3 Post-RISC Processors14.8.4 Explicitly Parallel Instruction Computing (EPIC)
2
2004 Deitel & Associates, Inc. All rights reserved.
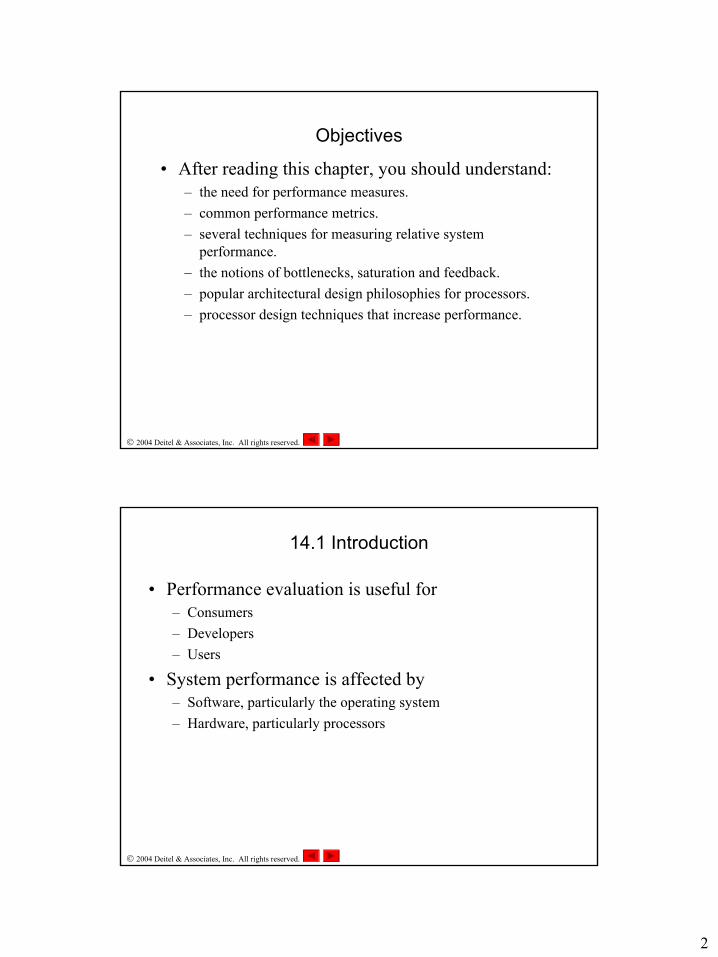
Objectives
• After reading this chapter, you should understand:– the need for performance measures.– common performance metrics.– several techniques for measuring relative system
performance.– the notions of bottlenecks, saturation and feedback.– popular architectural design philosophies for processors.– processor design techniques that increase performance.
2004 Deitel & Associates, Inc. All rights reserved.
14.1 Introduction
• Performance evaluation is useful for– Consumers– Developers– Users
• System performance is affected by– Software, particularly the operating system– Hardware, particularly processors
3
2004 Deitel & Associates, Inc. All rights reserved.
14.2 Important Trends Affecting Performance Issues
• Early days of computing: performance evaluation almost exclusively for hardware
• Now: software must be evaluated too• Raw measures influential (e.g., GHz)• Industry standardization• Evaluation tools becoming more sophisticated
2004 Deitel & Associates, Inc. All rights reserved.
14.3 Why Performance Monitoring and Evaluation are Needed
• Common purposes of performance evaluation– Selection evaluation– Performance projection– Performance monitoring
• Performance evaluation useful when:– Developing a system– Deciding whether to buy or upgrade– System tuning
4
2004 Deitel & Associates, Inc. All rights reserved.
14.4 Performance Measures
• Two types of measures– Absolute performance measures (e.g., throughput)– Relative performance measures (e.g., ease of use)
• Common performance measures:– Turnaround time = time from when a job is submitted to when a
result is returned– Response time = time from when a user enters a request until the
system displays a response– System reaction time = time from when a user enters a request
until the first time slice of service is given to that user request
• Represented by random variables
2004 Deitel & Associates, Inc. All rights reserved.
14.4 Performance Measures
• Other commonly employed performance measures:– Variance in response time = how closely individual response
times are to the mean response time– Throughput = work per unit time– Workload = amount of work submitted to a system; the system is
evaluated in relation to a specified workload.– Capacity = maximum throughput– Utilization = fraction of time a resource is in use
5
2004 Deitel & Associates, Inc. All rights reserved.
14.5 Performance Evaluation Techniques
• Different techniques for different purposes• Some evaluate the system as a whole• Some isolate the performance of individual
subsystems, components, functions or instructions• Thorough evaluation involves using more than one
technique
2004 Deitel & Associates, Inc. All rights reserved.
14.5.1 Tracing and Profiling
• Trace– Record of system activity, typically a log of user or application
requests to the operating system– Characterizes a system’s execution environment– Manipulate to test for “what if” scenarios– Standard traces
• Can be used to compare systems that execute in a similar environment
• Standard traces are difficult to obtain because– Traces proprietary to installation where recorded– Subtle differences between environments can make an impact
on performance, hindering the portability of traces
6
2004 Deitel & Associates, Inc. All rights reserved.
14.5.1 Tracing and Profiling
• Profile– Record of system activity in kernel mode (e.g., process
scheduling and I/O management)– Indicate which primitives are most heavily used and should be
optimized
2004 Deitel & Associates, Inc. All rights reserved.
14.5.2 Timings and Microbenchmarks
• Timing– Raw performance measure (e.g., cycles per second or
instructions per second)– Quick comparisons between hardware– Comparisons between members of the same family of computers
(e.g., Pentiums)
• Microbenchmark– Measures the time required to perform a specific operating
system operation (e.g., process creation)– Also used for system operations (e.g., read/write bandwidth)– Only used for measuring small aspects of system performance,
not the system’s performance as a whole
7
2004 Deitel & Associates, Inc. All rights reserved.
14.5.2 Timings and Microbenchmarks
• Microbenchmark suites– Programs that contain a number of microbenchmarks to test
different instructions and operations of a system– lmbench
• Compare system performance between different UNIX platforms• Several limitations
– Timings too coarse (used a software clock) for some tests– Statistics reporting was not uniform
– hbench• Analyzes the relationship between operating system primitives and
hardware components• Corrected some of the limitations of lmbench
2004 Deitel & Associates, Inc. All rights reserved.
14.5.3 Application-Specific Evaluation
• Vector-based methodology– System vector
• Microbenchmark test for each primitive• Vector consists of the results of these tests
– Application vector• Profile the system when running the target application• Vector consists of the demand on each primitive
– Performance of the system obtained by• For each element in the system vector, multiply it by the element in
the application vector that corresponds to the same primitive• Sum the results
8
2004 Deitel & Associates, Inc. All rights reserved.
14.5.3 Application-Specific Evaluation
• Hybrid methodology– Combines the vector-based methodology with a trace– Useful for system’s whose execution environment depends not
only the target application, but on the stream of user requests (e.g., a Web server)
• Kernel program– A simple algorithm (e.g., matrix inversion) or an entire program– Executed “on paper” using manufacturer’s timings– Useful for consumers who have not yet purchased a system– Not commonly used anymore
2004 Deitel & Associates, Inc. All rights reserved.
14.5.4 Analytic Models
• Analytic models– Mathematical representations of computer systems– Examples: those of queuing theory and Markov processes– Pros
• A large body of results exist that can be applied to new models• Can be relatively fast and accurate
– Cons• Systems often too complex to model exactly• Evaluator must be a skilled mathematician
– Must use other techniques to validate results
9
2004 Deitel & Associates, Inc. All rights reserved.
14.5.5 Benchmarks
• Production program or industry-standard benchmark– Run to completion and timed on target machine– Pros
• Run on the actual machine so human error minimal• Capture most aspects of a system and its environment• Typically already exist so easy to use
– Characteristics of a good benchmark• Produces nearly the same result each run on the same machine• Relevant to the types of applications executed on target system• Widely used
2004 Deitel & Associates, Inc. All rights reserved.
14.5.5 Benchmarks
• Standard Performance Evaluation Corporation (SPEC)– Develops industry-standard benchmarks, called SPECmarks– Publishes thousands of results per month– Criticized because workloads not relevant enough to actual
workloads on systems being tested– Continually works to develop more relevant benchmarks
10
2004 Deitel & Associates, Inc. All rights reserved.
14.5.5 Benchmarks
• Other Industry-standard benchmarks– Business Application Performance Corporation (BAPCo):
SYSmark, MobileMark, WebMark– Transaction Processing Performance Council (TPC) benchmarks
for database systems– Standard Application (SAP) benchmarks evaluating scalability
2004 Deitel & Associates, Inc. All rights reserved.
14.5.6 Synthetic Programs
• Synthetic programs– Programs constructed for a specific purpose (not a real program)
• To test a specific component• To approximate the instruction mix of an application or group of
applications– Useful for isolating the performance of specific components, but
not the system as a whole
11
2004 Deitel & Associates, Inc. All rights reserved.
14.5.6 Synthetic Programs
• Examples of synthetic programs– Whetstone (floating point calculations), no longer used– Dhrystone (execution of system programs), no longer used– WinBench 99 (graphics, disk and video subsystems in a
Windows environment)– IOStone (file systems)– Hartstone (real-time systems)– STREAM (memory subsystem)
2004 Deitel & Associates, Inc. All rights reserved.
14.5.7 Simulation
• Simulation– Computerized model of a system– Useful in performance projection– Results of a simulation must be validated– Two types
• Event driven simulators – controlled by events made to occur according to a probability distribution
• Script-driven simulators – controlled by data carefully manipulated to reflect the system’s anticipated environment
– Common errors• Bugs in the simulator• Deliberate omissions (due to complexity)• Imprecise modeling
12
2004 Deitel & Associates, Inc. All rights reserved.
14.5.8 Performance Monitoring
• Performance monitoring– Can locate inefficiencies in a system that administrators or
developers can remove– Software monitors
• Windows Task Manager and Linux proc file system• Might distort results because these program require system
resources– Hardware monitors
• Use counting registers• Record events such as TLB misses, clock ticks and memory
operations
2004 Deitel & Associates, Inc. All rights reserved.
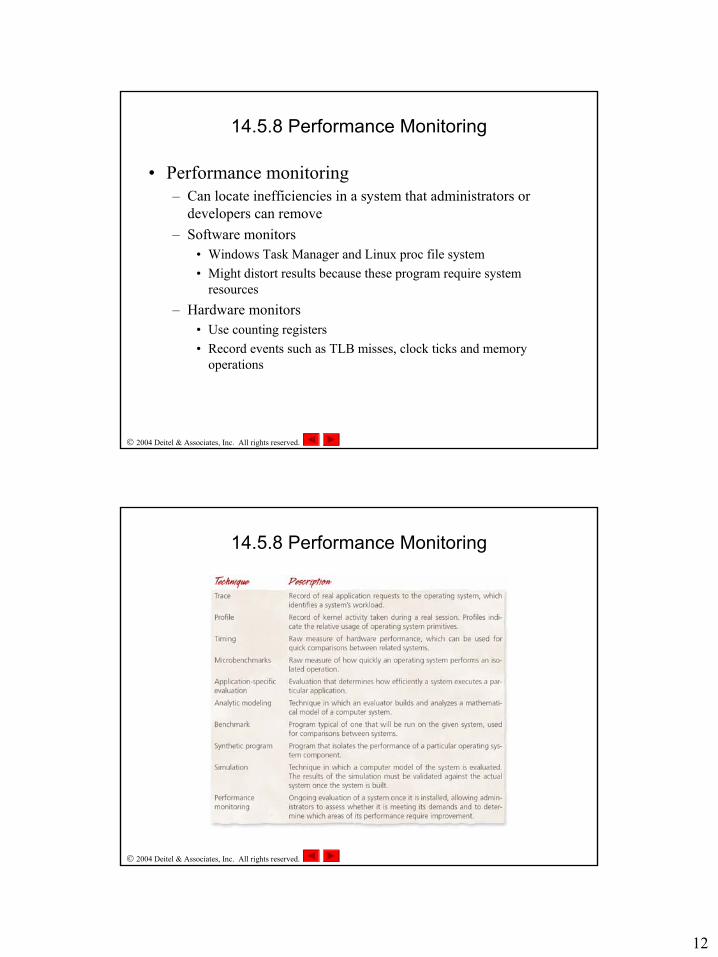
Figure 14.1 Summary of performance evaluation techniques.
14.5.8 Performance Monitoring
13
2004 Deitel & Associates, Inc. All rights reserved.
14.6 Bottlenecks and Saturation
• Bottleneck– Resource that performs its designated task slowly relative to
other resources– Degrades system performance– Arrival rate > service rate– Removing a bottleneck might not increase performance if there
are other bottlenecks
• Saturated resource– Processes competing for use of the resource interfere with each
other’s execution– Thrashing occurs when memory is saturated
2004 Deitel & Associates, Inc. All rights reserved.
14.7 Feedback Loops
• Feedback loop– Technique in which information about the current state of the
system can affect arriving requests– Negative feedback implies resource is saturated– Positive feedback implies resource is underutilized
14
2004 Deitel & Associates, Inc. All rights reserved.
14.7.1 Negative Feedback
• Negative feedback– Arrival rate a resource might decrease as a result of negative
feedback– Examples:
• Multiple print servers• Print servers with long queues cause negative feedback• Jobs go to other print servers
– Contributes to system stability
2004 Deitel & Associates, Inc. All rights reserved.
14.7.2 Positive Feedback
• Positive feedback– Arrival rate a resource might increase as a result of positive
feedback– Might be misleading
• E.g., Processor utilization is low might cause the scheduler to admit more processes to that processor’s queue
• Low utilization might be due to thrashing• Admitting more processes causes more thrashing and worse
performance• Designers must be cautious of these types of situations
15
2004 Deitel & Associates, Inc. All rights reserved.
14.8 Performance Techniques in Processor Design
• Conceptually, a processor can be divided into:– Instruction set– Hardware implementation
• Instruction Set Architecture (ISA)– Interface that describes the processor– Instruction set, number of registers, etc.– Like an API exposed by the processor
2004 Deitel & Associates, Inc. All rights reserved.
14.8.1Complex Instruction Set Computing (CISC)
• Complex instruction set computing (CISC)– Incorporate frequently used sections of code into single machine
language instructions– Makes assembly code writing easier– Saves memory– Optimizes the execution of complex functions– Popular until mid-1980s
16
2004 Deitel & Associates, Inc. All rights reserved.
14.8.1 Complex Instruction Set Computing (CISC)
• Characteristics of CISC processors– Many instructions– Instruction decoded by firmware– Few general purpose registers– Examples: Pentium, Athlon
• Pipelining– Divides a processor’s datapath into discrete stages– One instruction per stage per clock cycle– Increases parallelism and hence processor performance– Originally developed for CISC processors– First pipeline: IBM 7030 (“Stretch”)
2004 Deitel & Associates, Inc. All rights reserved.
14.8.2 Reduced Instruction Set Computing (RISC)
• Studies revealed that only a few simple instructions accounted for nearly all instructions executed by a processor– IBM System/370 – 10 most frequently executed instructions
accounted for 2/3 of instructions executed– IBM Series/1 - programmers tended to generate “semantically
equivalent instruction sequences”– Provided compelling evidence for reduced instruction set
computing (RISC)
17
2004 Deitel & Associates, Inc. All rights reserved.
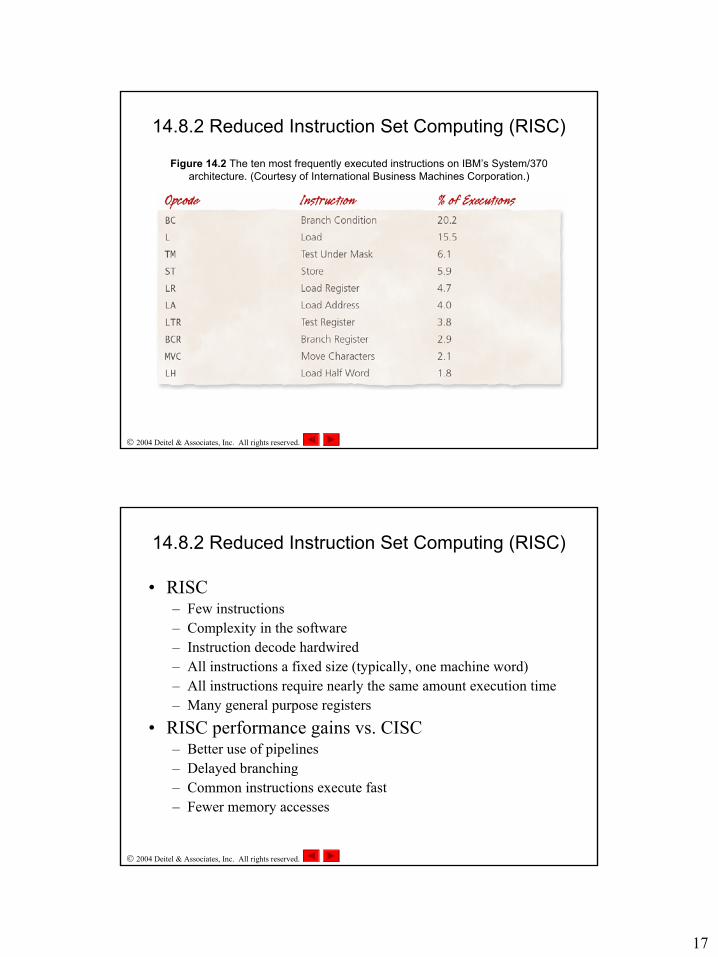
Figure 14.2 The ten most frequently executed instructions on IBM’s System/370 architecture. (Courtesy of International Business Machines Corporation.)
14.8.2 Reduced Instruction Set Computing (RISC)
2004 Deitel & Associates, Inc. All rights reserved.
14.8.2 Reduced Instruction Set Computing (RISC)
• RISC– Few instructions – Complexity in the software– Instruction decode hardwired– All instructions a fixed size (typically, one machine word)– All instructions require nearly the same amount execution time– Many general purpose registers
• RISC performance gains vs. CISC– Better use of pipelines– Delayed branching– Common instructions execute fast– Fewer memory accesses
18
2004 Deitel & Associates, Inc. All rights reserved.
14.8.2 Reduced Instruction Set Computing (RISC)
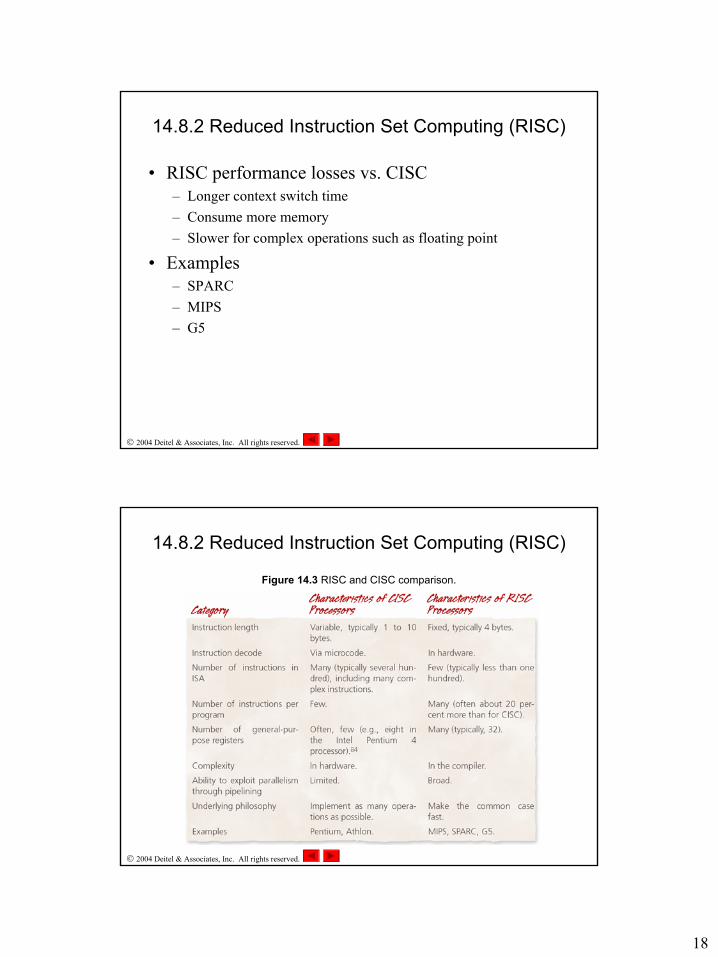
• RISC performance losses vs. CISC– Longer context switch time– Consume more memory– Slower for complex operations such as floating point
• Examples– SPARC– MIPS– G5
2004 Deitel & Associates, Inc. All rights reserved.
Figure 14.3 RISC and CISC comparison.
14.8.2 Reduced Instruction Set Computing (RISC)
19
2004 Deitel & Associates, Inc. All rights reserved.
14.8.3 Post-RISC Processors
• Modern processors– Stray from traditional RISC and CISC designs– Include anything that increases performance– Common names: post-RISC, second generation RISC and fast
instruction set computing (FISC)– Some do not agree that RISC and CISC designs converged
• RISC convergence to CISC– Superscalar architecture– Out of order execution (OOO)– Branch prediction– On-chip floating point and vector support– Additional, infrequently used instructions
2004 Deitel & Associates, Inc. All rights reserved.
14.8.3 Post-RISC Processors
• CISC convergence to RISC– Core RISC instruction set– All instructions decoded to RISC instructions (e.g., Pentium)– Complex instructions only included to provide backwards
compatibility
20
2004 Deitel & Associates, Inc. All rights reserved.
14.8.4 Explicitly Parallel Instruction Computing (EPIC)
• Motivations– Hardware complexity from superscalar architectures do not scale
well– Exploit instruction-level parallelism (ILP)
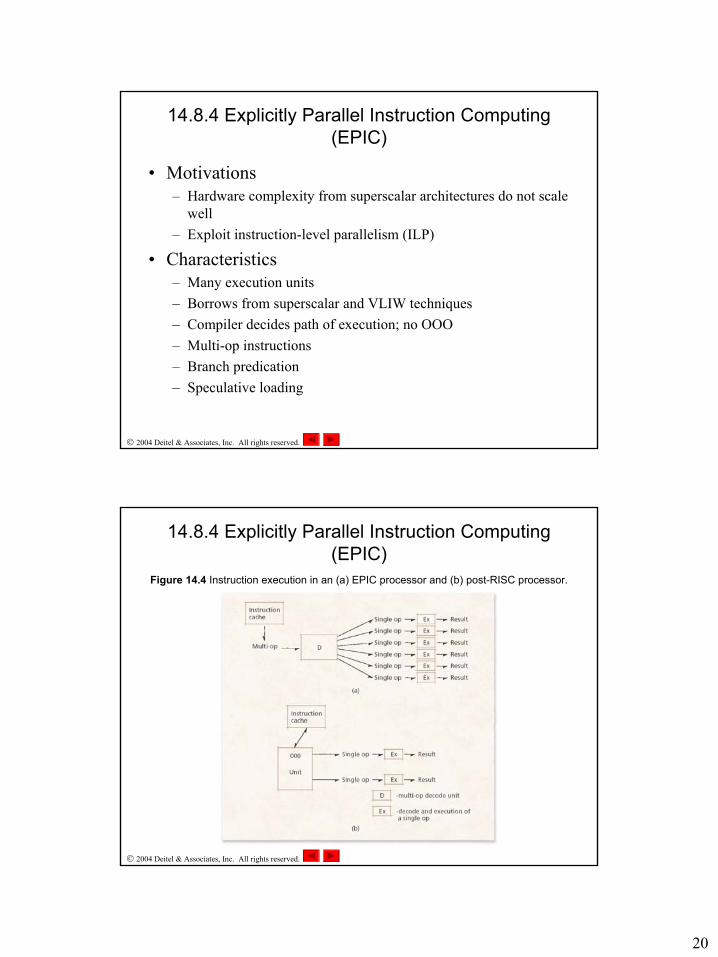
• Characteristics– Many execution units– Borrows from superscalar and VLIW techniques– Compiler decides path of execution; no OOO– Multi-op instructions– Branch predication– Speculative loading
2004 Deitel & Associates, Inc. All rights reserved.
Figure 14.4 Instruction execution in an (a) EPIC processor and (b) post-RISC processor.
14.8.4 Explicitly Parallel Instruction Computing (EPIC)