Embed Size (px)
Citation preview

Page 1
CHAPTER 14: SPECTROSCOPY
CHEMICAL IDENTIFICATION
Historical Chemical Identification involved combustion analysis (to determine the molecular formula), simple chemical tests, degradation to smaller pieces and simple chemical tests on the resulting fragments. It was a very slow process and required painstaking detective work.
Maitotoxin is one of the largest natural products. It is very lethal (LD50 = 50 ng/kg). The structure was mostly determined by NMR experiments in 1993 and stereochemistry further determined in 19961.
1 Jones, M., Fleming, S.A., Organic Chemistry, 4th ed., Norton, 2010, pp. 745
Page 2
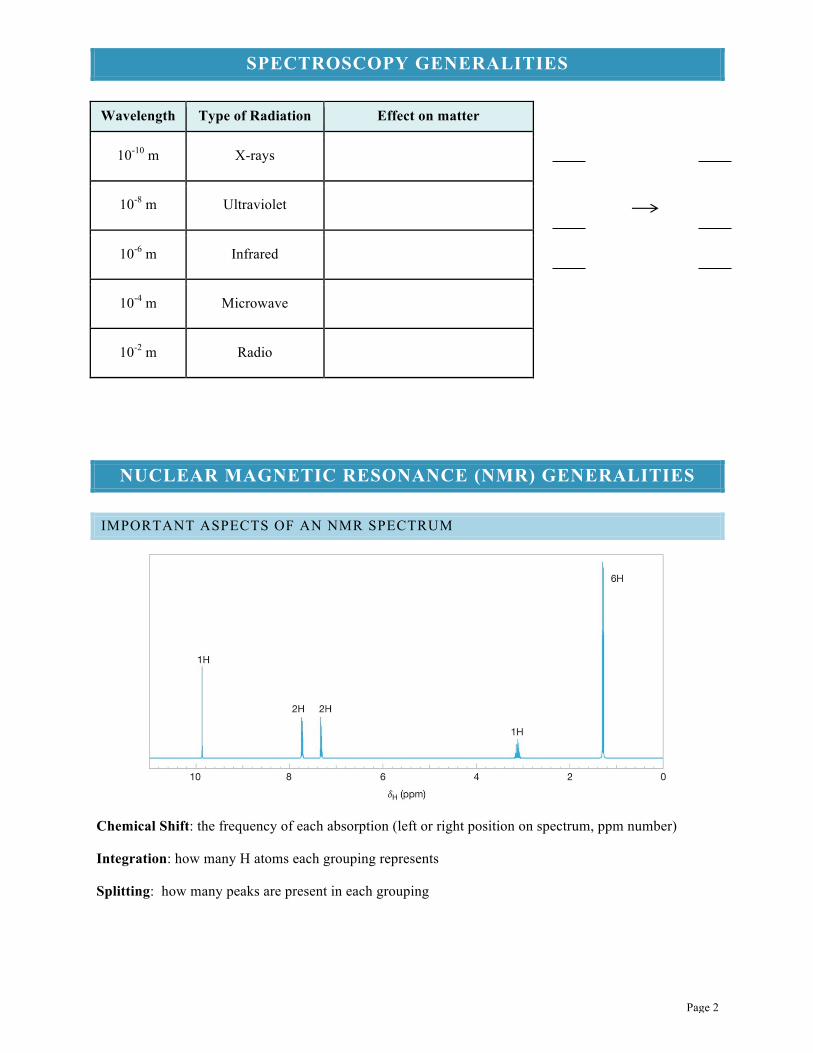
SPECTROSCOPY GENERALITIES
Wavelength Type of Radiation Effect on matter
10-10 m X-rays
10-8 m Ultraviolet
10-6 m Infrared
10-4 m Microwave
10-2 m Radio
NUCLEAR MAGNETIC RESONANCE (NMR) GENERALITIES
IMPORTANT ASPECTS OF AN NMR SPECTRUM
Chemical Shift: the frequency of each absorption (left or right position on spectrum, ppm number)
Integration: how many H atoms each grouping represents
Splitting: how many peaks are present in each grouping

Page 3
THE NMR PHENOMENON
NUCLEAR SPIN STATES
ABSORPTION
The a and b states are very close in energy, with only a slight excess in the a state. On a 60 MHz instrument, there are 1,000,000 nuclei in the b state and 1,000,009 nuclei in the a state.2
MAGNETIC RESONANCE IMAGING (MRI)
Clinical MRI instruments are 5,000-20,000 gauss (0.5-2.0 Tesla). The Earth’s magnetic field is 0.5 gauss.
I believe Enloe’s MRI is 14,092 gauss (H comes into resonance at 60 MHz).
In the MRI (NMR) instrument, hydrogen atoms from water undergo a “spin flip” and the instrument measures the amount of time it takes to return to normal (to relax). Water relaxes at different rates depending on its environment (tissue, tumors). The relaxation times are represented by colors or shades of grey.
2 Pavia, D.L., Lampman, G.M., Introduction to Spectroscopy, 4th ed., Brooks/Cole, 2009, pp. 111
α
β
α
β
α
β

Page 4
SPIN ACTIVE NUCLEI
1. Not all atoms have “spin.” They must have odd mass, odd atomic # or both.
Commonly analyzed NMR active nuclei: 1H, 2H, 13C, 15N, 19F, 29Si, 31P, 119Sn
2. Each spin active nuclei absorbs at a different frequency
NMR UNITS (FYI)
TETRAMETHYLSILANE (TMS) + UNITS
The internal standard TMS is sometimes used (meaning it is in the NMR solvent) to provide a reference absorption. The TMS absorption is defined as zero and other signals are referenced relative to this standard.
100 MHz instrument: signal at 1 ppm is 100 Hz greater than TMS 300 MHz instrument: signal at 1 ppm is 300 MHz greater than TMS.
Deuterium (2H)Carbon-13 (13C)Hydrogen (1H)
On a 300 MHz instrument:
300 MHz
75 MHz 46 MHz
TMS
H3C SiCH3
CH3
CH3
TMS

Page 5
NMR FEATURES NECESSARY FOR INTERPRETATION
SAMPLE PREPARATION AND SOLVENT
O
CH3CH2OH
CH3CH2OH
1 mL solvent
1 drop sample
O
solvent
sample

Page 6
CHEMICAL EQUIVALENCE
Chemically equivalent hydrogen atoms absorb in the same location.
How many signals should be present in the 1H NMR spectrum of each compound?
Structure
# signals
How many signals should ideally be present in the 1H NMR spectrum of each compound?
Structure
# signals
01234PPM
01234PPM
01234PPM
O O
O
0123PPM
0123PPM
O
0123PPM
H3C
CH3
Br
Cl
OH

Page 7
CHEMICAL SHIFT
ELECTRONIC SHIELDING
H C
H
H
C
O
C
H
H
Br

Page 8
CHEMICAL SHIFT TRENDS
1) CORRELATION CHART
2) PROXIMITY TO AN ELECTRONEGATIVE GROUP
Substance Shift
CH3Cl 3.06 ppm
CH2Cl2 CHCl3 CCl4
C C
H
H
O C
H
H
HN

Page 9
INTEGRATION
SIGNAL SPLITTING
012345PPM
012345PPM
H C
H
OH
H
H C
H
H
C
H
OH
H

Page 10
SIGNAL WITH ONE NEIGHBOR
SIGNAL WITH TWO NEIGHBORS

Page 11
SPLITTING SHORTCUT
What is the expected splitting (how many lines) for each signal?
Signal a b c d
Splitting
SIGNAL HEIGHTS
Pascal’s triangle describes the relative heights within a split signal.
singlet broad singlet doublet triplet quartet quintet sextet multiplet
s br. s d t q quint. sext. m
Br C
H
Br
C
H
H
Br
C C
H
H
C
H
C
H
O
O C
H
H
HH
H
Hba c d

Page 12
SIGNALS INVOLVED IN HYDROGEN BONDING
• They can be seen over a broad range (ppm is concentration dependent).
• The signals are often (but not always) broadened.
• They are normally singlets (splitting is not seen even if they have neighbors).
DRAWING 1H NMR SPECTRUM FROM STRUCTURE
012345PPM
H C
H
H
C
O
O C
H
C
H
H
HH
4 3 2 1 0 ppm
CH3 CH2 OH CH3 CH2 OH

Page 13
OHCC
H H
H
C
CH
H
H
H
H
H
C
CC
C
CC C
C
O
H
HH
H
H
H
H
H
4 3 2 1 0 ppm
8 6 4 2 0 ppm 7 5 3 1

Page 14
DETERMINING STRUCTURE FROM 1H NMR SPECTRUM
COINCIDENTAL OVERLAP
EXAMPLE
RESOLUTION IMPROVES WITH MAGNET STRENGTH
Butte College 60 MHz Chico State 400 MHz and 300 MHz Biggest to date 1000 MHz (1 GHz)
012345678PPM
2H, t
3H, t
2H, q
3H, m
300 MHz
600 MHzResolution improves
The 3rd + 4th CH2�s overlap
ClCH2CH2CH2CH2CH3
O

Page 15
DEGREES OF UNSATURATION
MOLECULAR FORMULA
Alkane, C2H6 Alkene, C2H4 Alkyne, C2H2 C3H8
CALCULATING D.U.
1) GENERAL FORMULA
𝐷. 𝑈. = & #( )& –(#,)&
Ex. C6H8
Which of these structures are possible for C6H8?
2) ATOMS OTHER THAN C
Convert other atoms into a C-H equivalent.
Halogens: Oxygen: Nitrogen:
Ex. C4H7NO
Which of these structures are possible for C4H7NO?
H C
H
H
C
H
H
H
C C
H
H H
H
C CH H H C
H
H
C
H
C
H
H
H
HC C
C
H H
H H
HH
H C
H
H
C
H
H
H
H C
H
H
C
Br
H
H
H C
H
H
C
H
H
H
H C
H
H
O C H
H
H
H C
H
H
C
H
H
H
H C
H
H
N H
H
NH2
HOH2N
O
HN
O
HN
O
NH
O

Page 16
APPROACH TO SOLVING 1H NMR PROBLEMS
1) COMMON PATTERNS
Isopropyl group: Tert-butyl group:
Unknown C5H10O
H3CC
O
H3C CH3
CH2CH3H3C
CHCH3
Br

Page 17
Doubly substituted Aromatic:
Unknown C10H12O
012345678PPM
3H, s
2H, d 2H, d
OCH3 OCH3 OCH3
BrBr
Br

Page 18
2) GENERAL APPROACH
1. Calculate the degrees of unsaturation.
2. Look at the integration of each signal. 2H is often a CH2 group, 3H is often a CH3 group.
3. Look at the position of each signal to see what kind of H’s are present (aromatic, aldehyde), or what the H’s might be next to (O, Br, C=O).
4. Look at how many peaks are in each signal (multiplicity) to determine neighbors. Start with simpler splittings like doublets or triplets.
5. Try to connect pieces together as soon as possible. If there is only one signal that integrates to 1H and you find a signal that is neighboring 1H (because it is a doublet), put those pieces together.
6. Keep building fragments of the structure, and check off the signals when you’ve already used them. Eventually the fragments should connect.
Unknown, C10H14
012345678PPM
3H, m
2H, t
1H, m
2H, quint.
3H, d3H, t

Page 19
PRACTICE PROBLEMS
Unknown A: C4H10O
Unknown B: C4H9Br
01234PPM
3H, s
1H, m
6H, d
01234PPM
2H, t 2H, quint.
2H, sext.
3H, t

Page 20
Unknown C: C9H10O2
Unknown D: C8H11N
012345678PPM
5H, m 2H, t2H, t
2H, s

Page 21
CARBON-13 NMR
DIFFERENCES BETWEEN 13C AND 1H
1. 13C nucleus absorbs at a different frequency than 1H nucleus (75 MHz on a 300 MHz magnet).
2. Usable range is greater because the factors that affect chemical shift are felt through 1 fewer bond than with 1H.
3. Only 1.08% of all carbon atoms are 13C while 99.98% of all hydrogen atoms are 1H. This makes 13C 6000× less sensitive than H: must use more concentrated samples.
4. The instrument is set up so there is no splitting between 13C and 1H (every unique carbon shows up as a singlet).
5. Integration is meaningless in 13C NMR.
6. There is never any coincidental overlap.
Limonene (orange oil)
CDCl
O
CDCl3

Page 22
SIMILARITIES BETWEEN 13C AND 1H SPECTRA
1. Chemical shifts parallel, are just more spread out in 13C NMR spectra.
2. Symmetry considerations still apply.
How many total signals would we expect for each compound in their 13C NMR spectrum?
200 150 100 50 0 ppm
C
O
H
C
O
C
O
OH
C
O
OR
C
O
NH2
C
C=C
C C
C-O
C-Cl
C-NC-CH3
C-CH2-C
C CHC
C
Br
Cl
OBr Cl
Cl
Cl
Cl
Cl
Cl

Page 23
COMBINATION SPECTROSCOPY PROBLEMS
APPROACH
1. Calculate D.U.
2. Look briefly at IR for key functional groups (OH, NH, C=O, terminal alkyne)
3. Look briefly at 13C NMR for general functional groups present (C=O, aromatics/alkenes), and check for symmetry (are there fewer signals than carbon atoms).
4. Tackle the 1H NMR in the normal way.
PROBLEMS
Unknown A: C6H5NCl2
IR Spectrum of A: 13C NMR Spectrum of A:
1H NMR Spectrum of A:

Page 24
Unknown B: C5H9ClO2

Page 25
MORE COMBO PROBLEMS
Unknown C: C9H6O
13C NMR d: 175.0, 132.3, 128.4, 128.3, 122.7, 96.2, 88.2 ppm

Page 26
Unknown D: C4H8Cl2
01020304050PPM
01234PPM
1H
3H4H

Page 27
1H NMR Correlation Chart
The ranges below are approximate values for the bolded hydrogen atoms in the partial structures. Be aware that there will be cases where they will fall outside of their expected range.
These ranges represent the environment of the hydrogen atoms, not the quantity:
Br-CH3 will be found in the same location as Br-CH2-C, and Cl-CH2-C would also be found in the same range.
H on Alkyl Group H on Multiple Bonds C-CH3 0.7 – 1.3 ppm 1.7 – 2.7 ppm
C-CH2-C 1.2 – 1.4
4.6 – 5.7
1.4 – 1.7
6.5 – 8.0
Next to mild electron-withdrawing group
9.0 – 10.0
1.6 – 2.6 That can hydrogen bond
2.1 – 2.4
11.0 – 12.0
2.3 – 2.7
4.0 – 10.0
C-CH2-NH 2.2 – 2.9 C-CH2-OH 0.5 – 5.0
Next to strong electron-withdrawing group C-CH2-NH 0.5 – 5.0
C-CH2-O 3.2 – 3.8
C-CH2-Br 2.7 – 4.1
3.5 – 4.8
C-CH-Cl2 5.0 – 5.9
12 11 10 9 8 7 6 5 4 3 2 1 0 ppm
O
OH
HO
HH
C-CH
C-OH C-NH
CH-OCH-Cl
CH-Br
CHO
CH
OH
CH-Cl2
C CC H
H
H
C CHC
C
H
O
H
H
OH
O
OH
H OH
O
OCH

Page 28