Embed Size (px)
Citation preview
Ecosystem Services | Chapter 15: Provisioning Services 597
Chapter 15:Provisioning ServicesCoordinating Lead Author: Gareth Edwards-Jones Contributing Authors: Paul Cross, Nicola Foley, Ian Harris, Mike Kaiser, Lewis Le Vay, Mark Rayment, Matt Scowen and Paul Waller
Key Findings .......................................................................................................................................................... 59815.1 Introduction ................................................................................................................................................... 600
15.1.2 Data Use and Interpretation ......................................................................................................................................60015.2 Food, Fibre and Energy from Agriculture ...................................................................................................... 600
15.2.1 Historical and Global Perspective on Food Supply ..................................................................................................60115.2.2 Crops ...........................................................................................................................................................................60115.2.3 Livestock .....................................................................................................................................................................60215.2.4 Fibre from Agriculture ...............................................................................................................................................60615.2.5 Biomass and Bioenergy .............................................................................................................................................60615.2.6 Drivers of Change in Agriculture ..............................................................................................................................606
15.3 Food from Marine Ecosystems ...................................................................................................................... 60815.3.1 Data Constraints ........................................................................................................................................................60915.3.2 Trends in Landings ....................................................................................................................................................60915.3.3 Drivers of Change in Marine Fisheries ..................................................................................................................... 611
15.4 Food from Aquaculture ...................................................................................................................................61115.4.1 Drivers of Change in Aquaculture ............................................................................................................................. 612
15.5 Game and Wild Collected Food .......................................................................................................................612 15.5.1 Gamebirds ................................................................................................................................................................... 612
15.5.2 Deer ............................................................................................................................................................................. 61315.5.3 Salmon and Migratory Trout in Estuaries and Freshwaters ................................................................................... 61415.5.4 Drivers of Change in Harvesting Game Species ....................................................................................................... 614
15.6 Honey ..............................................................................................................................................................61515.6.1 Drivers of Change in Honey Production .................................................................................................................... 615
15.7 Timber and Forest Products ...........................................................................................................................61515.7.1 Timber ......................................................................................................................................................................... 61615.7.2 Christmas Trees .......................................................................................................................................................... 61715.7.3 Edible Non-Timber Forest Products .......................................................................................................................... 61715.7.4 Drivers of Change in Timber and Forest Products ................................................................................................... 617
15.8 Peat .................................................................................................................................................................61815.8.1 Drivers of Change in Peat Extraction ........................................................................................................................ 619
15.9 Ornamental Resources ...................................................................................................................................61915.9.1 Drivers of Change in the Ornamentals Sector .......................................................................................................... 619
15.10 Genetic Resources ....................................................................................................................................... 62015.10.1 Drivers of Change for Genetic Resources ................................................................................................................620
15.11 Water ............................................................................................................................................................ 62015.11.1 Bottled Water ............................................................................................................................................................. 62115.11.2 Drivers of Change for Water Use .............................................................................................................................. 621
15.12 Trade-offs, Synergies and Options for Sustainable Management ................................................................ 62315.13 Key Questions and Knowledge Gaps.............................................................................................................624
15.13.1 How Should We Spatially Allocate Productive and Environmental Management Activities? ............................. 62415.13.2 What Level of Species Redundancy is There in Productive Ecosystems? ............................................................. 62415.13.3 How Can We Predict When Environmental Pressures Will Serve to Reduce Future Flows of Provisioning Services in Given Ecosystems? ...................................................................................................................... 62415.13.4 How Can We Enhance Resource Efficiency and Reduce Levels of Waste and Pollution? .................................... 625
References ..............................................................................................................................................................626Appendix 15.1 Approach Used to Assign Certainty Terms to Chapter Key Findings ..............................................631
598 UK National Ecosystem Assessment: Technical Report
Key Findings*
* Each Key Finding has been assigned a level of scientific certainty, based on a 4-box model and complemented, where possible, with a likelihood scale. Superscript numbers and letters indicate the uncertainty term assigned to each finding. Full details of each term and how they were assigned are presented in Appendix 15.1.
Over the last 60 years, production from owned and managed resources has grown, but production from wild resources has declined. Policy, technology and market forces have all played a role, but policy has had the greatest impact. Its goal has sometimes been to maximise production (e.g. Common Agricultural Policy) and sometimes been to prevent overexploitation (e.g. Common Fisheries Policy). Some policies, such as agri-environment schemes, have aimed to reduce the environmental impacts of production.
It is unlikely that declines in environmental quality have reduced agricultural production levels, but overexploitation has harmed marine fish populations and some game species1.
1 well established
Over the last decade, the UK has produced more food per year from crops than at any other time in history. The area of land under crops increased in England from 3 million hectares (ha) in 1940 to 4.2 million ha in 2009, but crop areas declined in other regions of the UK: in Wales, for example, there was a 66% decrease over the same time period. The area of wheat trebled in England between 1940 and 2000, while crops such as oats, flax, turnips and vetches declined. Increases in the cropped area were driven by financial returns to farmers1, partially derived from the Common Agricultural Policy and partially from the market. The changes were facilitated by technologies such as more effective pesticides, mechanisation, varietal improvement and increased fertiliser use. Large increases in the productivity of all crops occurred between 1940 and 2008, as exemplified by average UK wheat yields which increased from 2.5 tonnes/hectare (t/ha) to 8 t/ha.
1 well established
Livestock productivity has increased, while animal numbers have fluctuated over time. Average milk yields increased from 3,500 litres/cow/year in 1960 to 7,000 litres/cow/year by 2009, and the average dressed carcass weight for steers increased from 267 kg in 1980 to 316 kg in 2003. These productivity gains have been accomplished through enhanced breeding and improved feeding regimes. Numbers of beef cattle peaked at 1.9 million in 1999, dairy cattle at 3.4 million in 1980 and sheep numbers peaked at 45 million in 2000. Numbers have fallen since these times. In 2009, the UK dairy herd comprised 1.8 million dairy cattle, while the national sheep flock was 33 million in 2008. Sheep numbers have fluctuated according to levels of financial support, while numbers of dairy cattle have been affected by market conditions for milk1. There has been a large increase in numbers of broiler chickens, largely due to the changed consumption patterns of UK consumers.
1 well established
The provision of food from marine fisheries is lower now than at any time in the last century. Landings into UK ports were around 1.2 million tonnes in 1948 and declined slightly to just over 1 million tonnes in 1970. The total weight of landings has declined steadily since that time and, in 2008, landings were only 538,000 tonnes. Large declines have been recorded in demersal species, and smaller declines in pelagic species. Pressure from fishing has reduced the size of fish stocks1; the development of new technology for finding and harvesting fish has enabled fishers to maintain higher catch rates and exploit new grounds. Production from aquaculture has increased over the last 20 years, especially in Scotland. In 1988, Scotland produced 18 tonnes of salmon from aquaculture, but by 2008, this had increased seven-fold to 128 tonnes.
1 well established
Ecosystem Services | Chapter 15: Provisioning Services 599
Some game species have shown major declines in numbers, while others have become more abundant and widespread. There were declines in the bags of red grouse and partridges between 1940 and 2009, but bags of pheasant increased. Changes in the management of farmland had a major impact on partridge numbers1. Deer are now more widespread than during the 1940s, and harvests have not shown any evidence of decline. After 1970, the numbers of wild caught salmon fell in Scotland to a low of less than 100,000 fish in 2006. Yet, in 2007, there was suggestion of an upturn when 91,053 salmon were caught by rod and line, which was the third largest catch by that method since 1952. Catches in England and Wales also declined from 1988, and, in 2006, less than 40,000 fish were caught by all methods. Capture at sea and estuarine netting have been largely responsible for declining numbers of spawning salmon2.
1 well established 2 established but incomplete evidence
Overall provision of timber has increased over the last 40 years, but major increases in softwood harvests mask declines in the harvest of hardwoods. The production of softwoods in the UK has increased steadily over the last 40 years. The total harvest of softwood was 8.6 million cubic metres (m3) in 2008, compared with less than 400,000 m3 of hardwood. Typically, around 60% of the softwood harvest is derived from Scotland. The increased harvest of softwood reflects the levels of deliberate and extensive planting that began on the national forest estate in the early part of the 20th Century. These were driven by policy needs and, later in the century, were reinforced by financial aid to landowners. The different trends in softwood and hardwood reflect the fact that softwoods are derived from plantation forests, while most hardwoods are derived from managed semi-natural woodlands. The total area of land used for peat extraction fell from 14,980 ha in 1994 to 10,690 ha in 2009. At a Great Britain scale, 1.6 million m3 of peat were sold in 1999 and 760,000 m3 in 2008.
The amount of water taken from ecosystems by the public water supply in the UK declined between 1990 and 2009. In 1990, 20 billion litres/day were taken by the public water supply in the UK. By 2008, this had declined to about 17 billion litres/day. The greatest declines occurred in England and Wales, with hardly any declines occurring in Scotland and Northern Ireland. Total levels of abstractions in England and Wales stayed more or less constant between 1995 and 2007. In Scotland, abstractions decreased between 2002–2003 and 2007–2008 by 4.5% to 2,387 megalitres/day in 2007–2008. Leakage was approximately 41% in Scotland in 2007–2008, but only 16% in England and Wales—down from 23% in the late 1990s. Decreased leakage in England and Wales is related to the privatisation of water supply and its associated legislative requirementsc. Water demand has decreased due to reduced demand from heavy industry1.
1 well establishedC likely
600 UK National Ecosystem Assessment: Technical Report
15.1 Introduction
Although it may not be as apparent now as in earlier periods of human history, the whole of the human economy is driven by the goods and services provided by ecosystems and natural resources. Minerals are derived from geological deposits. Gas, coal and oil come from ancient deposits of vegetative matter, while peat, biomass and wood fuel are derived from living and less ancient plants. Water for human consumption and industry is extracted from rivers and lakes, and timber comes from forests. Food and fibre are derived from managed agricultural ecosystems and are, to some extent, still harvested from more natural ecosystems.
The role that an ecosystem plays in providing any one of these goods is termed a ‘provisioning service’, and nowhere is the relationship between ecosystem services and human well-being more apparent than when considering provisioning services. Moreover, because of the direct relationship between the provision of food and fibre and its impact on the environment, nowhere is the risk of damage to ecosystems greater than when deriving provisioning services from nature. These impacts have tended to increase over time as the intensity of extraction from, and management of, ecosystems has increased. On some occasions, the introduction of new technologies has mitigated these impacts, for example, drip irrigation systems save water and reduce emissions of greenhouse gases from soils (Sanchez-Martin et al. 2008), while low ground pressure vehicles reduce soil compaction (Tijink et al. 2000). However, there have also been occasions when the introduction of new technologies has had adverse impacts on ecosystems, such as the excessive use of some pesticides (Cade et al. 1971; Potts et al. 2010). Unfortunately, it tends to be difficult to identify these adverse impacts before the technology is introduced as their use and impact is mediated by humans. As a result, there is a lag between introducing a technology, identifying a problem, and then undertaking action to reduce the problem. Thus the provision of food, fuel and fibre is a relationship between ecosystems and three sets of human actors: producers, consumers and regulators; and the dynamics of these relationships are mediated by politics, policy, technology and markets.
In this chapter, we are concerned with documenting the trends in supply of the goods provided by the UK’s ecosystems from 1945 to 2009, and in understanding how this provision has interacted with ecosystems and UK NEA Broad Habitats. The supply of these goods is dependent on many of the supporting and regulating services discussed elsewhere in this assessment (Chapter 13; Chapter 14). In addition, because of the historical and social aspects of producing food and fibre, there are also close links between provisioning and cultural services (Chapter 16). These include experiences with nature, landscapes and community, and also the sensory and social experiences of consumption (Laplace 2006; Chen 2009).
This chapter presents data on the provision of the following goods: food from agriculture; wild caught food (i.e. fish, honey, game); timber; fibre; peat; ornamental goods;
genetic resources; and water. We are not concerned with either fossil fuels or resources that are derived from mining or the provision of renewable energy. While some individuals may argue these resources are also supplied by ecosystem processes and should, therefore, be considered here, we decided that these were basically physical processes that do not interact sufficiently with extant plant and animal species to warrant inclusion in this ecosystem assessment (where ecosystems are defined as being an interaction of living and non-living entities).
15.1.2 Data Use and InterpretationMuch of the data presented here are derived from surveys undertaken by government and industry over many years. The use of such data in modern Britain presents several challenges. Firstly, there is a need to consider the provision of goods from all four countries in the UK. Secondly, there is a need to be aware of the limitations of the data that are available. While all four countries in the UK currently run separate administrations for many elements of government, e.g. agriculture and nature conservation, this has not always been the case. For this reason, individual, long-term data sets do not necessarily exist on all issues separately for all four countries, and there has been a need to use some form of aggregate data on some occasions. Also, not all four countries have put equivalent efforts into collecting, analysing and publishing data on all items of concern, and so, there are differences in the quality and quantity of data available for each country. Finally, even where long-term data are available on the supply of particular goods, there may have been changes in the way data were collected and/or analysed over the term of data collection. So while we seek to present the best available data on trends in the supply of goods, there are inevitably some deficiencies in the data presented here.
For the purposes of description, the amount of provisioning goods and services produced by the UK’s ecosystems are reported at the point of production and not at the point of processing or final use, i.e. yields of wheat are reported in tonnes/hectare (t/ha) and not in bags of flour or loaves of breads produced or purchased. The units used to describe levels of production vary between products, so for crops it is t/ha, for livestock it is numbers, while for bottled water it is litres. The historical trends in each service are presented first, followed by a discussion of the drivers of change for that service. The chapter concludes with a discussion of trade-offs, synergies and options for sustainable management of productive ecosystems, and a review of knowledge gaps relevant to the future delivery of provisioning services.
15.2 Food, Fibre and Energy from Agriculture
This section presents an historical perspective on food supply before considering trends in key agricultural outputs separately. Several of the topics discussed here are also
Ecosystem Services | Chapter 15: Provisioning Services 601
discussed in other chapters in this assessment. Some issues of grazing and grassland management are discussed in Chapters 5, 6 and 7, while Chapter 7 also considers the interaction of crop production and natural ecosystems.
15.2.1 Historical and Global Perspective on Food SupplySeveral factors interact when considering the supply of food over time. Firstly, it is necessary to consider the amount of land that is utilised to produce a particular food item. Secondly, it is necessary to consider the amount of that food item that is produced per unit of land, i.e. yield. Thirdly, the quality of the food item may vary nutritionally over time; therefore, the actual nutritional value of a food item in 1945 may not be exactly as it was in 2011 (Davis et al. 2004). Fourthly, the financial value of food items will vary over time. This is a function of inflation and real price changes brought about through variations in supply and demand, and occasionally through the impacts of policy (Harrison et al. 2010). Finally, it is important to remember that the production of food in the UK does not directly relate to the consumption of food by UK citizens. Some food items are produced in the UK and exported (such as Welsh lamb and Scotch whisky), while other foodstuffs consumed in the UK are produced overseas such as tropical fruits (Edwards-Jones et al. 2009).
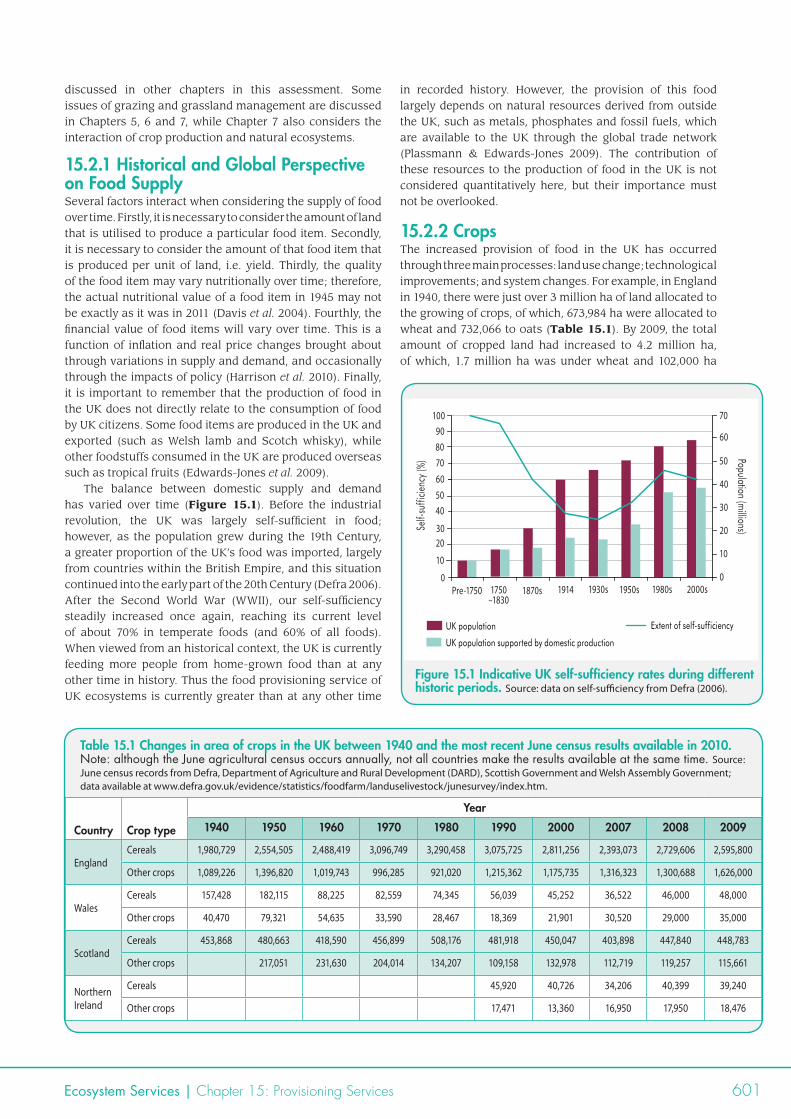
The balance between domestic supply and demand has varied over time (Figure 15.1). Before the industrial revolution, the UK was largely self-sufficient in food; however, as the population grew during the 19th Century, a greater proportion of the UK’s food was imported, largely from countries within the British Empire, and this situation continued into the early part of the 20th Century (Defra 2006). After the Second World War (WWII), our self-sufficiency steadily increased once again, reaching its current level of about 70% in temperate foods (and 60% of all foods). When viewed from an historical context, the UK is currently feeding more people from home-grown food than at any other time in history. Thus the food provisioning service of UK ecosystems is currently greater than at any other time
in recorded history. However, the provision of this food largely depends on natural resources derived from outside the UK, such as metals, phosphates and fossil fuels, which are available to the UK through the global trade network (Plassmann & Edwards-Jones 2009). The contribution of these resources to the production of food in the UK is not considered quantitatively here, but their importance must not be overlooked.
15.2.2 CropsThe increased provision of food in the UK has occurred through three main processes: land use change; technological improvements; and system changes. For example, in England in 1940, there were just over 3 million ha of land allocated to the growing of crops, of which, 673,984 ha were allocated to wheat and 732,066 to oats (Table 15.1). By 2009, the total amount of cropped land had increased to 4.2 million ha, of which, 1.7 million ha was under wheat and 102,000 ha
Figure 15.1 Indicative UK self-sufficiency rates during different historic periods. Source: data on self-sufficiency from Defra (2006).
Country Crop type
Year
1940 1950 1960 1970 1980 1990 2000 2007 2008 2009
EnglandCereals 1,980,729 2,554,505 2,488,419 3,096,749 3,290,458 3,075,725 2,811,256 2,393,073 2,729,606 2,595,800
Other crops 1,089,226 1,396,820 1,019,743 996,285 921,020 1,215,362 1,175,735 1,316,323 1,300,688 1,626,000
WalesCereals 157,428 182,115 88,225 82,559 74,345 56,039 45,252 36,522 46,000 48,000
Other crops 40,470 79,321 54,635 33,590 28,467 18,369 21,901 30,520 29,000 35,000
ScotlandCereals 453,868 480,663 418,590 456,899 508,176 481,918 450,047 403,898 447,840 448,783
Other crops 217,051 231,630 204,014 134,207 109,158 132,978 112,719 119,257 115,661
NorthernIreland
Cereals 45,920 40,726 34,206 40,399 39,240
Other crops 17,471 13,360 16,950 17,950 18,476
Table 15.1 Changes in area of crops in the UK between 1940 and the most recent June census results available in 2010. Note: although the June agricultural census occurs annually, not all countries make the results available at the same time. Source: June census records from Defra, Department of Agriculture and Rural Development (DARD), Scottish Government and Welsh Assembly Government; data available at www.defra.gov.uk/evidence/statistics/foodfarm/landuselivestock/junesurvey/index.htm.
0
20
40
90100
Self-
suffi
cienc
y (%)
Pre-1750 1750–1830
1914 1930s 1950s 1980s 2000s
30
10
50
7060
80
Population (millions)
10
60
70
0
20
40
30
50
1870s
UK population
UK population supported by domestic production
Extent of self-sufficiency
602 UK National Ecosystem Assessment: Technical Report
was under oats. One reason for the reduction in the amount of oats being grown in 2009, compared to 1940, relates to the transition from horses to tractors as the main source of agricultural power. Up until the widespread adoption of tractors in the late 1940s and 1950s, horses were used both as working animals on the farm and as transport for many rural families. This required that a considerable area of land be given to the production of oats and other crops suitable for their feed. As numbers of horses declined, so the land previously used to grow oats could be switched to other crops such as wheat.
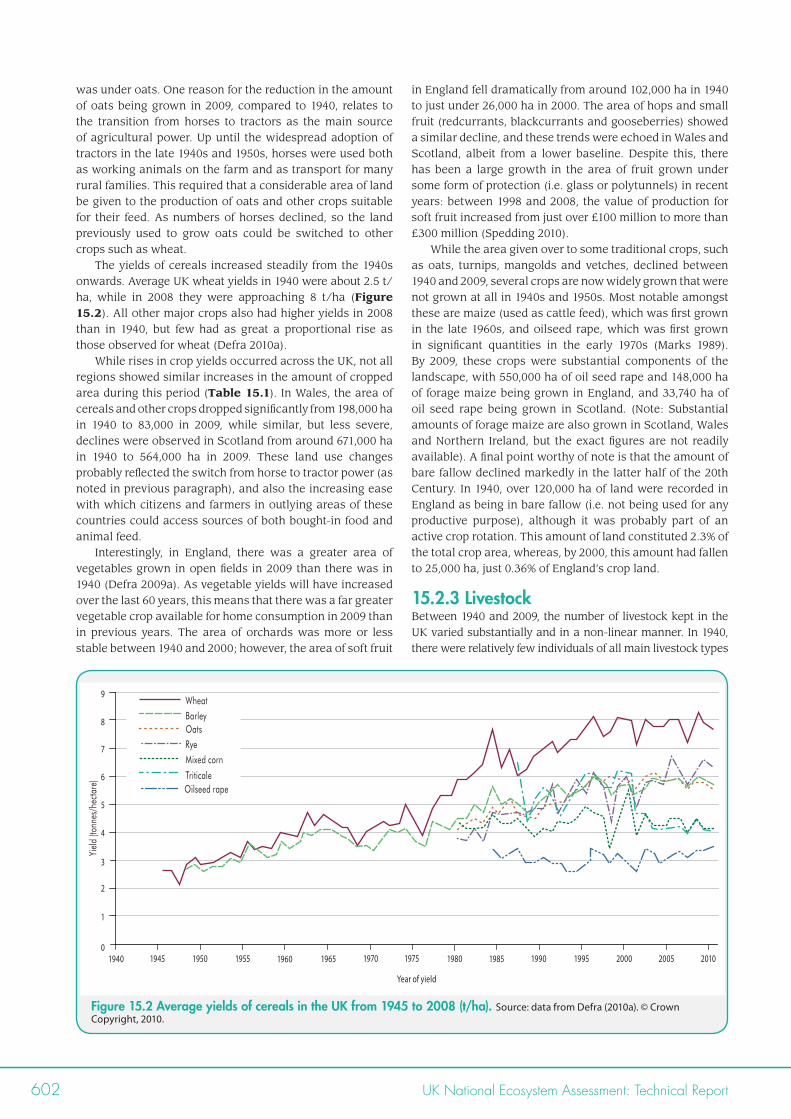
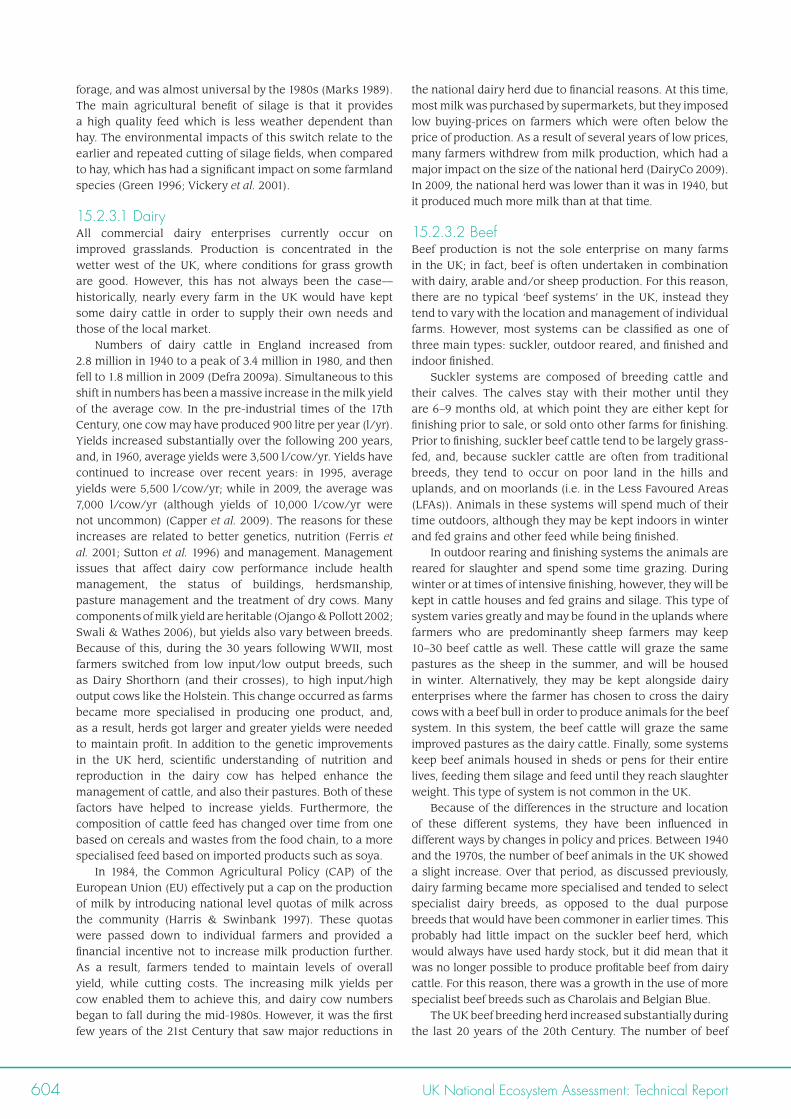
The yields of cereals increased steadily from the 1940s onwards. Average UK wheat yields in 1940 were about 2.5 t/ha, while in 2008 they were approaching 8 t/ha (Figure 15.2). All other major crops also had higher yields in 2008 than in 1940, but few had as great a proportional rise as those observed for wheat (Defra 2010a).
While rises in crop yields occurred across the UK, not all regions showed similar increases in the amount of cropped area during this period (Table 15.1). In Wales, the area of cereals and other crops dropped significantly from 198,000 ha in 1940 to 83,000 in 2009, while similar, but less severe, declines were observed in Scotland from around 671,000 ha in 1940 to 564,000 ha in 2009. These land use changes probably reflected the switch from horse to tractor power (as noted in previous paragraph), and also the increasing ease with which citizens and farmers in outlying areas of these countries could access sources of both bought-in food and animal feed.
Interestingly, in England, there was a greater area of vegetables grown in open fields in 2009 than there was in 1940 (Defra 2009a). As vegetable yields will have increased over the last 60 years, this means that there was a far greater vegetable crop available for home consumption in 2009 than in previous years. The area of orchards was more or less stable between 1940 and 2000; however, the area of soft fruit
in England fell dramatically from around 102,000 ha in 1940 to just under 26,000 ha in 2000. The area of hops and small fruit (redcurrants, blackcurrants and gooseberries) showed a similar decline, and these trends were echoed in Wales and Scotland, albeit from a lower baseline. Despite this, there has been a large growth in the area of fruit grown under some form of protection (i.e. glass or polytunnels) in recent years: between 1998 and 2008, the value of production for soft fruit increased from just over £100 million to more than £300 million (Spedding 2010).
While the area given over to some traditional crops, such as oats, turnips, mangolds and vetches, declined between 1940 and 2009, several crops are now widely grown that were not grown at all in 1940s and 1950s. Most notable amongst these are maize (used as cattle feed), which was first grown in the late 1960s, and oilseed rape, which was first grown in significant quantities in the early 1970s (Marks 1989). By 2009, these crops were substantial components of the landscape, with 550,000 ha of oil seed rape and 148,000 ha of forage maize being grown in England, and 33,740 ha of oil seed rape being grown in Scotland. (Note: Substantial amounts of forage maize are also grown in Scotland, Wales and Northern Ireland, but the exact figures are not readily available). A final point worthy of note is that the amount of bare fallow declined markedly in the latter half of the 20th Century. In 1940, over 120,000 ha of land were recorded in England as being in bare fallow (i.e. not being used for any productive purpose), although it was probably part of an active crop rotation. This amount of land constituted 2.3% of the total crop area, whereas, by 2000, this amount had fallen to 25,000 ha, just 0.36% of England’s crop land.
15.2.3 LivestockBetween 1940 and 2009, the number of livestock kept in the UK varied substantially and in a non-linear manner. In 1940, there were relatively few individuals of all main livestock types
Figure 15.2 Average yields of cereals in the UK from 1945 to 2008 (t/ha). Source: data from Defra (2010a). © Crown Copyright, 2010.
0
2
4
9
Yiel
d (to
nnes
/hec
tare
)
1940 1945 1955 1960 1965 1970 1975
3
1
5
7
6
8
1950
Year of yield
1980 1990 1995 2000 2005 20101985
WheatBarleyOatsRyeMixed corn
TriticaleOilseed rape
Ecosystem Services | Chapter 15: Provisioning Services 603
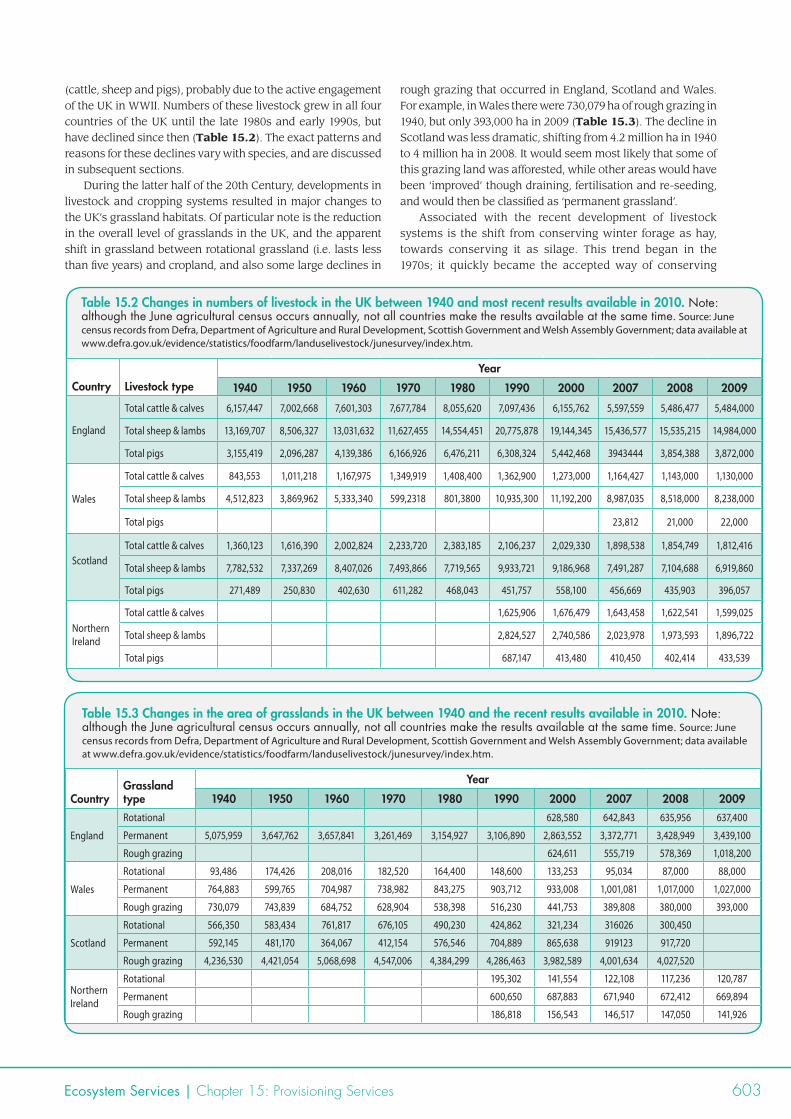
(cattle, sheep and pigs), probably due to the active engagement of the UK in WWII. Numbers of these livestock grew in all four countries of the UK until the late 1980s and early 1990s, but have declined since then (Table 15.2). The exact patterns and reasons for these declines vary with species, and are discussed in subsequent sections.
During the latter half of the 20th Century, developments in livestock and cropping systems resulted in major changes to the UK’s grassland habitats. Of particular note is the reduction in the overall level of grasslands in the UK, and the apparent shift in grassland between rotational grassland (i.e. lasts less than five years) and cropland, and also some large declines in
rough grazing that occurred in England, Scotland and Wales. For example, in Wales there were 730,079 ha of rough grazing in 1940, but only 393,000 ha in 2009 (Table 15.3). The decline in Scotland was less dramatic, shifting from 4.2 million ha in 1940 to 4 million ha in 2008. It would seem most likely that some of this grazing land was afforested, while other areas would have been ‘improved’ though draining, fertilisation and re-seeding, and would then be classified as ‘permanent grassland’.
Associated with the recent development of livestock systems is the shift from conserving winter forage as hay, towards conserving it as silage. This trend began in the 1970s; it quickly became the accepted way of conserving
Table 15.2 Changes in numbers of livestock in the UK between 1940 and most recent results available in 2010. Note: although the June agricultural census occurs annually, not all countries make the results available at the same time. Source: June census records from Defra, Department of Agriculture and Rural Development, Scottish Government and Welsh Assembly Government; data available at www.defra.gov.uk/evidence/statistics/foodfarm/landuselivestock/junesurvey/index.htm.
Country Livestock typeYear
1940 1950 1960 1970 1980 1990 2000 2007 2008 2009
England
Total cattle & calves 6,157,447 7,002,668 7,601,303 7,677,784 8,055,620 7,097,436 6,155,762 5,597,559 5,486,477 5,484,000
Total sheep & lambs 13,169,707 8,506,327 13,031,632 11,627,455 14,554,451 20,775,878 19,144,345 15,436,577 15,535,215 14,984,000
Total pigs 3,155,419 2,096,287 4,139,386 6,166,926 6,476,211 6,308,324 5,442,468 3943444 3,854,388 3,872,000
Wales
Total cattle & calves 843,553 1,011,218 1,167,975 1,349,919 1,408,400 1,362,900 1,273,000 1,164,427 1,143,000 1,130,000
Total sheep & lambs 4,512,823 3,869,962 5,333,340 599,2318 801,3800 10,935,300 11,192,200 8,987,035 8,518,000 8,238,000
Total pigs 23,812 21,000 22,000
ScotlandTotal cattle & calves 1,360,123 1,616,390 2,002,824 2,233,720 2,383,185 2,106,237 2,029,330 1,898,538 1,854,749 1,812,416
Total sheep & lambs 7,782,532 7,337,269 8,407,026 7,493,866 7,719,565 9,933,721 9,186,968 7,491,287 7,104,688 6,919,860
Total pigs 271,489 250,830 402,630 611,282 468,043 451,757 558,100 456,669 435,903 396,057
Northern Ireland
Total cattle & calves 1,625,906 1,676,479 1,643,458 1,622,541 1,599,025
Total sheep & lambs 2,824,527 2,740,586 2,023,978 1,973,593 1,896,722
Total pigs 687,147 413,480 410,450 402,414 433,539
Table 15.3 Changes in the area of grasslands in the UK between 1940 and the recent results available in 2010. Note: although the June agricultural census occurs annually, not all countries make the results available at the same time. Source: June census records from Defra, Department of Agriculture and Rural Development, Scottish Government and Welsh Assembly Government; data available at www.defra.gov.uk/evidence/statistics/foodfarm/landuselivestock/junesurvey/index.htm.
CountryGrassland type
Year
1940 1950 1960 1970 1980 1990 2000 2007 2008 2009
England
Rotational 628,580 642,843 635,956 637,400
Permanent 5,075,959 3,647,762 3,657,841 3,261,469 3,154,927 3,106,890 2,863,552 3,372,771 3,428,949 3,439,100
Rough grazing 624,611 555,719 578,369 1,018,200
Wales
Rotational 93,486 174,426 208,016 182,520 164,400 148,600 133,253 95,034 87,000 88,000
Permanent 764,883 599,765 704,987 738,982 843,275 903,712 933,008 1,001,081 1,017,000 1,027,000
Rough grazing 730,079 743,839 684,752 628,904 538,398 516,230 441,753 389,808 380,000 393,000
Scotland
Rotational 566,350 583,434 761,817 676,105 490,230 424,862 321,234 316026 300,450
Permanent 592,145 481,170 364,067 412,154 576,546 704,889 865,638 919123 917,720
Rough grazing 4,236,530 4,421,054 5,068,698 4,547,006 4,384,299 4,286,463 3,982,589 4,001,634 4,027,520
Northern Ireland
Rotational 195,302 141,554 122,108 117,236 120,787
Permanent 600,650 687,883 671,940 672,412 669,894
Rough grazing 186,818 156,543 146,517 147,050 141,926
604 UK National Ecosystem Assessment: Technical Report
forage, and was almost universal by the 1980s (Marks 1989). The main agricultural benefit of silage is that it provides a high quality feed which is less weather dependent than hay. The environmental impacts of this switch relate to the earlier and repeated cutting of silage fields, when compared to hay, which has had a significant impact on some farmland species (Green 1996; Vickery et al. 2001).
15.2.3.1 DairyAll commercial dairy enterprises currently occur on improved grasslands. Production is concentrated in the wetter west of the UK, where conditions for grass growth are good. However, this has not always been the case—historically, nearly every farm in the UK would have kept some dairy cattle in order to supply their own needs and those of the local market.
Numbers of dairy cattle in England increased from 2.8 million in 1940 to a peak of 3.4 million in 1980, and then fell to 1.8 million in 2009 (Defra 2009a). Simultaneous to this shift in numbers has been a massive increase in the milk yield of the average cow. In the pre-industrial times of the 17th Century, one cow may have produced 900 litre per year (l/yr). Yields increased substantially over the following 200 years, and, in 1960, average yields were 3,500 l/cow/yr. Yields have continued to increase over recent years: in 1995, average yields were 5,500 l/cow/yr; while in 2009, the average was 7,000 l/cow/yr (although yields of 10,000 l/cow/yr were not uncommon) (Capper et al. 2009). The reasons for these increases are related to better genetics, nutrition (Ferris et al. 2001; Sutton et al. 1996) and management. Management issues that affect dairy cow performance include health management, the status of buildings, herdsmanship, pasture management and the treatment of dry cows. Many components of milk yield are heritable (Ojango & Pollott 2002; Swali & Wathes 2006), but yields also vary between breeds. Because of this, during the 30 years following WWII, most farmers switched from low input/low output breeds, such as Dairy Shorthorn (and their crosses), to high input/high output cows like the Holstein. This change occurred as farms became more specialised in producing one product, and, as a result, herds got larger and greater yields were needed to maintain profit. In addition to the genetic improvements in the UK herd, scientific understanding of nutrition and reproduction in the dairy cow has helped enhance the management of cattle, and also their pastures. Both of these factors have helped to increase yields. Furthermore, the composition of cattle feed has changed over time from one based on cereals and wastes from the food chain, to a more specialised feed based on imported products such as soya.
In 1984, the Common Agricultural Policy (CAP) of the European Union (EU) effectively put a cap on the production of milk by introducing national level quotas of milk across the community (Harris & Swinbank 1997). These quotas were passed down to individual farmers and provided a financial incentive not to increase milk production further. As a result, farmers tended to maintain levels of overall yield, while cutting costs. The increasing milk yields per cow enabled them to achieve this, and dairy cow numbers began to fall during the mid-1980s. However, it was the first few years of the 21st Century that saw major reductions in
the national dairy herd due to financial reasons. At this time, most milk was purchased by supermarkets, but they imposed low buying-prices on farmers which were often below the price of production. As a result of several years of low prices, many farmers withdrew from milk production, which had a major impact on the size of the national herd (DairyCo 2009). In 2009, the national herd was lower than it was in 1940, but it produced much more milk than at that time.
15.2.3.2 BeefBeef production is not the sole enterprise on many farms in the UK; in fact, beef is often undertaken in combination with dairy, arable and/or sheep production. For this reason, there are no typical ‘beef systems’ in the UK, instead they tend to vary with the location and management of individual farms. However, most systems can be classified as one of three main types: suckler, outdoor reared, and finished and indoor finished.
Suckler systems are composed of breeding cattle and their calves. The calves stay with their mother until they are 6–9 months old, at which point they are either kept for finishing prior to sale, or sold onto other farms for finishing. Prior to finishing, suckler beef cattle tend to be largely grass-fed, and, because suckler cattle are often from traditional breeds, they tend to occur on poor land in the hills and uplands, and on moorlands (i.e. in the Less Favoured Areas (LFAs)). Animals in these systems will spend much of their time outdoors, although they may be kept indoors in winter and fed grains and other feed while being finished.
In outdoor rearing and finishing systems the animals are reared for slaughter and spend some time grazing. During winter or at times of intensive finishing, however, they will be kept in cattle houses and fed grains and silage. This type of system varies greatly and may be found in the uplands where farmers who are predominantly sheep farmers may keep 10–30 beef cattle as well. These cattle will graze the same pastures as the sheep in the summer, and will be housed in winter. Alternatively, they may be kept alongside dairy enterprises where the farmer has chosen to cross the dairy cows with a beef bull in order to produce animals for the beef system. In this system, the beef cattle will graze the same improved pastures as the dairy cattle. Finally, some systems keep beef animals housed in sheds or pens for their entire lives, feeding them silage and feed until they reach slaughter weight. This type of system is not common in the UK.
Because of the differences in the structure and location of these different systems, they have been influenced in different ways by changes in policy and prices. Between 1940 and the 1970s, the number of beef animals in the UK showed a slight increase. Over that period, as discussed previously, dairy farming became more specialised and tended to select specialist dairy breeds, as opposed to the dual purpose breeds that would have been commoner in earlier times. This probably had little impact on the suckler beef herd, which would always have used hardy stock, but it did mean that it was no longer possible to produce profitable beef from dairy cattle. For this reason, there was a growth in the use of more specialist beef breeds such as Charolais and Belgian Blue.
The UK beef breeding herd increased substantially during the last 20 years of the 20th Century. The number of beef
Ecosystem Services | Chapter 15: Provisioning Services 605
cows was 1,478,000 in 1980, and grew to a peak of 1,924,000 in 1999. Increases in the English beef herd were particularly noticeable, with numbers increasing by 45% between 1981 and 1995. However, the overall number of animals marketed for beef between 1980 and 2005 fell by nearly 50%, although the average dressed carcass weight for steers increased from 267 kg in 1980 to 316 kg in 2003 (Mead 2003).
The decline in the number of animals marketed for beef seen during this period was a result of the decline in the dairy herd, which had, until that time, provided over 40% of beef. As with the beef herd, the dairy herd was affected by policies relating to the control of Bovine Spongiform Encephalitis (BSE) and the impact of Foot and Mouth Disease in 2001 (Chapter 14). Following the BSE outbreak, export markets for UK beef were closed. As a result, both demand and prices fell and a high proportion of dairy cross calves, which had previously gone for beef production, were disposed of on-farm. In addition, a related policy, the Over Thirty-Month Scheme (OTMS), required that no cattle over 30 months entered the human food chain, removing many cattle that may have otherwise gone into beef production.
Subsequently, the continued decline in dairy cow numbers has reduced the production of calves that can enter the beef herd. In addition, recent changes in the CAP have reduced the profitability of many suckler beef herds, causing a decline in their numbers. However, in some areas, the extent of these shifts has been counteracted by the support available under agri-environment schemes for grazing by traditional breeds on mountains, moorlands and some coastal regions (Defra 2010b).
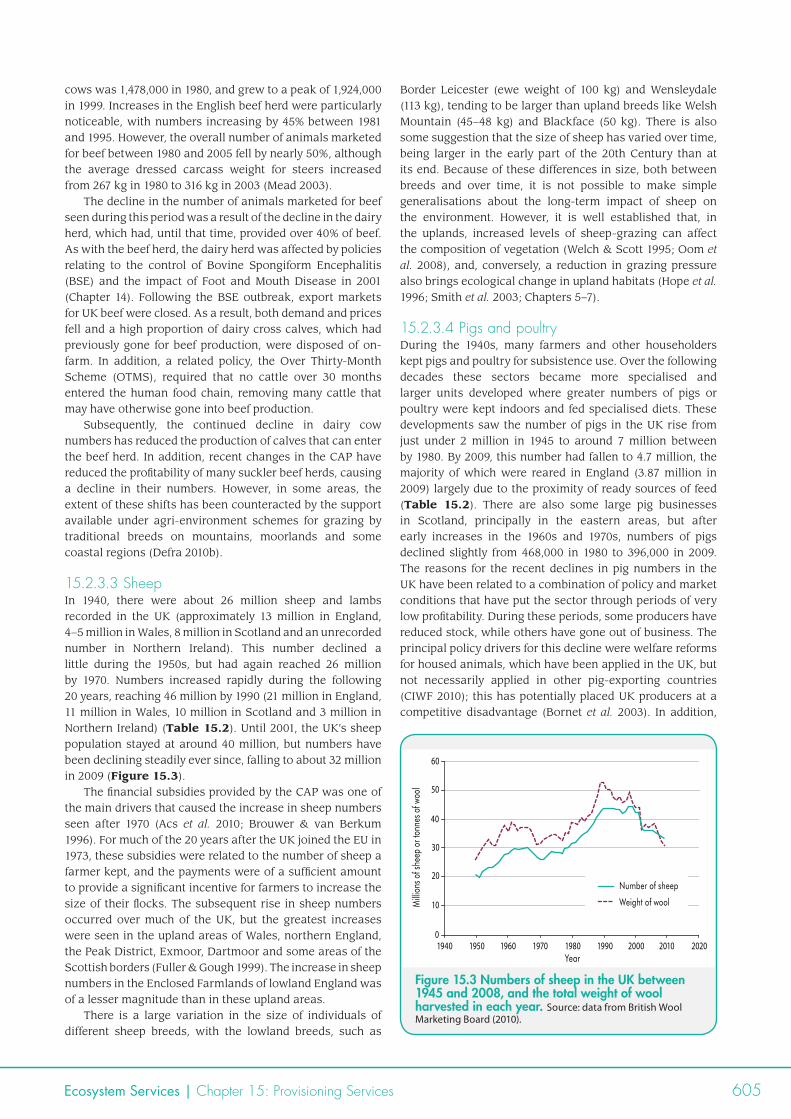
15.2.3.3 SheepIn 1940, there were about 26 million sheep and lambs recorded in the UK (approximately 13 million in England, 4–5 million in Wales, 8 million in Scotland and an unrecorded number in Northern Ireland). This number declined a little during the 1950s, but had again reached 26 million by 1970. Numbers increased rapidly during the following 20 years, reaching 46 million by 1990 (21 million in England, 11 million in Wales, 10 million in Scotland and 3 million in Northern Ireland) (Table 15.2). Until 2001, the UK’s sheep population stayed at around 40 million, but numbers have been declining steadily ever since, falling to about 32 million in 2009 (Figure 15.3).
The financial subsidies provided by the CAP was one of the main drivers that caused the increase in sheep numbers seen after 1970 (Acs et al. 2010; Brouwer & van Berkum 1996). For much of the 20 years after the UK joined the EU in 1973, these subsidies were related to the number of sheep a farmer kept, and the payments were of a sufficient amount to provide a significant incentive for farmers to increase the size of their flocks. The subsequent rise in sheep numbers occurred over much of the UK, but the greatest increases were seen in the upland areas of Wales, northern England, the Peak District, Exmoor, Dartmoor and some areas of the Scottish borders (Fuller & Gough 1999). The increase in sheep numbers in the Enclosed Farmlands of lowland England was of a lesser magnitude than in these upland areas.
There is a large variation in the size of individuals of different sheep breeds, with the lowland breeds, such as
Border Leicester (ewe weight of 100 kg) and Wensleydale (113 kg), tending to be larger than upland breeds like Welsh Mountain (45–48 kg) and Blackface (50 kg). There is also some suggestion that the size of sheep has varied over time, being larger in the early part of the 20th Century than at its end. Because of these differences in size, both between breeds and over time, it is not possible to make simple generalisations about the long-term impact of sheep on the environment. However, it is well established that, in the uplands, increased levels of sheep-grazing can affect the composition of vegetation (Welch & Scott 1995; Oom et al. 2008), and, conversely, a reduction in grazing pressure also brings ecological change in upland habitats (Hope et al. 1996; Smith et al. 2003; Chapters 5–7).
15.2.3.4 Pigs and poultryDuring the 1940s, many farmers and other householders kept pigs and poultry for subsistence use. Over the following decades these sectors became more specialised and larger units developed where greater numbers of pigs or poultry were kept indoors and fed specialised diets. These developments saw the number of pigs in the UK rise from just under 2 million in 1945 to around 7 million between by 1980. By 2009, this number had fallen to 4.7 million, the majority of which were reared in England (3.87 million in 2009) largely due to the proximity of ready sources of feed (Table 15.2). There are also some large pig businesses in Scotland, principally in the eastern areas, but after early increases in the 1960s and 1970s, numbers of pigs declined slightly from 468,000 in 1980 to 396,000 in 2009. The reasons for the recent declines in pig numbers in the UK have been related to a combination of policy and market conditions that have put the sector through periods of very low profitability. During these periods, some producers have reduced stock, while others have gone out of business. The principal policy drivers for this decline were welfare reforms for housed animals, which have been applied in the UK, but not necessarily applied in other pig-exporting countries (CIWF 2010); this has potentially placed UK producers at a competitive disadvantage (Bornet et al. 2003). In addition,
0
20
30
40
50
60
1940 1950 1960 1970 1980 1990 2000 2010 2020Year
Milli
ons o
f she
ep o
r ton
nes o
f woo
l
10
Number of sheep
Weight of wool
Figure 15.3 Numbers of sheep in the UK between 1945 and 2008, and the total weight of wool harvested in each year. Source: data from British Wool Marketing Board (2010).
606 UK National Ecosystem Assessment: Technical Report
fluctuations in the exchange rate and the price of animal feed and energy can have large impacts on the profitability of pigs and poultry (de Lange 1999), and it is well established that there are economies of scale to be gained in the pig sector. As a result, recent increases in the prices of inputs have adversely affected smaller producers in particular.
The poultry industry has followed a very similar pattern to that of the pig industry, moving from a population of 60 million birds in 1945 to 166 million in 2008 (Defra 2009a). In 2008, about 30 million birds were kept for laying, which produced about 868 million eggs in that year. The majority of the remainder are chickens kept for meat, but there are also about 12 million head of other poultry types in the UK such as geese, ducks and turkeys.
The poultry sector is comprised of some very large enterprises which specialise in raising either broilers (poultry for meat) or eggs, and some smaller ones which tend to offer the highest welfare standards and sell their produce for a premium. Although there has typically been a preponderance of poultry enterprises in the east of the England and Scotland, a significant number of poultry are also bred in both Wales and Northern Ireland.
Generally, large-scale pig and poultry units have little interaction with the natural environment, apart from the production of odours and waste disposal (Nicholson et al. 2002). The disposal of wastes from both pigs and poultry can be problematic, but uses for these wastes are currently being researched and include using chicken manure in composts (White 2000) and using pig and chicken manure in aerobic and anaerobic energy systems (Boersma et al. 1981; Tait et al. 2009). However, in recent years, there has been an increase in the number of pigs that are kept outside for at least some of their lives. These enterprises tend to do best on well-drained soils, such as sand and chalk, and, in cases where pigs are kept on a field for a year or two, can be viewed as part of the arable rotation. The environmental impact of such pig units is not well studied, but they may have negative interactions with soil and water quality (Worthington et al. 1992; Haygarth et al. 2009).
15.2.4 Fibre from AgricultureIn the UK, fibre for textiles and ropes has traditionally been derived from wool, flax and hemp. Historically, hemp was used to make ropes and flax was used to make linen, but modern uses focus more on their potential as components of building materials and plastics (Dimmock et al. 2005; Yates 2006). Nearly 11,000 ha of flax were grown in England in 1940, but, by the early 21st Century, plantings of this crop had dropped to almost nothing. In 2000, more than 11,000ha of flax were once again reported growing (Defra 2009a). However, this revival was short-lived as no flax was reported to be grown in 2009.
Hemp for industrial use has been grown in England and Wales since the mid-1990s (Dimmock et al. 2005). Up until that time, the growing of hemp had been banned in the UK under the Misuse of Drugs Act 1971. Varieties of hemp with low levels of THC (Tetrahydrocannabinol: the psychoactive drug in Cannabis) were developed in Europe, and, in 1993, legal agreement was given to grow low-THC hemp in the UK. Currently, UK hemp is processed and used in a range of agricultural and industrial products.
The surge in area of flax and hemp grown in the late 1990s and early 2000s reflected both the development of processing facilities in the UK and active financial support for these crops from the CAP. This level of support was subsequently removed from these crops, resulting in a reduction in growing area in the UK.
Sheep’s wool can be used for making clothes, carpets, felt, tweeds, furniture and insulation. In 2009, the UK was the seventh largest producer of wool in the world, responsible for about 2% of global production and exporting considerable amounts of wool. The amount of wool harvested in the UK is closely related to the number of sheep in the country. For this reason, the amount of wool harvested in 1950 was 26 million kg (from about 20 million sheep), while in 1998 it was 49 million kg from 44 million sheep (British Wool Marketing Board website; www.britishwool.org.uk). However, the quality of the wool varies between breeds. Some breeds, such as the Blue Faced Leicester, have fine wool, while others, such as some of the more hardy breeds typical of mountainous areas, produce only a small amount of poor quality wool. The financial returns from wool are relatively low, and few UK farmers would consider sheep wool as a major product. However, some of the specialist farmers of fine wool from other species, such as goats and Angora rabbits, may consider their fleeces as major products.
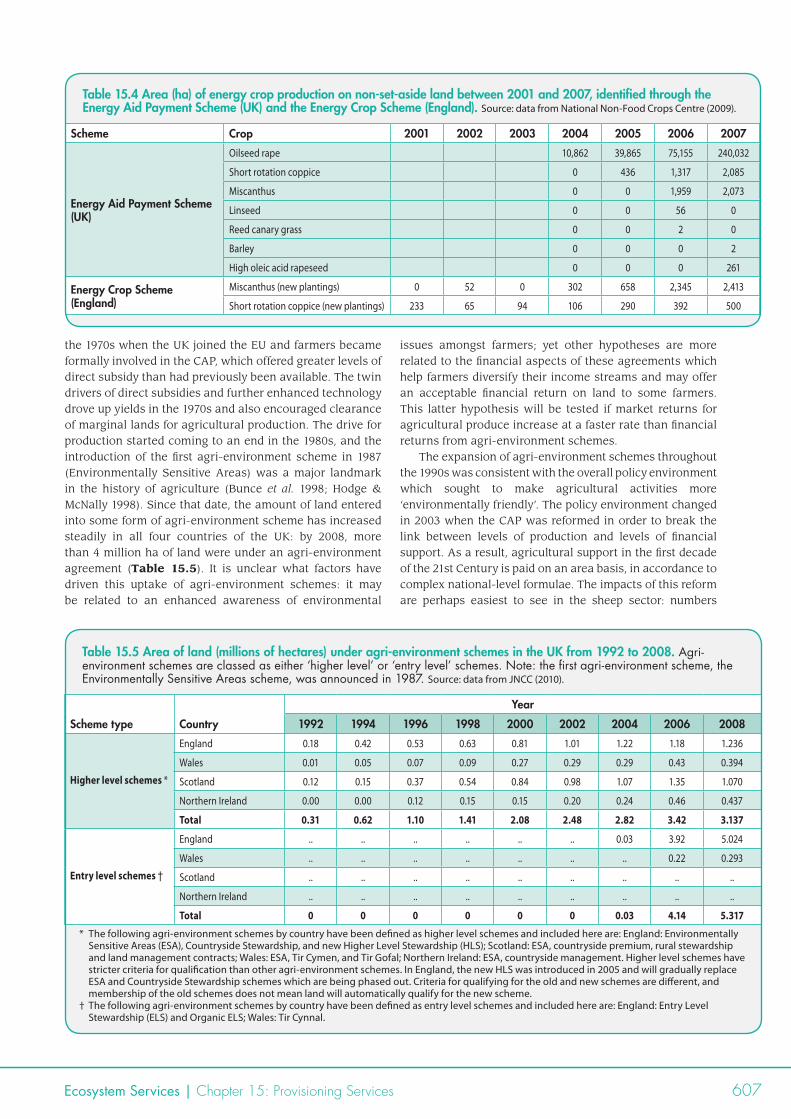
15.2.5 Biomass and BioenergyAt the turn of the 20th Century, almost no biomass crops were grown commercially in the UK. Yet, in 2005, 436 ha of short-rotation coppice willow were recorded in the UK, and, by 2007, this had increased five-fold (Table 15.4). Similar increases were noted in Miscanthus and reed canary grass over the same time-scale, both of which are grown for biomass. However, the most commonly grown crop for bioenergy is oilseed rape, with the area planted in the UK increasing from 10,863 ha in 2004 to 240,032 ha in 2007 (Table 15.3).
Plantings for biomass and bioenergy have largely been driven by a combination of market opportunity and policy. Relevant policies are not necessarily agricultural, but contain incentives for energy generators to include a certain proportion of renewable materials in their feed stocks, and for some large establishments to have biomass boilers. This demand has led energy providers to offer contracts to farmers to supply biomass. As transport costs can be substantial for biomass crops, such schemes tend to stimulate farmers in the immediate locality of the power plant, rather than benefiting all farmers across the nation.
15.2.6 Drivers of Change in AgricultureAgricultural production has typically been driven by three main factors: market price, the policy environment and technological change. For much of the period between 1945 and 1960, the predominant policy was to increase food output in order to provide adequate supplies to the UK’s population during the post-war years. At the same time, new technologies were becoming available, such as chemical pesticides, mechanisation and new crop varieties, enabling farmers to realise increased yields. This trend continued through the 1960s, and was further energised in
Ecosystem Services | Chapter 15: Provisioning Services 607
the 1970s when the UK joined the EU and farmers became formally involved in the CAP, which offered greater levels of direct subsidy than had previously been available. The twin drivers of direct subsidies and further enhanced technology drove up yields in the 1970s and also encouraged clearance of marginal lands for agricultural production. The drive for production started coming to an end in the 1980s, and the introduction of the first agri-environment scheme in 1987 (Environmentally Sensitive Areas) was a major landmark in the history of agriculture (Bunce et al. 1998; Hodge & McNally 1998). Since that date, the amount of land entered into some form of agri-environment scheme has increased steadily in all four countries of the UK: by 2008, more than 4 million ha of land were under an agri-environment agreement (Table 15.5). It is unclear what factors have driven this uptake of agri-environment schemes: it may be related to an enhanced awareness of environmental
issues amongst farmers; yet other hypotheses are more related to the financial aspects of these agreements which help farmers diversify their income streams and may offer an acceptable financial return on land to some farmers. This latter hypothesis will be tested if market returns for agricultural produce increase at a faster rate than financial returns from agri-environment schemes.
The expansion of agri-environment schemes throughout the 1990s was consistent with the overall policy environment which sought to make agricultural activities more ‘environmentally friendly’. The policy environment changed in 2003 when the CAP was reformed in order to break the link between levels of production and levels of financial support. As a result, agricultural support in the first decade of the 21st Century is paid on an area basis, in accordance to complex national-level formulae. The impacts of this reform are perhaps easiest to see in the sheep sector: numbers
Table 15.4 Area (ha) of energy crop production on non-set-aside land between 2001 and 2007, identified through the Energy Aid Payment Scheme (UK) and the Energy Crop Scheme (England). Source: data from National Non-Food Crops Centre (2009).
Scheme Crop 2001 2002 2003 2004 2005 2006 2007
Energy Aid Payment Scheme (UK)
Oilseed rape 10,862 39,865 75,155 240,032
Short rotation coppice 0 436 1,317 2,085
Miscanthus 0 0 1,959 2,073
Linseed 0 0 56 0
Reed canary grass 0 0 2 0
Barley 0 0 0 2
High oleic acid rapeseed 0 0 0 261
Energy Crop Scheme (England)
Miscanthus (new plantings) 0 52 0 302 658 2,345 2,413
Short rotation coppice (new plantings) 233 65 94 106 290 392 500
Table 15.5 Area of land (millions of hectares) under agri-environment schemes in the UK from 1992 to 2008. Agri-environment schemes are classed as either ‘higher level’ or ‘entry level’ schemes. Note: the first agri-environment scheme, the Environmentally Sensitive Areas scheme, was announced in 1987. Source: data from JNCC (2010).
Scheme type Country
Year
1992 1994 1996 1998 2000 2002 2004 2006 2008
Higher level schemes *
England 0.18 0.42 0.53 0.63 0.81 1.01 1.22 1.18 1.236
Wales 0.01 0.05 0.07 0.09 0.27 0.29 0.29 0.43 0.394
Scotland 0.12 0.15 0.37 0.54 0.84 0.98 1.07 1.35 1.070
Northern Ireland 0.00 0.00 0.12 0.15 0.15 0.20 0.24 0.46 0.437
Total 0.31 0.62 1.10 1.41 2.08 2.48 2.82 3.42 3.137
Entry level schemes †
England .. .. .. .. .. .. 0.03 3.92 5.024
Wales .. .. .. .. .. .. .. 0.22 0.293
Scotland .. .. .. .. .. .. .. .. ..
Northern Ireland .. .. .. .. .. .. .. .. ..
Total 0 0 0 0 0 0 0.03 4.14 5.317
* The following agri-environment schemes by country have been defined as higher level schemes and included here are: England: Environmentally Sensitive Areas (ESA), Countryside Stewardship, and new Higher Level Stewardship (HLS); Scotland: ESA, countryside premium, rural stewardship and land management contracts; Wales: ESA, Tir Cymen, and Tir Gofal; Northern Ireland: ESA, countryside management. Higher level schemes have stricter criteria for qualification than other agri-environment schemes. In England, the new HLS was introduced in 2005 and will gradually replace ESA and Countryside Stewardship schemes which are being phased out. Criteria for qualifying for the old and new schemes are different, and membership of the old schemes does not mean land will automatically qualify for the new scheme.
† The following agri-environment schemes by country have been defined as entry level schemes and included here are: England: Entry Level Stewardship (ELS) and Organic ELS; Wales: Tir Cynnal.
608 UK National Ecosystem Assessment: Technical Report
declined between 2000 and 2009 despite the existence of relatively good market prices for lamb (Table 15.2).
Outbreaks of livestock disease and zoonoses, such as Salmonella, BSE, Newcastle Disease, Bovine Tuberculosis (bTB) and Foot and Mouth, have also had impacts on the livestock sector throughout the last 60 years. While outbreaks of Foot and Mouth Disease were relatively common during the first 60 years of the 20th Century (Woods 2004), perhaps the most important outbreaks occurred in 1966 and 2001. The former was a large outbreak that, in many ways, spurred some farmers in the dairy sector to modernise their systems and enhance the genetic potential of their stock. The second outbreak was important for at least two reasons: firstly, it raised the level of public debate about the social acceptability of different disease control mechanisms, specifically culling versus vaccination; and secondly, it showed that the economic benefits of the countryside were more dependent on tourism and recreation than previously thought (Donaldson et al. 2002; Phillipson et al. 2004).
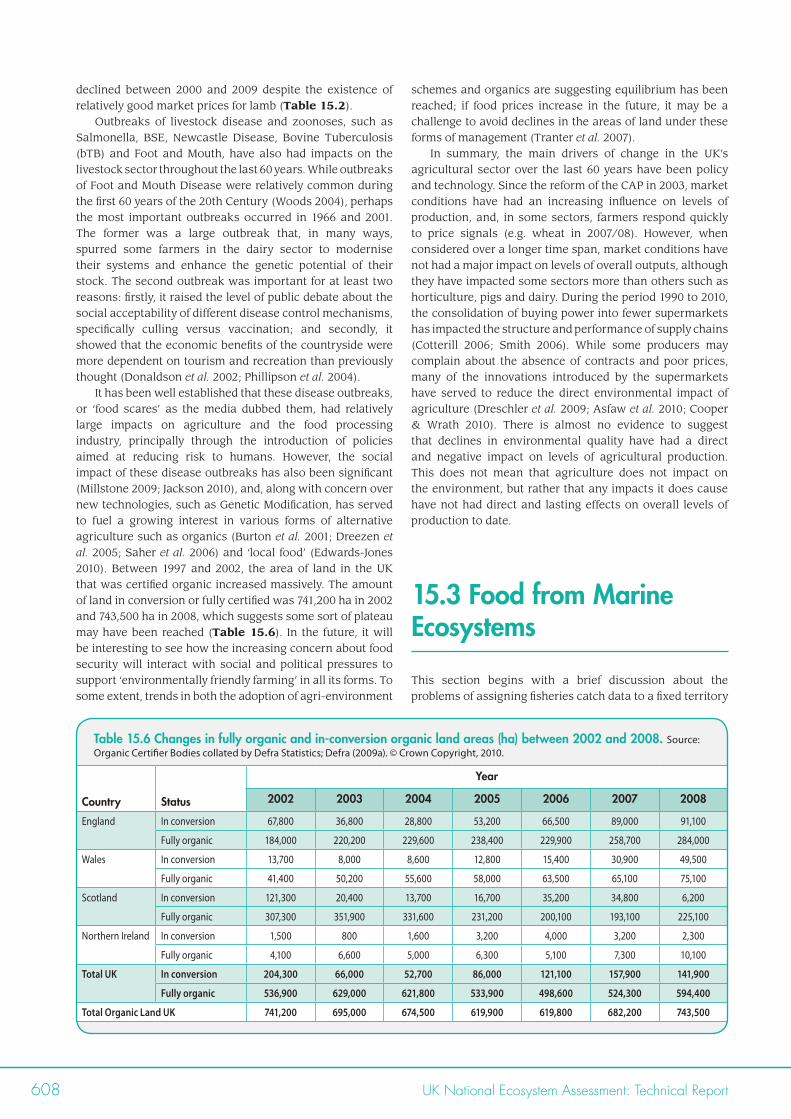
It has been well established that these disease outbreaks, or ‘food scares’ as the media dubbed them, had relatively large impacts on agriculture and the food processing industry, principally through the introduction of policies aimed at reducing risk to humans. However, the social impact of these disease outbreaks has also been significant (Millstone 2009; Jackson 2010), and, along with concern over new technologies, such as Genetic Modification, has served to fuel a growing interest in various forms of alternative agriculture such as organics (Burton et al. 2001; Dreezen et al. 2005; Saher et al. 2006) and ‘local food’ (Edwards-Jones 2010). Between 1997 and 2002, the area of land in the UK that was certified organic increased massively. The amount of land in conversion or fully certified was 741,200 ha in 2002 and 743,500 ha in 2008, which suggests some sort of plateau may have been reached (Table 15.6). In the future, it will be interesting to see how the increasing concern about food security will interact with social and political pressures to support ‘environmentally friendly farming’ in all its forms. To some extent, trends in both the adoption of agri-environment
schemes and organics are suggesting equilibrium has been reached; if food prices increase in the future, it may be a challenge to avoid declines in the areas of land under these forms of management (Tranter et al. 2007).
In summary, the main drivers of change in the UK’s agricultural sector over the last 60 years have been policy and technology. Since the reform of the CAP in 2003, market conditions have had an increasing influence on levels of production, and, in some sectors, farmers respond quickly to price signals (e.g. wheat in 2007/08). However, when considered over a longer time span, market conditions have not had a major impact on levels of overall outputs, although they have impacted some sectors more than others such as horticulture, pigs and dairy. During the period 1990 to 2010, the consolidation of buying power into fewer supermarkets has impacted the structure and performance of supply chains (Cotterill 2006; Smith 2006). While some producers may complain about the absence of contracts and poor prices, many of the innovations introduced by the supermarkets have served to reduce the direct environmental impact of agriculture (Dreschler et al. 2009; Asfaw et al. 2010; Cooper & Wrath 2010). There is almost no evidence to suggest that declines in environmental quality have had a direct and negative impact on levels of agricultural production. This does not mean that agriculture does not impact on the environment, but rather that any impacts it does cause have not had direct and lasting effects on overall levels of production to date.
15.3 Food from Marine Ecosystems
This section begins with a brief discussion about the problems of assigning fisheries catch data to a fixed territory
Table 15.6 Changes in fully organic and in-conversion organic land areas (ha) between 2002 and 2008. Source: Organic Certifier Bodies collated by Defra Statistics; Defra (2009a). © Crown Copyright, 2010.
Country Status
Year
2002 2003 2004 2005 2006 2007 2008
England In conversion 67,800 36,800 28,800 53,200 66,500 89,000 91,100
Fully organic 184,000 220,200 229,600 238,400 229,900 258,700 284,000
Wales In conversion 13,700 8,000 8,600 12,800 15,400 30,900 49,500
Fully organic 41,400 50,200 55,600 58,000 63,500 65,100 75,100
Scotland In conversion 121,300 20,400 13,700 16,700 35,200 34,800 6,200
Fully organic 307,300 351,900 331,600 231,200 200,100 193,100 225,100
Northern Ireland In conversion 1,500 800 1,600 3,200 4,000 3,200 2,300
Fully organic 4,100 6,600 5,000 6,300 5,100 7,300 10,100
Total UK In conversion 204,300 66,000 52,700 86,000 121,100 157,900 141,900
Fully organic 536,900 629,000 621,800 533,900 498,600 524,300 594,400
Total Organic Land UK 741,200 695,000 674,500 619,900 619,800 682,200 743,500
Ecosystem Services | Chapter 15: Provisioning Services 609
such as the UK. It then proceeds to consider trends in landings from 1940 to 2009. These topics overlap a little with Chapter 12, which provides a detailed analysis of the relationship between fisheries and marine ecosystems.
15.3.1 Data ConstraintsThere are some difficulties in examining the statistics of marine fisheries in the context of the UK NEA. These arise because fishing vessels that are registered in the UK are not obliged to land all of their catch in the UK, and, similarly, vessels registered in other countries can land some of their catch in the UK should they choose to do so. Generally, vessels choose a landing venue according to the relative market conditions in different ports. Fortunately, national fisheries statistics do seek to represent both of these situations, as discussed below. However, it can be difficult to decide how to allocate fish caught in the open ocean to specific nations. Since 1913, records of catches in Northern Europe have been attributed to statistical areas known as ICES (International Council for the Exploration of the Sea) rectangles (0.5° Latitude by 1° Longitude) (Engelhard 2005). Yet these statistical rectangles transcend national boundaries at sea which can complicate the attribution of catches to national waters. As a result, it is difficult to attribute catches to ecosystems that lie within the boundaries of the UK.
It should also be noted that we do not have complete historical records from the inshore fleet that fishes within 12 nautical miles from the coast. At present, vessels less than 15m long are not legally obliged to report their catches either nationally or to the European Commission, and most inshore vessels are below this length. Some data on inshore catches are now available from Sea Fisheries committees and from voluntary logbook schemes in certain sub-samples of the inshore fleet, but these are not included in the historical records discussed below.
Finally, it is not possible to relate the contemporary landings of fish by UK boats to the consumption of fish by UK citizens; for example, more than 90% of cod consumed in the UK is now imported from areas such as Iceland and Greenland. The lack of a direct relationship between domestic consumption and catches by the UK fishing fleet reflects the changing status of that fleet over time. Prior to 1983, the UK was a net exporter of fish, but since then the UK has become a net importer. To some extent, the switch from being a net exporter to a net importer is related to the removal of the UK’s ‘distant water fleet’ from water around Norway and Iceland in the 1970s following the so-called ‘cod wars’. Despite being an overall net importer of fish products, the UK is an active exporter of premium species such as Norway lobster (Nephrops norvegicus), blue mussels (Mytilus edulis), live edible crab (Cancer pagurus) and whole scallops.
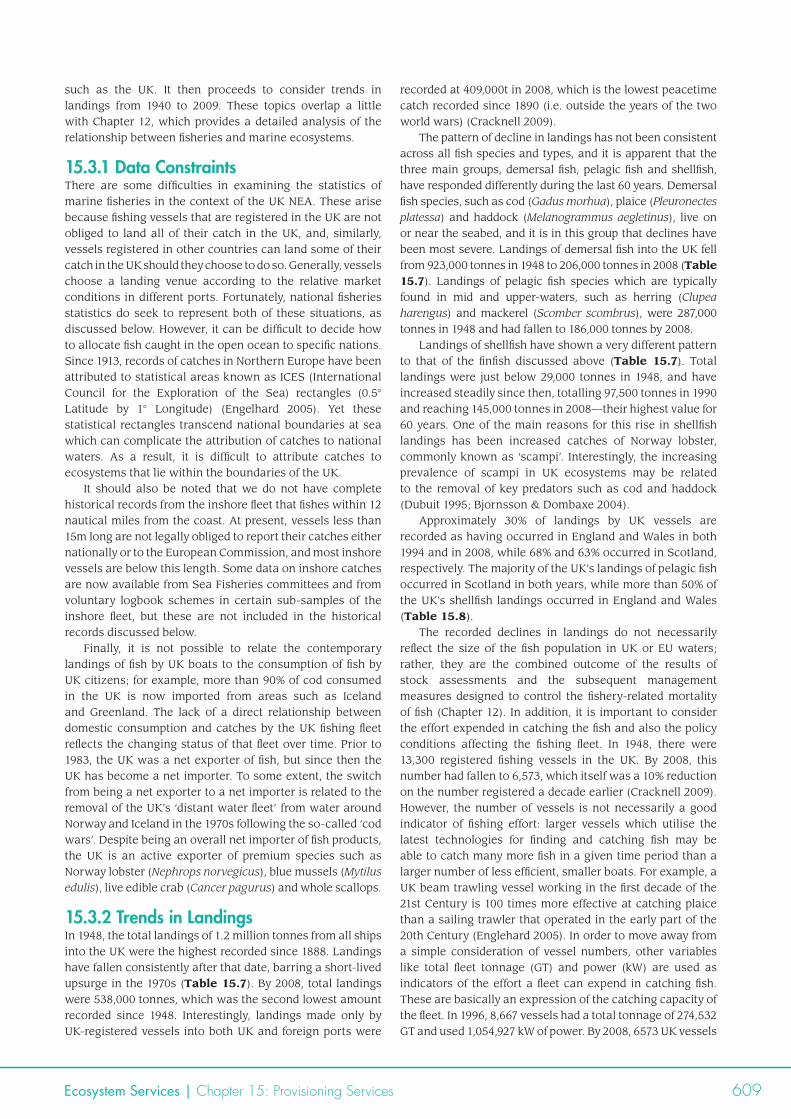
15.3.2 Trends in Landings In 1948, the total landings of 1.2 million tonnes from all ships into the UK were the highest recorded since 1888. Landings have fallen consistently after that date, barring a short-lived upsurge in the 1970s (Table 15.7). By 2008, total landings were 538,000 tonnes, which was the second lowest amount recorded since 1948. Interestingly, landings made only by UK-registered vessels into both UK and foreign ports were
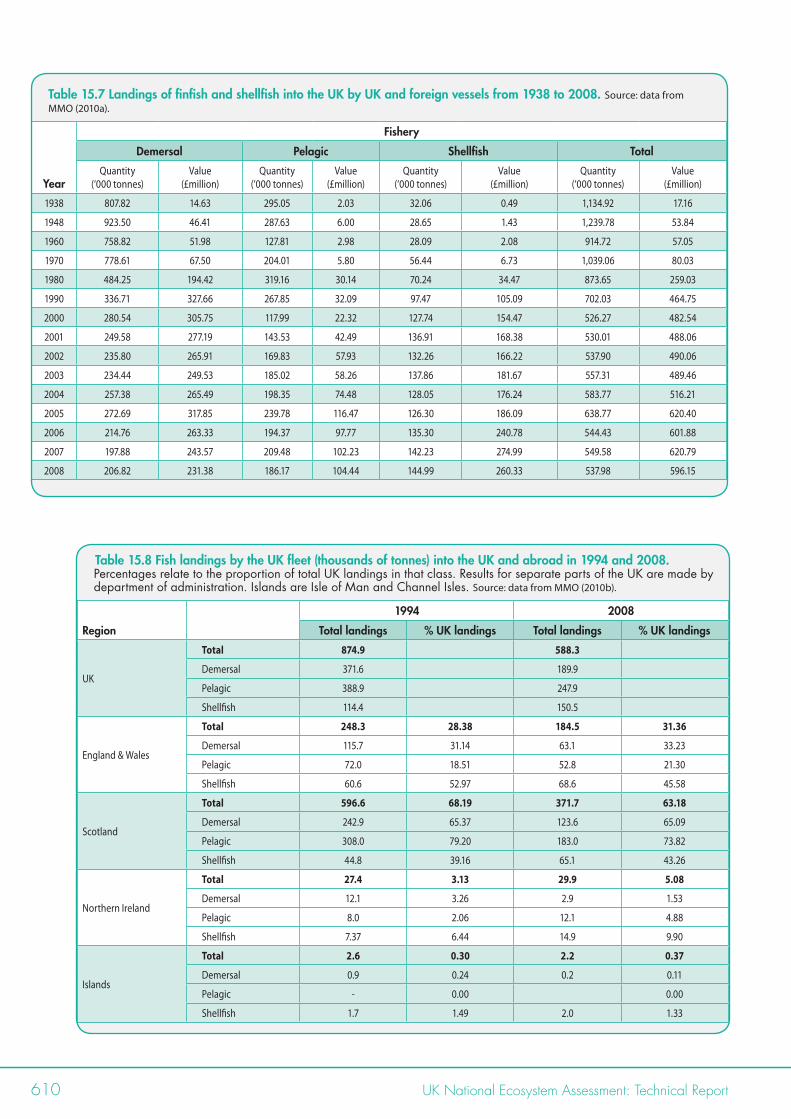
recorded at 409,000t in 2008, which is the lowest peacetime catch recorded since 1890 (i.e. outside the years of the two world wars) (Cracknell 2009). The pattern of decline in landings has not been consistent across all fish species and types, and it is apparent that the three main groups, demersal fish, pelagic fish and shellfish, have responded differently during the last 60 years. Demersal fish species, such as cod (Gadus morhua), plaice (Pleuronectes platessa) and haddock (Melanogrammus aegletinus), live on or near the seabed, and it is in this group that declines have been most severe. Landings of demersal fish into the UK fell from 923,000 tonnes in 1948 to 206,000 tonnes in 2008 (Table 15.7). Landings of pelagic fish species which are typically found in mid and upper-waters, such as herring (Clupea harengus) and mackerel (Scomber scombrus), were 287,000 tonnes in 1948 and had fallen to 186,000 tonnes by 2008. Landings of shellfish have shown a very different pattern to that of the finfish discussed above (Table 15.7). Total landings were just below 29,000 tonnes in 1948, and have increased steadily since then, totalling 97,500 tonnes in 1990 and reaching 145,000 tonnes in 2008—their highest value for 60 years. One of the main reasons for this rise in shellfish landings has been increased catches of Norway lobster, commonly known as ‘scampi’. Interestingly, the increasing prevalence of scampi in UK ecosystems may be related to the removal of key predators such as cod and haddock (Dubuit 1995; Bjornsson & Dombaxe 2004). Approximately 30% of landings by UK vessels are recorded as having occurred in England and Wales in both 1994 and in 2008, while 68% and 63% occurred in Scotland, respectively. The majority of the UK’s landings of pelagic fish occurred in Scotland in both years, while more than 50% of the UK’s shellfish landings occurred in England and Wales (Table 15.8).
The recorded declines in landings do not necessarily reflect the size of the fish population in UK or EU waters; rather, they are the combined outcome of the results of stock assessments and the subsequent management measures designed to control the fishery-related mortality of fish (Chapter 12). In addition, it is important to consider the effort expended in catching the fish and also the policy conditions affecting the fishing fleet. In 1948, there were 13,300 registered fishing vessels in the UK. By 2008, this number had fallen to 6,573, which itself was a 10% reduction on the number registered a decade earlier (Cracknell 2009). However, the number of vessels is not necessarily a good indicator of fishing effort: larger vessels which utilise the latest technologies for finding and catching fish may be able to catch many more fish in a given time period than a larger number of less efficient, smaller boats. For example, a UK beam trawling vessel working in the first decade of the 21st Century is 100 times more effective at catching plaice than a sailing trawler that operated in the early part of the 20th Century (Englehard 2005). In order to move away from a simple consideration of vessel numbers, other variables like total fleet tonnage (GT) and power (kW) are used as indicators of the effort a fleet can expend in catching fish. These are basically an expression of the catching capacity of the fleet. In 1996, 8,667 vessels had a total tonnage of 274,532 GT and used 1,054,927 kW of power. By 2008, 6573 UK vessels
610 UK National Ecosystem Assessment: Technical Report
Table 15.7 Landings of finfish and shellfish into the UK by UK and foreign vessels from 1938 to 2008. Source: data from MMO (2010a).
Year
Fishery
Demersal Pelagic Shellfish Total
Quantity (‘000 tonnes)
Value(£million)
Quantity (‘000 tonnes)
Value (£million)
Quantity (‘000 tonnes)
Value (£million)
Quantity (‘000 tonnes)
Value (£million)
1938 807.82 14.63 295.05 2.03 32.06 0.49 1,134.92 17.16
1948 923.50 46.41 287.63 6.00 28.65 1.43 1,239.78 53.84
1960 758.82 51.98 127.81 2.98 28.09 2.08 914.72 57.05
1970 778.61 67.50 204.01 5.80 56.44 6.73 1,039.06 80.03
1980 484.25 194.42 319.16 30.14 70.24 34.47 873.65 259.03
1990 336.71 327.66 267.85 32.09 97.47 105.09 702.03 464.75
2000 280.54 305.75 117.99 22.32 127.74 154.47 526.27 482.54
2001 249.58 277.19 143.53 42.49 136.91 168.38 530.01 488.06
2002 235.80 265.91 169.83 57.93 132.26 166.22 537.90 490.06
2003 234.44 249.53 185.02 58.26 137.86 181.67 557.31 489.46
2004 257.38 265.49 198.35 74.48 128.05 176.24 583.77 516.21
2005 272.69 317.85 239.78 116.47 126.30 186.09 638.77 620.40
2006 214.76 263.33 194.37 97.77 135.30 240.78 544.43 601.88
2007 197.88 243.57 209.48 102.23 142.23 274.99 549.58 620.79
2008 206.82 231.38 186.17 104.44 144.99 260.33 537.98 596.15
Table 15.8 Fish landings by the UK fleet (thousands of tonnes) into the UK and abroad in 1994 and 2008. Percentages relate to the proportion of total UK landings in that class. Results for separate parts of the UK are made by department of administration. Islands are Isle of Man and Channel Isles. Source: data from MMO (2010b).
Region
1994 2008
Total landings % UK landings Total landings % UK landings
UK
Total 874.9 588.3
Demersal 371.6 189.9
Pelagic 388.9 247.9
Shellfish 114.4 150.5
England & Wales
Total 248.3 28.38 184.5 31.36
Demersal 115.7 31.14 63.1 33.23
Pelagic 72.0 18.51 52.8 21.30
Shellfish 60.6 52.97 68.6 45.58
Scotland
Total 596.6 68.19 371.7 63.18
Demersal 242.9 65.37 123.6 65.09
Pelagic 308.0 79.20 183.0 73.82
Shellfish 44.8 39.16 65.1 43.26
Northern Ireland
Total 27.4 3.13 29.9 5.08
Demersal 12.1 3.26 2.9 1.53
Pelagic 8.0 2.06 12.1 4.88
Shellfish 7.37 6.44 14.9 9.90
Islands
Total 2.6 0.30 2.2 0.37
Demersal 0.9 0.24 0.2 0.11
Pelagic - 0.00 0.00
Shellfish 1.7 1.49 2.0 1.33
Ecosystem Services | Chapter 15: Provisioning Services 611
had a total tonnage of 207,423 GT and 836,485 kW of power. This indicates that the size and power of the remaining vessels has not fully compensated for the reduction in vessel number. The policy environment and the untenable state of many fish stocks may partly explain why there has not been more compensation of power and size for numbers in recent years. Under the Common Fisheries Policy of the EU an increasing number of restrictions have been placed on fleets fishing waters around the UK, many of which have been aimed at stock conservation (e.g. restrictions in permissible days at sea, closed areas and gear restrictions) (Frost & Andersen 1996; Laurec & Armstrong 1997; Hadjimichael et al. 2010). In particular, declines in landings over the last decade are likely to reflect the impact of these policies, along with a reduction in the amount of fisheries subsidies that are provided to domestic fleets.
15.3.3 Drivers of Change in Marine FisheriesSince joining the EU the community’s fisheries policy has been the dominant influence on the behaviour of fishers. The restrictive influences of this policy have intensified in recent years, with a combination of catch quotas, gear restrictions and limits on days at sea all seeking to reduce catches to more sustainable levels. In spite of these policies, the fishing industry has continued to innovate, and there have been marked developments in technology in recent years. In parallel to these policy and technological trends, it is virtually certain that declining stocks of many fish have resulted in reduced catches. As a result, the trends in the industry are a spiralling and interacting function of a profitable industry investing in technology which causes further declines in stock, and policy makers responding to these two drivers by implementing new regulations.
In addition, certain fishing practices (e.g. beam-trawling, scallop-dredging) can have negative impacts on the marine environment that directly affect the productivity of the system and have subsequent negative consequences for fish populations (Hinz et al. 2009; Benn et al. 2010; but see also Hiddink et al. 2008 for a different viewpoint). Observed changes in ecological communities and the size of animals that occur in areas without fishing disturbance demonstrate the magnitude of the negative impacts fishing can have on marine environments (Kaiser et al. 2006).
15.4 Food from Aquaculture
The major finfish products of aquaculture in the UK are the Atlantic Salmon (Salmo salar) in coastal waters and rainbow trout (Oncorhynchus mykiss) in freshwater. Several shellfish species are also produced, of which, mussels (Mytilus edulis) and oysters (two species are grown in UK; the Pacific oyster Crassostrea gigas and the European flat oyster, Ostrea edulis) are the dominant species. Aquaculture occurs across the UK, but Scotland is responsible for 80% of the UK’s aquaculture production, largely due to the scale of the salmon industry (Defra 2009c).
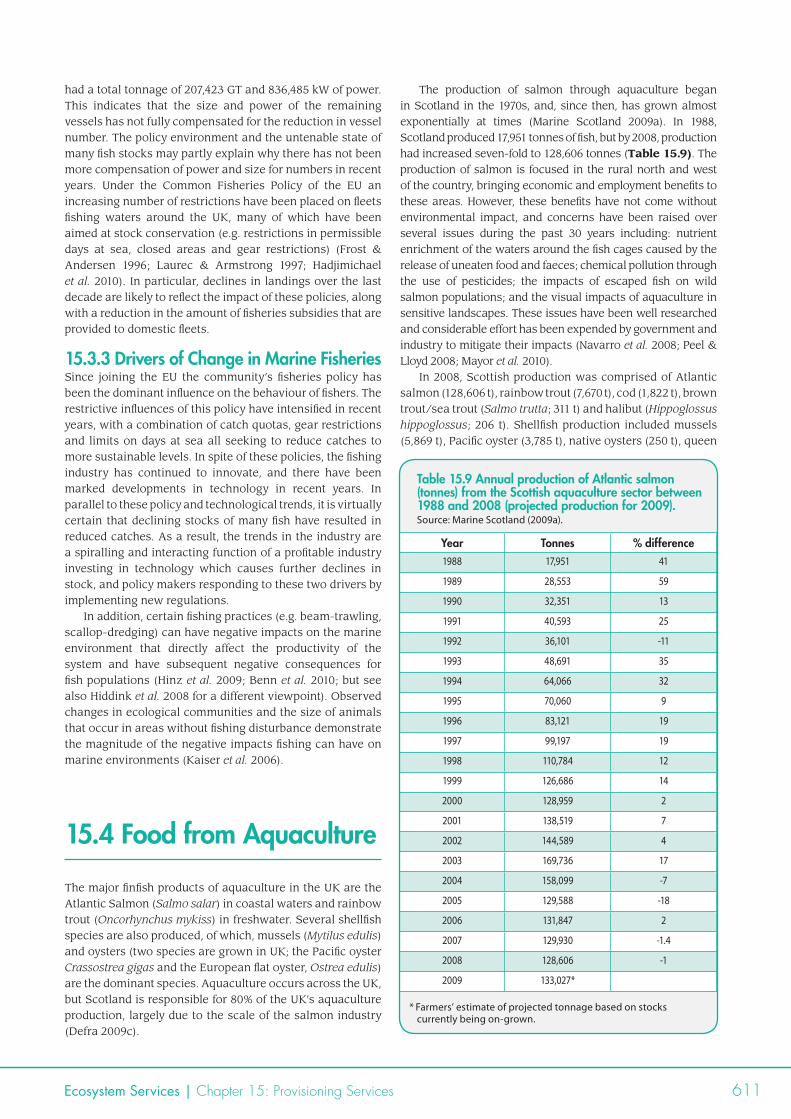
The production of salmon through aquaculture began in Scotland in the 1970s, and, since then, has grown almost exponentially at times (Marine Scotland 2009a). In 1988, Scotland produced 17,951 tonnes of fish, but by 2008, production had increased seven-fold to 128,606 tonnes (Table 15.9). The production of salmon is focused in the rural north and west of the country, bringing economic and employment benefits to these areas. However, these benefits have not come without environmental impact, and concerns have been raised over several issues during the past 30 years including: nutrient enrichment of the waters around the fish cages caused by the release of uneaten food and faeces; chemical pollution through the use of pesticides; the impacts of escaped fish on wild salmon populations; and the visual impacts of aquaculture in sensitive landscapes. These issues have been well researched and considerable effort has been expended by government and industry to mitigate their impacts (Navarro et al. 2008; Peel & Lloyd 2008; Mayor et al. 2010).
In 2008, Scottish production was comprised of Atlantic salmon (128,606 t), rainbow trout (7,670 t), cod (1,822 t), brown trout/sea trout (Salmo trutta; 311 t) and halibut (Hippoglossus hippoglossus; 206 t). Shellfish production included mussels (5,869 t), Pacific oyster (3,785 t), native oysters (250 t), queen
Table 15.9 Annual production of Atlantic salmon (tonnes) from the Scottish aquaculture sector between 1988 and 2008 (projected production for 2009). Source: Marine Scotland (2009a).
Year Tonnes % difference1988 17,951 41
1989 28,553 59
1990 32,351 13
1991 40,593 25
1992 36,101 -11
1993 48,691 35
1994 64,066 32
1995 70,060 9
1996 83,121 19
1997 99,197 19
1998 110,784 12
1999 126,686 14
2000 128,959 2
2001 138,519 7
2002 144,589 4
2003 169,736 17
2004 158,099 -7
2005 129,588 -18
2006 131,847 2
2007 129,930 -1.4
2008 128,606 -1
2009 133,027*
* Farmers’ estimate of projected tonnage based on stocks currently being on-grown.
612 UK National Ecosystem Assessment: Technical Report
scallops (Aequipecten opercularis; 687 t) and king scallops (Pecten maximus; 15 t) (Marine Scotland 2009ab). However, both the production of cod and Arctic charr (Salvelinus alpinus) had ceased by 2010.
In England and Wales, there were 518 registered fish and shellfish farms in 2008: 193 coarse fish farms, 197 trout and other finfish farms and 128 shellfish farms. Of the total 8,127 tonnes of finfish produced in England and Wales in 2006, the majority was rainbow trout (7,294 t). In 2006, there was also production of brown trout (441 t), carp (Cyprinus carpio; 175 t) Atlantic salmon (63 t), turbot (Psetta maxima; 63.5 t), barramundi (Lates calcarifer; 45 t) and tilapia (33 t). Farm-produced shellfish totaled 15,449 tonnes in 2006, with the main species cultivated being mussels (14,553 t) and Pacific and native oysters (880 t) (Defra 2009c).
There were 84 licensed fish farms in Northern Ireland in 2007. Fifty of these were licensed for the cultivation of shellfish (mussels, Pacific oysters, native oysters and clams) and 34 for the cultivation of finfish (salmon, rainbow trout and brown trout). In 2007, production totalled 8,400 tonnes of shellfish and more than 999 tonnes of finfish.
15.4.1 Drivers of Change in AquacultureAs catches of sea-caught fish have declined over time, so the demand for farmed fish has increased. The industry has adapted technology developed in other countries and has expanded rapidly, mainly in Scotland. However, constraints of the technology require that sea-based fish farms have particular bio-physical requirements. Furthermore, the growth of the industry has been a function of planning restriction and market demand. New technologies may permit some of the future growth in the sector to move further offshore, and the declines in stocks of marine fish will result in price increases, which should, in turn, raise demand for competitively priced products from aquaculture. Thus constraints on future growth in this sector will be a function of environmental regulation and technological developments.
15.5 Game and Food Collected from the Wild
Game species are those species of wild animals, birds, or fish hunted for food and/or sport. Within the UK, the main terrestrial game species are red deer (Cervus elaphus), roe deer (Capreolus capreolus), fallow deer (Dama dama), brown hare (Lepus europaeus), mountain hare (Lepus timidus), pheasant (Phasianus colchicus), grey partridge (Perdix perdix), red-legged partridge (Alectoris rufa), and red grouse (Lagopus lagopus scoticus). In addition, duck like mallard (Anas platyrhynchos) and fish species like salmon and trout (Salmo trutta) may also be classed as game. Many of these game species are hunted for pleasure; despite this, the majority of game animals that are killed in the UK will enter the human food chain in some form, either by being eaten by their hunter or after being sold to consumers, retailers or game dealers. However, not all
game animals are killed explicitly for consumption; instead, some may be culled because of their nuisance value or their role as pests. Species hunted in this way may include deer, hares, rabbits (Oryctolagus cuniculus) and wood pigeons (Columba palumbus) (note: the latter two species are not typically classed as game animals, but they are hunted for sport and have traditionally been eaten by humans).
Although game species are technically wild animals, many are subject to management of some form. For example, heather moorlands are managed to enhance the numbers of red grouse they support; some agricultural land is managed for partridge and pheasants (e.g. conservation headlands and gamebird cover); and some woodlands are managed to provide opportunities to shoot deer and pheasants. In addition, some game species have their natural populations enhanced through the deliberate release of animals reared domestically prior to the shooting season (especially pheasant, red-legged partridge and mallard). Finally, the predators of game species are often actively culled. For example, the number of foxes (Vulpes vulpes) killed on estate land (i.e. land managed for game) increased from about 0.5 fox/100 ha of estate land in 1961 to 3/100 ha of estate land in 2005 (GWCT 2009). The other major predators that are actively controlled include weasels (Mustela nivalis), stoats (Mustela erminea), brown rats (Rattus norvegicus), American mink (Neovison vison), carrion crows (Corvus corone), hooded crows (Corvus cornix) and magpies (Pica pica).
15.5.1 GamebirdsSeveral species of bird are shot for game and trends in bag sizes have shown variation over time (Figure 15.4a–d). For example, annual bags of red grouse shot on upland moors varied around a consistent mean for much of the period during 1900 and 1940. Bags then fell during the war years of 1940 to 1945, increased steadily up to 1970, and declined again through to 2007. The causes of these declines have been the subject of much speculation (Barnes 1987; Sotherton et al. 2009). The high bags of the early 20th Century probably reflect the active and intense management of grouse moors and associated fauna. Changes in the structure of large estates in the middle of the 20th Century, however, reduced the availability of labour for undertaking moorland management; while long-term changes in land use and management in the uplands, such as afforestation and increased sheep numbers, very likely served to reduce the quality of grouse habitat and enabled the impacts of predator populations to increase (Thirgood et al. 2000).
Contrary to trends seen in red grouse, the numbers of pheasant shot per 100 ha of estate land increased steadily from 1960 to 2007 (Figure 15.4b). These increased bags largely reflect the greater number of pheasants reared and released specifically for hunting; in 2004, for example, 35 million pheasants were released in the UK (PACEC 2006).
Interestingly, the average bags of woodcock (Scolopax rusticola) during the last few decades of the 20th Century were very similar to those obtained in the first few decades of that century. In contrast, bags of snipe (Gallinago gallinago) showed an increase up to the 1940s, followed by a rapid and continued decline throughout the latter half of the 20th Century (National Gamebag Census, GWCT 2009).
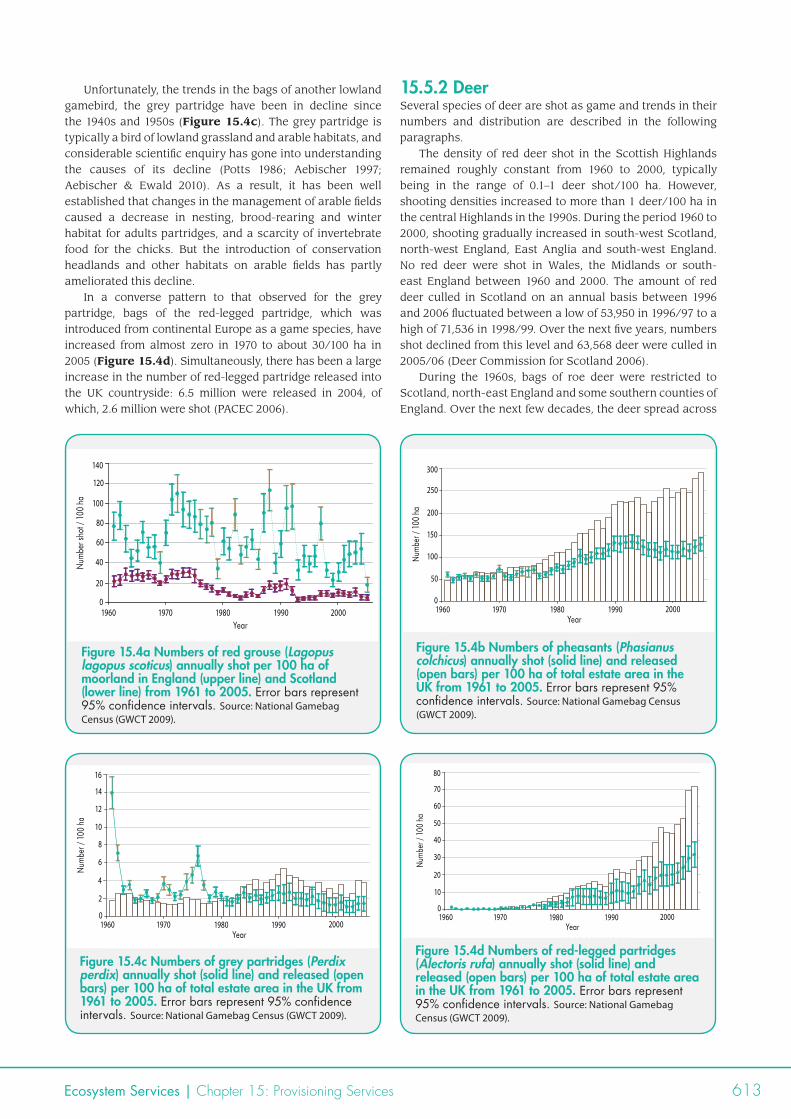
Ecosystem Services | Chapter 15: Provisioning Services 613
Unfortunately, the trends in the bags of another lowland gamebird, the grey partridge have been in decline since the 1940s and 1950s (Figure 15.4c). The grey partridge is typically a bird of lowland grassland and arable habitats, and considerable scientific enquiry has gone into understanding the causes of its decline (Potts 1986; Aebischer 1997; Aebischer & Ewald 2010). As a result, it has been well established that changes in the management of arable fields caused a decrease in nesting, brood-rearing and winter habitat for adults partridges, and a scarcity of invertebrate food for the chicks. But the introduction of conservation headlands and other habitats on arable fields has partly ameliorated this decline.
In a converse pattern to that observed for the grey partridge, bags of the red-legged partridge, which was introduced from continental Europe as a game species, have increased from almost zero in 1970 to about 30/100 ha in 2005 (Figure 15.4d). Simultaneously, there has been a large increase in the number of red-legged partridge released into the UK countryside: 6.5 million were released in 2004, of which, 2.6 million were shot (PACEC 2006).
15.5.2 DeerSeveral species of deer are shot as game and trends in their numbers and distribution are described in the following paragraphs.
The density of red deer shot in the Scottish Highlands remained roughly constant from 1960 to 2000, typically being in the range of 0.1–1 deer shot/100 ha. However, shooting densities increased to more than 1 deer/100 ha in the central Highlands in the 1990s. During the period 1960 to 2000, shooting gradually increased in south-west Scotland, north-west England, East Anglia and south-west England. No red deer were shot in Wales, the Midlands or south-east England between 1960 and 2000. The amount of red deer culled in Scotland on an annual basis between 1996 and 2006 fluctuated between a low of 53,950 in 1996/97 to a high of 71,536 in 1998/99. Over the next five years, numbers shot declined from this level and 63,568 deer were culled in 2005/06 (Deer Commission for Scotland 2006).
During the 1960s, bags of roe deer were restricted to Scotland, north-east England and some southern counties of England. Over the next few decades, the deer spread across
Figure 15.4c Numbers of grey partridges (Perdix perdix) annually shot (solid line) and released (open bars) per 100 ha of total estate area in the UK from 1961 to 2005. Error bars represent 95% confidence intervals. Source: National Gamebag Census (GWCT 2009).
0
80
100
120
140
1960 1970 1980 1990 2000Year
Num
ber s
hot /
100
ha
60
40
20
0
150
200
250
300
1960 1970 1980 1990 2000Year
Num
ber /
100
ha
100
50
0
8
12
14
16
1960 1970 1980 1990 2000Year
Num
ber /
100
ha
6
2
10
4
0
40
60
70
80
1960 1970 1980 1990 2000Year
Num
ber /
100
ha
30
10
50
20
Figure 15.4a Numbers of red grouse (Lagopus lagopus scoticus) annually shot per 100 ha of moorland in England (upper line) and Scotland (lower line) from 1961 to 2005. Error bars represent 95% confidence intervals. Source: National Gamebag Census (GWCT 2009).
Figure 15.4b Numbers of pheasants (Phasianus colchicus) annually shot (solid line) and released (open bars) per 100 ha of total estate area in the UK from 1961 to 2005. Error bars represent 95% confidence intervals. Source: National Gamebag Census (GWCT 2009).
Figure 15.4d Numbers of red-legged partridges (Alectoris rufa) annually shot (solid line) and released (open bars) per 100 ha of total estate area in the UK from 1961 to 2005. Error bars represent 95% confidence intervals. Source: National Gamebag Census (GWCT 2009).
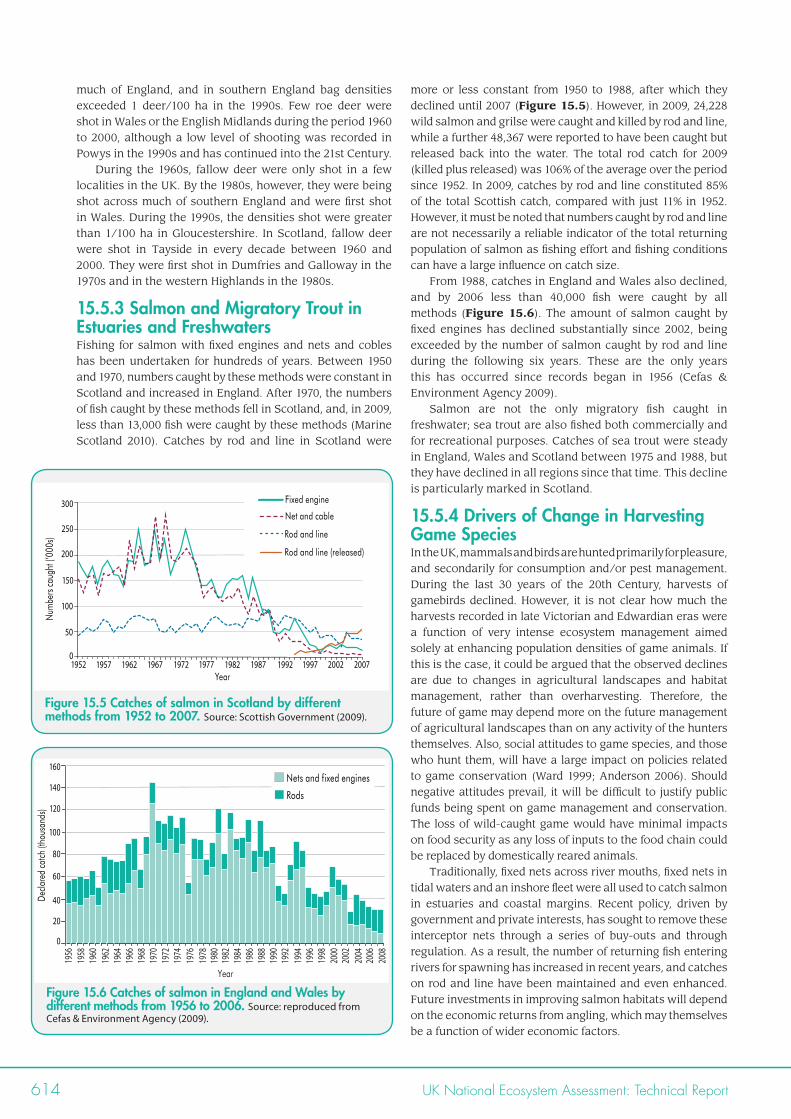
614 UK National Ecosystem Assessment: Technical Report
much of England, and in southern England bag densities exceeded 1 deer/100 ha in the 1990s. Few roe deer were shot in Wales or the English Midlands during the period 1960 to 2000, although a low level of shooting was recorded in Powys in the 1990s and has continued into the 21st Century.
During the 1960s, fallow deer were only shot in a few localities in the UK. By the 1980s, however, they were being shot across much of southern England and were first shot in Wales. During the 1990s, the densities shot were greater than 1/100 ha in Gloucestershire. In Scotland, fallow deer were shot in Tayside in every decade between 1960 and 2000. They were first shot in Dumfries and Galloway in the 1970s and in the western Highlands in the 1980s.
15.5.3 Salmon and Migratory Trout in Estuaries and FreshwatersFishing for salmon with fixed engines and nets and cobles has been undertaken for hundreds of years. Between 1950 and 1970, numbers caught by these methods were constant in Scotland and increased in England. After 1970, the numbers of fish caught by these methods fell in Scotland, and, in 2009, less than 13,000 fish were caught by these methods (Marine Scotland 2010). Catches by rod and line in Scotland were
Figure 15.5 Catches of salmon in Scotland by different methods from 1952 to 2007. Source: Scottish Government (2009).
Figure 15.6 Catches of salmon in England and Wales by different methods from 1956 to 2006. Source: reproduced from Cefas & Environment Agency (2009).
0
100
200
250
300
1952 1957 1962 1967 1972 1977 1982 1992 1997 20021987 2007Year
Num
bers
caug
ht (’
000s
)
50
150
Fixed engine
Net and cable
Rod and line (released)
Rod and line
20
80
120
140
160
Dec
lare
d ca
tch (t
hous
ands
)
40
100
60
0
1972
1974
1976
1978
1980
1982
1984
1986
1988
1990
1992
1994
1996
1998
2000
2002
2004
2006
2008
Year
1956
1958
1960
1962
1964
1966
1970
1968
Nets and fixed engines
Rods
more or less constant from 1950 to 1988, after which they declined until 2007 (Figure 15.5). However, in 2009, 24,228 wild salmon and grilse were caught and killed by rod and line, while a further 48,367 were reported to have been caught but released back into the water. The total rod catch for 2009 (killed plus released) was 106% of the average over the period since 1952. In 2009, catches by rod and line constituted 85% of the total Scottish catch, compared with just 11% in 1952. However, it must be noted that numbers caught by rod and line are not necessarily a reliable indicator of the total returning population of salmon as fishing effort and fishing conditions can have a large influence on catch size.
From 1988, catches in England and Wales also declined, and by 2006 less than 40,000 fish were caught by all methods (Figure 15.6). The amount of salmon caught by fixed engines has declined substantially since 2002, being exceeded by the number of salmon caught by rod and line during the following six years. These are the only years this has occurred since records began in 1956 (Cefas & Environment Agency 2009).
Salmon are not the only migratory fish caught in freshwater; sea trout are also fished both commercially and for recreational purposes. Catches of sea trout were steady in England, Wales and Scotland between 1975 and 1988, but they have declined in all regions since that time. This decline is particularly marked in Scotland.
15.5.4 Drivers of Change in Harvesting Game SpeciesIn the UK, mammals and birds are hunted primarily for pleasure, and secondarily for consumption and/or pest management. During the last 30 years of the 20th Century, harvests of gamebirds declined. However, it is not clear how much the harvests recorded in late Victorian and Edwardian eras were a function of very intense ecosystem management aimed solely at enhancing population densities of game animals. If this is the case, it could be argued that the observed declines are due to changes in agricultural landscapes and habitat management, rather than overharvesting. Therefore, the future of game may depend more on the future management of agricultural landscapes than on any activity of the hunters themselves. Also, social attitudes to game species, and those who hunt them, will have a large impact on policies related to game conservation (Ward 1999; Anderson 2006). Should negative attitudes prevail, it will be difficult to justify public funds being spent on game management and conservation. The loss of wild-caught game would have minimal impacts on food security as any loss of inputs to the food chain could be replaced by domestically reared animals.
Traditionally, fixed nets across river mouths, fixed nets in tidal waters and an inshore fleet were all used to catch salmon in estuaries and coastal margins. Recent policy, driven by government and private interests, has sought to remove these interceptor nets through a series of buy-outs and through regulation. As a result, the number of returning fish entering rivers for spawning has increased in recent years, and catches on rod and line have been maintained and even enhanced. Future investments in improving salmon habitats will depend on the economic returns from angling, which may themselves be a function of wider economic factors.
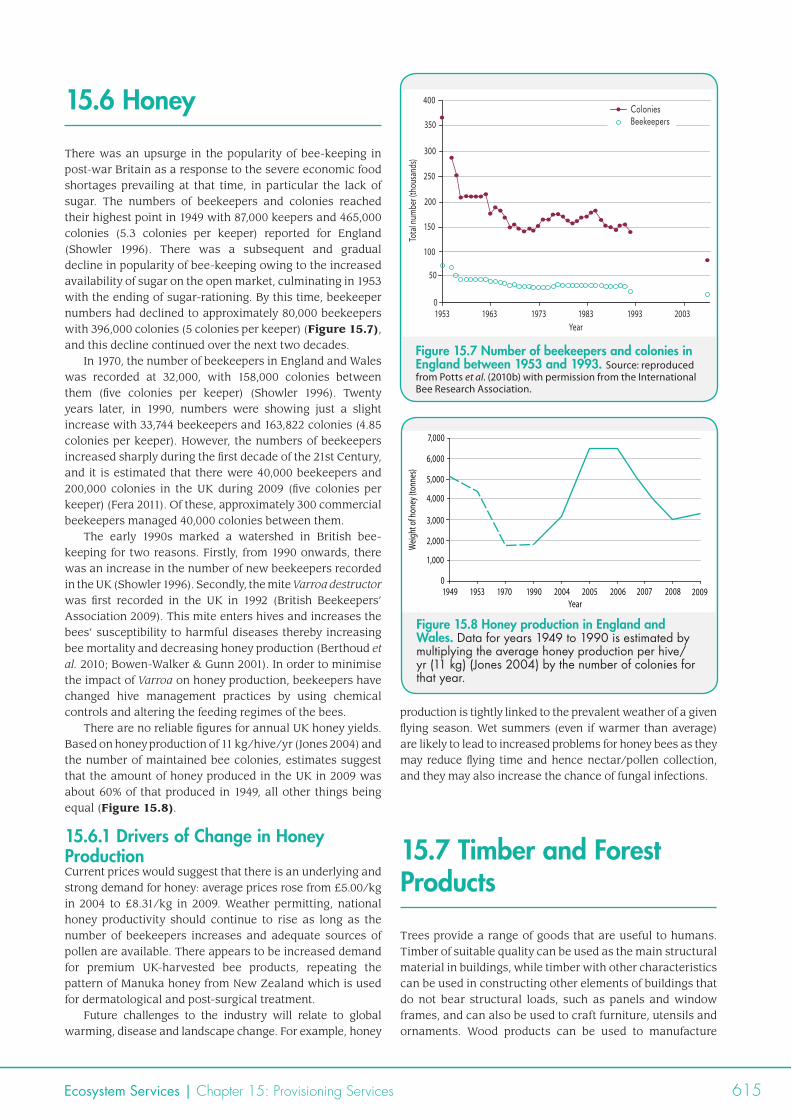
Ecosystem Services | Chapter 15: Provisioning Services 615
15.6 Honey
There was an upsurge in the popularity of bee-keeping in post-war Britain as a response to the severe economic food shortages prevailing at that time, in particular the lack of sugar. The numbers of beekeepers and colonies reached their highest point in 1949 with 87,000 keepers and 465,000 colonies (5.3 colonies per keeper) reported for England (Showler 1996). There was a subsequent and gradual decline in popularity of bee-keeping owing to the increased availability of sugar on the open market, culminating in 1953 with the ending of sugar-rationing. By this time, beekeeper numbers had declined to approximately 80,000 beekeepers with 396,000 colonies (5 colonies per keeper) (Figure 15.7), and this decline continued over the next two decades.
In 1970, the number of beekeepers in England and Wales was recorded at 32,000, with 158,000 colonies between them (five colonies per keeper) (Showler 1996). Twenty years later, in 1990, numbers were showing just a slight increase with 33,744 beekeepers and 163,822 colonies (4.85 colonies per keeper). However, the numbers of beekeepers increased sharply during the first decade of the 21st Century, and it is estimated that there were 40,000 beekeepers and 200,000 colonies in the UK during 2009 (five colonies per keeper) (Fera 2011). Of these, approximately 300 commercial beekeepers managed 40,000 colonies between them.
The early 1990s marked a watershed in British bee-keeping for two reasons. Firstly, from 1990 onwards, there was an increase in the number of new beekeepers recorded in the UK (Showler 1996). Secondly, the mite Varroa destructor was first recorded in the UK in 1992 (British Beekeepers’ Association 2009). This mite enters hives and increases the bees’ susceptibility to harmful diseases thereby increasing bee mortality and decreasing honey production (Berthoud et al. 2010; Bowen-Walker & Gunn 2001). In order to minimise the impact of Varroa on honey production, beekeepers have changed hive management practices by using chemical controls and altering the feeding regimes of the bees.
There are no reliable figures for annual UK honey yields. Based on honey production of 11 kg/hive/yr (Jones 2004) and the number of maintained bee colonies, estimates suggest that the amount of honey produced in the UK in 2009 was about 60% of that produced in 1949, all other things being equal (Figure 15.8).
15.6.1 Drivers of Change in Honey ProductionCurrent prices would suggest that there is an underlying and strong demand for honey: average prices rose from £5.00/kg in 2004 to £8.31/kg in 2009. Weather permitting, national honey productivity should continue to rise as long as the number of beekeepers increases and adequate sources of pollen are available. There appears to be increased demand for premium UK-harvested bee products, repeating the pattern of Manuka honey from New Zealand which is used for dermatological and post-surgical treatment.
Future challenges to the industry will relate to global warming, disease and landscape change. For example, honey
Figure 15.8 Honey production in England and Wales. Data for years 1949 to 1990 is estimated by multiplying the average honey production per hive/yr (11 kg) (Jones 2004) by the number of colonies for that year.
Figure 15.7 Number of beekeepers and colonies in England between 1953 and 1993. Source: reproduced from Potts et al. (2010b) with permission from the International Bee Research Association.
0
200
300
Tota
l num
ber (
thou
sand
s)
1953 1963 1973 1993 20031983Year
400
100
250
350
150
50
ColoniesBeekeepers
0
4,000
5,000
7,000
1949 1953 1970 1990 2004 2005 2006 2008 2009Year
Weig
ht of
hone
y (to
nnes
)
6,000
1,000
2,000
3,000
2007
production is tightly linked to the prevalent weather of a given flying season. Wet summers (even if warmer than average) are likely to lead to increased problems for honey bees as they may reduce flying time and hence nectar/pollen collection, and they may also increase the chance of fungal infections.
15.7 Timber and Forest Products
Trees provide a range of goods that are useful to humans. Timber of suitable quality can be used as the main structural material in buildings, while timber with other characteristics can be used in constructing other elements of buildings that do not bear structural loads, such as panels and window frames, and can also be used to craft furniture, utensils and ornaments. Wood products can be used to manufacture
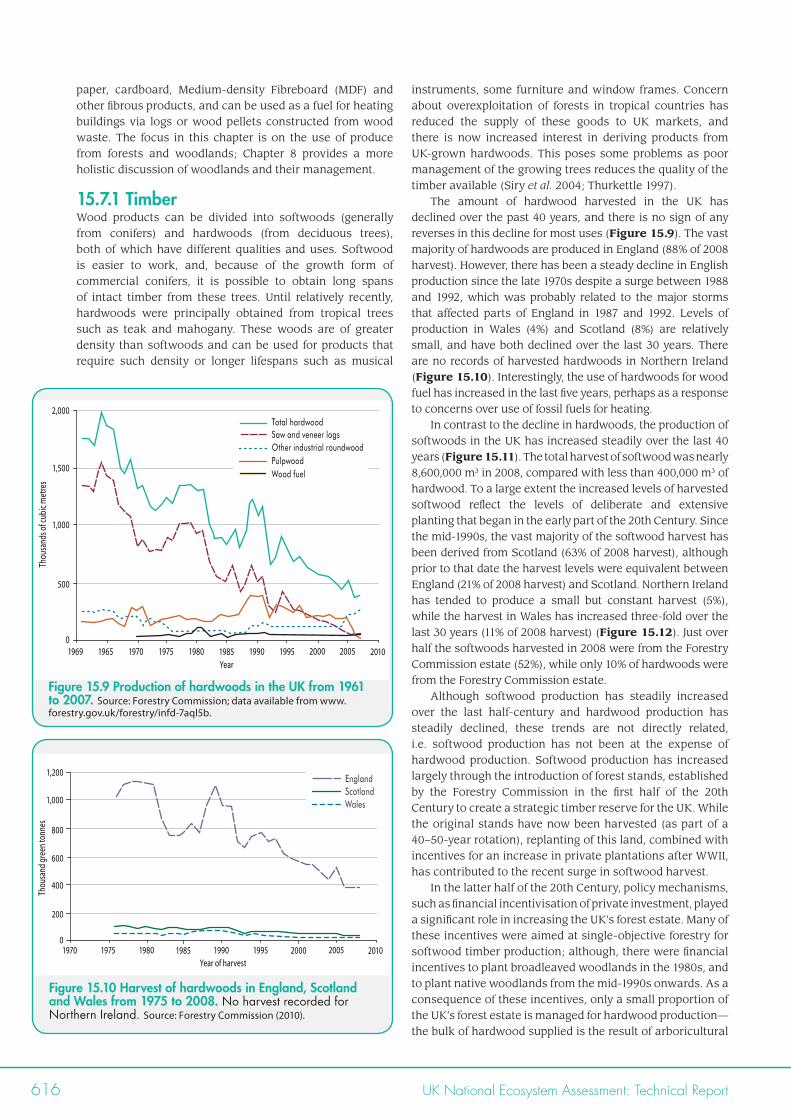
616 UK National Ecosystem Assessment: Technical Report
paper, cardboard, Medium-density Fibreboard (MDF) and other fibrous products, and can be used as a fuel for heating buildings via logs or wood pellets constructed from wood waste. The focus in this chapter is on the use of produce from forests and woodlands; Chapter 8 provides a more holistic discussion of woodlands and their management.
15.7.1 TimberWood products can be divided into softwoods (generally from conifers) and hardwoods (from deciduous trees), both of which have different qualities and uses. Softwood is easier to work, and, because of the growth form of commercial conifers, it is possible to obtain long spans of intact timber from these trees. Until relatively recently, hardwoods were principally obtained from tropical trees such as teak and mahogany. These woods are of greater density than softwoods and can be used for products that require such density or longer lifespans such as musical
instruments, some furniture and window frames. Concern about overexploitation of forests in tropical countries has reduced the supply of these goods to UK markets, and there is now increased interest in deriving products from UK-grown hardwoods. This poses some problems as poor management of the growing trees reduces the quality of the timber available (Siry et al. 2004; Thurkettle 1997).
The amount of hardwood harvested in the UK has declined over the past 40 years, and there is no sign of any reverses in this decline for most uses (Figure 15.9). The vast majority of hardwoods are produced in England (88% of 2008 harvest). However, there has been a steady decline in English production since the late 1970s despite a surge between 1988 and 1992, which was probably related to the major storms that affected parts of England in 1987 and 1992. Levels of production in Wales (4%) and Scotland (8%) are relatively small, and have both declined over the last 30 years. There are no records of harvested hardwoods in Northern Ireland (Figure 15.10). Interestingly, the use of hardwoods for wood fuel has increased in the last five years, perhaps as a response to concerns over use of fossil fuels for heating.
In contrast to the decline in hardwoods, the production of softwoods in the UK has increased steadily over the last 40 years (Figure 15.11). The total harvest of softwood was nearly 8,600,000 m3 in 2008, compared with less than 400,000 m3 of hardwood. To a large extent the increased levels of harvested softwood reflect the levels of deliberate and extensive planting that began in the early part of the 20th Century. Since the mid-1990s, the vast majority of the softwood harvest has been derived from Scotland (63% of 2008 harvest), although prior to that date the harvest levels were equivalent between England (21% of 2008 harvest) and Scotland. Northern Ireland has tended to produce a small but constant harvest (5%), while the harvest in Wales has increased three-fold over the last 30 years (11% of 2008 harvest) (Figure 15.12). Just over half the softwoods harvested in 2008 were from the Forestry Commission estate (52%), while only 10% of hardwoods were from the Forestry Commission estate.
Although softwood production has steadily increased over the last half-century and hardwood production has steadily declined, these trends are not directly related, i.e. softwood production has not been at the expense of hardwood production. Softwood production has increased largely through the introduction of forest stands, established by the Forestry Commission in the first half of the 20th Century to create a strategic timber reserve for the UK. While the original stands have now been harvested (as part of a 40–50-year rotation), replanting of this land, combined with incentives for an increase in private plantations after WWII, has contributed to the recent surge in softwood harvest.
In the latter half of the 20th Century, policy mechanisms, such as financial incentivisation of private investment, played a significant role in increasing the UK’s forest estate. Many of these incentives were aimed at single-objective forestry for softwood timber production; although, there were financial incentives to plant broadleaved woodlands in the 1980s, and to plant native woodlands from the mid-1990s onwards. As a consequence of these incentives, only a small proportion of the UK’s forest estate is managed for hardwood production—the bulk of hardwood supplied is the result of arboricultural
Figure 15.9 Production of hardwoods in the UK from 1961 to 2007. Source: Forestry Commission; data available from www.forestry.gov.uk/forestry/infd-7aql5b.
0
1,000
1969 1965 1970 1975 1980 1990 1995 2005 2010Year
Thou
sand
s of c
ubic
met
res
500
20001985
1,500
2,000
Figure 15.10 Harvest of hardwoods in England, Scotland and Wales from 1975 to 2008. No harvest recorded for Northern Ireland. Source: Forestry Commission (2010).
Total hardwoodSaw and veneer logsOther industrial roundwoodPulpwoodWood fuel
0
1,000
1970 1975 1980 20001990 1995 2005 2010Year of harvest
Thou
sand
gree
n ton
nes
400
1985
1,200
200
600
800
EnglandScotlandWales
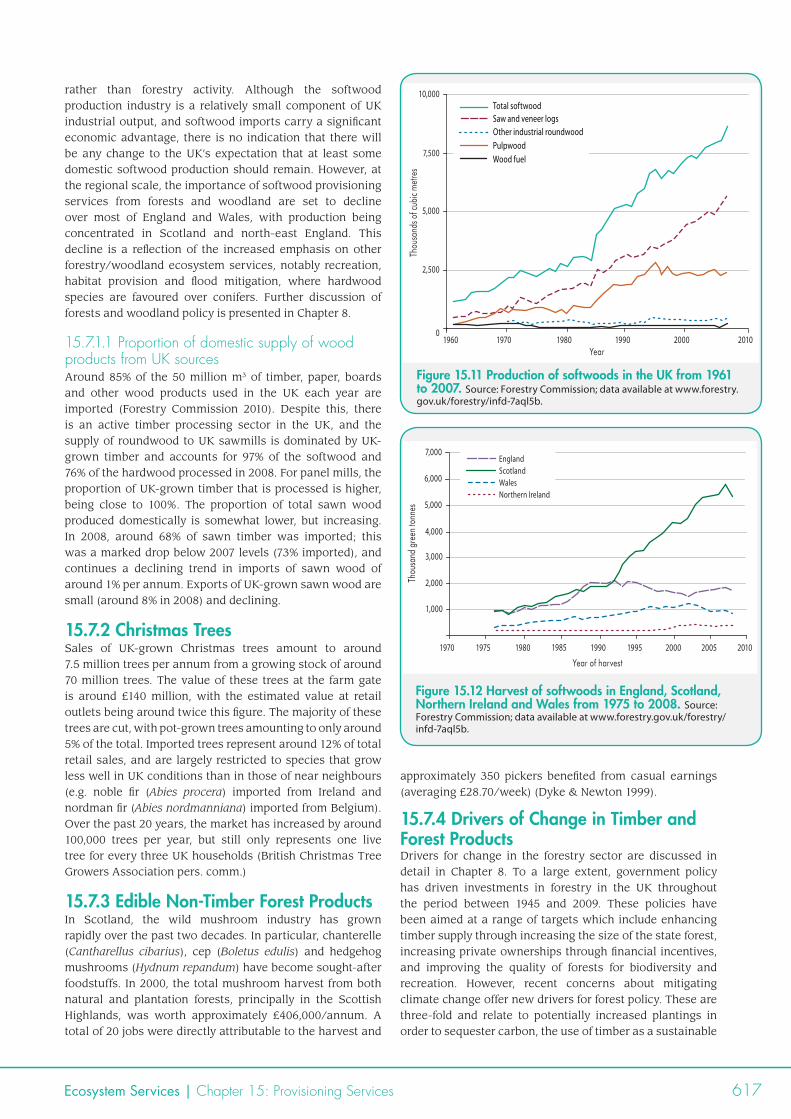
Ecosystem Services | Chapter 15: Provisioning Services 617
rather than forestry activity. Although the softwood production industry is a relatively small component of UK industrial output, and softwood imports carry a significant economic advantage, there is no indication that there will be any change to the UK’s expectation that at least some domestic softwood production should remain. However, at the regional scale, the importance of softwood provisioning services from forests and woodland are set to decline over most of England and Wales, with production being concentrated in Scotland and north-east England. This decline is a reflection of the increased emphasis on other forestry/woodland ecosystem services, notably recreation, habitat provision and flood mitigation, where hardwood species are favoured over conifers. Further discussion of forests and woodland policy is presented in Chapter 8.
15.7.1.1 Proportion of domestic supply of wood products from UK sourcesAround 85% of the 50 million m3 of timber, paper, boards and other wood products used in the UK each year are imported (Forestry Commission 2010). Despite this, there is an active timber processing sector in the UK, and the supply of roundwood to UK sawmills is dominated by UK-grown timber and accounts for 97% of the softwood and 76% of the hardwood processed in 2008. For panel mills, the proportion of UK-grown timber that is processed is higher, being close to 100%. The proportion of total sawn wood produced domestically is somewhat lower, but increasing. In 2008, around 68% of sawn timber was imported; this was a marked drop below 2007 levels (73% imported), and continues a declining trend in imports of sawn wood of around 1% per annum. Exports of UK-grown sawn wood are small (around 8% in 2008) and declining.
15.7.2 Christmas TreesSales of UK-grown Christmas trees amount to around 7.5 million trees per annum from a growing stock of around 70 million trees. The value of these trees at the farm gate is around £140 million, with the estimated value at retail outlets being around twice this figure. The majority of these trees are cut, with pot-grown trees amounting to only around 5% of the total. Imported trees represent around 12% of total retail sales, and are largely restricted to species that grow less well in UK conditions than in those of near neighbours (e.g. noble fir (Abies procera) imported from Ireland and nordman fir (Abies nordmanniana) imported from Belgium). Over the past 20 years, the market has increased by around 100,000 trees per year, but still only represents one live tree for every three UK households (British Christmas Tree Growers Association pers. comm.)
15.7.3 Edible Non-Timber Forest Products In Scotland, the wild mushroom industry has grown rapidly over the past two decades. In particular, chanterelle (Cantharellus cibarius), cep (Boletus edulis) and hedgehog mushrooms (Hydnum repandum) have become sought-after foodstuffs. In 2000, the total mushroom harvest from both natural and plantation forests, principally in the Scottish Highlands, was worth approximately £406,000/annum. A total of 20 jobs were directly attributable to the harvest and
approximately 350 pickers benefited from casual earnings (averaging £28.70/week) (Dyke & Newton 1999).
15.7.4 Drivers of Change in Timber and Forest ProductsDrivers for change in the forestry sector are discussed in detail in Chapter 8. To a large extent, government policy has driven investments in forestry in the UK throughout the period between 1945 and 2009. These policies have been aimed at a range of targets which include enhancing timber supply through increasing the size of the state forest, increasing private ownerships through financial incentives, and improving the quality of forests for biodiversity and recreation. However, recent concerns about mitigating climate change offer new drivers for forest policy. These are three-fold and relate to potentially increased plantings in order to sequester carbon, the use of timber as a sustainable
Figure 15.11 Production of softwoods in the UK from 1961 to 2007. Source: Forestry Commission; data available at www.forestry.gov.uk/forestry/infd-7aql5b.
Figure 15.12 Harvest of softwoods in England, Scotland, Northern Ireland and Wales from 1975 to 2008. Source: Forestry Commission; data available at www.forestry.gov.uk/forestry/infd-7aql5b.
0
2,500
5,000
7,500
10,000
Thou
sand
s of c
ubic
met
res
1960 1970 1980 1990 2000 2010Year
Total softwoodSaw and veneer logsOther industrial roundwoodPulpwoodWood fuel
1,000
2,000
3,000
4,000
Thou
sand
gre
en to
nnes
1970 1975 1980 1990 1995 2000 2005 2010
Year of harvest
1985
5,000
6,000
7,000EnglandScotlandWalesNorthern Ireland
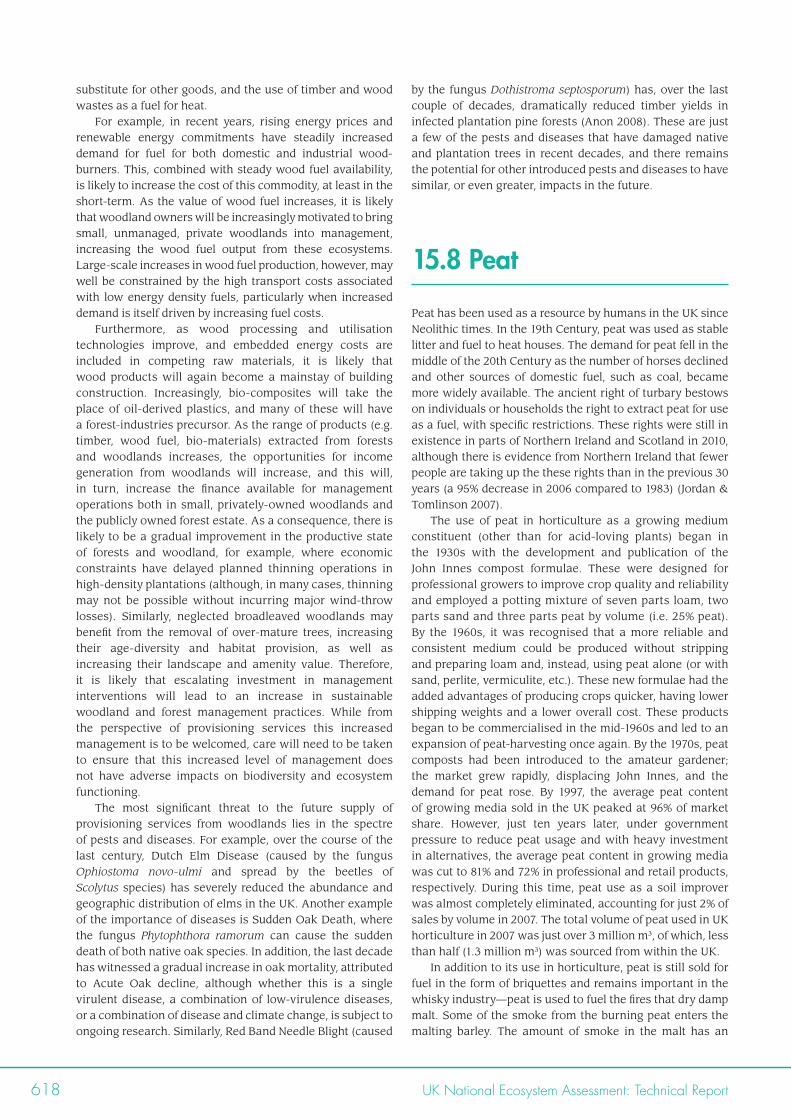
618 UK National Ecosystem Assessment: Technical Report
substitute for other goods, and the use of timber and wood wastes as a fuel for heat.
For example, in recent years, rising energy prices and renewable energy commitments have steadily increased demand for fuel for both domestic and industrial wood-burners. This, combined with steady wood fuel availability, is likely to increase the cost of this commodity, at least in the short-term. As the value of wood fuel increases, it is likely that woodland owners will be increasingly motivated to bring small, unmanaged, private woodlands into management, increasing the wood fuel output from these ecosystems. Large-scale increases in wood fuel production, however, may well be constrained by the high transport costs associated with low energy density fuels, particularly when increased demand is itself driven by increasing fuel costs.
Furthermore, as wood processing and utilisation technologies improve, and embedded energy costs are included in competing raw materials, it is likely that wood products will again become a mainstay of building construction. Increasingly, bio-composites will take the place of oil-derived plastics, and many of these will have a forest-industries precursor. As the range of products (e.g. timber, wood fuel, bio-materials) extracted from forests and woodlands increases, the opportunities for income generation from woodlands will increase, and this will, in turn, increase the finance available for management operations both in small, privately-owned woodlands and the publicly owned forest estate. As a consequence, there is likely to be a gradual improvement in the productive state of forests and woodland, for example, where economic constraints have delayed planned thinning operations in high-density plantations (although, in many cases, thinning may not be possible without incurring major wind-throw losses). Similarly, neglected broadleaved woodlands may benefit from the removal of over-mature trees, increasing their age-diversity and habitat provision, as well as increasing their landscape and amenity value. Therefore, it is likely that escalating investment in management interventions will lead to an increase in sustainable woodland and forest management practices. While from the perspective of provisioning services this increased management is to be welcomed, care will need to be taken to ensure that this increased level of management does not have adverse impacts on biodiversity and ecosystem functioning.
The most significant threat to the future supply of provisioning services from woodlands lies in the spectre of pests and diseases. For example, over the course of the last century, Dutch Elm Disease (caused by the fungus Ophiostoma novo-ulmi and spread by the beetles of Scolytus species) has severely reduced the abundance and geographic distribution of elms in the UK. Another example of the importance of diseases is Sudden Oak Death, where the fungus Phytophthora ramorum can cause the sudden death of both native oak species. In addition, the last decade has witnessed a gradual increase in oak mortality, attributed to Acute Oak decline, although whether this is a single virulent disease, a combination of low-virulence diseases, or a combination of disease and climate change, is subject to ongoing research. Similarly, Red Band Needle Blight (caused
by the fungus Dothistroma septosporum) has, over the last couple of decades, dramatically reduced timber yields in infected plantation pine forests (Anon 2008). These are just a few of the pests and diseases that have damaged native and plantation trees in recent decades, and there remains the potential for other introduced pests and diseases to have similar, or even greater, impacts in the future.
15.8 Peat
Peat has been used as a resource by humans in the UK since Neolithic times. In the 19th Century, peat was used as stable litter and fuel to heat houses. The demand for peat fell in the middle of the 20th Century as the number of horses declined and other sources of domestic fuel, such as coal, became more widely available. The ancient right of turbary bestows on individuals or households the right to extract peat for use as a fuel, with specific restrictions. These rights were still in existence in parts of Northern Ireland and Scotland in 2010, although there is evidence from Northern Ireland that fewer people are taking up the these rights than in the previous 30 years (a 95% decrease in 2006 compared to 1983) (Jordan & Tomlinson 2007).
The use of peat in horticulture as a growing medium constituent (other than for acid-loving plants) began in the 1930s with the development and publication of the John Innes compost formulae. These were designed for professional growers to improve crop quality and reliability and employed a potting mixture of seven parts loam, two parts sand and three parts peat by volume (i.e. 25% peat). By the 1960s, it was recognised that a more reliable and consistent medium could be produced without stripping and preparing loam and, instead, using peat alone (or with sand, perlite, vermiculite, etc.). These new formulae had the added advantages of producing crops quicker, having lower shipping weights and a lower overall cost. These products began to be commercialised in the mid-1960s and led to an expansion of peat-harvesting once again. By the 1970s, peat composts had been introduced to the amateur gardener; the market grew rapidly, displacing John Innes, and the demand for peat rose. By 1997, the average peat content of growing media sold in the UK peaked at 96% of market share. However, just ten years later, under government pressure to reduce peat usage and with heavy investment in alternatives, the average peat content in growing media was cut to 81% and 72% in professional and retail products, respectively. During this time, peat use as a soil improver was almost completely eliminated, accounting for just 2% of sales by volume in 2007. The total volume of peat used in UK horticulture in 2007 was just over 3 million m3, of which, less than half (1.3 million m3) was sourced from within the UK.
In addition to its use in horticulture, peat is still sold for fuel in the form of briquettes and remains important in the whisky industry—peat is used to fuel the fires that dry damp malt. Some of the smoke from the burning peat enters the malting barley. The amount of smoke in the malt has an
Ecosystem Services | Chapter 15: Provisioning Services 619
impact on the taste of the whisky, giving rise to different, and consistent, tastes of malt whiskies. In some areas, there may have been over-extraction for the whisky industry, but more recently this industry has taken steps to reduce its use of peat.
The total area of land used for peat extraction has fallen from 14,980 ha in 1994 to 10,690 ha in 2009. The area of land used for extractions does not necessarily reflect the amount of peat extracted from that land in a given period. For example, at a GB scale, 1,616,000 m3 of peat were sold in 1999 (392,000 m3 derived in Scotland, 316,000 from north-east England and 249,000 m3 from north-west England), while, in 2008, this figure had fallen to 760,000 m3 (265,000 m3 from Scotland and 416,000 m3 from north-west England). No commercial exploitation of peat has occurred in Wales in recent times.
The control of commercial peat extraction lies with local authorities who hold information on extent, site location and after-use of extraction sites. In 2003, Scottish Natural Heritage commissioned a review of commercial peat extraction in Scotland which listed sites, areas, planning conditions and relation to nearby protected sites (Special Areas of Conservation (SACs) or Sites of Special Scientific Interest (SSSIs) which intersect or lie within one kilometre of the extraction area) (Scottish Government 2009). At that time, 72 peat extraction consent sites were recorded in Scotland (20 active, 16 expired, three pending, the remaining 33 awaiting confirmation). After-use for sites was varied and included wetland creation, forestry and agriculture (Scottish Government 2009).
Seventeen raised bogs in England and 24 in Scotland have permission for peat extraction, 12 of which have been (at least partly) notified as SSSIs. Local authorities could rescind permission to extract from a site, but this may require the government to pay compensation to owners of the peat extraction rights as occurred in the cases of Hatfield and Thorne Moors and Bolton Fell Moss.
15.8.1 Drivers of Change in Peat ExtractionThe combination of policy and demand will determine the amount of peat that is extracted from UK sources in the future. If consumer demand for peat is reduced, i.e. by further adoption of non-peat composts, then there will be less call for peat to be extracted. Similarly, if consumers send strong signals to commercial growers that they do not want to purchase products grown in peat, demand would also be reduced. However, as a lot of peat is currently imported into the UK from countries such as Ireland and the Baltic states, the relationship between demand for peat and UK extraction is not simple. In addition to changing consumer demands, policy could also lessen peat extraction through a reduction in extraction licences.
15.9 Ornamental Resources
Ecosystems provide a number of resources that humans use for ornamental purposes. These include: plants and flowers
used in gardens and for indoor decoration; animal resources, such as skins, heads and horns, used in taxidermy and as throws and wall mountings; minerals used as ornaments in gardens (e.g. river cobbles, limestone and slate) and as smaller, indoor decorations (e.g. polished stones); mollusc shells and fossils used in garden and indoor decoration; and driftwood and other pieces of timber used for various purposes. Unfortunately, there are very limited data on the use and production of these resources from UK, but data are available on the production of flowers and shrubs for ornamental purposes.
Some flowers are produced in open fields in the UK (4,578 ha grown in England in 2006), including daffodils and narcissi (3,871 ha)—many of which are produced in the Isles of Scilly, Cornwall, Pembrokeshire, Lincolnshire and south-west Scotland—and gladioli (252 ha) and pinks (56 ha). The area dedicated to these flowers has declined in recent years as retailers have tended to source flowers from producers in Europe and Africa.
Many flowers are also produced under glass; there are large enterprises in Lincolnshire and the south of England producing a range of flowers, such as 1,000 tonnes of narcissi for cut flowers, 84 million tulip bulbs, 151.5 million bulbs of irises and lilies, 566 ha of bedding plants and 56 ha of chrysanthemums. In addition, 45.6 million units of pot plants are produced for indoor use each year, including 11.9 million units of primroses and polyanthus, 1.9 million units of poinsettia and 3.7 million units of begonia. The relationship between glasshouse-produced flowers and ecosystems is limited, although glasshouse enterprises do require resources such as growing media, water and minerals. They also produce waste that needs to be disposed of off-site.
The economic importance of this sector is evidenced by data suggesting that, in 2002, the ornamental sector was worth around £674 million annually, having increased its total value by 50% during the 1990s. The largest ornamental sector was hardy nursery stock, which accounted for 49% of total production and a total value of £284 million. Between them, shrubs, roses and ornamental trees accounted for one third of the sector’s value. The UK fresh-cut flower and indoor plant market was worth over £1.45 billion at the retail level, while exports of ornamentals were valued at around £39 million in 2000 (NFU 2002).
15.9.1 Drivers of Change in the Ornamental SectorAlthough there are no long-term data available on the production of flowers in the UK, it is very likely that the increased wealth and house ownership that occurred in the latter half of the 20th Century served to increase the demand for shrubs, flowers and pot plants. Supporting evidence for this postulation comes from data on the total area of outdoor flowers and hardy nursery stock grown in England which increased from 6,921 ha in 1940 to 12,775 ha in 2000. If rising wealth is a driver of demand for ornamentals, then further increases will result in greater demand for these goods in the future. However, the opposite is also true: reduced spending by individuals and government in the future may reduce overall demand for ornamentals.
620 UK National Ecosystem Assessment: Technical Report
15.10 Genetic Resources
Genes are a resource to humans as the offer potential to meet future needs. Within-species genetic variation provides a range of building blocks which can be used to enhance the desirable traits and characteristics of species that already provide goods to humans, e.g. crops and livestock. Other species, which are closely related to existing crop and livestock species, can also provide genes that can enhance the benefits provided by their domesticated conspecifics. Thus desirable genes from wild relatives of domesticated plants can be transferred into crops through natural breeding or molecular techniques. At another level, the chemicals within animals, plants and microbes may themselves be useful to humans, such as in pharmaceuticals. In essence, it could be argued that all species are potentially beneficial to humans, and, as we do not know what our future needs will be, a prudent strategy would be to ensure that all extant species survive into the future. While there is some merit in this argument, it is also possible to identify some genetic resources that are more likely to be useful than others in the short-term.
One such group of resources is contained within the existing breeds and varieties of current livestock and crops. Commercial production of food tends to rely on relatively few breeds and varieties, which have been selected because of their productivity under current farming systems. However, many other breeds and varieties exist which are not commercially competitive in modern food production systems. It is a challenge to maintain viable populations of non-commercial breeds and varieties. Maintaining varieties of plants, such as wheat or apples, is relatively easy as seed banks provide a reliable long-term store of genetic material. Maintaining animal breeds is more difficult as they need constant care and attention (although long-term storage of semen and ova is becoming more viable). Some of the ‘rare livestock breeds’, such as Large Black pigs, are kept commercially as they offer niche food products, while others are kept as hobbies. Yet despite best efforts, it has been estimated that 26 native livestock breeds were lost from the UK between 1900 and 1973 (RBST 2010).
A second group of genetic resources is held in the wild relatives of crops and livestock. There are few truly wild relatives of livestock in the UK, as even the most feral goats and sheep are managed to some extent. Wild deer are perhaps the closest example of a wild livestock relative in the UK, but it could also be argued that brown trout, sea trout and wild salmon are also wild relatives of domesticated food animals. There are many more wild relatives of crops in the UK; Maxted et al. (2007) suggest that there are 413 genera and 195 species that have close genetic relationships with UK-grown crop plants. Of these, 85% are wild relatives of medicinal and aromatic plants, 82% of agricultural and horticultural crops, 15% of forestry plants and 30% of ornamentals. Although wheat is the most economically important crop in the UK, it has no wild relatives in this country. Consequently, the UK genus of highest economic importance as a crop wild relative is Brassica; this is because
of the several crop species of this genus grown here and their numerous wild relatives (Maxted et al. 2007). These data highlight both the potential importance of many plant species for future human welfare, and also the international dimension of any conservation effort aimed at maintaining these resources.
15.10.1 Drivers of Change for Genetic ResourcesThe breeding of new varieties of crops and livestock is a continuous process, and so, there is an ever-growing list of varieties that may warrant conservation. Such conservation is not without cost, and while maintaining rare breeds of animals may offer some income generation opportunities through sale of products and/or leisure experiences, seed banks are costly to build and maintain. For these reasons, the future conservation of many rare breeds and varieties depends upon governmental and societal preferences for spending money on these resources. Although industry may also benefit financially from the use of genetic resources in the future, it is hard to envisage a practical system whereby they would pay now for potential benefits they may accrue in the future. The conservation of crop wild relatives in the field is easier to achieve and these species could be conserved through ongoing habitat conservation initiatives and agri-environment schemes.
15.11 Water
Since the 1940s, the population of the UK has grown, introducing a greater demand for potable water. In addition, although private water supplies are still in use in many rural areas across the UK, there has generally been a movement towards greater connectivity to the central mains water supply. Not only do more people now access water from the mains supply, but the potable water supply also receives far greater levels of treatment than in previous decades, thereby reducing risks to human health. All the same, the amount of water put into the public water supply in England and Wales declined between 1990 and 2009. This trend was not evident in Scotland or Northern Ireland (Figure 15.13).
This decline in the water supply of England and Wales may be due to reduced demand from industry during that period. However, another factor that could affect this trend is the privatisation of the water industry in England and Wales in 1989; something that did not happen in Scotland or Northern Ireland. In addition, there is a far higher incidence of water meters in domestic premises in England and Wales (approximately 36% of homes) than in Scotland. The difference in uptake of water meters could be related to the differences in the cost of installation; in England and Wales installation is free to homeowners, while in Scotland the homeowner must bear the cost of installation.
In a similar vein, the total levels of abstractions in England and Wales stayed more or less constant between 1995 and 2007 (Table 15.10). Abstractions increased from 1995 to
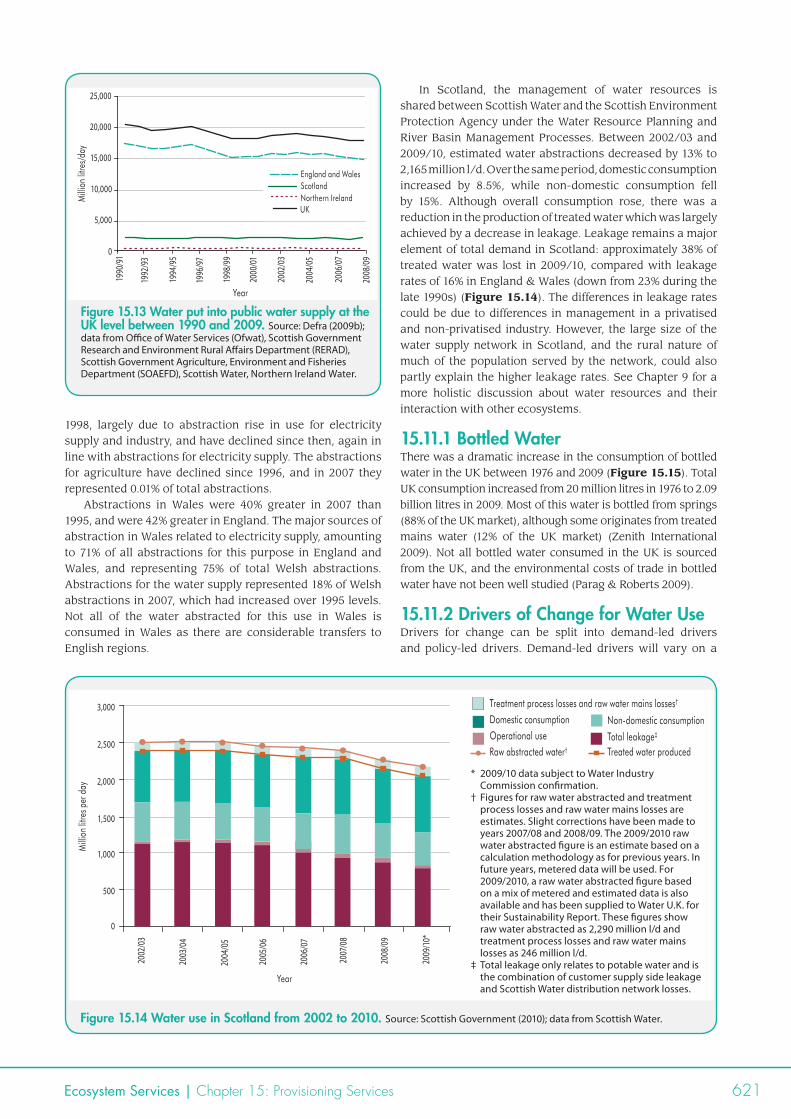
Ecosystem Services | Chapter 15: Provisioning Services 621
1998, largely due to abstraction rise in use for electricity supply and industry, and have declined since then, again in line with abstractions for electricity supply. The abstractions for agriculture have declined since 1996, and in 2007 they represented 0.01% of total abstractions.
Abstractions in Wales were 40% greater in 2007 than 1995, and were 42% greater in England. The major sources of abstraction in Wales related to electricity supply, amounting to 71% of all abstractions for this purpose in England and Wales, and representing 75% of total Welsh abstractions. Abstractions for the water supply represented 18% of Welsh abstractions in 2007, which had increased over 1995 levels. Not all of the water abstracted for this use in Wales is consumed in Wales as there are considerable transfers to English regions.
In Scotland, the management of water resources is shared between Scottish Water and the Scottish Environment Protection Agency under the Water Resource Planning and River Basin Management Processes. Between 2002/03 and 2009/10, estimated water abstractions decreased by 13% to 2,165 million l/d. Over the same period, domestic consumption increased by 8.5%, while non-domestic consumption fell by 15%. Although overall consumption rose, there was a reduction in the production of treated water which was largely achieved by a decrease in leakage. Leakage remains a major element of total demand in Scotland: approximately 38% of treated water was lost in 2009/10, compared with leakage rates of 16% in England & Wales (down from 23% during the late 1990s) (Figure 15.14). The differences in leakage rates could be due to differences in management in a privatised and non-privatised industry. However, the large size of the water supply network in Scotland, and the rural nature of much of the population served by the network, could also partly explain the higher leakage rates. See Chapter 9 for a more holistic discussion about water resources and their interaction with other ecosystems.
15.11.1 Bottled WaterThere was a dramatic increase in the consumption of bottled water in the UK between 1976 and 2009 (Figure 15.15). Total UK consumption increased from 20 million litres in 1976 to 2.09 billion litres in 2009. Most of this water is bottled from springs (88% of the UK market), although some originates from treated mains water (12% of the UK market) (Zenith International 2009). Not all bottled water consumed in the UK is sourced from the UK, and the environmental costs of trade in bottled water have not been well studied (Parag & Roberts 2009).
15.11.2 Drivers of Change for Water UseDrivers for change can be split into demand-led drivers and policy-led drivers. Demand-led drivers will vary on a
Figure 15.13 Water put into public water supply at the UK level between 1990 and 2009. Source: Defra (2009b); data from Office of Water Services (Ofwat), Scottish Government Research and Environment Rural Affairs Department (RERAD), Scottish Government Agriculture, Environment and Fisheries Department (SOAEFD), Scottish Water, Northern Ireland Water.
0
5,000
10,000
Milli
on li
tres/
day
1990
/91
1992
/93
1994
/95
1998
/99
2000
/01
2002
/03
2004
/05
2006
/07
Year
1996
/97
15,000
20,000
25,000
2008
/09
England and WalesScotlandNorthern IrelandUK
500
1,000
1,500
2,000
Milli
on li
tres p
er d
ay
2,500
3,000
0
2002
/03
2003
/04
2005
/06
2006
/07
2007
/08
2008
/09
Year
2004
/05
2009
/10*
* 2009/10 data subject to Water Industry Commission confirmation.
† Figures for raw water abstracted and treatment process losses and raw water mains losses are estimates. Slight corrections have been made to years 2007/08 and 2008/09. The 2009/2010 raw water abstracted figure is an estimate based on a calculation methodology as for previous years. In future years, metered data will be used. For 2009/2010, a raw water abstracted figure based on a mix of metered and estimated data is also available and has been supplied to Water U.K. for their Sustainability Report. These figures show raw water abstracted as 2,290 million l/d and treatment process losses and raw water mains losses as 246 million l/d.
‡ Total leakage only relates to potable water and is the combination of customer supply side leakage and Scottish Water distribution network losses.
Figure 15.14 Water use in Scotland from 2002 to 2010. Source: Scottish Government (2010); data from Scottish Water.
Treatment process losses and raw water mains losses†
Domestic consumptionOperational useRaw abstracted water† Treated water produced
Non-domestic consumptionTotal leakage‡
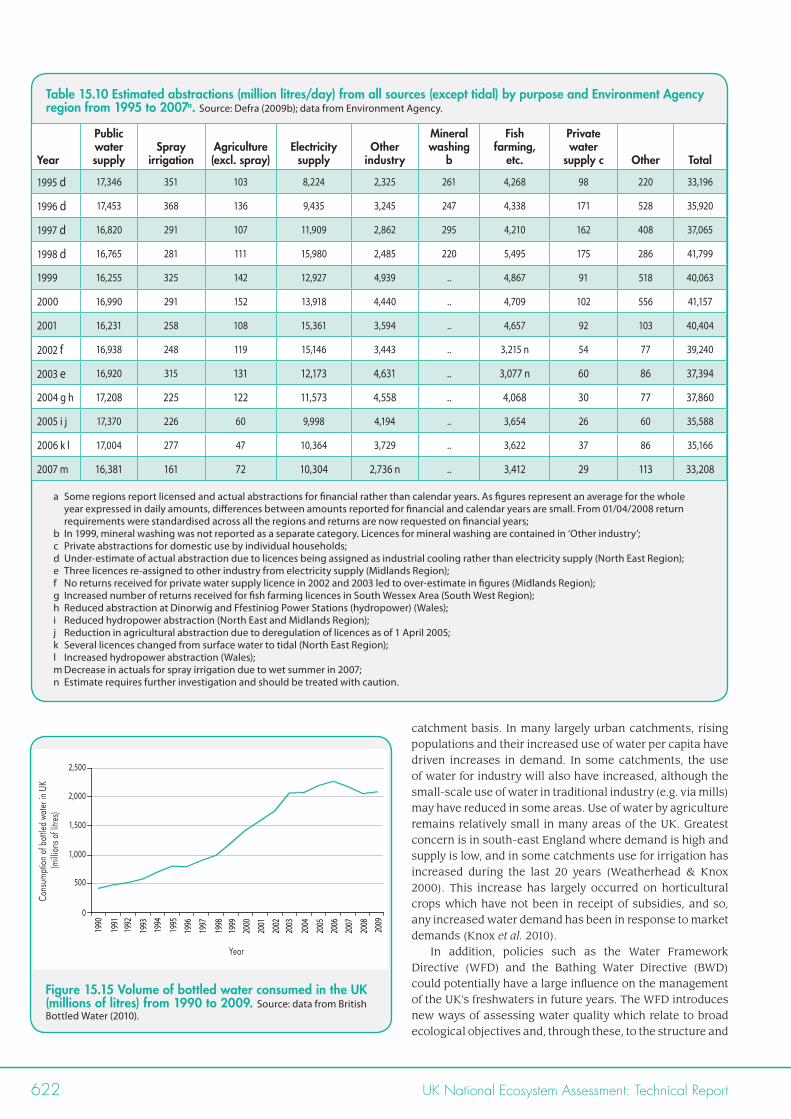
622 UK National Ecosystem Assessment: Technical Report
Table 15.10 Estimated abstractions (million litres/day) from all sources (except tidal) by purpose and Environment Agency region from 1995 to 2007a. Source: Defra (2009b); data from Environment Agency.
Year
Public water supply
Spray irrigation
Agriculture (excl. spray)
Electricity supply
Other industry
Mineral washing
b
Fish farming,
etc.
Private water
supply c Other Total
1995 d 17,346 351 103 8,224 2,325 261 4,268 98 220 33,196
1996 d 17,453 368 136 9,435 3,245 247 4,338 171 528 35,920
1997 d 16,820 291 107 11,909 2,862 295 4,210 162 408 37,065
1998 d 16,765 281 111 15,980 2,485 220 5,495 175 286 41,799
1999 16,255 325 142 12,927 4,939 .. 4,867 91 518 40,063
2000 16,990 291 152 13,918 4,440 .. 4,709 102 556 41,157
2001 16,231 258 108 15,361 3,594 .. 4,657 92 103 40,404
2002 f 16,938 248 119 15,146 3,443 .. 3,215 n 54 77 39,240
2003 e 16,920 315 131 12,173 4,631 .. 3,077 n 60 86 37,394
2004 g h 17,208 225 122 11,573 4,558 .. 4,068 30 77 37,860
2005 i j 17,370 226 60 9,998 4,194 .. 3,654 26 60 35,588
2006 k l 17,004 277 47 10,364 3,729 .. 3,622 37 86 35,166
2007 m 16,381 161 72 10,304 2,736 n .. 3,412 29 113 33,208
a Some regions report licensed and actual abstractions for financial rather than calendar years. As figures represent an average for the whole year expressed in daily amounts, differences between amounts reported for financial and calendar years are small. From 01/04/2008 return requirements were standardised across all the regions and returns are now requested on financial years;
b In 1999, mineral washing was not reported as a separate category. Licences for mineral washing are contained in ‘Other industry’; c Private abstractions for domestic use by individual households; d Under-estimate of actual abstraction due to licences being assigned as industrial cooling rather than electricity supply (North East Region); e Three licences re-assigned to other industry from electricity supply (Midlands Region); f No returns received for private water supply licence in 2002 and 2003 led to over-estimate in figures (Midlands Region); g Increased number of returns received for fish farming licences in South Wessex Area (South West Region); h Reduced abstraction at Dinorwig and Ffestiniog Power Stations (hydropower) (Wales); i Reduced hydropower abstraction (North East and Midlands Region); j Reduction in agricultural abstraction due to deregulation of licences as of 1 April 2005; k Several licences changed from surface water to tidal (North East Region); l Increased hydropower abstraction (Wales); m Decrease in actuals for spray irrigation due to wet summer in 2007; n Estimate requires further investigation and should be treated with caution.
catchment basis. In many largely urban catchments, rising populations and their increased use of water per capita have driven increases in demand. In some catchments, the use of water for industry will also have increased, although the small-scale use of water in traditional industry (e.g. via mills) may have reduced in some areas. Use of water by agriculture remains relatively small in many areas of the UK. Greatest concern is in south-east England where demand is high and supply is low, and in some catchments use for irrigation has increased during the last 20 years (Weatherhead & Knox 2000). This increase has largely occurred on horticultural crops which have not been in receipt of subsidies, and so, any increased water demand has been in response to market demands (Knox et al. 2010).
In addition, policies such as the Water Framework Directive (WFD) and the Bathing Water Directive (BWD) could potentially have a large influence on the management of the UK’s freshwaters in future years. The WFD introduces new ways of assessing water quality which relate to broad ecological objectives and, through these, to the structure and
Figure 15.15 Volume of bottled water consumed in the UK (millions of litres) from 1990 to 2009. Source: data from British Bottled Water (2010).
0
500
1,000
1,500
2,500
Cons
umpt
ion
of b
ottle
d wa
ter i
n UK
(m
illion
s of l
itres
)
2,000
1990
1991
1992
1993
1994
1995
1996
1997
1998
1999
2000
2001
2002
2003
2004
2005
2006
2007
2008
2009
Year
Ecosystem Services | Chapter 15: Provisioning Services 623
agri-environment schemes (Carvell et al. 2007; Walker et al. 2007). Similar events have also happened at the large scale when private organisations, such as the Royal Society for the Protection of Birds and National Trust, buy agricultural land and then manage it for biodiversity. In both cases, however, somebody has to pay for the environmental enhancement. In the former case, it is the tax payer, and in the latter case it is the charities’ memberships. These systems raise some questions about fairness of payment and distribution of benefits; for instance, should all tax payers contribute to agri-environment payments that increase biodiversity on private land that they will never see? Or is it fair for charity members to support biodiversity which potentially benefits more people than themselves? Are the general public free-riding on the actions of those charity members?
Similar tensions occur in marine fisheries, and, to a large extent, much of recent fisheries policy has been trading-off short-term sector profitability against longer-term stock protection. While fisheries policy has tried to regulate fisheries activities though imposing close seasons for certain stock and restricting the number of days that trawlers may actively fish, perhaps the best examples of trade-offs relate to gear restrictions and closed areas. Gear restrictions seek to limit the types of fishing gear that can be used in certain locations and/or for catching certain fish species: these are known as ‘technical measures’. Technical measures can be used to achieve a range of management objectives. For example, minimum mesh sizes may be used to encourage the release of under-sized or juvenile fish, while the use of separator panels or square mesh codends may eliminate the catching of species for which the fishers have no quota or that would be taken as by-catch.
Biodiversity can also be enhanced by extensification of production practices. These may include reduction in inputs to crops, wider planting densities in crops and reduced stocking rates of grazing animals. Similarly, in forestry and fisheries it is possible to develop techniques that provide ‘more space for nature’, for example, more broadleaved trees in conifer plantations and ‘no-take zones’ in sea fisheries. Although such activities enhance biodiversity, they may not enhance either levels of food/fibre provision or the incomes of landowners and rural communities. Furthermore, they may not necessarily serve to reduce the emissions of greenhouse gases from production activities. For example, low stocking rates of suckler beef herds may offer biodiversity benefits to upland and marginal habitats, but the slow growth rates of stock in these systems results in greater levels of lifetime methane emissions than in some other beef production systems. Unfortunately, this argument is complicated by the fact that some extensive grazing systems serve to protect extensive carbon stocks in soils, while others may even be able to enhance carbon sequestration on farms (Taylor et al. 2010).
Thus the challenge for sustainable management is to find options that offer advances in more than one dimension of sustainability at a time. Can we devise food/fibre production systems that protect biodiversity and reduce greenhouse gas emissions, while still maintaining incomes and cultural values? There are few examples of such win:win management
function of aquatic ecosystems themselves. These objectives are to be met through a river basin management planning system which will seek to deliver integrated management of ground, fresh and coastal waters. The BWD seeks to monitor and improve bathing water quality around the coasts of EU members. In order to achieve this, the EU has set limits for physical, chemical and microbiological parameters, and national authorities must ensure that these limits are not exceeded. Agriculture and land use clearly play important roles in delivering high quality water resources, and, as a result of these new policies, there may be greater pressure on landowners to reduce the amount of chemical and biological pollutants entering water bodies. Several studies highlight problems associated with meeting the required standards (Kay et al. 2007; Howden et al. 2009), while others suggest that compliance may be financially costly for individual businesses (Fezzi et al. 2008).
15.12 Trade-offs, Synergies and Options for Sustainable Management
Detailed discussions of trade-offs and synergies for many of the habitats that provide provisioning services are provided in Chapters 5–9 and 11–12; in order to prevent repetition, this section provides a summary overview of some of the key issues in sustainable management of habitats and ecosystems for the supply of provisioning services.
The provision of food and fibre has large and significant interactions with many ecosystems. Indeed, much of the UK’s land and sea is managed to provide these services. Because of this, the trade-offs and synergies are many. Generally, if management is intensive, there is a greater impact on the environment, but the delivery of provisioning services may also be enhanced, for example, increased yield in intensive compared to organic wheat. There are occasions where management can be made less intensive, for example, when a farmer offers a niche product from an extensive farm system, however, it is not apparent that all of society’s needs can be met from such ‘extensive but niche’ systems.
Some foods and fibre are harvested from less intensively managed ecosystems, e.g. game, sea fish and timber from broadleaved woodland. In these ecosystems, there are trade-offs between harvest method, size of harvest, price and long-term supply of the goods. If regulated properly, such harvests can be truly sustainable; however, it is unclear how many of our needs for food and fibre can be met from such systems.
Within more intensive production systems there are many known options for introducing management that can enhance one dimension of sustainability at a time. For example, levels of farmland biodiversity can be enhanced by removing land from agricultural production and enabling re-establishment of natural habitats, as promoted by some
624 UK National Ecosystem Assessment: Technical Report
changes available at the moment. So the question that must be asked is: which elements of the sustainability agenda are most important to achieve, and which are least important? If society can define this, then there are options for enhancing sustainability on one or two dimensions simultaneously. However, if demand for provisioning services continues to increase, society will face some very hard choices: to date, there are few examples of provisioning services which meet the highest standards of environmental and social sustainability while simultaneously being highly productive and profitable.
15.13 Key Questions and Knowledge Gaps
The specific knowledge gaps and research needs relating to many of the habitats discussed in this chapter are presented in Chapters 5–9 and 12, the purpose here is to present some of the common and overarching questions and gaps relevant to provisioning services from all habitats.
15.13.1 How Should We Spatially Allocate Productive and Environmental Management Activities?There is a debate in agriculture about how to spatially integrate productive and environmental management activities (Fischer et al. 2008; Ewers et al. 2009; Hodgson et al. 2010). One option is to separate these two activities and to prioritise production in some areas and environmental conservation in others. A second option is to encourage production and environmental management to occur at the same spatial scale. This debate is relevant at several spatial scales. For example, within a field there could be intensively managed crops in the centre and a wide field margin managed for wildlife at the edge. Alternatively, the whole field could be managed less intensively with lower seed rates, reduced use of agrochemicals and gaps for wildlife, such as skylark scrapes (Smith et al. 2009), being present throughout the crop. At larger spatial scales there is potential to have some fields on a farm managed intensively for production and to allocate other areas of the farm for environmental purposes. While at the landscape-scale there is potential to have some larger areas of land dedicated to production and others dedicated to environmental purposes (e.g. reserves of some type).
Similar debates are relevant to fisheries and forestry. Within forestry, the questions are similar to those within agriculture: should commercial forests focus solely on maximising timber production, or should they include areas for wildlife and recreation (e.g. open areas, areas of non-commercial broadleaved species, wide forest rides, etc.) (Hale et al. 2009; Tomkins 1990)?
In marine fisheries, debate centres around whether areas of the sea should be designated as marine reserves or no-take zones, while others are left for production (Lorenzen et al. 2008; Richardson et al. 2006), or whether fishers should be
asked to undertake environmentally sustainable activities in all areas. At the extreme, we could ask if increased use of intensive aquacultural activities would serve to reduce fishing pressure on the open ocean.
The environmental and economic costs and benefits of applying these options at various scales are poorly understood, and the balance of costs and benefits will change over time as demand for food and fibre fluctuates. We need a better understanding of the environmental, economic and social aspects of applying these alternative strategies in different locations on land and at sea. Related to this is a need to understand how the best overall option could be implemented in an efficient and effective manner.
15.13.2 What Level of Species Redundancy is There in Productive Ecosystems?This question is related to the question set out in Section 15.13.1 but focuses more on the levels of biodiversity we should aim to see in productive ecosystems. It could be argued that some of the biodiversity observed on UK farms has little impact on the productive potential of that farm. Advocates of the view that some biodiversity is irrelevant to production could point to the increased trends in wheat yields observed over the last 50 years in the UK and the simultaneous decline in farmland birds (Newton 2004; Fuller & Ausden 2008). They would argue that if farmland birds really were crucial to the health of the productive ecosystem then yields would have decreased at the same time as the populations of farmland birds declined. Indeed, advocates of such a view may point more widely to global trends and highlight the fact that, despite species going extinct at an unprecedented rate (Pimm et al. 1995), levels of agricultural production tend to be increasing; this suggests that, at a global level, many species are not that important to production-related activities. There are many counter arguments to this viewpoint (Bell et al. 2005; Bunker et al. 2005; Chapin et al. 2000; Hector et al. 2007; Loreau et al. 2001), and, as Ehrlich & Ehrlich (1981) pointed out, species loss is analogous to losing rivets from an aircraft wing. You can afford to lose a few rivets without any worry, but you never know when losing another rivet will lead to the loss of the wing, and thereby the loss of all life on the aircraft.
If, in the future, we do need to increase the levels of food and fibre produced from our ecosystems, then it would be useful to understand which species really are crucial to maintaining the productive ability of the ecosystems, and which are effectively redundant from a production point of view. Such information would ensure that managers of farms, forests and fisheries do not accidentally cause loss of species vital to the functioning of their productive ecosystems. It would also enable conservation strategies to be developed for those species that are functionally redundant.
15.13.3 How Can We Predict When Environmental Pressures Will Serve to Reduce Future Flows of Provisioning Services in Given Ecosystems?All systems which provide food and fibre are vulnerable to two broad classes of factors which could render them
Ecosystem Services | Chapter 15: Provisioning Services 625
unsustainable in the long-term: intrinsic and extrinsic effects. Intrinsic effects can be defined as the impact of activities that arise within that production system upon itself. Extrinsic effects can be defined as the impact of activities outside the production system on that system. An example of an intrinsic effect would include the over-cultivation of some soils which leads to extreme soil erosion and prevents the further use of that land for crop production. An example of an extrinsic effect would be the impact of a distant pollution event on the ability of a piece of land to produce some provisioning services (e.g. the impact of radioactivity from the Chernobyl explosion on sheep production in some areas of the UK).
As described earlier in this chapter, the output of services (per unit area of land) and labour (measured in terms of weight and calories from UK agriculture) increased between 1945 and 2009 in nearly all areas of crop and livestock production. It is also evident that the production of food from agriculture has had wide and varied impacts on the environment; for example, overgrazing on the hills and mountains, pesticide-poisoning of raptors in the 1950 and 1960s, water pollution from phosphorus and nitrogen, and cropping system impacts on populations of farmland birds (Cade et al. 1971; Newton 2004; Haygarth et al. 2009; Potts et al. 2010a). However, the fact that more food is produced in the UK now than in 1940s suggests that the environmental impacts of agriculture have not yet reduced its own productive capacity. In other words, the productive activities of agriculture have not had long-term and lasting intrinsic effects on its ability to provide provisioning goods and services.
The situation in sea fisheries is very different; there have been continued declines in catches of fish over the period 1945 to 2009. The main hypothesised cause for these declines relates to overharvesting of the fish resource (Cook et al. 1997; Hutchings 2000; Pauly et al. 1998). In effect, the activities of fishers themselves had had a long-term impact on the level of provisioning services provided by the UK’s marine ecosystems.
It would be useful to develop indicators that would alert managers to the risk of intrinsic effects decreasing their productive activities in the future. This would enable them to alter their management regimes and, hopefully, ensure the long-term flow of provisioning services from their systems. However, while the development of some indicators may be relatively straightforward at a biophysical level, it may be more difficult to ensure that managers act on the signals they provide. For example, it was evident for many years that the total catch and catch per unit effort of many species of sea fish were in decline (both of which may be indicators of the stock’s long-term health), but neither policy makers nor fishers acted effectively on this information. Similarly, in some areas of the world, soil salinity was identified as a problem for cropping systems but no effective action was taken to effectively manage salinity levels; as a result, these areas have now been abandoned (Edwards-Jones 2003).
The reasons why managers may not act on such indicators are complex and varied. Some resource users may not have any options for changing their management regimes, and/or science may not be able to suggest viable alternative management systems to farmers and fishers.
There may also be dispute over the cause of an observed change in the indicator, for example, some people may argue that reduced fish stocks are not related to overfishing, but to other causes instead, such as climate change (Brander 2010; Halliday & Pinhorn 2009). Finally, other factors may serve to obscure the signal provided by the indicator. For instance, technology that enables production to increase despite the impact of declining environmental quality may serve to mask underlying trends in the productive capacity of the ecosystem; new crop varieties may offer enhanced yields despite deteriorating soil quality; and better management of inputs may serve to maintain yields despite declines in natural predators of pests.
Several questions which are relevant to the future management of the UK’s productive ecosystems arise from a consideration of the impact of intrinsic and extrinsic factors on these systems:a) Can we rely on the continued investment in agricultural
science and technology to ensure that negative intrinsic effects will not affect the continued flow of provisioning goods and services?
b) How should society balance the impacts of intrinsic and extrinsic effects of production?
c) Are there any early indicators that intrinsic effects are starting to have negative impacts on the ability of production systems to provide a flow of provisioning goods and services?
d) In the future, are the flows of provisioning services from the UK more likely to be interrupted by intrinsic or extrinsic factors?
e) Can the flow of provisioning services from production systems, such as sea fisheries and forestry, be enhanced by altered patterns of investment in science and technology?
15.13.4 How Can We Enhance Resource Efficiency and Reduce Levels of Waste and Pollution?Natural resources are finite, yet nearly all of human activity depends upon the use of these resources. Recently, there has been much focus on the quantities of oil that remain to be mined (Charpentier 2002; Verbruggen & Marchohi 2010), but many other inputs to production systems are derived from non-renewable sources such as metals, phosphorus and other minerals (Edwards-Jones & Howells 2001). Technological improvements in mining and related industries, combined with increased prices for some non-renewable materials due to increased scarcity, make it more economically viable to access previously untapped pockets of many resources. But this does not remove the fact that these resources are ultimately finite, and it would be a wise long-term strategy to minimise their use.
Similarly, it would seem wise to reduce the amount of waste and pollution that productive activities cause. This is particularly relevant in the context of climate change. Currently, there is much interest in reducing greenhouse gas emissions from agriculture (Burney et al. 2010; Huang & Tang 2010; Smith et al. 2010), but there remains a considerable challenge in achieving real and meaningful reductions in overall levels of emissions, particularly in levels of greenhouse gases per unit of production.
626 UK National Ecosystem Assessment: Technical Report
For these reasons, a very real and immediate challenge across agriculture, fisheries and forestry is to increase the resource efficiency of production by developing systems of production that use fewer non-renewable resources (including water) per unit of production, while simultaneously producing lower levels of pollution per unit of production. This task can only be achieved by the active and positive interaction of scientists, engineers and industry. Recent multi-disciplinary research initiatives and partnership between academia and industry offer some hope for progress in this field. However, the relevant research questions are very applied in nature, and to date many of state funders of research have struggled to divert substantial funds to such applied fields. Developing suitable mechanisms to fund the necessary applied multi-disciplinary research presents a challenge for government and the research community.
ReferencesAcs, S., Hanley, N., Dallimer, M., Gaston, K.J., Robertson, P.,
Wilson, P. & Armsworth, P.R. (2010) The effect of decoupling on
marginal agricultural systems: Implications for farm incomes,
land use and upland ecology. Land Use Policy, 27, 550–563.
Aebischer, N.J. (1997). Gamebirds: management of the
grey partridge in Britain. Conservation and the Use of Wildlife
Resources (ed. M.Bolton), pp. 131-151. Chapman & Hall, London.
Aebischer, N.J. & Ewald, J.A. (2010) Grey Partridge Perdix
perdix in the UK: recovery status, set-aside and shooting. Ibis
152, 530–542.
Anderson, A. (2006) Spinning the rural agenda: The
countryside alliance, fox hunting and social policy. Social Policy
& Administration, 40, 722–738.
Anonymous (2008) New Research Note: Red band needle
blight. Scottish Forestry, 62, 30.
Asfaw, S., Mithofer, D. & Waibel, H. (2010) Agrifood supply
chain, private-sector standards, and farmers’ health: evidence
from Kenya. Agricultural Economics, 41, 251–263.
Barnes, R.F.W. (1987) Long term declines of red grouse in
Scotland. Journal of Applied Ecology, 24, 735–741.
Bell, T., Newman, J.A., Silverman, B.W., Turner, S.L. & Lilley,
A.K. (2005) The contribution of species richness and composition
to bacterial services. Nature, 436, 1157–1160.
Berthoud, H., Imdorf, A., Haueter, M., Radloff, S. & Neumann
P. (2010) Virus infections and winter losses of honey bee colonies
(Apis mellifera). Journal of Apicultural Research, 49, 60–65.
Benn, R., Weaver, P.P,. Billet, D.S.M., van den Hove, S.,
Murdock, A.P., Doneghan, G.B. & Le Bas, T. (2010) Human
Activities on the Deep Seafloor in the North East Atlantic: An
Assessment of Spatial Extent. PLoS One, 5: Article No.: e12730
Art No. 2010.
Bjornsson, B. & Dombaxe, M.A.D. (2004) Quality of
Nephrops as food for Atlantic cod (Gadus morhua L.) with
possible implications for fisheries management. ICES Journal of
Marine Science, 61, 983–991.
Boersma, L., Gasper, E., Oldfield, J.E. & Cheeke, P.R. (1981)
Methods for the recovery of nutrients and energy from swine
manure. 1. Biogas. Netherlands Journal of Agricultural Science, 29,
3–14.
Bornett, H.L.I., Guy, J.H. & Cain, P.J. (2003) Impact of
animal welfare on costs and viability of pig production in the UK.
Journal of Agricultural & Environmental Ethics, 16, 163–186.
Bowen-Walker, P.L. & Gunn, A. (2001) The effect of the
ectoparasitic mite, Varroa destructor on adult worker honeybee
(Apis mellifera) emergence weights, water, protein, carbohydrate,
and lipid levels. Entomologia Experimentalis et Applicata, 101,
207–217.
Brander, K.M. (2010) Cod Gadus morhua and climate
change: processes, productivity and prediction. Journal of Fish
Biology, 77, 1899–1911.
British Beekeepers’ Association (2009) Honey Bee Health
Research Concepts, January 2009.
British Bottled Water (2010) Water’s vital statistics:
industry data. [online] Available at <http://www.
britishbottledwater.org/vitalstats2.html> [Accessed 07.03.11].
Brouwer, F.M. & van Berkum, S. (1996) CAP and
environment in the European Union: Analysis of the effects
of the CAP on the environment and assessment of existing
environmental conditions in policy. Wageningen Pers, The
Netherlands pp vii+171p ISBN: 90-74134-39-4.
Bunce, R.G.H., Bell, M. & Farino, T. (1998) The
environmentally sensitive area legislation in the United Kingdom
and its potential application to the Picos de Europa mountains in
north-west Spain. Environmental Conservation, 25, 219–227.
Bunker, D.E., DeClerck, F., Bradford, J.C., Colwell, R.K.,
Perfecto, I., Phillips, O.L., Sankaran, M. & Naeem, S. (2005)
Species loss and aboveground carbon storage in a tropical forest.
Science, 310, 1029–1031.
Burney, J.A., Davis, S.J. & Lobell, D.B. (2010) Greenhouse
gas mitigation by agricultural intensification. Proceedings of the
National Academy of Sciences of the United States of America, 107,
12052–12057.
Burton, M., Rigby, D., Young, T. & James, S. (2001)
Consumer attitudes to genetically modified organisms in food in
the UK. European Review of Agricultural Economics, 28, 479–498.
Cade, T.J., Lincer, J.L., White, C.M., Roseneau, D.G. &
Swartz, L.G. (1971) DDE residues and eggshell changes in
Alaskan Falcons and hawks. Science, 172, (3986), 955–1971.
Capper, J.L., Cady, R.A. & Bauman, D.E. (2009) The
environmental impact of dairy production: 1944 compared with
2007. Journal of Animal Science, 87, 2160–2167.
Carvell, C., Meek, W.R., Pywell, R.F., Goulson, D. &
Nowakowski, M. (2007) Comparing the efficacy of agri-
environment schemes to enhance bumble bee abundance and
diversity on arable field margins. Journal of Applied Ecology 44,
29–40.
Cefas (Centre for Environment, Fisheries and
Aquaculture Science) & Environment Agency (2009)
Annual Assessment of Salmon Stocks in England and Wales
2008. Preliminary assessment prepared for ICES, March 2009.
Environment Agency & Cefas, 117 pp.
Chapin, F.S., Zavaleta, E.S., Eviner, V.T., Naylor, R.L.,
Vitousek, P.M., Reynolds, H.L. & Hooper, D.U., Lavorel, S., Sala,
O.E. Hobbie, S.E. Mack, M.C., Diaz, S. (2000) Consequences of
changing biodiversity. Nature, 405, 234–242.
Charpentier, R.R. (2002) Hubbert’s peak – The impending
world oil shortage. Science, 295, 1470–1470.
Ecosystem Services | Chapter 15: Provisioning Services 627
Chen, J.S. (2009) Food oral processing – A review. Food
Hydrocolloids, 23, 1–25.
CIWF (Compassion in Wild Farming) (2010) Pigs in
Europe still suffering says Compassion. [online] Available at:
<http://www.ciwf.org.uk/news/pig_farming/pigs_in_europe_
still_suffering.aspx> [Accessed 16.10.10].
Cook, R.M., Sinclair, A. & Stefansson, G. (1997) Potential
collapse of North Sea cod stocks. Nature, 385, 521–522.
Cooper, M.D. & Wrathall, J.H.M. (2010) Assurance schemes
as a tool to tackle genetic welfare problems in farm animals:
broilers. Animal Welfare, 19, 51–56.
Cotterill, R.W. (2006) Antitrust analysis of supermarkets:
global concerns playing out in local markets. Australian Journal
of Agriculultural and Resource Economics, 50, 17–32.
Cracknell, R. (2009) Sea fisheries statistics. House of
Commons Library Standard Note: SN/SG/2788 16pp.
DairyCo (2009) Confidence key to halting decline in milk
supply. [online] Available at: <http://www.dairyco.org.uk/news/
press-archive/january-2009/confidence-key-to-halting-decline-
in-milk-supply.aspx> [Accessed 07.03.11].
Davis, D.R., Epp, M.D. & Riordan, H.D. (2004) Changes in
USDA food composition data for 43 garden crops, 1950 to 1999.
Journal of the American College of Nutrition, 23, 669–682.
de Lange, K. (1999) Feeding growing-finishing pigs for profit
– Main concepts and new opportunities. (Ed. Ball, R.) Advance
in Pork Production, 10123–144, 28th Banff Pork Seminar, Banff,
Canada.
Defra (Department for Environment, Food and Rural
Affairs) (2006) Food Security and the UK: An Evidence and
Analysis Paper. Food Chain Analysis Group, Defra, 87pp. [online]
Available at: <http://archive.defra.gov.uk/evidence/economics/
foodfarm/reports/documents/foodsecurity.pdf>.
Defra (Department for Environment, Food and Rural
Affairs) (2009a) Agriculture in the UK 2009 Report. [online]
Available at: <http://www.defra.gov.uk/statistics/2010/03/18/
auk-2009/> [Accessed 07.03.11].
Defra (Department for Environment, Food and Rural
Affairs) (2009b) Environmental and Wildlife Statistics – Inland
water. [online] Available at: <http://www.defra.gov.uk/
evidence/statistics/environment/> [Accessed: 28.04.11].
Defra (Department for Environment, Food and Rural
Affairs) (2009c) Strategic Review of Aquaculture Potential
England. [online] Available at: <http://archive.defra.gov.uk/
foodfarm/fisheries/documents/aquaculture-report0904.pdf>
[Accessed 07.03.11].
Defra (Department for Environment, Food and Rural
Affairs) (2010a) Yield and production time series. [online]
Available at: <http://www.defra.gov.uk/statistics/foodfarm/
food/cereals/cerealsoilseed/> [Accessed 07.03.11].
Defra (Department for Environment, Food and Rural
Affairs) (2010b) Environmental Stewardship. [online] Available
at: <http://www.defra.gov.uk/food-farm/land-manage/>
[Accessed 16.10.10].
Dimmock, J.P.R.E., Bennett, S.J., Wright, D., Edwards-
Jones, G. & Harris, I.M. (2005). Agronomic evaluation and
performance of flax varieties for industrial fibre production.
Journal of Agricultural Science, 143, 299–309.
Dittirch, P., Senser, M. & Frielinghaus, J. (1989).
Comparative study on the turnover of quinic acid and shikimic
acid and its derivaties in the needles of Norway Spruce,
Picea abies (L) Karst affected by Waldsterben syndrome.
Forstwissenschaftliches Centralblatt, 108, 103–110.
Donaldson, A., Lowe, P. & Ward, N. (2002) Virus-crisis-
institutional change: The foot and mouth actor network and the
governance of rural affairs in the UK. Sociologica Ruralis, 42,
201–214.
Dreezens, E., Martijn, C., Tenbult, P., Kok, G. & de Vries,
N.K. (2005) Food and the relation between values and attitude
characteristics. Appetite, 45, 40–46.
Dubuit, M.H. (1995) Food and feeding of cod (Gadus morhua
L ) in the Celtic Sea. Fisheries Research, 22, 227–241.
Dyke, A. & Newton, A. (1999) Commercial harvesting of
wild mushrooms in Scottish forests: is it sustainable? Scottish
Forestry, 53 (2) 77–85.
Edwards-Jones, G. (2003) Agricultural policy and
environment in Syria: The cases of rangeland grazing and
soil management. Syrian Agriculture at the Crossroads, FAO
Agricultural Policy and Economic Development Series. No 8.
Rome pp 117–133.
Edwards-Jones, G. (2010) Are eating local food and
increasing national levels of self-sufficiency good for the health
of the environment and consumers? Proceedings of the Nutrition
Society, 69, 582–591.
Edwards-Jones, G. & Howells, O. (2001) The origin and
hazard of inputs to crop protection in organic farming systems:
Are they sustainable? Agricultural Systems, 67, 31–47.
Edwards-Jones, G., Plassmann, K., York, E.H.,
Hounsome, B., Jones, D.L. & Milà i Canals, L. (2009)
Vulnerability of Exporting Nations to the Development of a
Carbon Label in the United Kingdom. Environmental Science
and Policy, 12, 479–490.
Ehrlich, P.R. & Ehrlich, A.H. (1981) Extinction: the Causes
and Consequences of the Disappearance of Species. Random
House, New York, NY.
Engelhard, G.H. (2005) Catalogue of Defra historical catch
and effort charts: six decades of detailed spatial statistics for British
fisheries. Sci. Ser. Tech. Rep., Cefas Lowestoft, No. 128: 42pp.
Ewers, R.M., Scharlemann, J.P.W., Balmford, A. & Green,
R.E. (2009) Do increases in agricultural yield spare land for
nature? Global Change Biology, 15,1716–1726.
Fera (Food and Environment Research Agency) (2011)
Honey bees. [online] Available at: <http://www.fera.defra.gov.
uk/plants/beeHealth/> [Accessed 25.01.11].
Ferris, C.P., Gordon, F.J., Patterson, D.C., Kilpatrick, D.J.,
Mayne, C.S. & McCoy, M.A. (2001) The response of dairy cows
of high genetic merit to increasing proportion of concentrate
in the diet with a high and medium feed value silage. Journal of
Agricultural Science, 136, 319–329.
Fezzi, C., Rigby, D., Bateman, I.J., Hadley, D. & Posen, P.
(2008) Estimating the range of economic impacts on farms of
nutrient leaching reduction policies. Agricultural Economics, 39,
197–205.
Fischer, J. Brosi, B. Daily, G.C., Ehrlich, P.R., Goldman,
R., Goldstein, J., Lindenmayer, D.B., Manning, A.D., Mooney,
H.A., Pejchar, L., Ranganathan, Jai. & Tallis, H. (2008) Should
agricultural policies encourage land sparing or wildlife-friendly
farming? Frontiers in Ecology and the Environment, 6, 380–385.
Forestry Commission (2010) Timber Sales. [online]
Available at: <http://www.forestry.gov.uk/forestry/INFD-
7BADDP> [Accessed 07.03.11].
628 UK National Ecosystem Assessment: Technical Report
Frost H. & Andersen, P. (2006) The Common Fisheries Policy
of the European Union and fisheries economics. Marine Policy,
30 (6) 737–746.
Fuller, R.J. & Ausden, M. (2008) Birds and habitat change
in Britain Part I: a review of losses and gains in the twentieth
century. British Birds, 101, 644–675.
Fuller, R.J. & Gough, S.J. (1999) Changes in sheep
numbers in Britain: implications for bird populations. Biological
Conservation, 91,73–89.
Green, R.E. (1996) Factors affecting the population density
of the corncrake Crex crex in Britain and Ireland. Journal of
Applied Ecology, 33, 237–248.
GWCT (Game & Wildlife Conservation Trust) (2009)
National GameBag Census. [online] Available at: <http://www.
gwct.org.uk/research__surveys/wildlife_surveys/national_
gamebag_census/trends_in_game_bags/default.asp> [Accessed
07.03.11].
Hadjimichael, M., Edwards-Jones, M. & Kaiser, M.J. (2010)
Distribution of the burden of fisheries regulations in Europe: The
north/south divide. Marine Policy, 34,795–802.
Hale, S.E., Edwards, C., Mason, W.L., Price, M. & Peace, A.
(2009) Relationships between canopy transmittance and stand
parameters in Sitka spruce and Scots pine stands in Britain.
Forestry, 82, 503–513.
Halliday, R.G. & Pinhorn, A.T. (2009) The roles of fishing
and environmental change in the decline of Northwest Atlantic
groundfish populations in the early 1990s. Fisheries Research, 97,
163–182.
Harris, S. & Swinbank, A. (1997). The CAP and the Food
Industry. The Common Agricultural Policy (Eds. C Ritson & D R
Harvey). CAB, Wallingford UK.
Harrison, M., Lee, A., Findlay, M., Nicholls, R., Leonard, D. &
Martin, C. (2010) The increasing cost of healthy food. Australian
and New Zealand Journal of Public Health, 34, 179–186.
Haygarth, P.M., ApSimon, H., Betson, M., Harris, D.,
Hodgkinson, R. & Withers, P.J.A. (2009) Mitigating Diffuse
Phosphorus Transfer from Agriculture According to Cost and
Efficiency. Journal of Environmental Quality, 38, 2012–2022.
Hector, A. & Bagchi, R. (2007) Biodiversity and ecosystem
multifunctionality. Nature, 448,188–U6.
Hinz, H. Prieto, V. & Kaiser, M.J. (2009) Trawl disturbance
on benthic communities: chronic effects and experimental
predictions. Ecological Applications, 19, 761–773.
Hodge, I. & McNally, S. (1998) Evaluating the
environmentally sensitive areas: the value of rural environments
and policy relevance. Journal of Rural Studies, 14, 357–367.
Hodgson, J.A., Kunin, W.E., Thomas, C.D., Benton, T.G. &
Gabriel, D. (2010) Comparing organic farming and land sparing:
optimizing yield and butterfly populations at a landscape scale.
Ecology Letters, 13, 1358–1367.
Hope, D., Picozzi, N., Catt, D.C. & Moss, R. (1996) Effects
of reducing sheep grazing in the Scottish Highlands. Journal of
Range Management, 49, 301–310.
Howden, N.J.K., Bowes, M.J., Clark, A.D.J., Bowes, M.J.,
Clark, A.D.J., Humphries, N. & Neal, C. (2009) Water quality,
nutrients and the European union’s Water Framework Directive
in a lowland agricultural region: Suffolk, south-east England.
Science of the total Environment, 407, 2966–2979.
Huang, Y. & Tang, Y.H. (2010) An estimate of greenhouse
gas (N2O and CO2) mitigation potential under various scenarios
of nitrogen use efficiency in Chinese croplands. Global Change
Biology, 16, 2958–2970.
Hutchings, J.A. (2000) Collapse and recovery of marine
fishes. Nature, 406, 882–885.
Jackson, P. (2010) Food stories: consumption in an age of
anxiety. Cultural Geographies, 17, 147–165.
JNCC (Joint Nature Conservation Committee) (2010)
8. Area of land under agri-environment scheme management.
[online] Available at: <http://www.jncc.gov.uk/default.
aspx?page=4243> [Accessed 07.03.11].
Jones, R. (2004) European beekeeping in the 21st century:
strengths, weaknesses, opportunities, threats. Bee World,
85:77–80.
Jordan, C. & Tomlinson, R.W. (2007) Soil carbon and peat
extraction in Northern Ireland. Inventory and projections of UK
emissions by sources and removals by sinks due to land use,
land use change and forestry (Eds: A.M. Thomson & M. van
Oijen). Annual Report, June 2007. Defra: Climate, Energy, Science
and Analysis Division.
Kaiser, M.J., Clarke, K.R., Hinz, H., Austen, M.C.V.,
Somerfield, P.J. & Karakassis, I. (2006) Global analysis and
prediction of the response of benthic biota and habitats to
fishing. Marine Ecology Progress Series, 311, 1–14.
Kay, D., Aitken, M. & Crowther, J. (2007) Reducing fluxes of
faecal indicator compliance parameters to bathing waters from
diffuse agricultural sources: The Brighouse Bay study, Scotland.
Environmental Pollution, 147, 138–149.
Knox, J.W., Kay, Rodriguez-Diaz, J.A., Weatherhead, E.K. &
Kay, M.G. (2010) Development of a water strategy for horticulture
in England and Wales. Journal of Horticultural Science and
Biotechnology, 85, 89–93.
Laplace, J.P. (2006) Farming and food. Crossed
perspectives. Cahiers Agricultures, 15, 375–378.
Laurec, A., & Armstrong, D. (1997) The European Common
Fisheries Policy and its evolution. Global trends: fisheries
management (Ed. Pikitch, E.K., Huppert, D.D., & Sissenwine,
M.P.). American Fisheries Society Symposium, 20. Bethesda,
Maryland. pp. 61–72.
Loreau, M., Naeem, S., Inchausti, P., Bengtsson, J., Grime,
J.P., Hector, A., Hooper, D.U., Huston, M.A., Raffaelli, D., Schmid,
B., Tilman, D. & Wardle, D.A. (2001) Ecology – Biodiversity
and ecosystem functioning: Current knowledge and future
challenges. Science, 294, 804–808.
Lorenzen, K., Steneck, R.S., Warner, R.R., Parma, A.M.,
Coleman, F.C. & Leber, K.M. (2008) The spatial dimensions of
fisheries: putting it all in place. Bulletin of Marine Science, 86,
169–177.
Marine Scotland (2009a) Scottish Fish Farms Annual
Production Survey 2008. Marine Scotland, Scottish
Government.
Marine Scotland (2009b) Scottish Shellfish Production
Survey 2008 Report. Marine Scotland, Scottish Government.
Marks, H.F. (1989) A hundred years of British Food and
Farming. A statistical Survey. Taylor & Francis, London, 275 pp.
Maxted, N., Scholten M, Codd R & Ford-Lloyd B (2007)
Creation and use of a national inventory of crop wild relatives.
Biological Conservation, 140, 142–159.
Mayor, D.J., Zuur, A.F., Solan, M., Paton, G.I. & Kilham, K.
(2010) Factors Affecting Benthic Impacts at Scottish Fish Farms.
Environmental Science & Technology, 44, 2079–2084.
Ecosystem Services | Chapter 15: Provisioning Services 629
Mead, S.J.H. (2003) An analysis of trends in the UK beef
industry and key dynamics of change for 2015. Journal of the
Royal Agricultural Society of England 164.
Millstone, E. (2009) Science, risk and governance: Radical
rhetorics and the realities of reform in food safety governance.
Research Policy, 38, 624–636.
MMO (Marine Management Organisation) (2010a) UK
Sea Fisheries Statistics 2009, Table 3.3 [online] Available at:
<http://www.marinemanagement.org.uk/fisheries/statistics/
annual2009.htm> [Accessed 28.01.11].
MMO (Marine Management Organisation) (2010b) UK
Sea Fisheries Statistics Archive [online] Available at: <http://
www.marinemanagement.org.uk/fisheries/statistics/annual_
archive.htm> [Accessed 28.01.11].
National Non-Food Crops Centre (2009) Area Statistics
for Non-food crops. [online] Available at: <http://www.nnfcc.
co.uk/metadot/index.pl?id=2179;isa=Category;op=show>
[Accessed 28.01.11].
Navarro, N., Leakey, R.J.G. & Black, K.D. (2008) Effect
of salmon cage aquaculture on the pelagic environment of
temperate coastal waters: seasonal changes in nutrients and
microbial community. Marine Ecology Progress Series, 361, 47–58.
Newton, I. (2004) The recent declines of farmland bird
populations in Britain: an appraisal of causal factors and
conservation actions. Ibis, 146, 579–600.
NFU (National Farmers Union) (2002) Growing Great
Britain: Horticulture Facts and Figures. NFU Public Affairs,
August 2002.
Nicholson, R.J., Webb, J. & Moore, A. (2002) A review of
the environmental effects of different livestock manure storage
systems, and a suggested procedure for assigning environmental
ratings. Biosystems Engineering, 81, 363–377.
Ojango, J.M.K. & Pollott, G.E. (2002) The relationship
between Holstein bull breeding values for milk yield derived in
both the UK and Kenya. Livestock Production Science, 74, 1–12.
Oom, S.P., Sibbald, A.M., Hester, A.J., Miller, D.R. & Legg,
C.J. (2008) Impacts of sheep grazing a complex vegetation
mosaic: Relating behaviour to vegetation change. Agriculture,
Ecosystems & Environment, 124, 219–228.
PACEC (Public and Corporate Economic Consultants)
(2006) The Economic and Environmental Impact of Sporting
Shooting in the UK. Public and Corporate Economic Consultants.
PACEC, London.
Parag, Y. & Roberts, J.T. (2009) A Battle Against the Bottles:
Building, Claiming, and Regaining Tap-Water Trustworthiness.
Society & Natural Resources, 22, 625–636.
Pauly, D., Christensen, V., Dalsgaard, J., Froese, R. & Torres,
F. (1998) Fishing down marine food webs. Science, 279, 860–863.
Peel, D. & Lloyd, M.G. (2008) Governance and planning
policy in the marine environment: regulating aquaculture in
Scotland. Geographical Journal, 174, 361–373.
Phillipson, J., Bennett, K., Lowe, P. & Raley, M. (2004)
Adaptive responses and asset strategies: the experience of
rural micro-firms and Foot and Mouth Disease. Journal of Rural
Studies, 20, 227–243.
Pimm, S.L., Russell, G.J., Gittleman, J.L. & Brooks, T.M.
(1995) The future of biodiversity. Science, 269, 347–350.
Plassmann, K. & Edwards-Jones, G. (2009) Where does
the carbon footprint fall? Developing a carbon map of food
production. IIED London, pp34.
Potts, G.R. (1986) The Partridge: Pesticides, Predation and
Conservation. Collins, London.
Potts, G.R., Ewald, J.A. & Aebischer, N.J. (2010a) Long-
term changes in the flora of the cereal ecosystem on the Sussex
Downs, England, focusing on the years 1968–2005. Journal of
Applied Ecology, 47, 215–226.
Potts, S.G., Roberts, S.P.M., Dean, R., Marris, G., Brown,
M.A., Jones, R., Neumann, P. & Settele, J. (2010b) Declines of
managed honey bees and beekeepers in Europe. Journal of
Apicultural Research, 49, 15–22.
RBST (Rare Breeds Survival Trust) (2010) Welcome to
the Rare Breeds Survival Trust. [online] Available at: <www.
rbst.co.uk> [Accessed 07.03.11].
Richardson, E.A., Possingham, H.P., Kaiser, M.J. &
Edwards-Jones, G. (2006) Sensitivity of marine reserve design
to the spatial resolution of socioeconomic data. Conservation
Biology, 20, 1191–1202.
Saher, M., Lindeman, M. & Hursti, U.K.K. (2006) Attitudes
towards genetically modified and organic foods. Appetite, 46,
324–331.
Sanchez-Martin, L., Arce, A., Benito, A., Garcia-Torres,
L. & Vallejo, A. (2008) Influence of drip and furrow irrigation
systems on nitrogen oxide emissions from a horticultural crop.
Soil Biology & Biochemistry, 40, 1698–1706.
Scottish Government (2009) Key Scottish Environment
Statistics. [online] Available at: <http://www.scotland.gov.uk/
Publications/2009/08/26112651/52> [Accessed 2.11.10].
Scottish Government (2010) Key Scottish Environment
Statistics. [online] Available at: <http://www.scotland.gov.uk/
Publications/2010/09/08094058/0> [Accessed 07.03.11].
Showler, K. (1996) The development of national beekeeping
associations in England. Study two: 1940–1990. Bee World, 77,
16–25.
Siry, J.P., Robison, D.J. & Cubbage, F.W. (2004) Economic
returns model for silvicultural investments in young hardwood
stands. Southern Journal of Applied Forestry, 28, 179–184.
Smith, B., Holland, J., Jones, N., Moreby, S., Morris, A.J. &
Southway, S. (2009) Enhancing invertebrate food resources for
skylarks in cereal ecosystems: how useful are in-crop agri-
environment scheme management options? Journal of Applied
Ecology, 46, 692–702.
Smith, P., Bhogal, A., Edgington, P., Black, H., Lilly, A.,
Barraclough, D., Worrall, F., Hillier, J. & Merrington, G. (2010)
Consequences of feasible future agricultural land-use change
on soil organic carbon stocks and greenhouse gas emissions in
Great Britain. Soil Use and Management, 26, 381–398.
Smith, R.L. (2006) The Australian grocery industry: a
competition perspective. Australian Journal of Agricultural and
Resource Economics, 50, 33–50.
Smith, R.S., Charman, D., Rushton, S.P., Sanderson,
R.A., Simkin, J.M. & Shiel, R.S. (2003) Vegetation change in an
ombrotrophic mire in northern England after excluding sheep.
Applied Vegetation Science, 6, 261–270.
Sotherton, N., Tapper, S. & Smith, A. (2009) Hen harriers
and red grouse: economic aspects of red grouse shooting and
the implications for moorland conservation. Journal of Applied
Ecology, 46, 955–960.
Spedding, A. (2010) Horticultural Production in England.
Briefing Note 1040. [online] Available at: <http://www.
nationalrural.org/upload/rusource/1040.pdf> [Accessed 07.03.11].
630 UK National Ecosystem Assessment: Technical Report
Sutton, J.D., Aston, K., Beever, D.E. & Dhanoa, M.S. (1996)
Milk production from grass silage diets: Effects of high-protein
concentrates for lactating heifers and cows on intake, milk
production and milk nitrogen fractions. Animal Science, 62,
207–215.
Swali, A. & Wathes, D.C. (2006) Influence of the dam and
sire on size at birth and subsequent growth, milk production and
fertility in dairy heifers. Theriogenology, 66, 1173–1184.
Tait, S., Tamis, J., Edgerton, B. & Batstone, D.J. (2009)
Anaerobic digestion of spent bedding from deep litter piggery
housing. Bioresource Technology, 100, 2210–2218.
Taylor, R.C., Jones, A.K. & Edwards-Jones, G. (2010)
Measuring holistic carbon footprints for lamb and beef farms
in the Cambrian Mountains Initiative. Report for Countryside
Council of Wales. 57 pp.
Thirgood, S.J., Redpath, S.M., Haydon, D.T., Rothery,
P., Newton, I. & Hudson, P.J. (2000) Habitat loss and raptor
predation: disentangling long- and short-term causes of red
grouse declines. Proceedings of the Royal Society B, 267, 651–656.
Thurkettle, V. (1997) The marketing of British hardwoods.
Forestry, 70, 319–325.
Tijink, F.G.J. & van der Linden, J.P. (2000) Engineering
approaches to prevent subsoil compaction in cropping
systems with sugar beet (Eds. Horn, R., VandenAkker, J.J.H &
Arvidsson, J.). Subsoil Compaction: Distribution, processes and
consequences, 32442–452 International Workshop on Subsoil
Compaction, March 1999, Kiel, Germany.
Tomkins, J. (1990) Recreation and the Forestry Commission
– the case for multiple use resource-management within public
forestry in the UK. Journal of Environmental Management, 30,
79–88.
Tranter, R.B., Holt, G.C. & Grey, P.T. (2007) Budgetary
implications of, and motives for, converting to organic farming:
Case study farm business evidence from Great Britain. Biological
Agriculture & Horticulture, 25, 133–151.
Verbruggen, A. & Al Marchohi, M. (2010) Views on peak
oil and its relation to climate change policy. Energy Policy, 38,
5572–5581.
Vickery, J.A., Tallowin, J.R., Feber, R.E., Asteraki, E.J.,
Atkinson, P.W., Fuller, R.J. & Brown, V.K. (2001) The management
of lowland neutral grasslands in Britain: effects of agricultural
practices on birds and their food resources. Journal of Applied
Ecology, 38, 647–664.
Walker, K.J., Critchley, C.N.R., Sherwood, A.J., Large,
R., Nuttall, P., Hulmes, S., Rose, R. & Mountford, J.O. (2007)
The conservation of arable plants on cereal field margins:
An assessment of new agri-environment scheme options in
England, UK. Biological Conservation 136, 260–270.
Ward, N. (1999) Foxing the nation: the economic (in)
significance of hunting with hounds in Britain. Journal of Rural
Studies, 15, 389–403.
Weatherhead, E.K. & Knox, J.W. (2000) Predicting and
mapping the future demand for irrigation water in England and
Wales. Agricultural Water Management, 43, 203–218.
Welch, D. & Scott, D. (1995) Studies in the grazing of
heather moorland in northeast Scotland. 6. 20-year trends in
botanical composition. Journal of Applied Ecology, 32, 596–611.
White, P.F. (2000) The effect of covering compost with paper
on yield of the cultivated mushroom Agaricus bisporus (Lange)
Imbach. Journal of Horticultural Science & Biotechnology, 75,
667–671.
Woods, A. (2004) A Manufactured Plague: The History of
Foot-and-mouth Disease in Britain. Earthscan.
Worthington, T.R. & Danks, P.W. (1992) Nitrate Leaching
and intensive outdoor pig production. Soil Use and Management,
8, 56–60.
Yates, T. (2006) The use of non-food crops in the UK
construction industry. Journal of the Science of Food and
Agriculture, 86, 1790–1796.
Zenith International (2009) Water’s vital statistics: industry
data. [online] Available at: <http://www.britishbottledwater.org/
vitalstats2.html> [Accessed: 16.10.10].
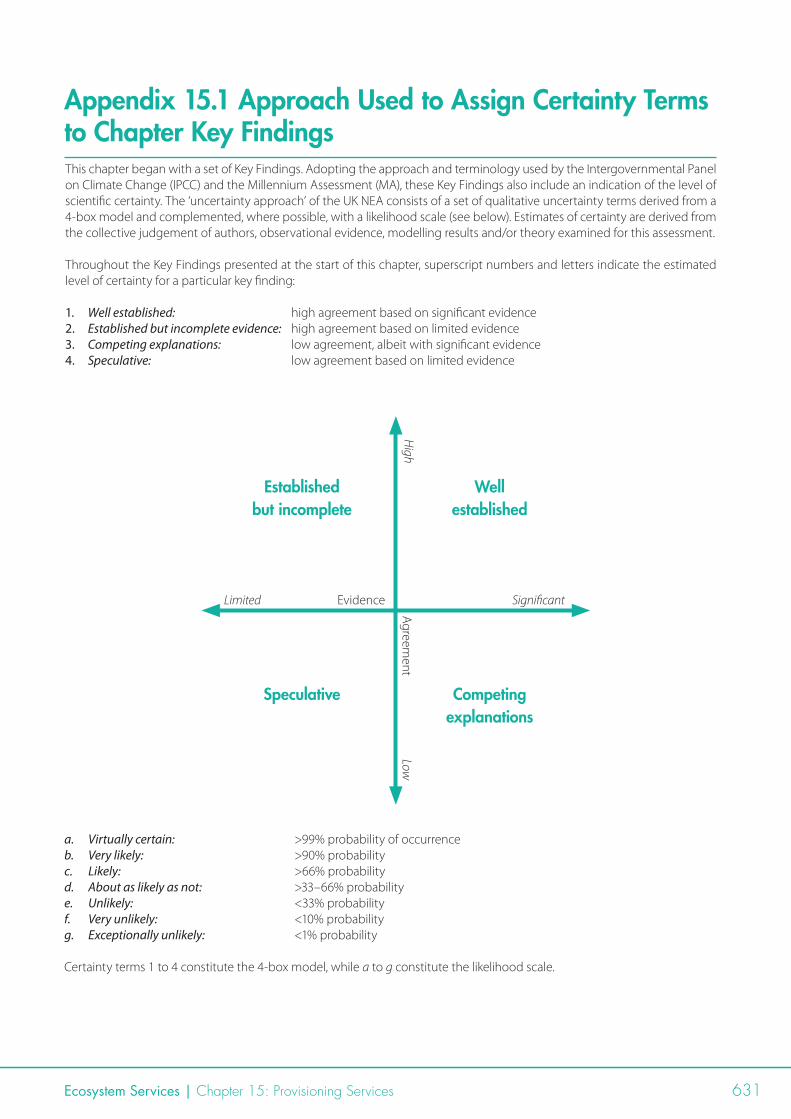
Ecosystem Services | Chapter 15: Provisioning Services 631
This chapter began with a set of Key Findings. Adopting the approach and terminology used by the Intergovernmental Panel on Climate Change (IPCC) and the Millennium Assessment (MA), these Key Findings also include an indication of the level of scientific certainty. The ‘uncertainty approach’ of the UK NEA consists of a set of qualitative uncertainty terms derived from a 4-box model and complemented, where possible, with a likelihood scale (see below). Estimates of certainty are derived from the collective judgement of authors, observational evidence, modelling results and/or theory examined for this assessment.
Throughout the Key Findings presented at the start of this chapter, superscript numbers and letters indicate the estimated level of certainty for a particular key finding:
1. Well established: high agreement based on significant evidence2. Established but incomplete evidence: high agreement based on limited evidence3. Competing explanations: low agreement, albeit with significant evidence4. Speculative: low agreement based on limited evidence
Well established
Competing explanations
Established but incomplete
Speculative
Evidence
Agreem
ent
SignificantLimited
High
Low
a. Virtually certain: >99% probability of occurrenceb. Very likely: >90% probabilityc. Likely: >66% probabilityd. About as likely as not: >33–66% probabilitye. Unlikely: <33% probabilityf. Very unlikely: <10% probabilityg. Exceptionally unlikely: <1% probability
Certainty terms 1 to 4 constitute the 4-box model, while a to g constitute the likelihood scale.
Appendix 15.1 Approach Used to Assign Certainty Terms to Chapter Key Findings

632 UK National Ecosystem Assessment: Technical Report