Embed Size (px)
Citation preview
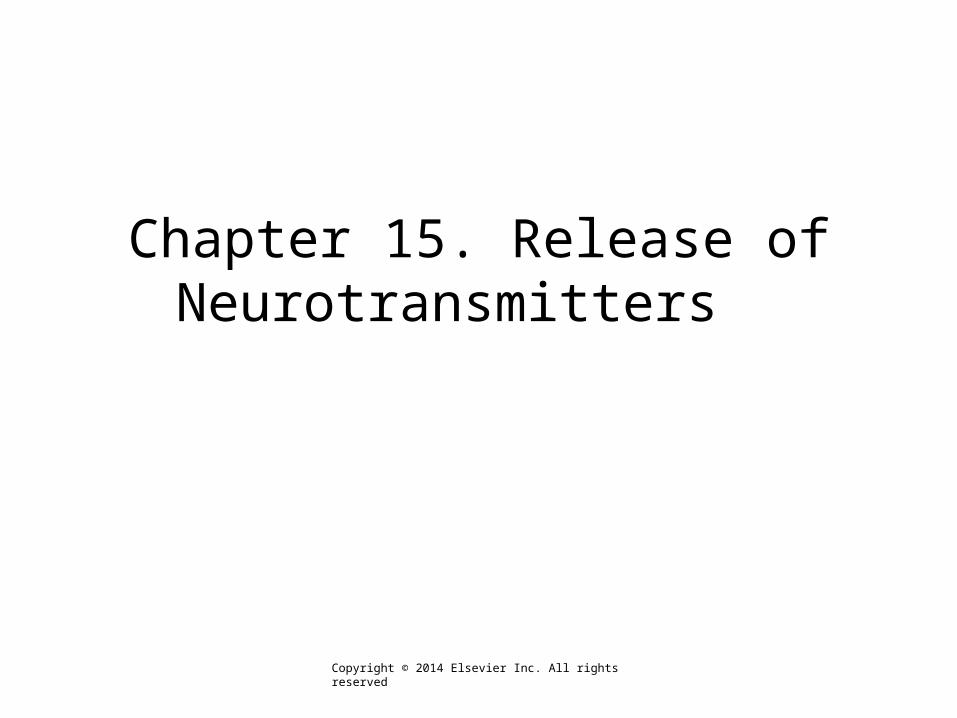
Chapter 15. Release of Neurotransmitters
Copyright © 2014 Elsevier Inc. All rights reserved
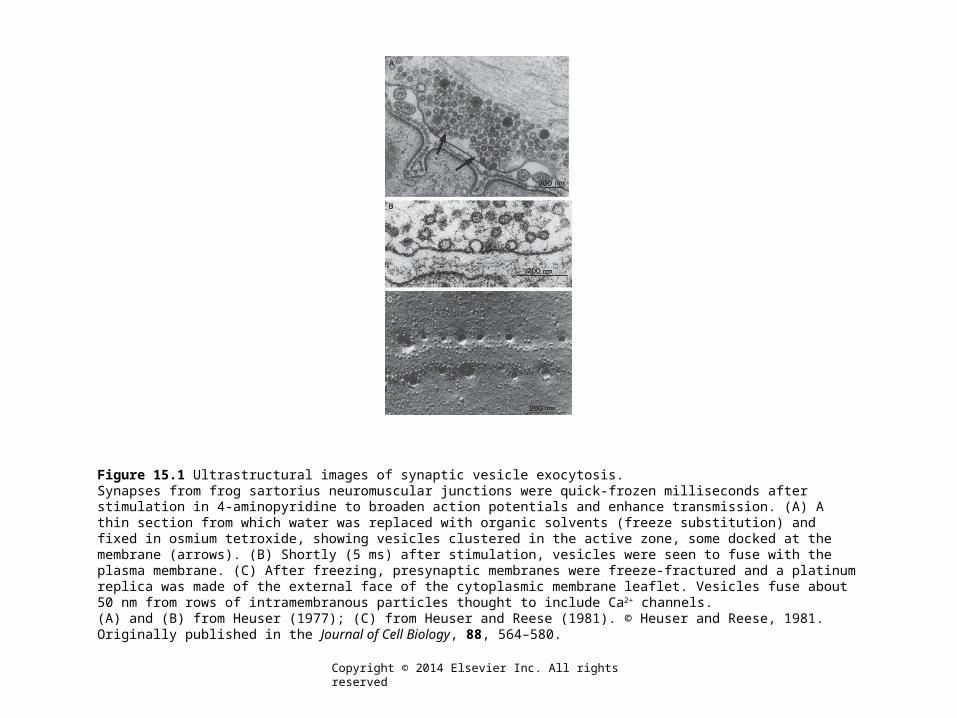
Figure 15.1 Ultrastructural images of synaptic vesicle exocytosis.Synapses from frog sartorius neuromuscular junctions were quick-frozen milliseconds after stimulation in 4-aminopyridine to broaden action potentials and enhance transmission. (A) A thin section from which water was replaced with organic solvents (freeze substitution) and fixed in osmium tetroxide, showing vesicles clustered in the active zone, some docked at the membrane (arrows). (B) Shortly (5 ms) after stimulation, vesicles were seen to fuse with the plasma membrane. (C) After freezing, presynaptic membranes were freeze-fractured and a platinum replica was made of the external face of the cytoplasmic membrane leaflet. Vesicles fuse about 50 nm from rows of intramembranous particles thought to include Ca2+ channels.(A) and (B) from Heuser (1977); (C) from Heuser and Reese (1981). © Heuser and Reese, 1981. Originally published in the Journal of Cell Biology, 88, 564–580.
Copyright © 2014 Elsevier Inc. All rights reserved
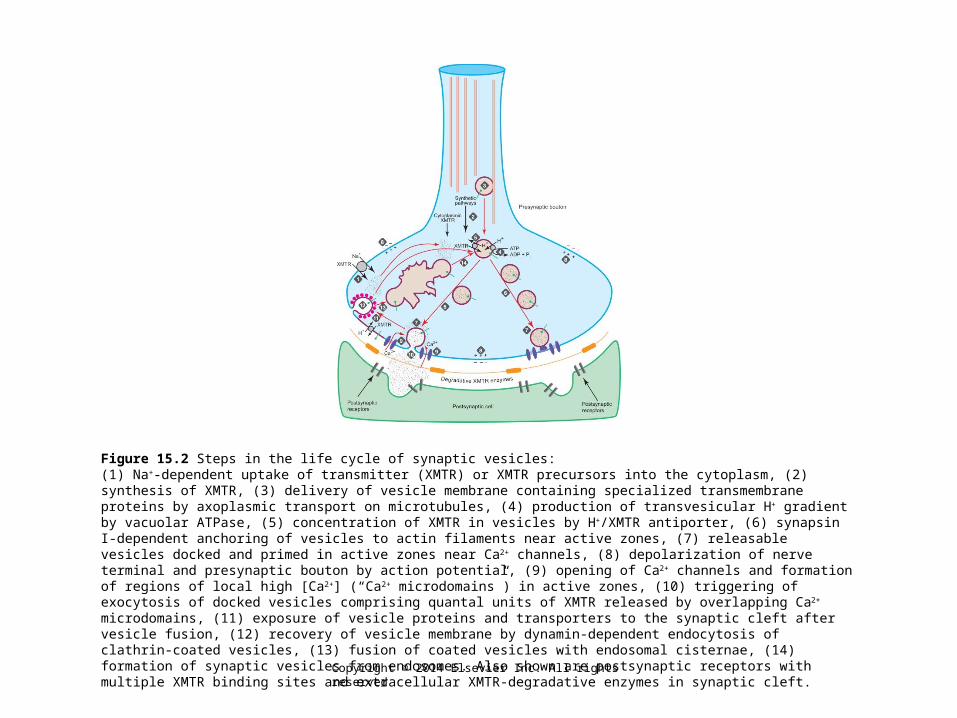
Figure 15.2 Steps in the life cycle of synaptic vesicles:(1) Na+-dependent uptake of transmitter (XMTR) or XMTR precursors into the cytoplasm, (2) synthesis of XMTR, (3) delivery of vesicle membrane containing specialized transmembrane proteins by axoplasmic transport on microtubules, (4) production of transvesicular H+ gradient by vacuolar ATPase, (5) concentration of XMTR in vesicles by H+/XMTR antiporter, (6) synapsin I-dependent anchoring of vesicles to actin filaments near active zones, (7) releasable vesicles docked and primed in active zones near Ca2+ channels, (8) depolarization of nerve terminal and presynaptic bouton by action potential, (9) opening of Ca2+ channels and formation of regions of local high [Ca2+] (“Ca2+ microdomains”) in active zones, (10) triggering of exocytosis of docked vesicles comprising quantal units of XMTR released by overlapping Ca2+ microdomains, (11) exposure of vesicle proteins and transporters to the synaptic cleft after vesicle fusion, (12) recovery of vesicle membrane by dynamin-dependent endocytosis of clathrin-coated vesicles, (13) fusion of coated vesicles with endosomal cisternae, (14) formation of synaptic vesicles from endosomes. Also shown are postsynaptic receptors with multiple XMTR binding sites and extracellular XMTR-degradative enzymes in synaptic cleft.
Copyright © 2014 Elsevier Inc. All rights reserved

Figure 15.3 Microdomains with high Ca2+ concentrations form in the cytosol near open Ca2+ channels and trigger the exocytosis of synaptic vesicles.(A) In this adaptation of a model of Ca2+ dynamics in the terminal, a set of Ca2+ channels is spaced along the x axis, as if in a cross section of a terminal. The channels have opened and, while they are open, the cytosolic Ca2+ concentration (y axis) is spatially inhomogeneous. Near the mouth of the channel, the influx of Ca2+ drives the local concentration to as high as 800 μM, but within just 50 nm of the channel the concentration drops off to about 25 μM. The channels are irregularly spaced but are often sufficiently close to one another that their clouds of Ca2+ can overlap and sum. (B). In the active zone (gray), an action potential has opened a fraction of the Ca2+ channels and microdomains of high cytosolic Ca2+ (pink) arise around these open channels as Ca2+ flows into the cell. In the rest of the cytoplasm, the Ca2+ concentration is at resting levels (0.10 μM), but within these microdomains, and particularly near the channel mouth, Ca2+ concentrations are much higher, as in (A). Synaptic vesicles docked and primed at the active zone may come under the influence of one or more of these microdomains and thereby be triggered to fuse with the membrane. (C) A few milliseconds after the action potential, the channels have closed and the microdomains have dispersed. The overall Ca2+ concentration in the terminal is now slightly higher (0.11 μM) than before the action potential. If no other action potentials occur, the cell will pump the extra Ca2+ out across the plasma membrane and restore the initial condition after several hundred milliseconds.(A) Adapted from Roberts, W.M. (1994). The numerical details are for hair cell synapses only.
Copyright © 2014 Elsevier Inc. All rights reserved
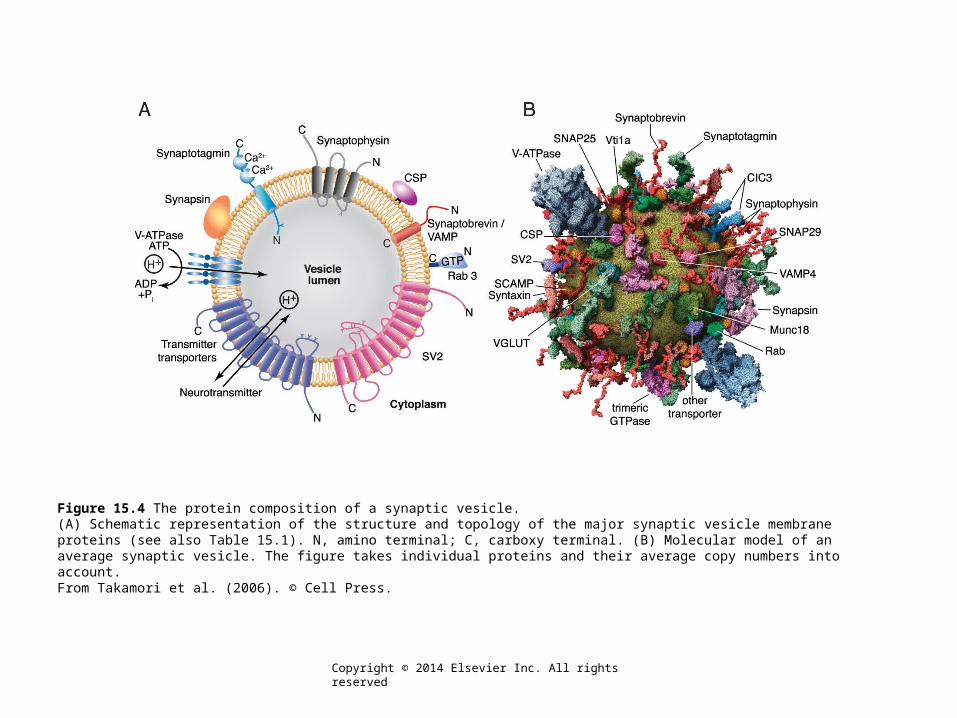
Figure 15.4 The protein composition of a synaptic vesicle.(A) Schematic representation of the structure and topology of the major synaptic vesicle membrane proteins (see also Table 15.1). N, amino terminal; C, carboxy terminal. (B) Molecular model of an average synaptic vesicle. The figure takes individual proteins and their average copy numbers into account.From Takamori et al. (2006). © Cell Press.
Copyright © 2014 Elsevier Inc. All rights reserved
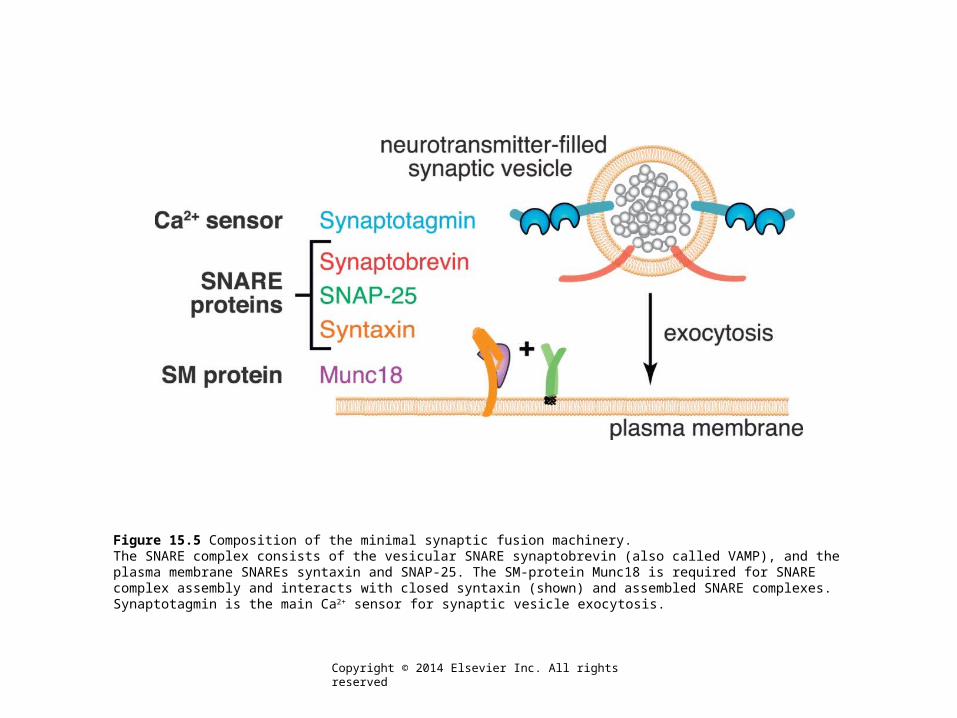
Figure 15.5 Composition of the minimal synaptic fusion machinery.The SNARE complex consists of the vesicular SNARE synaptobrevin (also called VAMP), and the plasma membrane SNAREs syntaxin and SNAP-25. The SM-protein Munc18 is required for SNARE complex assembly and interacts with closed syntaxin (shown) and assembled SNARE complexes. Synaptotagmin is the main Ca2+ sensor for synaptic vesicle exocytosis.
Copyright © 2014 Elsevier Inc. All rights reserved
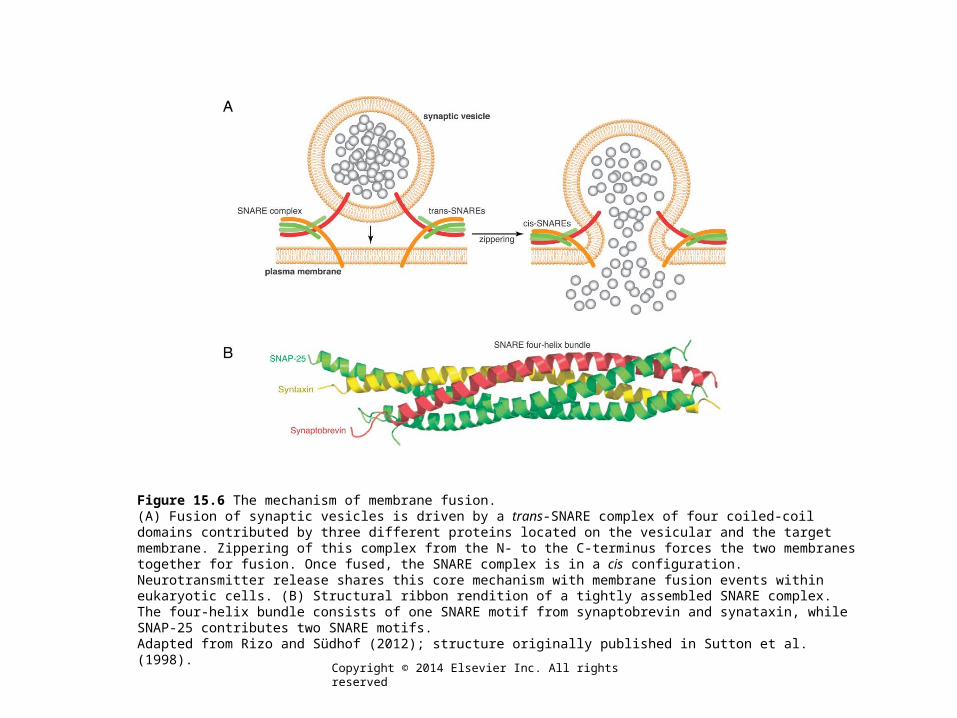
Figure 15.6 The mechanism of membrane fusion.(A) Fusion of synaptic vesicles is driven by a trans-SNARE complex of four coiled-coil domains contributed by three different proteins located on the vesicular and the target membrane. Zippering of this complex from the N- to the C-terminus forces the two membranes together for fusion. Once fused, the SNARE complex is in a cis configuration. Neurotransmitter release shares this core mechanism with membrane fusion events within eukaryotic cells. (B) Structural ribbon rendition of a tightly assembled SNARE complex. The four-helix bundle consists of one SNARE motif from synaptobrevin and synataxin, while SNAP-25 contributes two SNARE motifs.Adapted from Rizo and Südhof (2012); structure originally published in Sutton et al. (1998).
Copyright © 2014 Elsevier Inc. All rights reserved
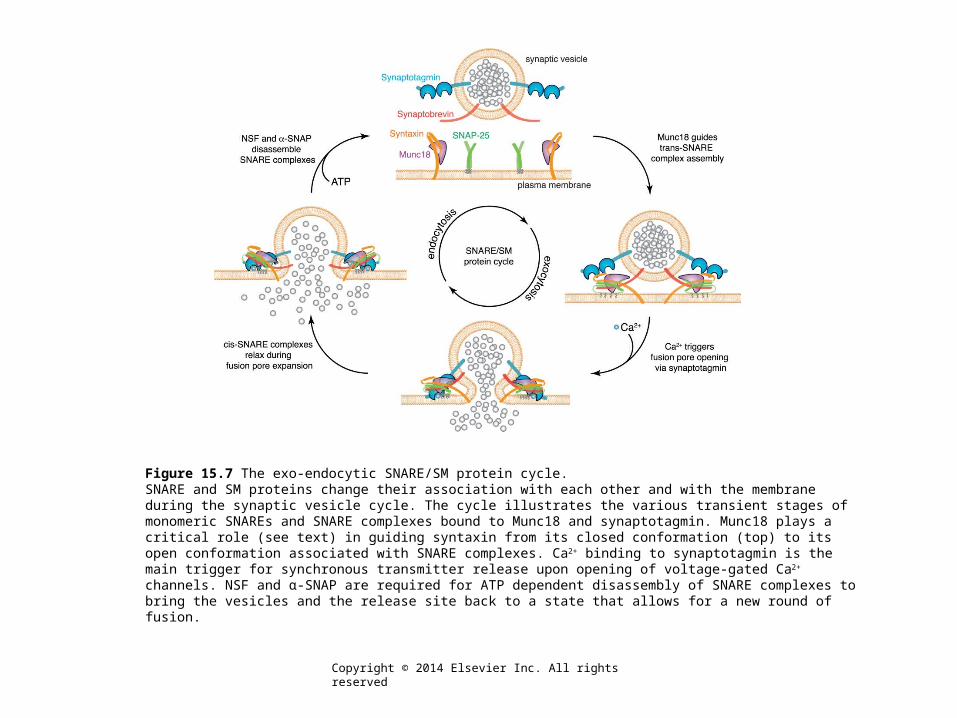
Figure 15.7 The exo-endocytic SNARE/SM protein cycle.SNARE and SM proteins change their association with each other and with the membrane during the synaptic vesicle cycle. The cycle illustrates the various transient stages of monomeric SNAREs and SNARE complexes bound to Munc18 and synaptotagmin. Munc18 plays a critical role (see text) in guiding syntaxin from its closed conformation (top) to its open conformation associated with SNARE complexes. Ca2+ binding to synaptotagmin is the main trigger for synchronous transmitter release upon opening of voltage-gated Ca2+ channels. NSF and α-SNAP are required for ATP dependent disassembly of SNARE complexes to bring the vesicles and the release site back to a state that allows for a new round of fusion.
Copyright © 2014 Elsevier Inc. All rights reserved

Figure 15.8 Models of the presynaptic active zone.(A–C) Fine structure of the active zone at a neuromuscular junction. (A) Active zone (yellow) as revealed by electron tomography, viewed from the side of the plasma membrane with adjacent synaptic vesicles (blue). Active zone protein material extends from the vesicles and connects to a central beam in an organized fashion. (B) Transverse view of active zone material and docked synaptic vesicles adjacent to the plasma membrane (orange). (C) Schematic rendering of an active zone based on the tomographic analysis. An ordered structure aligns the vesicles and connects them to the plasma membrane and to one another. (D) Protein interactions in the active zone of a central nervous synapse. Several families of large multidomain proteins form a dense network that connects to synaptic vesicles and tethers Ca2+ channels close by.(A–C) Adapted with permission from Macmillan Publishers Ltd. (Harlow et al., 2001). (D) Adapted from Kaeser et al. (2011).
Copyright © 2014 Elsevier Inc. All rights reserved

Copyright © 2014 Elsevier Inc. All rights reserved
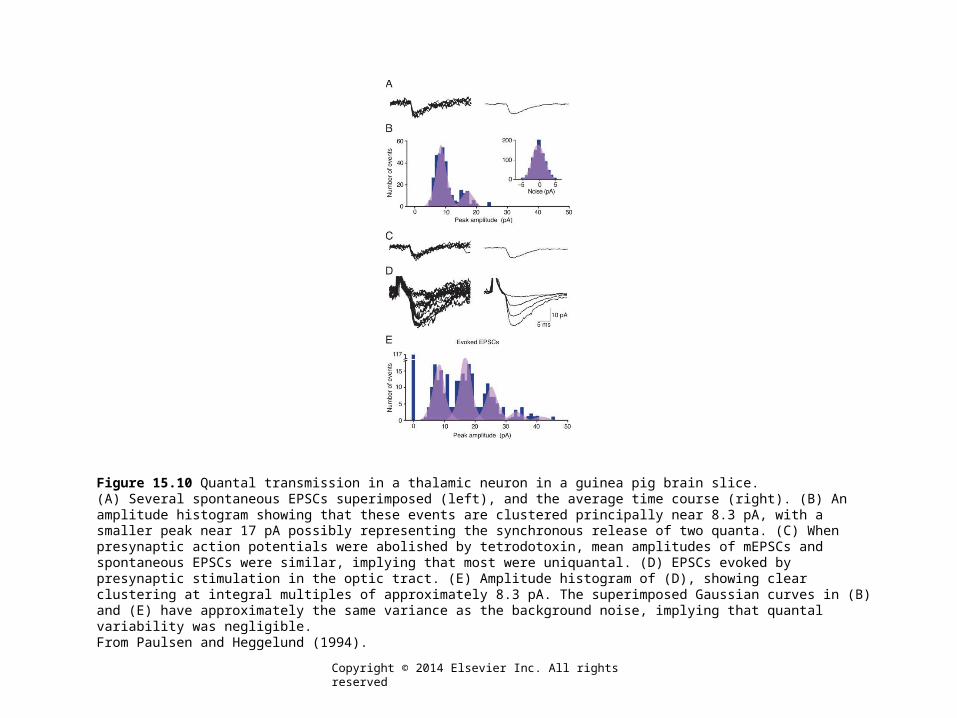
Figure 15.10 Quantal transmission in a thalamic neuron in a guinea pig brain slice.(A) Several spontaneous EPSCs superimposed (left), and the average time course (right). (B) An amplitude histogram showing that these events are clustered principally near 8.3 pA, with a smaller peak near 17 pA possibly representing the synchronous release of two quanta. (C) When presynaptic action potentials were abolished by tetrodotoxin, mean amplitudes of mEPSCs and spontaneous EPSCs were similar, implying that most were uniquantal. (D) EPSCs evoked by presynaptic stimulation in the optic tract. (E) Amplitude histogram of (D), showing clear clustering at integral multiples of approximately 8.3 pA. The superimposed Gaussian curves in (B) and (E) have approximately the same variance as the background noise, implying that quantal variability was negligible.From Paulsen and Heggelund (1994).
Copyright © 2014 Elsevier Inc. All rights reserved
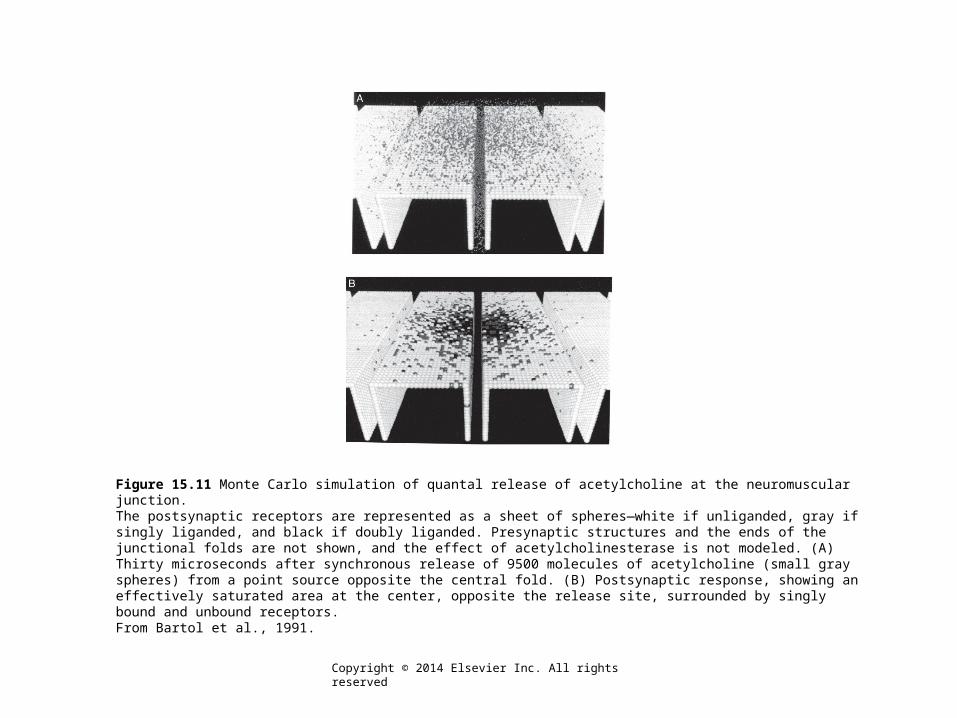
Figure 15.11 Monte Carlo simulation of quantal release of acetylcholine at the neuromuscular junction.The postsynaptic receptors are represented as a sheet of spheres—white if unliganded, gray if singly liganded, and black if doubly liganded. Presynaptic structures and the ends of the junctional folds are not shown, and the effect of acetylcholinesterase is not modeled. (A) Thirty microseconds after synchronous release of 9500 molecules of acetylcholine (small gray spheres) from a point source opposite the central fold. (B) Postsynaptic response, showing an effectively saturated area at the center, opposite the release site, surrounded by singly bound and unbound receptors.From Bartol et al., 1991.
Copyright © 2014 Elsevier Inc. All rights reserved

Figure 15.12 Cumulative distribution of mEPPs.(A) One thousand consecutive mEPPs recorded at the frog neuromuscular junction are plotted cumulatively. The dashed lines are the 95% confidence limits, calculated by applying Kolmogorov–Smirnov statistics. (B) The first 100 mEPPs are plotted in the same way, showing that as the sample size is reduced, the confidence limits broaden. (C) Effect of insulin on the cumulative distribution. The curve is shifted to the right, indicating an increase in quantal amplitude.From Van der Kloot (1991).
Copyright © 2014 Elsevier Inc. All rights reserved

Copyright © 2014 Elsevier Inc. All rights reserved

Copyright © 2014 Elsevier Inc. All rights reserved

Copyright © 2014 Elsevier Inc. All rights reserved