Embed Size (px)
Citation preview

Chapter 15
Section 1
How Populations Grow

Objectives
Distinguish among the 3 patterns of dispersion in a population
Contrast exponential growth and logistic growth
Differentiate R-strategists from K-strategists

Population
Consists of all the individuals of a species that live together in one place at one time – Populations tend to grow: multiple offspring– Limits resources limit population
Ex. Population of walleye in Maple Lake

Population

Demography
Statistical study of all populations
Study the composition of a population and try to predict how the size will change
Ex. Growth of the population of Canada in the next 10 years


Population Size
Number of individuals in a population
Can affect the populations ability to survive
Ex. 40 moose in Glacier National Park

Population Density
Number of individuals that live in a given area If individuals of a population are few and spaced widely apart, they may seldom encounter one another, making reproduction rareEx. If 20 walleye live by the dock of my cottage

Population Density

Dispersion
The way the individuals of the population are arranged in space
3 patterns:– Random Distribution: location of each individual is
self determined or determined by chance– Even Distribution: located at regular intervals– Clumped Distribution: individuals are bunched
together in clusters

Dispersion

Population Model
Hypothetical population that attempts to exhibit the key characteristics of a real population
By making a change and observing the outcomes, demographers can predict what might occur in a real population

Growth Rate
Population grows when more individuals are born than die
A simple population model describes the rate of population growth as the difference between the birth and death rates
Ex. Find the rate of population growth where there are 360 births and 250 deaths in a year– 360 - 250 = 110 (population is increasing by 110
individuals/year)

Exponential Growth Curve
Curve in which the rate of population growth stays the same, as a result the population size increases steadily
Population size vs. time, J shaped

Exponential Growth Curve
N = size of the current population
r = rate of growth
K = carrying capacity, population size that an environment can sustain

Density Dependent Factors
Resources are density dependent factors
The rate at which they become depleted depends upon the population density of the population that uses them
Ex. Population of 200 seagulls on lake Erie vs. Population of 50 seagulls on lake Erie – Which will use up resources more quickly?

Logistic Model
Population model that takes into account the declining resources available to a population
Exponential growth is limited by a density dependent factor
Assumes birth and death rates vary

Logistic Model

Logistic Model
When population is below carrying capacity, growth rate is rapidAs population approaches carrying capacity death rates rise, birth rates slow– Result: rate of growth slows
Population stops growing when birth and death rates are equal If population exceeds carrying capacity, deaths will increase and outnumber births until population falls to carrying capacity


Population Growth Models
Simple model (part one): calculating the population growth rate – r (rate of growth) = birthrate - death rate
The rate of population growth equals the rate of births minus the rate of deaths

Population Growth Models
Simple model (part 2): exponential growth curve – Delta N (change in population) = rN
Once r has been determined for a population (part 1) the number of individuals that will be added to a population as it grows is equal to the rate of growth multiplied by the number of individuals in the current population (N)
Population Growth Models
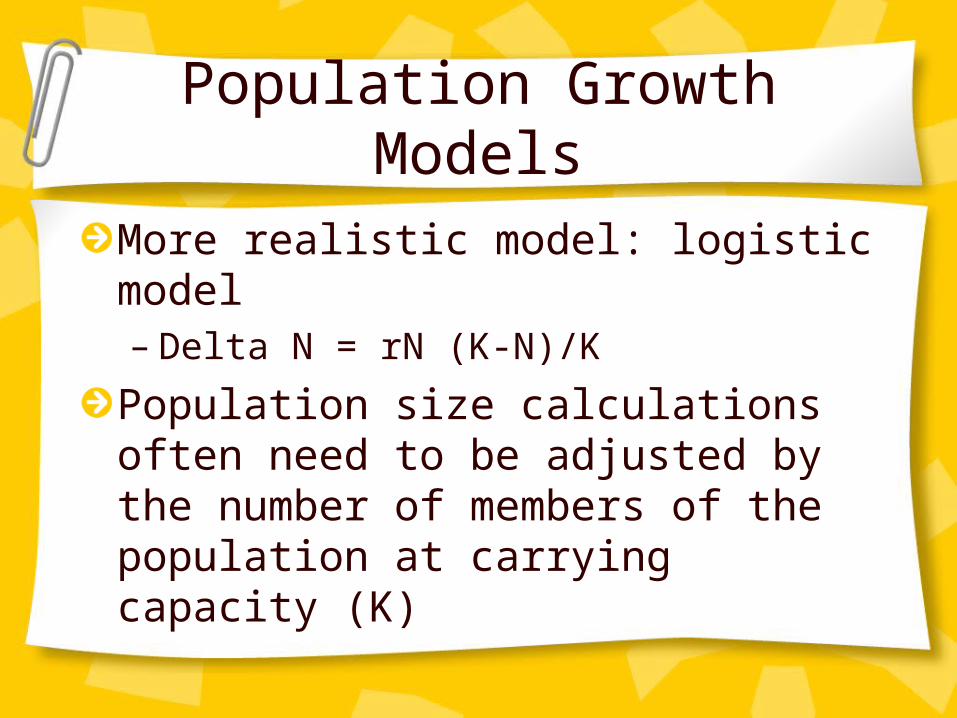
More realistic model: logistic model– Delta N = rN (K-N)/K
Population size calculations often need to be adjusted by the number of members of the population at carrying capacity (K)

Density Independent Factors
Environmental conditions
Weather and climate
Ex. Mosquito populations increase in the summer while the weather is warm, but decrease in the winter

R-strategist
Strategy means pattern of livingR-strategist: grow exponentially when environmental conditions allow them to reproduce Results in temporarily large populations When environmental conditions worsen population size drops quickly Usually have short life span, reproduce early, and have many offspring, offspring are small and mature rapidly on their own

R-strategist & K-strategist

K-Stategists
K-strategists: population density is usually near carrying capacity
Characterized by long life span, few young, slow maturing process, reproduction late in life, provide care of young, live in stable environments

R vs. K Strategist
Ex. R-strategist– Insects like mosquitoes
Ex. K-strategist– Whales, tigers
Review
1. Identify the pattern of dispersion of fans attending a basketball game as random, even, or clumped. Explain your answer.
2. Differentiate a logistic growth pattern from an exponential growth pattern.
3. Describe why an R-strategist might be better suited for an unpredictable environment than a K-strategist.

Answers
1. The pattern of dispersion of fans at a basketball game could be described as clumped. This could be because usually friends and family sit together, making a clumped pattern.
2. A logistic growth pattern is a population model that takes into account the declining resources available to a population. Whereas a exponential growth pattern is a curve in which the rate of population growth stays the same, as a result the population size increases steadily.

Answers
3. An R- strategist may be better suited for an unpredictable environment because they are able to reproduce exponentially when environmental conditions are favorable. They would be able to build up a large population and be able to handle an unpredictable environment when their population size would drop.