Embed Size (px)
Citation preview
Chapter 16
Scaling procedures and construct validation of context
questionnaire data
INTRODUCTION
The PISA 2018 Context Questionnaires are based on the questionnaire framework (OECD,
2017), described in chapter 3 of this report. Many questionnaire items were designed to be
combined in some way in order to measure latent constructs that cannot be observed directly
(e.g. a student’s achievement motivation or economic, social and cultural background). To
these items, transformations or scaling procedures were applied to construct meaningful
indices.
In the following, these indices are referred to as “derived variables”. This chapter describes
derived variables based on one or more items that were constructed and validated for all
questionnaires administered in PISA 2018.
In analogy to previous PISA surveys, three different kinds of derived variables can be
distinguished:
simple questionnaire indices constructed through the arithmetical transformation or
recoding of one or more items
derived variables based on IRT scaling (see section “Scaling procedures” in this chapter)
ESCS composite scores (see section “The PISA index of economic, social and cultural
status (ESCS)” in this chapter).
As described in chapter 3, the PISA 2018 Context Questionnaires included a broad scope of
context factors assessed with different questionnaire instruments. While student and school
context questionnaires were mandatory in all countries, many countries also administered the
optional questionnaire to parents of the tested students. In addition, countries could choose to
administer the international options Information and Communication Technology (ICT)
Familiarity Questionnaire, Well-Being Questionnaire, Financial Literacy Questionnaire and
the Educational Career Questionnaire to students. Moreover, several countries chose to
participate in the Teacher Questionnaire option including questionnaires for test language and
general teachers.
In the following, this chapter (i) describes the methodology used for scaling and construct
validation including trend scales, (ii) presents an overview of all derived variables (simple
indices, IRT-based scales) per questionnaire, and (iii) illustrates the computation of the PISA
index of economic, social and cultural status (ESCS).
SCALING METHODOLOGY AND CONSTRUCT VALIDATION
Scaling procedures
As in previous cycles of PISA, one subset of the derived variables was constructed using IRT
(item response theory) scaling methodology. In the IRT framework, several different models
can be distinguished with the generalised partial credit model (see below) being the one used
for constructing derived variables in the PISA 2018 Context Questionnaires.
For each item, responses of person j on item i are modelled as a function of the latent construct,
j. With the one-parameter model (Rasch model; Rasch, 1960) for dichotomous items, the
probability of person j selecting category 1 instead of 0 is modelled as:
Formula 16.1
𝑃(𝑋𝑗𝑖 = 1|𝜃𝑗, 𝛽𝑖) =exp(𝜃𝑗 − 𝛽𝑖)
1 + 𝑒𝑥𝑝(𝜃𝑗 − 𝛽𝑖)
where P(Xji = 1) is the probability of person j to score 1 on item i, j is the estimated latent trait
of person j and i the estimated location or difficulty of item i on this dimension. In the case of
items with more than two categories m (e.g. Likert-type items), this model can be generalised
to the Partial Credit Model (Masters and Wright, 1997), which takes the form of:
Formula 16.2
𝑃(𝑋𝑗𝑖 = 𝑘|𝜃𝑗 , 𝛽𝑖 , 𝑑𝑖) =𝑒𝑥𝑝(∑ 𝜃𝑗 − (𝛽𝑖
𝑘𝑟=0 + 𝑑𝑖𝑟))
∑ 𝑒𝑥𝑝(∑ 𝜃𝑗 − (𝛽𝑖𝑢𝑟=0 + 𝑑𝑖𝑟))
𝑚𝑖𝑢=0
where P(Xji = k) denotes the probability of person j to score k on item i out of the mi possible
scores on the item. j denotes the person’s latent trait, the item parameter i gives the general
location or difficulty of the item on the latent continuum and dir denote additional step
parameters. This model has been used throughout previous cycles of PISA for scaling derived
variables in the context questionnaires. However, research literature (especially Glas and
Jehangir, 2014) suggests that a generalisation of this model, the generalised partial credit
model (GPCM) (Muraki, 1992), is more appropriate in the context of PISA since it allows for
the item discrimination to vary between items within any given scale. This model takes the
form of:
Formula 16.3
𝑃(𝑋𝑗𝑖 = 𝑘|𝜃𝑗 , 𝛽𝑖 , 𝛼𝑖 , 𝑑𝑖) =𝑒𝑥𝑝(∑ 𝐷𝛼𝑖(𝜃𝑗 − (𝛽𝑖 + 𝑑𝑖𝑟))
𝑘𝑟=0 )
∑ 𝑒𝑥𝑝(∑ 𝐷𝛼𝑖(𝜃𝑗 − (𝛽𝑖 + 𝑑𝑖𝑟))𝑢𝑟=0 )
𝑚𝑖𝑢=0
in which the additional discrimination parameter i allows for the items of a scale to contribute
with different weights to the measurement of the latent construct. D is a scaling factor equal to
1.7.
Most of the scales were analysed based on 2018 data only (see section “Regular scales”) while
three scales were analysed to allow for comparisons with the weighted likelihood estimates
(WLE; Warm, 1989) obtained in PISA 2009 (see section “Trend scales”).
Regular scales (PISA 2018)
For the regular scales, international item and person parameters were obtained from a GPCM
(see formula 16.3) in a single analysis based on data from all persons in all countries using the
mdltm software (version 1.965; von Davier, 2005; Khorramdel et al., 2019). For each scale,
only persons with a minimum number of three valid responses were included. Students were
weighted using the final student weight (W_FSTUWT), and all countries contributed equally
to the estimation. Additional analyses on the invariance of item parameters across countries
and languages were conducted and unique parameters were estimated if necessary (see section
“Cross-country comparability” in this chapter). Once this process was finished, weighted
likelihood estimates (WLE; Warm, 1989) were used as individual participant scores. These
scores were then transformed to have a mean of 0 and a standard deviation of 1 across senate
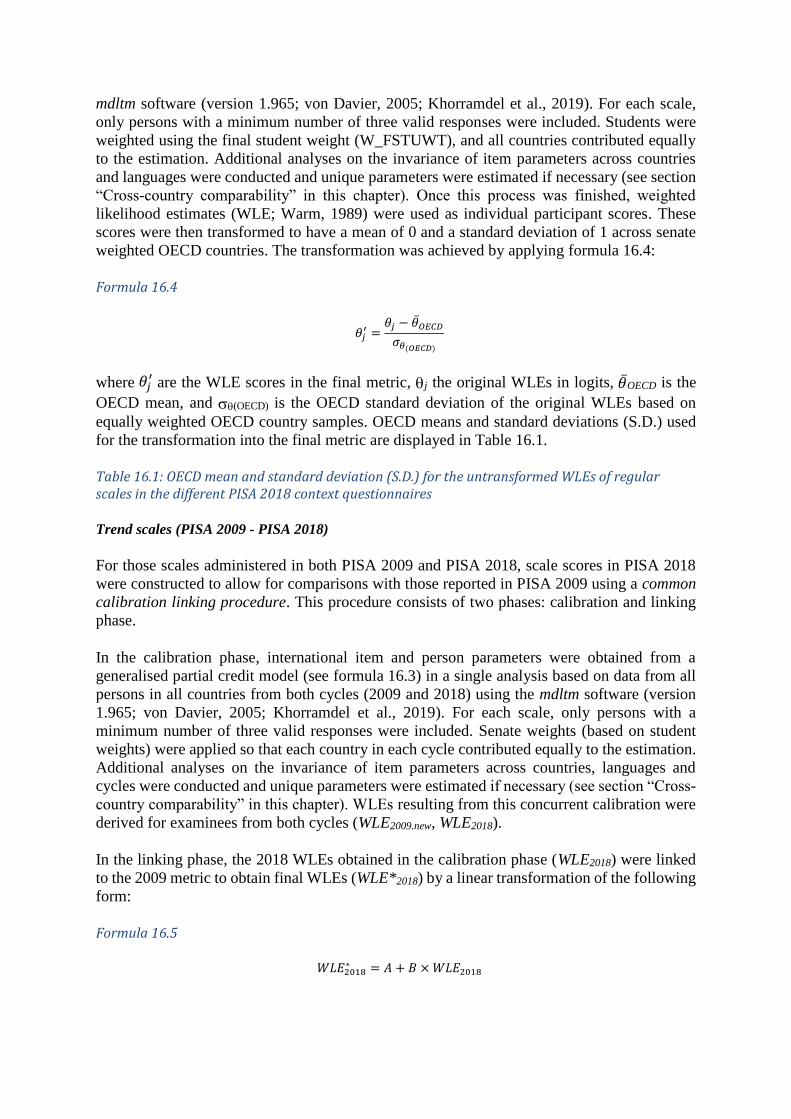
weighted OECD countries. The transformation was achieved by applying formula 16.4:
Formula 16.4
𝜃𝑗′ =
𝜃𝑗 − �̅�𝑂𝐸𝐶𝐷
𝜎𝜃(𝑂𝐸𝐶𝐷)
where 𝜃𝑗′ are the WLE scores in the final metric, j the original WLEs in logits, �̅�OECD is the
OECD mean, and (OECD) is the OECD standard deviation of the original WLEs based on
equally weighted OECD country samples. OECD means and standard deviations (S.D.) used
for the transformation into the final metric are displayed in Table 16.1.
Table 16.1: OECD mean and standard deviation (S.D.) for the untransformed WLEs of regular scales in the different PISA 2018 context questionnaires
Trend scales (PISA 2009 - PISA 2018)
For those scales administered in both PISA 2009 and PISA 2018, scale scores in PISA 2018
were constructed to allow for comparisons with those reported in PISA 2009 using a common
calibration linking procedure. This procedure consists of two phases: calibration and linking
phase.
In the calibration phase, international item and person parameters were obtained from a
generalised partial credit model (see formula 16.3) in a single analysis based on data from all
persons in all countries from both cycles (2009 and 2018) using the mdltm software (version
1.965; von Davier, 2005; Khorramdel et al., 2019). For each scale, only persons with a
minimum number of three valid responses were included. Senate weights (based on student
weights) were applied so that each country in each cycle contributed equally to the estimation.
Additional analyses on the invariance of item parameters across countries, languages and
cycles were conducted and unique parameters were estimated if necessary (see section “Cross-
country comparability” in this chapter). WLEs resulting from this concurrent calibration were
derived for examinees from both cycles (WLE2009.new, WLE2018).
In the linking phase, the 2018 WLEs obtained in the calibration phase (WLE2018) were linked
to the 2009 metric to obtain final WLEs (WLE*2018) by a linear transformation of the following
form:
Formula 16.5
𝑊𝐿𝐸2018∗ = 𝐴 + 𝐵 ×𝑊𝐿𝐸2018
The linking constants (A, B) were calculated based on the mean and standard deviation of the
newly derived and original WLEs of the 2009 data:
Formula 16.6
𝐵 =𝑆𝐷𝑊𝐿𝐸2009.𝑜𝑟𝑖𝑔𝑖𝑛𝑎𝑙
𝑆𝐷𝑊𝐿𝐸2009.𝑛𝑒𝑤
Formula 16.7
𝐴 = 𝑀𝑊𝐿𝐸2009.𝑜𝑟𝑖𝑔𝑖𝑛𝑎𝑙– 𝐵 ×𝑀𝑊𝐿𝐸2009.𝑛𝑒𝑤
Table 16.2 shows both the transformation constants (A, B) and the correlations between the
original and newly derived WLEs for PISA 2009, r(WLE2009.original, WLE2009.new). They indicate
that original and transformed scales are highly consistent both with respect to distributional
characteristics and rank order of individuals, indicating that all scales could be recovered well.
This is particularly noteworthy as the scaling model changed from the partial credit model in
PISA 2009 to the generalised partial credit model in 2018.
Table 16.2: Scaling constants (A, B) and correlations between original and newly derived 2009 WLEs for trend scales in 2018
Criteria for omitting responses from IRT scaling
Person scores (WLEs) were reported whenever possible. However, responses of individual
persons or groups of persons have been omitted from the IRT scaling under the following
conditions:
Too few responses: Only persons with a minimum number of three valid responses on the
scale’s indicator items received a WLE. Cases with fewer than three valid responses
received score “99”, indicating a missing scale score due to insufficient responses.
Poor scale quality compared to other groups: Groups in which the internal consistency
(Cronbach’s Alpha) and the items’ correlations with the total score were far below those
observed in other groups have been removed from scaling. Cases in such groups received
score “98” indicating a missing scale score due to poor scale quality, and a footnote was
added to the tables in the remainder of this chapter to identify such instances.
Low comparability with other groups: Groups for which more than two local item
treatments were necessary for achieving acceptable item fit, thus threatening the scale’s
comparability across groups, have been removed from scaling (for more details see section
“Cross-country comparability” in this chapter). Cases in such groups received score “98”,
indicating low comparability with other groups, and a footnote was added to the tables in
the remainder of this chapter to identify such instances.
All cases in countries that did not administer the items used for scaling received score “97” on
the derived variable.
Interpreting results from IRT scaling
Interpreting person parameters
As in previous cycles of PISA, in PISA 2018 categorical items from the context questionnaires
were scaled using IRT modelling. WLEs for the latent dimensions were transformed to scales
with a mean of 0 and a standard deviation of 1 across OECD countries (with equally weighted
countries).
A score of 0 is expected for an average student in an OECD country. Negative values on the
index do not imply that students responded negatively to the underlying question. Rather,
students with negative scores are those who responded less positively than the average student
across OECD countries, but not necessarily negative with regards to the underlying question.
Likewise, students with positive scores are those who responded more positively than the
average student in OECD countries.
It is possible to interpret these scores by comparing individual scores or group mean scores to
the OECD mean, but the individual scores do not reveal anything about the actual item
responses and it is impossible to determine from scale score values to what extent respondents
endorsed the items used for the measurement of the latent construct.
Interpreting item parameters
The generalised partial credit model (see formula 16.3) contains three kinds of item parameters:
one relating to the general location or difficulty of the item (), one relating to the deviance of
each of the single response categories from this location parameter (d), and one relating to the
item’s discrimination or slope (a). Figure 16.1 displays the category characteristic curves of a
four-category item (e.g., a Likert-type item with response categories “Strongly disagree”,
“Disagree”, “Agree”, and “Strongly agree”). The three kinds of generalised partial credit model
item parameters were included in this representation, and each will be discussed in detail
below.
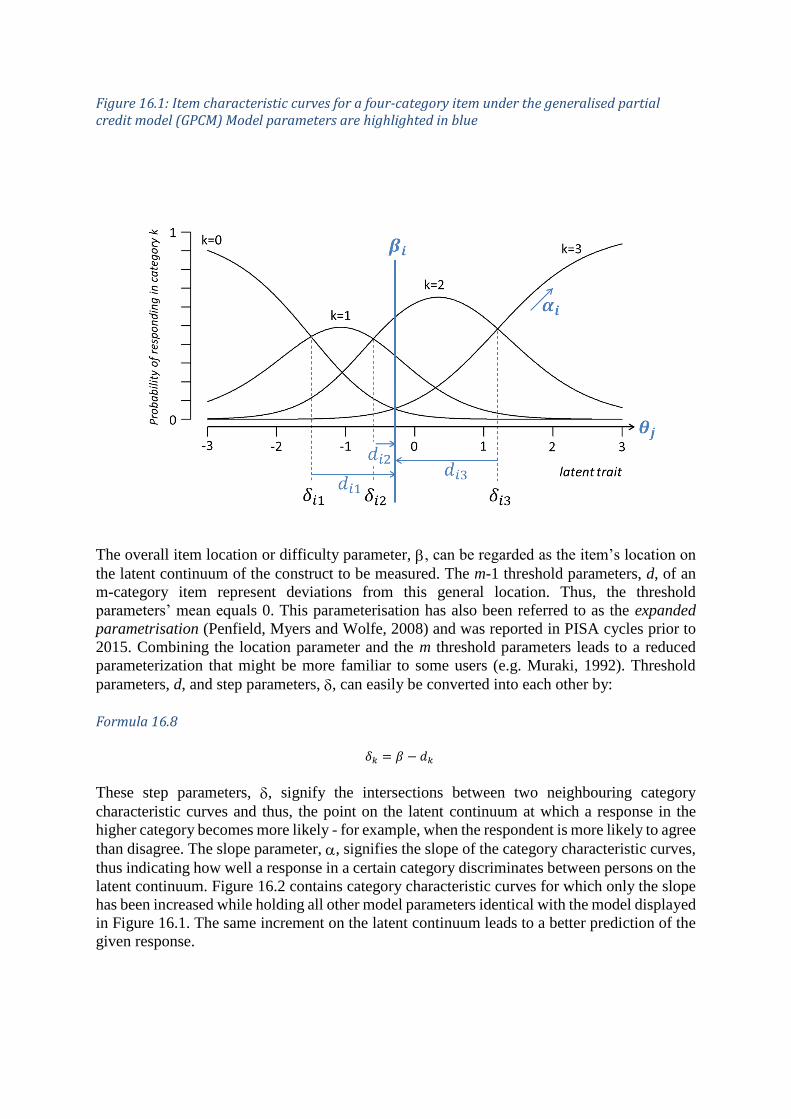
Figure 16.1: Item characteristic curves for a four-category item under the generalised partial credit model (GPCM) Model parameters are highlighted in blue
The overall item location or difficulty parameter, , can be regarded as the item’s location on
the latent continuum of the construct to be measured. The m-1 threshold parameters, d, of an
m-category item represent deviations from this general location. Thus, the threshold
parameters’ mean equals 0. This parameterisation has also been referred to as the expanded
parametrisation (Penfield, Myers and Wolfe, 2008) and was reported in PISA cycles prior to
2015. Combining the location parameter and the m threshold parameters leads to a reduced
parameterization that might be more familiar to some users (e.g. Muraki, 1992). Threshold
parameters, d, and step parameters, , can easily be converted into each other by:
Formula 16.8
𝛿𝑘 = 𝛽 − 𝑑𝑘
These step parameters, , signify the intersections between two neighbouring category
characteristic curves and thus, the point on the latent continuum at which a response in the
higher category becomes more likely - for example, when the respondent is more likely to agree
than disagree. The slope parameter, , signifies the slope of the category characteristic curves,
thus indicating how well a response in a certain category discriminates between persons on the
latent continuum. Figure 16.2 contains category characteristic curves for which only the slope
has been increased while holding all other model parameters identical with the model displayed
in Figure 16.1. The same increment on the latent continuum leads to a better prediction of the
given response.
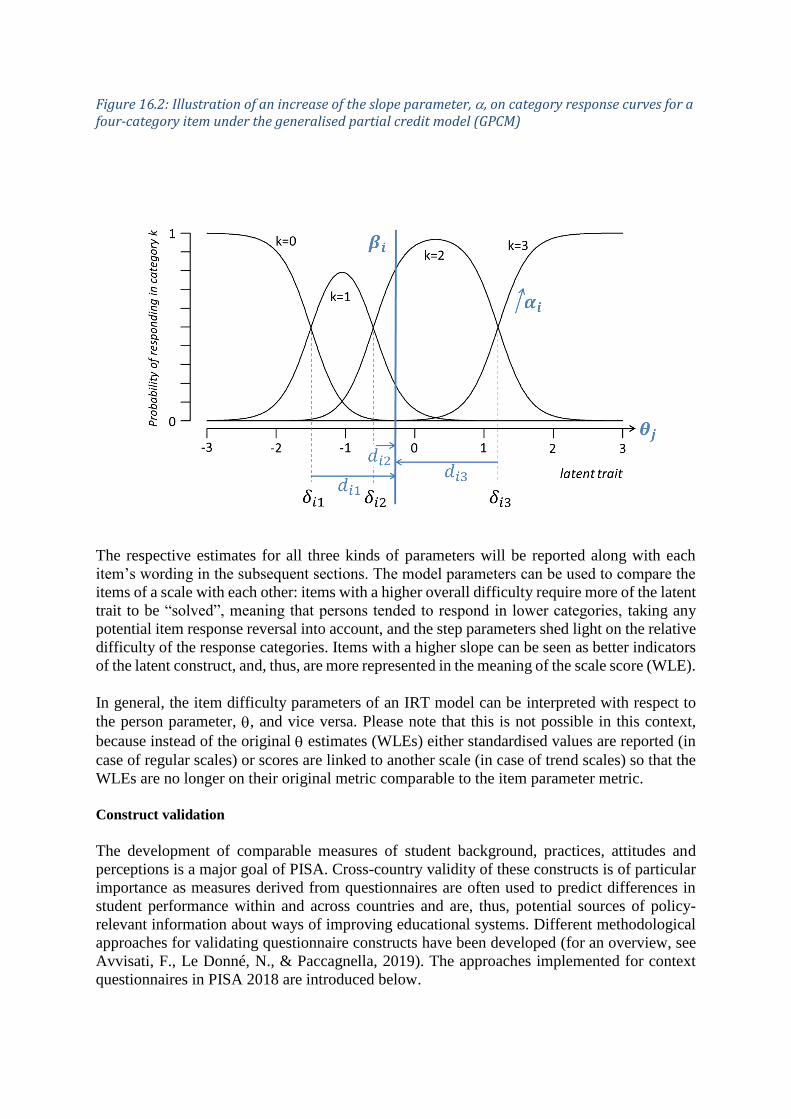
Figure 16.2: Illustration of an increase of the slope parameter, , on category response curves for a four-category item under the generalised partial credit model (GPCM)
The respective estimates for all three kinds of parameters will be reported along with each
item’s wording in the subsequent sections. The model parameters can be used to compare the
items of a scale with each other: items with a higher overall difficulty require more of the latent
trait to be “solved”, meaning that persons tended to respond in lower categories, taking any
potential item response reversal into account, and the step parameters shed light on the relative
difficulty of the response categories. Items with a higher slope can be seen as better indicators
of the latent construct, and, thus, are more represented in the meaning of the scale score (WLE).
In general, the item difficulty parameters of an IRT model can be interpreted with respect to
the person parameter, , and vice versa. Please note that this is not possible in this context,
because instead of the original estimates (WLEs) either standardised values are reported (in
case of regular scales) or scores are linked to another scale (in case of trend scales) so that the
WLEs are no longer on their original metric comparable to the item parameter metric.
Construct validation
The development of comparable measures of student background, practices, attitudes and
perceptions is a major goal of PISA. Cross-country validity of these constructs is of particular
importance as measures derived from questionnaires are often used to predict differences in
student performance within and across countries and are, thus, potential sources of policy-
relevant information about ways of improving educational systems. Different methodological
approaches for validating questionnaire constructs have been developed (for an overview, see
Avvisati, F., Le Donné, N., & Paccagnella, 2019). The approaches implemented for context
questionnaires in PISA 2018 are introduced below.
Internal consistency
Cronbach’s Alpha coefficient was used to check the internal consistency of each scale within
the countries and to compare it between the countries. The coefficient ranges between 0 and 1,
with higher values indicating higher internal consistency meaning the set of items closely
measures a common dimension. Commonly accepted cut-off values are 0.9 to signify excellent,
0.8 for good, and 0.7 for acceptable internal consistency. For some scales, some countries opted
to delete one or two items. Strictly speaking, this constituted a different scale and, therefore, a
footnote was added in the tables to note which item had been deleted.
Cross-country comparability
Cross-country comparability of the constructs requires a thorough and closely monitored
process of translation and standardised administration. It also makes assumptions about having
measured the same construct in different national and cultural contexts. All the indicators are
based on self-reports. Such measures can suffer from various measurement errors, for instance,
students are asked to report their behaviour retrospectively. Cultural differences in attitudes
towards self-enhancement can influence country-level results in examinees’ self-reported
beliefs, behaviours and attitudes (Bempechat, Jimenez and Boulay, 2002). The literature
consistently shows that response biases, such as social desirability, acquiescence and extreme
response choice, are more common in countries with lower socio-economic development,
compared with more affluent countries. Within countries, these response styles differ between
gender and across socio-economic status levels (Buckley, 2009).
Psychometric techniques can be used to analyse the extent to which the measurement of the
latent constructs is consistent across participating countries, thus indicating whether the
measured construct can be compared across countries. In PISA 2018, cross-country
comparability was investigated via two different approaches:
For each scale in each country, the internal consistency was calculated (see above).
For each item and scale, analyses on the invariance of item parameters across countries and
languages within a country were conducted.
Internal consistency. The Cronbach’s Alpha coefficient of internal consistency will be reported
for each country along with each scaled construct in the different questionnaire sections in this
chapter. Similar and high values across countries are a good indication of having measured
reliably across countries.
Invariance of item parameters. PISA 2018 implemented a relatively new approach to test
whether equal (invariant) item parameters can be assumed across groups of participating
countries and language groups therein. It was first introduced to PISA in 2015. For a detailed
description of this approach, see next section.
Evaluating cross-country comparability of latent constructs
Just as in PISA 2015, PISA 2018 adopted a relatively new approach to evaluating the
invariance of latent constructs across pre-defined groups.
In a first step, groups were defined by country. In cases when a country administered the
questions in two or more languages, a country-language group was defined for each language
as long as there was a large sample of examinees for this group. A senate-weighted sample size
of at least 300 cases was considered sufficiently large to form one group. For regular scales,
groups are based on country-by-language combinations. For trend scales, groups are based on
cycle-by-country-by-language combinations.
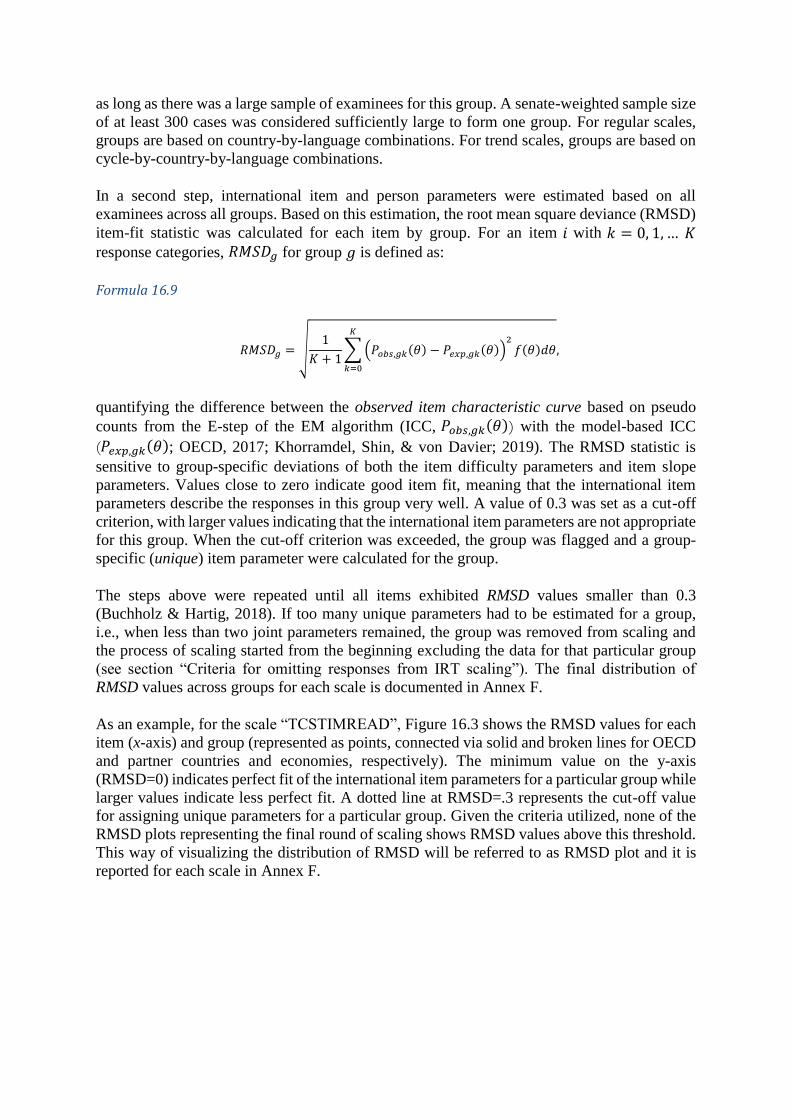
In a second step, international item and person parameters were estimated based on all
examinees across all groups. Based on this estimation, the root mean square deviance (RMSD)
item-fit statistic was calculated for each item by group. For an item 𝑖 with 𝑘 = 0, 1, … 𝐾
response categories, 𝑅𝑀𝑆𝐷𝑔 for group 𝑔 is defined as:
Formula 16.9
𝑅𝑀𝑆𝐷𝑔 = √1
𝐾 + 1∑(𝑃𝑜𝑏𝑠,𝑔𝑘(𝜃) − 𝑃𝑒𝑥𝑝,𝑔𝑘(𝜃))
2
𝑓(𝜃)𝑑𝜃
𝐾
𝑘=0
,
quantifying the difference between the observed item characteristic curve based on pseudo
counts from the E-step of the EM algorithm (ICC, 𝑃𝑜𝑏𝑠,𝑔𝑘(𝜃)) with the model-based ICC
(𝑃𝑒𝑥𝑝,𝑔𝑘(𝜃); OECD, 2017; Khorramdel, Shin, & von Davier; 2019). The RMSD statistic is
sensitive to group-specific deviations of both the item difficulty parameters and item slope
parameters. Values close to zero indicate good item fit, meaning that the international item
parameters describe the responses in this group very well. A value of 0.3 was set as a cut-off
criterion, with larger values indicating that the international item parameters are not appropriate
for this group. When the cut-off criterion was exceeded, the group was flagged and a group-
specific (unique) item parameter were calculated for the group.
The steps above were repeated until all items exhibited RMSD values smaller than 0.3
(Buchholz & Hartig, 2018). If too many unique parameters had to be estimated for a group,
i.e., when less than two joint parameters remained, the group was removed from scaling and
the process of scaling started from the beginning excluding the data for that particular group
(see section “Criteria for omitting responses from IRT scaling”). The final distribution of
RMSD values across groups for each scale is documented in Annex F.
As an example, for the scale “TCSTIMREAD”, Figure 16.3 shows the RMSD values for each
item (x-axis) and group (represented as points, connected via solid and broken lines for OECD
and partner countries and economies, respectively). The minimum value on the y-axis
(RMSD=0) indicates perfect fit of the international item parameters for a particular group while
larger values indicate less perfect fit. A dotted line at RMSD=.3 represents the cut-off value
for assigning unique parameters for a particular group. Given the criteria utilized, none of the
RMSD plots representing the final round of scaling shows RMSD values above this threshold.
This way of visualizing the distribution of RMSD will be referred to as RMSD plot and it is
reported for each scale in Annex F.
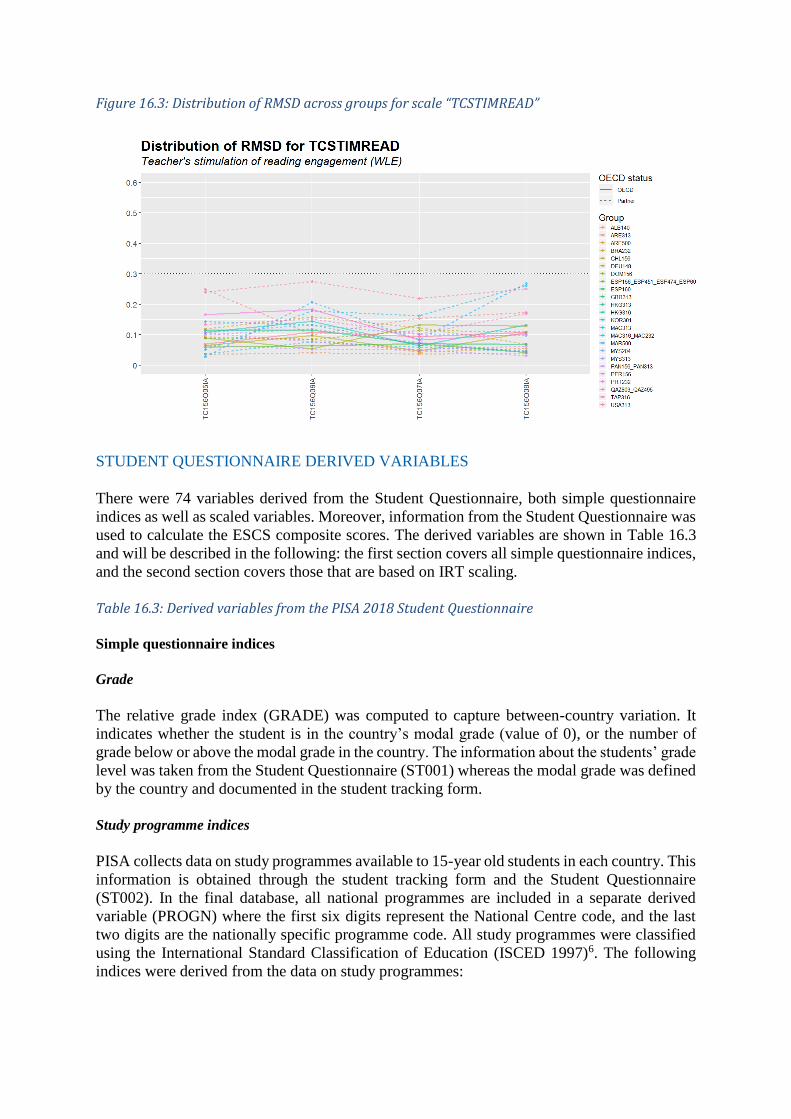
Figure 16.3: Distribution of RMSD across groups for scale “TCSTIMREAD”
STUDENT QUESTIONNAIRE DERIVED VARIABLES
There were 74 variables derived from the Student Questionnaire, both simple questionnaire
indices as well as scaled variables. Moreover, information from the Student Questionnaire was
used to calculate the ESCS composite scores. The derived variables are shown in Table 16.3
and will be described in the following: the first section covers all simple questionnaire indices,
and the second section covers those that are based on IRT scaling.
Table 16.3: Derived variables from the PISA 2018 Student Questionnaire
Simple questionnaire indices
Grade
The relative grade index (GRADE) was computed to capture between-country variation. It
indicates whether the student is in the country’s modal grade (value of 0), or the number of
grade below or above the modal grade in the country. The information about the students’ grade
level was taken from the Student Questionnaire (ST001) whereas the modal grade was defined
by the country and documented in the student tracking form.
Study programme indices
PISA collects data on study programmes available to 15-year old students in each country. This
information is obtained through the student tracking form and the Student Questionnaire
(ST002). In the final database, all national programmes are included in a separate derived
variable (PROGN) where the first six digits represent the National Centre code, and the last
two digits are the nationally specific programme code. All study programmes were classified
using the International Standard Classification of Education (ISCED 1997)6. The following
indices were derived from the data on study programmes:
programme level (ISCEDL) indicates whether students were at the lower or upper
secondary level (ISCED 2 or ISCED 3);
programme designation (ISCEDD) indicates the designation of the study programme
(A = general programmes designed to give access to the next programme level, B =
programmes designed to give access to vocational studies at the next programme level,
C = programmes designed to give direct access to the labour market, M = modular
programmes that combine any or all of these characteristics); and
programme orientation (ISCEDO) indicates whether the programme’s curricular
content was general, pre-vocational or vocational.
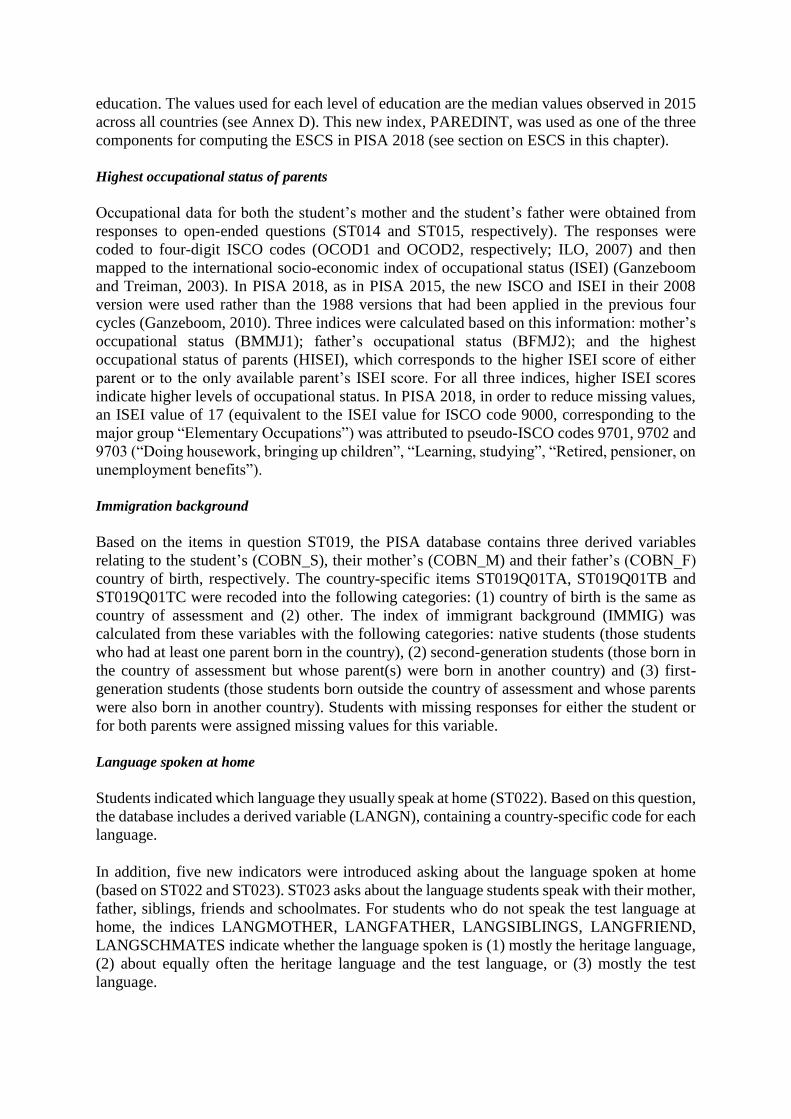
Student age
The age of a student (AGE) was calculated as the difference between the year and month of
the testing and the year and month of a student’s birth. Data on students’ age were obtained
from both the questionnaire (ST003) and the student tracking forms. The formula for
computing AGE was:
Formula 16.10
𝐴𝐺𝐸 = {100+(Ty − Sy)+(Tm− Sm), Ty > 10
(Ty − Sy) + (Tm− Sm), Ty < 10
where Ty and Sy are the year of the test and the year of the students’ birth, respectively, in two-
digit format (for example “06” or “92”), and Tm and Sm are the month of the test and month of
the students’ birth, respectively. The result is rounded to two decimal places.
Educational level of parents
Students’ responses to questions ST005, ST006, ST007, and ST008 regarding parental
education were classified using ISCED 1997 (OECD, 1999). Indices on parental education
were constructed by recoding educational qualifications into the following categories: (0)
None, (1) ISCED 1 (primary education), (2) ISCED 2 (lower secondary), (3) ISCED Level 3B
or 3C (vocational/pre-vocational upper secondary), (4) ISCED 3A (general upper secondary)
and/or ISCED 4 (non-tertiary post-secondary), (5) ISCED 5B (vocational tertiary) and (6)
ISCED 5A and/or ISCED 6 (theoretically oriented tertiary and post-graduate). Indices with
these categories were provided for a student’s mother (MISCED) and father (FISCED). In
addition, the index of highest educational level of parents (HISCED) corresponds to the higher
ISCED level of either parent. The index of highest educational level of parents was also recoded
into estimated number of years of schooling (PARED) based on the country level information
of the respective years of education (see Annex D).
For PISA 2018, additional indices representing parental education were created. For a student’s
mother (MISCED_D) and father (FISCED_D), respectively, the ISCED-categories were
recoded such that the parent will only receive the ISCED categories 3A/4, 5 or 6 if he or she
has successfully completed ISCED 2. In addition, the index of highest educational level of
parents (HISCED_D) corresponds to the higher ISCED_D level of either parent. Finally, an
alternative version of PARED, PAREDINT, was newly introduced in PISA 2018. PAREDINT
is based on an internationally standardized transformation of HISCED_D into years of
education. The values used for each level of education are the median values observed in 2015
across all countries (see Annex D). This new index, PAREDINT, was used as one of the three
components for computing the ESCS in PISA 2018 (see section on ESCS in this chapter).
Highest occupational status of parents
Occupational data for both the student’s mother and the student’s father were obtained from
responses to open-ended questions (ST014 and ST015, respectively). The responses were
coded to four-digit ISCO codes (OCOD1 and OCOD2, respectively; ILO, 2007) and then
mapped to the international socio-economic index of occupational status (ISEI) (Ganzeboom
and Treiman, 2003). In PISA 2018, as in PISA 2015, the new ISCO and ISEI in their 2008
version were used rather than the 1988 versions that had been applied in the previous four
cycles (Ganzeboom, 2010). Three indices were calculated based on this information: mother’s
occupational status (BMMJ1); father’s occupational status (BFMJ2); and the highest
occupational status of parents (HISEI), which corresponds to the higher ISEI score of either
parent or to the only available parent’s ISEI score. For all three indices, higher ISEI scores
indicate higher levels of occupational status. In PISA 2018, in order to reduce missing values,
an ISEI value of 17 (equivalent to the ISEI value for ISCO code 9000, corresponding to the
major group “Elementary Occupations”) was attributed to pseudo-ISCO codes 9701, 9702 and
9703 (“Doing housework, bringing up children”, “Learning, studying”, “Retired, pensioner, on
unemployment benefits”).
Immigration background
Based on the items in question ST019, the PISA database contains three derived variables
relating to the student’s (COBN_S), their mother’s (COBN_M) and their father’s (COBN_F)
country of birth, respectively. The country-specific items ST019Q01TA, ST019Q01TB and
ST019Q01TC were recoded into the following categories: (1) country of birth is the same as
country of assessment and (2) other. The index of immigrant background (IMMIG) was
calculated from these variables with the following categories: native students (those students
who had at least one parent born in the country), (2) second-generation students (those born in
the country of assessment but whose parent(s) were born in another country) and (3) first-
generation students (those students born outside the country of assessment and whose parents
were also born in another country). Students with missing responses for either the student or
for both parents were assigned missing values for this variable.
Language spoken at home
Students indicated which language they usually speak at home (ST022). Based on this question,
the database includes a derived variable (LANGN), containing a country-specific code for each
language.
In addition, five new indicators were introduced asking about the language spoken at home
(based on ST022 and ST023). ST023 asks about the language students speak with their mother,
father, siblings, friends and schoolmates. For students who do not speak the test language at
home, the indices LANGMOTHER, LANGFATHER, LANGSIBLINGS, LANGFRIEND,
LANGSCHMATES indicate whether the language spoken is (1) mostly the heritage language,
(2) about equally often the heritage language and the test language, or (3) mostly the test
language.
Learning time
Learning time in test language (LMINS) was computed by multiplying the number of minutes
on average in the test language class by number of test language class periods per week (ST061
and ST059). Comparable indices were computed for mathematics (MMINS) and science
(SMINS). Learning time in total (TMINS) was computed using information about the average
minutes in a <class period> (ST061) in relation to information about the number of class
periods per week attended in total (ST060).
Expected occupational status
In PISA 2018, students were asked to answer a question (ST114) about “what kind of job [they]
expect to have when [they] are about 30 years old”. Answers to this open-ended question were
recoded into two indices related to career expectations. OCOD3 represents the four-digit ISCO
codes (ILO, 2007). These ISCO codes were then mapped to the international socio-economic
index of occupational status (ISEI) (Ganzeboom and Treiman, 2003), in variable BSMJ. Higher
scores on this variable indicate higher levels of a student’s expected occupational status.
Early childhood education and care
Questions ST125 and ST126 measure the starting age in ISCED 1 and ISCED 0. The indicator
DURECEC is built as the difference of ST126 and ST125 plus the value of “2” to indicate the
number of years a student spent in early childhood education and care.
Grade repetition
The grade repetition variable (REPEAT) was computed by recoding variables ST127Q01TA,
ST127Q02TA, and ST127Q03TA. REPEAT took the value of “1” if the student had repeated
a grade in at least one ISCED level and the value of “0” if “no, never” was chosen at least once,
given that none of the repeated grade categories were chosen. The index is assigned a missing
value if none of the three categories were ticked in any levels.
Meta-cognition
The PISA 2018 questionnaires included three scenarios assessing students’ meta-cognition of
reading: “Understanding and remembering” (UNDREM, ST164), “Summarising”
(METASUM, ST165) and “Assessing credibility” (METASPAM, ST166). UNDREM and
METASUM were already administered in PISA 2009 (cf. Technical Report 2009: OECD,
2012, p. 282). METASPAM was newly developed for PISA 2018.
Each scenario consists of (a) a stem which is a reading task and (b) a set of strategies. Students
were asked to rate the strategies regarding their usefulness for solving the reading task. All
strategies have also been rated by reading experts regarding their usefulness via multiple
pairwise comparisons. This rating resulted in a hierarchy of all strategies for each task and it
was based on all the pairs agreed upon by at least 80% of the experts. For the new scenario
METASPAM (based on question ST166), for example, the experts’ ratings resulted in the
following order: Q02HA, Q04HA, Q05HA > Q01HA, Q03HA.
Based on this rating order, pairwise rules were then created to construct a score for each student
indicating the number of times in which he or she chose a more useful over a less useful
strategy. The final scores assigned to each student for each task ranges from 0 to 1 and can be
interpreted as the proportion of the total number of expert pairwise relations that are consistent
with the student ordering. The higher the score, the higher the number of times in which a
student chose an expert-validated strategy over a less useful one. For METASPAM, there were
6 (3x2) resulting pairwise rules based on this order, namely Q04HA > Q01HA, Q04HA >
Q03HA, Q02HA > Q01HA, Q02HA > Q03HA, Q05HA > Q01HA, and Q05HA > Q03HA.
Consequently, a student following 4 of these rules receives a score of 4/6=0.67. A similar
procedure was carried out for the remaining two meta-cognition tasks. For UNDREM (based
on question ST164), the expert-rated strategy order was Q03IA, Q04IA, Q05IA > Q01IA,
Q02IA, Q06IA. For METASUM (based on question ST165), the expert-rated strategy order
was Q04IA, Q05IA > Q01IA, Q03IA > Q02IA.
In case of a missing value on one or more items of the question, a missing score was assigned.
Finally, all three indices were standardized to have an OECD mean of 0 and a standard
deviation of 1.
Derived variables based on IRT scaling
The PISA 2018 Student Questionnaire provided data for 39 derived variables based on IRT
scaling which will be presented along with their internal consistency, their item content and
item parameters in the following sections. Two of the scales in the Student Questionnaire,
JOYREAD and DISCLIMA, were mapped to the respective scale used in PISA 2009 so that
trend comparison is possible.
Household possessions
In PISA 2018, students reported on the availability of 16 household items at their home
(ST011) including three country-specific household items that were seen as local measures of
family wealth within the country’s context. In addition, students reported the amount of
possessions and books at home (ST012, ST013). Five indices were derived from these items:
i) family wealth possessions (WEALTH), ii) cultural possessions (CULTPOSS), iii) home
educational resources (HEDRES), iv) ICT resources (ICTRES) and v) home possessions
(HOMEPOS). Table 16.4 gives an overview of the indicator items for each of these five indices.
Table 16.4: Indicators of household possessions and home background indices
Tables 16.5 and 16.6 provide information on the reliabilities (Cronbach’s Alpha coefficients)
in OECD countries and partner countries and economies, respectively.
Table 16.5: Scale reliabilities for Household possessions indices in OECD countries
Table 16.6: Scale reliabilities for Household possessions indices in partner countries and economies
HOMEPOS is a summary index of all household and possession items (ST011, ST012 and
ST013). HOMEPOS is also one of three components in the construction of the PISA index of
economic, social and cultural status (ESCS) (see the section on ESCS index construction later
in this chapter). The home possessions scale for PISA 2018 was computed differently than in
the previous cycles. The IRT model has changed for all cognitive and non-cognitive scales for
the purpose of cross-cultural comparability (see section “Cross-country comparability” in this
chapter). Categories for the number of books in the home are unchanged in PISA 2018. The
ST011-items (1=“yes”, 2=“no”) were reverse-coded so that a higher level indicates the
presence of the indicator. Please note that items ST011D17TA, ST011D18TA and
ST011D19TA represent national indicators of home possessions (see Annex E) and thus differ
in meaning across countries. In addition, items ST011Q07TA (Classic literature (e.g.
<Shakespeare>)), ST011Q08TA (Books of poetry), and ST012Q03TA (Rooms with a bath or
shower) were considered to have country-specific meaning. For all six items, no equality
constraints were assigned from the beginning. Instead, group-specific (large enough country-
by-language interactions) item parameters were estimated and are provided in Tables 16.7 and
16.8 for OECD countries and partner countries and economies, respectively.
Table 16.7: Item parameters for national home possession indicators in OECD countries
Table 16.8: Item parameters for national home possession indicators in partner countries and economies
Tables 16.9-16.13 show the item wording and international item parameters for each of the five
scales, respectively. Please note that all items of question ST011 are dichotomous, resulting in
a 2PL model with only two item parameters: one referring to item difficulty () and one
referring to item discrimination (). No threshold parameters (d) are necessary.
Table 16.9: Item parameters for Home possessions (HOMEPOS)
Table 16.10:Item parameters for Cultural possessions at home (CULTPOSS)
Table 16.11: Item parameters for Home educational resources (HEDRES)
Table 16.12: Item parameters for Family wealth (WEALTH)
Table 16.13: Item parameters for ICT Resources (ICTRES)
Test language lessons
PISA 2018 focused on the test language lessons in school by including questions about the
learning environment in the test language classroom. They asked how often specific activities
happened. Tables 16.14 and 16.15 contain the scale reliabilities (Cronbach’s Alpha
coefficients) for all participating OECD and partner countries and economies, respectively.
Table 16.14: Scale reliabilities for all derived variables relating to test language lessons in OECD countries
Table 16.15: Scale reliabilities for all derived variables relating to test language lessons in partner countries and economies
To assess the disciplinary climate in the test language classroom (DISCLIMA, ST097),
students responded on a four-point Likert scale with the categories “Every lesson”, “Most
lessons”, “Some lessons”, and “Never or hardly ever”. Table 16.16 shows the item wording
and international item parameters for DISCLIMA.
Table 16.16: Item parameters for Disciplinary climate in test language classes (DISCLIMA)
ST100 asks about teacher support (TEACHSUP). Students responded on a four-point Likert
scale with the categories “Every lesson”, “Most lessons”, “Some lessons”, and “Never or
hardly ever”. As a result, the responses had to be reversed so that higher WLEs and higher
difficulty correspond to higher levels of teacher support in test language lessons. Table 16.17
shows the item wording and international item parameters for TEACHSUP.
Table 16.17: Item parameters for Teacher support in test language lessons (TEACHSUP)
Teacher-directed instruction (DIRINS) was assessed with a question (ST102) that focussed on
teacher practices in test language lessons. All items were reverse-coded. Students responded
on a four-point Likert scale with the categories “Every lesson”, “Most lessons”, “Some
lessons”, and “Never or hardly ever”. Table 16.18 shows the item wording and international
item parameters for DIRINS.
Table 16.18: Item parameters for Teacher-directed instruction (DIRINS)
To assess the perceived teacher feedback (PERFEED, ST104), students responded on a four-
point Likert scale with the categories “Never or almost never”, “Some lessons”, “Many
lessons”, and “Every lesson or almost every lesson”. Table 16.19 shows the item wording and
international item parameters for PERFEED.
Table 16.19: Item parameters for Perceived feedback (PERFEED)
The scale on teachers’ stimulation of reading and teaching strategies (STIMREAD, ST152)
was already used in PISA 2009 (ST37). It provides information on how teachers stimulate
students’ reading engagement and reading skills. The four response categories ranged from
“Never or hardly ever”, “In some lessons”, “In most lessons”, to “In all lessons”. Higher WLEs
indicate higher teacher stimulation or reading engagement. Similarly, positive item difficulties
indicate aspects of teacher stimulation that are less common in the classroom environment.
Table 16.20 shows the item wording and international item parameters for STIMREAD.
Table 16.20: Item parameters for Teacher's stimulation of reading engagement perceived by student (STIMREAD)
Question ST212 addresses the adaptivity of instruction in test language lessons
(ADAPTIVITY). Students responded on a four-point Likert scale with the categories “Never
or almost never”, “Some lessons”, “Many lessons”, and “Every lesson or almost every lesson”.
Table 16.21 shows the item wording and international item parameters for ADAPTIVITY.
Table 16.21: Item parameters for Adaptation of instruction (ADAPTIVITY)
The teacher’s interest in teaching as perceived by the students (TEACHINT, ST213) was
measured with four items. A four-point Likert scale is applied for this question, ranging from
“Strongly disagree”, “Disagree”, “Agree”, to “Strongly agree”. Table 16.22 shows the item
wording and international item parameters for this TEACHINT.
Table 16.22: Item parameters for Perceived teacher's interest (TEACHINT)
Reading related attitudes
A total of four indicators targeting the individual reading-related attitudes of students were also
included in the Student Questionnaire. Tables 16.23 and 16.24 contain the scale reliabilities
(Cronbach’s Alpha coefficients) for all participating OECD and partner countries and
economies, respectively.
Table 16.23: Scale reliabilities for JOYREAD, SCREADCOMP, SCREADDIFF, PISADIFF in OECD countries
Table 16.24: Scale reliabilities for JOYREAD, SCREADCOMP, SCREADDIFF, PISADIFF in partner countries and economies
To measure the enjoyment of reading (JOYREAD, ST160), five items were taken from PISA
2009 (ST24). To allow for trend comparisons, scaling was conducted based on all 11 items of
ST24 (2009) and all five items of ST160 (2018), and WLE scores reported for 2018 have been
transformed so that they can be directly compared to those reported in PISA 2009. There are
four response categories ranging from “Strongly disagree”, “Disagree”, “Agree”, to “Strongly
agree”. Items which are negatively worded (for 2018: ST160Q01IR, ST160Q04IR and
ST160Q05IR) were reverse-scored for IRT scaling such that higher WLE scores on this derived
variable indicate higher levels of enjoyment of reading. Table 16.25 shows the item wording
and the international item parameters for JOYREAD.
Table 16.25: Item parameters for Joy/Like reading (JOYREAD)
Using a 6-item scale (ST161), students were asked to rate their self-concept of reading in two
aspects: Their perception of competence (SCREADCOMP, items ST161Q01HA,
ST161Q02HA, ST161Q03HA) and their perception of difficulty (SCREADDIFF, items
ST161Q06HA, ST161Q07HA, ST161Q08HA) when performing reading tasks. Tables 16.26
and 16.27 show the item wording and the international item parameters for SCREADCOMP
and SCREADDIFF, respectively.
Table 16.26: Item parameters for Self-concept of reading: Perception of competence (SCREADCOMP)
Table 16.27: Item parameters for Self-concept of reading: Perception of difficulty (SCREADDIFF)
Additionally, students were asked about their perception of difficulty of the PISA test
(PISADIFF, ST163). Responses were given on a four-point Likert scale with the categories
“Strongly disagree”, “Disagree”, “Agree”, and “Strongly agree”. Table 16.28 shows the item
wording and the international item parameters for PISADIFF.
Table 16.28: Item parameters for Perception of difficulty of the PISA test (PISADIFF)
Dispositional and school-focused variables
Dispositional variables are the personality-based context in which students approach learning.
They are the result of a lifetime of socialisation from parents, teachers, coaches and one’s
cultural surroundings, and they capture how behaviour is energised over time. School-focused
variables, or how students view and approach school, are influenced by both students’
disposition and the particular situation in which they find themselves. Tables 16.29 and 16.30
contain the scale reliabilities (Cronbach’s Alpha coefficients) for all participating OECD and
partner countries and economies, respectively.
Table 16.29: Scale reliabilities for ATTLNACT, COMPETE, WORKMAST, GFOFAIL, RESILIENCE, MASTGOAL, PERCOMP, PERCOOP in OECD countries
Table 16.30: Scale reliabilities for ATTLNACT, COMPETE, WORKMAST, GFOFAIL, RESILIENCE, MASTGOAL, PERCOMP, PERCOOP in partner countries and economies
The scale on attitudes towards learning activities (ATTLNACT, ST036) consists of three items
(ST036Q05TR, ST036Q06TR and ST036Q08TR) which were reverse-coded. It was also
included in the PISA 2012 Student Questionnaire (ID in 2012: ST89). A four-point Likert scale
is applied for this question, ranging from “Strongly agree”, “Agree”, to “Disagree”, and
“Strongly disagree”. Table 16.31 shows the item wording and the international item parameters
for ATTLNACT.
Table 16.31: Item parameters for Attitude towards school: learning activities (ATTLNACT)
The scale on competitiveness (COMPETE, ST181) consists of three items, collecting
information about students' competitiveness achievement motive. It applies a four-point Likert
scale ranging from “Strongly disagree”, “Disagree”, to “Agree”, and “Strongly agree”. Table
16.32 shows the item wording and the international item parameters for COMPETE.
Table 16.32: Item parameters for Competitiveness (COMPETE)
The scale WORKMAST (ST182) consists of three items asking about the working motive and
mastery achievement motive of students. It applies a four-point Likert scale ranging from
“Strongly disagree”, “Disagree”, to “Agree”, and “Strongly agree”. Table 16.33 shows the item
wording and the international item parameters for WORKMAST.
Table 16.33: Item parameters for Work mastery (WORKMAST)
The scale GFOFAIL (ST183) consists of three items assessing the students' general fear of
failure. It applies a four-point Likert scale ranging from “Strongly disagree”, “Disagree”, to
“Agree”, and “Strongly agree”. Table 16.34 shows the item wording and the international item
parameters for GFOFAIL.
Table 16.34: Item parameters for General fear of failure (GFOFAIL)
The scale on students' resilience (RESILIENCE, ST188) consists of five items using a four-
point Likert scale, ranging from “Strongly disagree”, “Disagree”, to “Agree”, and “Strongly
agree”. Table 16.35 shows the item wording and the international item parameters for
RESILIENCE.
Table 16.35: Item parameters for Resilience (RESILIENCE)
The scale MASTGOAL (ST208) informs about students' mastery-approach orientation of
achievement goals. It consists of three items and applies a five-point Likert scale ranging from
“Not at all true of me”, “Slightly true of me”, “Moderately true of me”, to “Very true of me”,
and “Extremely true of me”. Table 16.36 shows the item wording and the international item
parameters for MASTGOAL.
Table 16.36: Item parameters for Mastery goal orientation (MASTGOAL)
Two scales inform about the way in which students perceive a climate of competition
(PERCOMP, ST205) and cooperation (PERCOOP, ST206) amongst the students in their
school. The scales are each based on three items with a four-point Likert scale ranging from
“Not at all true”, “Slightly true”, to “Very true”, and “Extremely true”. Tables 16.37 and 16.38
show the item wording and the international item parameters for PERCOMP and PERCOOP,
respectively.
Table 16.37: Item parameters for Perception of competitiveness at school (PERCOMP)
Table 16.38: Item parameters for Perception of co-operation at school (PERCOOP)
Parental Support
Students were asked about their perceived emotional support from their parents (EMOSUPS,
ST123) with three items using a four-point Likert scale with the response categories “Strongly
disagree”, “Disagree”, “Agree”, and “Strongly agree”. This question was also used in PISA
2015 (ST123). Tables 16.39 and 16.40 contain the scales’ reliability (Cronbach’s Alpha) for
all participating OECD and partner countries and economies, respectively.
Table 16.39: Scale reliabilities for Parents’ emotional support perceived by student (EMOSUPS) in OECD countries
Table 16.40: Scale reliabilities for Parents’ emotional support perceived by student (EMOSUPS) in partner countries and economies
Table 16.41 shows the item wording and international item parameters for EMOSUPS.
Table 16.41: Item parameters for Parents' emotional support perceived by student (EMOSUPS)
Students’ well-being
PISA 2018 included two scales in the Student Questionnaire addressing different aspects of
students’ well-being. Tables 16.42 and 16.43 contain the scales’ reliabilities (Cronbach’s
Alpha) for all participating OECD and partner countries and economies, respectively.
Table 16.42: Scale reliabilities for EUDMO and SWBP in OECD countries
Table 16.43: Scale reliabilities for EUDMO and SWBP in partner countries and economies
The scale EUDMO (ST185) assessed eudemonia, a sense of meaning and purpose in life. It
consists of three items and applies a four-point Likert-scale ranging from “Strongly disagree”,
“Disagree”, to “Agree”, and “Strongly agree”. Table 16.44 shows the item wording and
international item parameters for EUDMO.
Table 16.44: Item parameters for Eudaemonia: meaning in life (EUDMO)
Subjective well-being (SWBP, ST186) measures students' positive affect by asking them about
different feelings they might have had. It consists of three items and applies a four-point Likert-
scale ranging from “Never”, “Rarely”, “Sometimes”, to “Always”. Table 16.45 shows the item
wording and international item parameters for SWBP.
Table 16.45: Item parameters for Subjective well-being: Positive affect (SWBP)
Dispositions for global competence
The PISA framework defines dispositions for global competence that were included in the
PISA 2018 Student Questionnaire. They relate to different aspects of the model of global
competence (OECD, 2018). Derived variables are only available for a selected sample of
countries that chose to include these questions. A total of ten scales have been reported and
will be described in the following. Tables 16.46 and 16.47 contain the scales’ reliabilities
(Cronbach’s Alpha) for all participating OECD and partner countries and economies,
respectively.
Table 16.46: Scale reliabilities for Global Competence scales in OECD countries
Table 16.47: Scale reliabilities for Global Competence scales in partner countries and economies
Knowledge about the world and other cultures
Question ST196 addresses a student’s self-efficacy regarding explaining or discussing several
complex global issues (GCSELFEFF). This question was partly retained from previous PISA
cycles (PISA 2015: ST129). The question stem and the first item have been retained from the
original question. All remaining items have been newly developed. The response format is a
four-point scale with the response categories “I couldn’t do this”, “I would struggle to do this
on my own”, “I could do this with a bit of effort”, and “I could do this easily”. Table 16.48
shows the item wording and international item parameters for GCSELFEFF.
Table 16.48: Item parameters for Self-efficacy regarding global issues (GCSELFEFF)
Question ST197 queries a student’s awareness of global issues (GCAWARE). This question
was partly retained from PISA 2015 (ST092). However, only the question stem is similar, all
items have been newly developed. The response format is a four-point scale with the response
categories “I have never heard of this”, “I have heard about this but I would not be able to
explain what it is really about”, “I know something about this and could explain the general
issue”, and “I am familiar with this and I would be able to explain this well”. Table 16.49 shows
the item wording and international item parameters for GCAWARE.
Table 16.49: Item parameters for Student's awareness of global issues (GCAWARE)
Question ST204 is new to PISA 2018. It queries the student’s attitudes toward equal rights for
immigrants (ATTIMM) and has been taken from the International Civic and Citizenship
Education Study (ICCS) (see Schulz, Ainley, & Fraillon, 2011). The response format is a four-
point Likert scale with the response categories “Strongly disagree”, “Disagree”, “Agree”, and
“Strongly agree”. Table 16.50 shows the item wording and international item parameters for
ATTIMM.
Table 16.50:Item parameters for Student's attitudes towards immigrants (ATTIMM)
Question ST214 queries a student’s interest in learning about other cultures (INTCULT). This
question is new to PISA 2018. The response format is a five-point Likert scale with the
response categories “Very much like me”, “Mostly like me”, “Somewhat like me”, “Not much
like me”, and “Not at all like me”. All the items were reverse-coded before scaling. Table 16.51
shows the item wording and international item parameters for INTCULT.
Table 16.51: Item parameters for Student's interest in learning about other cultures (INTCULT)
Question ST215 assesses how far a person takes the perspective of other people (PERSPECT)
and has been adapted from Davis (1983). Perspective taking is seen as an important
precondition for successful intercultural relationships. The response format is a five-point
Likert scale with the response categories “Very much like me”, “Mostly like me”, “Somewhat
like me”, “Not much like me”, and “Not at all like me”. All the items were reverse-coded.
Table 16.52 shows the item wording and international item parameters for PERSPECT.
Table 16.52: Item parameters for Perspective taking (PERSPECT)
Question ST216 assesses a student’s flexibility/adaptability in dealing with challenging or
difficult situations, which may include intercultural situations (COGFLEX). Items were
selected, with slight word adjustments, from Martin and Rubin (1995) and Dennis and Vander
Wal (2010). “Flexibility/adaptability” comprises the following facets: “Adaptation to
unfamiliar situations” (items Q01, Q02, Q03, Q05), “Intercultural adaptation” (item Q05). The
response format is a five-point Likert scale with the response categories “Very much like me”,
“Mostly like me”, “Somewhat like me”, “Not much like me”, and “Not at all like me”. All the
items were reverse-coded before scaling. Table 16.53 shows the item wording and international
item parameters for COGFLEX.
Table 16.53: Item parameters for Cognitive flexibility/adaptability (COGFLEX)
Question ST217 assesses a student’s respect for people from other cultures (RESPECT).
“Respect for people from other cultures” means having positive regard and esteem for those
people because they are perceived to have an intrinsic importance, worth or value which stems
from their inherent dignity as human beings (cf. the preamble to the Universal Declaration of
Human Rights). The response format is a five-point Likert scale with the response categories
“Very much like me”, “Mostly like me”, “Somewhat like me”, “Not much like me”, and “Not
at all like me”. All the items were reverse-coded before scaling. Table 16.54 shows the item
wording and international item parameters for RESPECT.
Table 16.54: Item parameters for Respect for people from other cultures (RESPECT)
Skills to understand the world and to take action
Question ST218 assesses a student’s intercultural communicative awareness (AWACOM)
which is regarded as one aspect of that student’s “global competence”. “Intercultural
communicative awareness” comprises the following facets: “Observing and monitoring
communications” (items Q01, Q02 and Q03), “Careful expression of own meanings” (items
Q04, Q05 and Q06), and “Managing communication breakdowns” (item Q07). The response
format is a four-point Likert scale with the response categories “Strongly disagree”,
“Disagree”, “Agree”, “Strongly agree”. Table 16.55 shows the item wording and international
item parameters for AWACOM.
Table 16.55: Item parameters for Awareness of intercultural communication (AWACOM)
Attitudes of openness, respect for people from different cultural backgrounds and global
mindedness
Question ST219 assesses a student’s sense of global-mindedness (GLOBMIND) which is
regarded as one aspect of that student’s “global competence”. “Global-mindedness” is a
worldview in which one sees oneself as connected to the world community and feels a sense
of responsibility towards its members. A globally-minded person has concerns for other people
in all parts of the world and feelings of responsibility to try to improve their conditions and the
global environment irrespective of distance and cultural differences. “Global-mindedness”
comprises the following facets: “Sense of world citizenship” (item Q01), “Responsibility for
others in the world” (items Q02, Q04 and Q06), “Sense of inter-connectedness” (item Q03),
and “Global self-efficacy” (item Q05). The response format is a four-point Likert scale with
the response categories “Strongly disagree”, “Disagree”, “Agree”, “Strongly agree”. Table
16.56 shows the item wording and international item parameters for GLOBMIND.
Table 16.56: Item parameters for Global-mindedness (GLOBMIND)
Question ST223 has been adapted from a question used in the PISA 2015 Field Trial (ST025).
It queries the multicultural school climate (DISCRIM). It asks students whether their teachers
treat students from all cultural groups with equal respect. Thereby, it measures the absence of
stereotypes, prejudice, and discrimination. The students are asked how many statements in the
question apply to their teachers. The response format is a four-point Likert scale with the
response categories “To none or almost none of them”, “To some of them”, “To most of them”,
and “To all or almost all of them”. Table 16.57 shows the item wording and international item
parameters for DISCRIM.
Table 16.57: Item parameters for Discriminating school climate (DISCRIM)
School climate
Aspects related to the school climate were assessed with two scales for PISA 2018.
Tables 16.58 and 16.59 contain the scales’ reliabilities (Cronbach’s Alpha) for all participating
OECD and partner countries and economies respectively.
Table 16.58: Scale reliabilities for BELONG, BEINGBULLIED in OECD countries
Table 16.59: Scale reliabilities for BELONG, BEINGBULLIED in partner countries and economies
PISA 2018 asked students about their sense of belonging to school (BELONG, ST034) using
six items previously used in PISA 2012 (ST87) and PISA 2015 (ST034). The response format
was a four-point Likert scale with the response categories “Strongly agree”, “Agree”,
“Disagree”, and “Strongly disagree”. Items ST034Q02TA, ST034Q03TA and ST034Q05TA
were reverse-coded so that higher WLEs and higher difficulty correspond to higher level of
sense of belonging on all items. Table 16.60 shows the item wording and international item
parameters for BELONG.
Table 16.60: Item parameters for Subjective well-being: Sense of belonging to school (BELONG)
PISA 2018 includes a scale on student's experience of being bullied (BEINGBULLIED,
ST038) using three items that were taken over from PISA 2015 (ID in 2015: ST038), asking
students how often they had been bullied by other students at school in the past 12 months. The
question used a four-point scale with response categories ranging from “Never or almost
never”, “A few times a year” , “A few times a month” to “Once a week or more”. Table 16.61
shows the item wording and international item parameters for BEINGBULLIED.
Table 16.61: Item parameters for Student's experience of being bullied (BEINGBULLIED)
SCHOOL QUESTIONNAIRE DERIVED VARIABLES
The PISA 2018 School Questionnaire consisted mainly of questions used in previous cycles.
All 17 derived variables are shown in Table 16.62 and are described in the following: the first
section covers all simple questionnaire indices, the second section covers those that are based
on IRT scaling.
Table 16.62: Derived variables in the PISA 2018 School Questionnaire
Simple questionnaire indices
School size
The index of school size (SCHSIZE) contains the total enrolment at school. It is based on the
enrolment data provided by the school principal, summing up the number of girls and boys at
a school (SC002). This index was calculated in 2018 and in all previous cycles.
Class size
The average class size (CLSIZE, SC003) is derived from one of nine possible categories in
question SC003, ranging from “15 students or fewer” to “More than 50 students”.
Availability of computers
School principals were asked to report the number of computers available at school (SC004).
The index of availability of computers (RATCMP1) is the ratio of computers available to 15-
year olds for educational purposes to the total number of students in the modal grade for 15-
year olds. The index RATCMP2 was calculated as the ratio of number of computers available
to 15-year olds for educational purposes to the number of these computers that were connected
to the internet.
School type
Schools are classified as either public or private according to whether a private entity or a
public agency has the ultimate power for decision making concerning its affairs. As in previous
PISA surveys, the index on school type (SCHLTYPE) was constructed by recoding SC013 and
SC016. SC013 asks whether the school is public or private, and SC016 asks about the source
of resources. SCHLYTPE has the following categories: (1) Private independent (if
SC013Q01TA=2 and SC016Q01TA < 50), (2) Private Government-dependent (if
SC013Q01TA=2 and SC016Q01TA >=50), (3) Public (if SC013Q01TA=1). This index was
calculated in 2018 and in all previous cycles. In PISA 2018, however, a few countries provided
this information from administrative record (e.g., Ireland, Singapore). In PISA 2009, the
variable name was SCHTYPE.
Quantity of teaching staff at school
Principals were asked to report the total number of teachers at their school (TOTAT) and
provide additional information on how many of the staff was full-time and part-time employed
teachers qualified at different ISCED levels (SC018).
The proportion of fully certified teachers (PROATCE) was computed by dividing the number
of fully certified teachers by the total number of teachers.
The proportion of teachers with an ISCED 5A bachelor qualification (PROAT5AB) was
calculated by dividing the number of these teachers by the total number of teachers.
The proportion of teachers with an ISCED 5A master qualification (PROAT5AM) was
calculated by dividing the number of these teachers by the total number of teachers.
The proportion of teachers with an ISCED level 6 qualification (PROAT6) was calculated by
dividing the number of these teachers by the total number of teachers.
The student-teacher ratio (STRATIO) was obtained by dividing the number of enrolled
students (SC002) by the total number of teachers (TOTAT).
Extra-curricular activities at school
School principals were asked to report what extra-curricular activities their schools offered to
15-year old students (SC053). The index of creative extra-curricular activities at school
(CREACTIV) was computed as the total number of the following activities that occurred at
school: i) band, orchestra or choir; ii) school play or school musical; and iii) art club or art
activities.
Derived variables based on IRT scaling
The School Questionnaire provided data for five derived variables based on IRT scaling which
will be presented along with their item content and item parameters in the following. Tables
16.63 and 16.64 contain the scale reliabilities (Cronbach’s Alpha coefficients) for all
participating OECD and partner countries and economies, respectively.
Table 16.63: Scale reliabilities for all derived variables in the School Questionnaire in OECD countries
Table 16.64: Scale reliabilities for all derived variables in the School Questionnaire in partner countries and economies
School resources
PISA 2018 included a question with eight items about school resources, measuring the school
principal’s perceptions of potential factors hindering the provision of instruction at school
(SC017). The four response categories were “Not at all”, “Very little”, “To some extent”, and
“A lot”. Both the scale on staff shortage (STAFFSHORT: SC017Q01NA, SC017Q02NA,
SC017Q03NA, and SC017Q04NA) and the scale on shortage of educational material
(EDUSHORT: SC017Q05NA, SC017Q06NA, SC017Q07NA, and SC017Q08NA) were based
on four items each. Tables 16.65 and 16.66 show the item wording and international item
parameters for STAFFSHORT and EDUSHORT, respectively.
Table 16.65: Item parameters for Shortage of educational staff (STAFFSHORT)
Table 16.66: Item parameters for Shortage of educational material (EDUSHORT)
School climate
The School Questionnaire included a trend question on school climate (SC061). It measured
the school principal’s perceptions of the school climate, in particular his or her perceptions of
teacher and student behaviour that might influence the provision of instruction at school. The
four response categories were “Not at all”, “Very little”, “To some extent”, and “A lot”. The
scaling model used six items to reflect student-related factors affecting school climate
(STUBEHA: items SC061Q01TA, SC061Q02TA, SC061Q03TA, SC061Q04TA,
SC061Q05TA and SC061Q11TA) and five items to reflect teacher-related factors affecting
school climate (TEACHBEHA: items SC061Q06TA, SC061Q07TA, SC061Q08TA,
SC061Q09TA, and SC061Q10TA). Tables 16.67 and 16.68 show the item wording and
international item parameters for STUBEHA and TEACHBEHA, respectively.
Table 16.67: Item parameters for Student behaviour hindering learning (STUBEHA)
Table 16.68: Item parameters for Teacher behaviour hindering learning (TEACHBEHA)
PISA 2018 also assessed the multicultural school climate as perceived by principals
(SCMCEG). This construct refers to teachers’ multicultural and egalitarian beliefs and was
adapted from Hachfeld, Hahn, Schroeder, Anders, Stanat & Kunter (2011). The question asks
principals to what extent the statements in the items reflect an opinion shared by their teaching
staff (SC166). The four response categories were “Shared among none or almost none of
them”, “Shared among some of them”, “Shared among many of them”, and “Shared among all
or almost all of them”. The resulting scale SCMCEG indicates the school principal’s view on
teachers’ multicultural and egalitarian beliefs. Table 16.69 shows the item wording and
international item parameters for SCMCEG.

Table 16.69: Item parameters for School principal's view on teachers' multicultural and egalitarian beliefs (SCMCEG)
ICT FAMILIARITY QUESTIONNAIRE
The ICT Familiarity Questionnaire (ICQ) is an international option that countries could choose
to implement. It is administered to the PISA students after they have completed the Student
Questionnaire. For PISA 2018, 11 derived variables were constructed, nine of which were
scaled using the IRT model described above. Most of the scales were already reported in PISA
2015.
An overview of all derived variables is shown in Table 16.70, and each is described in the
following: the first section covers all simple questionnaire indices, the second section covers
those that are based on IRT scaling.
Table 16.70: Derived variables in the optional PISA 2018 ICT Familiarity Questionnaire
Simple questionnaire indices
Availability and usage of ICT
The ICQ asked about the availability of ICT at home and if students used it for various
purposes. ICTHOME is an index calculated as the number of all 11 items included in IC001
that were agreed upon (either response category “Yes, and I use it” or “Yes, but I don’t use it”),
thus ranging from 0-11.
IC009 asked about the availability of ICT at school. The derived variable ICTSCH is calculated
as the number of all ten items in IC009 that were agreed upon (either response category “Yes,
and I use it” or “Yes, but I don’t use it”), thus ranging from 0-10.
Derived variables based on IRT scaling
The ICT Familiarity Questionnaire provided data for nine derived variables based on IRT
scaling which will be presented along with their item content and item parameters in the
following sections. Tables 16.71 and 16.72 contain the scale reliabilities (Cronbach’s Alpha
coefficients) for all participating OECD and partner countries and economies, respectively.
Table 16.71: Scale reliabilities for all derived variables in the ICT Familiarity Questionnaire in OECD countries
Table 16.72: Scale reliabilities for all derived variables in the ICT Familiarity Questionnaire in partner countries and economies
Availability and usage of ICT
Three questions in the ICT Familiarity Questionnaire asked how often digital devices are used
outside of school for leisure activities (IC008), outside of school for school work (IC010), as
well as for activities in school (IC011). The response categories for all three questions ranged
from “Never or hardly ever”, “Once or twice a month”, “Once or twice a week”, “Almost every
day”, to “Every day”. The respective indices ENTUSE (leisure activities), HOMESCH (for
school work outside of school) and USESCH (use of ICT at school) are scaled using the IRT
scaling model described above. Tables 16.73, 16.74 and 16.75 show the item wording and
international item parameters for each of the three scales, respectively.
Table 16.73: Item parameters for ICT use outside of school (leisure) (ENTUSE)
Table 16.74: Item parameters for Use of ICT outside of school (for school work activities) (HOMESCH)
Table 16.75: Item parameters for Use of ICT at school in general (USESCH)
Interest in ICT and perceived competence
PISA 2018 included four questions in the ICT Familiarity Questionnaire addressing students’
ICT interest (IC013, INTICT), their perceived competence in ICT usage (IC014, COMPICT),
their perceived autonomy related to ICT usage (IC015, AUTICT), and the degree to which ICT
is a part of their daily social life (IC016, SOIAICT). All questions used a four-point Likert
response scale ranging from “Strongly disagree”, “Disagree”, “Agree”, to “Strongly agree”.
Tables 16.76 to 16.79 show the item wording and international item parameters for each of the
four scales, respectively.
Table 16.76: Item parameters for Interest in ICT (INTICT)
Table 16.77: Item parameters for Perceived ICT competence (COMPICT)
Table 16.78: Item parameters for Perceived autonomy related to ICT use (AUTICT)
Table 16.79: Item parameters for ICT as a topic in social interaction (SOIAICT)
Subject-related ICT use
The ICT Familiarity Questionnaire also included two questions on the use of digital devices.
IC150 asked about the subject-related use of digital devices during classroom lessons
(ICTCLASS) and IC151 asked about the subject-related use of digital devices outside of
classroom lessons (ICTOUTSIDE). Both questions had five response categories from “No
time”, “1-30 minutes a week”, “31-60 minutes a week”, “More than 60 minutes a week”, to “I
do not study this subject”. For scaling purposes the last category in both questions was recoded
as missing. For ICTCLASS, items IC150Q01HA to IC150Q05HA were used. For
ICTOUTSIDE, items IC151Q01HA to IC151Q05HA were used. Tables 16.80 and 16.81 show
the item wording and international item parameters for each of the two scales, respectively.
Table 16.80: Item parameters for Subject-related ICT use during lessons (ICTCLASS)
Table 16.81: Item parameters for Subject-related ICT use outside of lessons (ICTOUTSIDE)
EDUCATIONAL CAREER QUESTIONNAIRE
The Educational Career Questionnaire (ECQ) is an international option that countries can
choose to implement. It is administered to the PISA students after they have completed the
Student Questionnaire. As the content of the ECQ changes in every cycle, no trend scales were
built for PISA 2018. The ECQ contains five derived variables, three of which are based on IRT
scaling. An overview of all derived variables is shown in Table 16.82, and each of them is
described in the following sections.
Table 16.82: Derived variables in the optional PISA 2018 Educational Career Questionnaire
Simple questionnaire indices
Educational pathways
The Educational Career Questionnaire included questions about the students’ educational
pathways within the school system, asking for information on whether students had ever
changed schools when attending ISCED 1 (EC031) or ISCED 2 (EC032), as well as whether
they had ever changed a study programme (EC033). The respective indicators were recoded to
reflect the number of school changes in EC031 and EC032 (SCCHANGE) and all three
questions report on the number of overall changes in the educational biography (CHANGE).
Derived variables based on IRT scaling
The Educational Career Questionnaire also included two questions about students’ information
on their future perspectives from which a total of three derived variables based on IRT scaling
are constructed. Tables 16.83 and 16.84 contain the scale reliabilities (Cronbach’s Alpha
coefficients) for all participating OECD and partner countries and economies, respectively.
Table 16.83: Scale reliabilities for all derived variables in the Educational Career Questionnaire in OECD countries
Table 16.84: Scale reliabilities for all derived variables in the Educational Career Questionnaire in partner countries and economies
Question EC150 asked about actions a student already took to find out about future study or
types of work such as internships or visiting a job fair providing two response categories
(“Yes”, “No, Never”). For scaling, all ten items were reverse-coded. Table 16.85 shows the
item wording and the international item parameters for INFOCAR.
Table 16.85: Item parameters for Information about careers (INFOCAR)
Question EC151 asked about skills a student has acquired to get information on a job or to
prepare for an interview providing three response categories: “Yes, at school”, “Yes, out of
school”, and “No, never”. Two scaled variables were derived from this question: INFOJOB1
on information about the labour market provided by the school and INFOJOB2 on information
about the labour market provided outside of school. For both scaled variables, all items were
used for scaling. Tables 16.86 and 16.87 show the item wording and international item
parameters for INFOJOB1 and INFOJOB2.
Table 16.86: Item parameters for Information about the labour market provided by the school (INFOJOB1)
Table 16.87: Item parameters for Information about the labour market provided outside of school (INFOJOB2)
FINANCIAL LITERACY QUESTIONNAIRE
The Financial Literacy Questionnaire is an international option that is new to PISA 2018. It
addresses familiarity of students related to financial literacy and their confidence about
financial matters. Five variables were derived from this questionnaire, one non-scaled and four
scaled ones. An overview of all derived variables is shown in table 16.88, and each will be
described in the following sections.
Table 16.88: Derived variables in the optional PISA 2018 Financial Literacy Questionnaire
Simple questionnaire indices
The only non-scaled derived variable in this questionnaire is FCFMLRTY, indicating a
student’s familiarity with concepts of finance. It is constructed as the sum of all 18 items from
question FL164 for which the student responded in category “learned about it, and I know what
it means”.
Derived variables based on IRT scaling
The Financial Literacy Questionnaire provided data for four derived variables based on IRT
scaling which will be presented along with their item content and item parameters in the
following sections. Tables 16.89 and 16.90 contain the scale reliabilities (Cronbach’s Alpha
coefficients) for all participating OECD and partner countries and economies respectively.
Table 16.89: Scale reliabilities for all derived variables in the Financial Literacy Questionnaire in OECD countries
Table 16.90: Scale reliabilities for all derived variables in the Financial Literacy Questionnaire in partner countries and economies
Confidence about financial matters
Two questions in this questionnaire address students’ confidence about financial matters:
FL162 asks about financial matters in general (FLCONFIN) and FL163 asks about financial
matters using digital devices (FLCONICT). Both questions used a four-point Likert scale
ranging from “Not at all confident”, “Not very confident”, “Confident”, to “Very Confident”.
Tables 16.91 and 16.92 show the item wording and international item parameters for
FLCONFIN and FLCONICT, respectively.
Table 16.91: Item parameters for Confidence about financial matters (FLCONFIN)
Table 16.92: Item parameters for Confidence about financial matters using digital devices (FLCONICT)
Financial education in school lessons
FL166 inquired about the frequency of specific financial related activities in financial matters.
The response categories range from “Never”, “Sometimes”, to “Often”. Table 16.93 shows the
item wording and international item parameters for FLSCHOOL.
Table 16.93: Item parameters for Financial education in school lessons (FLSCHOOL)
Parental involvement in matters of Financial Literacy
In FL167 students were asked about the frequency of collaboration with parents in financial
matters. The response categories range from “Never or hardly ever”, “Once or twice a month”,
“Once or twice a week”, to “Almost every day”. Table 16.94 shows the item wording and
international item parameters for FLFAMILY.
Table 16.94: Item parameters for Parental involvement in matters of Financial Literacy (FLFAMILY)
PARENT QUESTIONNAIRE
The Parent Questionnaire is an international option that countries can choose to implement. It
addresses the parents of students participating in the PISA assessment. In PISA 2018, the
Parent Questionnaire provided nine derived variables which will be presented along with their
item content and item parameters in the following sections. One of these scales, JOYREADP,
was mapped to the respective scale used in PISA 2009 so that trend comparison is possible.
All nine derived variables from the Parent Questionnaire were based on IRT scaling. An
overview of all derived variables is shown in Table 16.95, and each will be described in the
following section.
Table 16.95: Derived variables in the optional PISA 2018 Parent Questionnaire
Derived variables based on IRT scaling
Tables 16.96 and 16.97 contain the scale reliabilities (Cronbach’s Alpha coefficients) for all
participating OECD and partner countries and economies, respectively.
Table 16.96: Scale reliabilities for all derived variables in the Parent Questionnaire in OECD countries
Table 16.97: Scale reliabilities for all derived variables in the Parent Questionnaire in partner countries and economies
Current parental support
PISA 2018 measured the current parental support with two questions. PA003 (PISA 2015:
PA003) asked about current parental support for learning at home, including both reading-
specific and general aspects of parental support. The corresponding scale (CURSUPP) consists
of all items in that question. Response categories ranged from “Never or hardly ever”, “Once
or twice a year”, “Once or twice a month”, “Once or twice a week”, to “Every day or almost
every day”. Table 16.98 shows the item wording and international item parameters for
CURSUPP.
Table 16.98: Item parameters for Current parental support for learning at home (CURSUPP)
Another focus in PISA 2018 addressed the emotional support given by parents. Question
PA004 (PISA 2015: PA004) included three items asking parents about their interest and
support for students’ school-related difficulties and achievements. Response categories on a
four-point Likert scale ranged from “Strongly agree”, “Agree”, “Disagree” to “Strongly
disagree”. The scale based on this question, EMOSUPP, consists of all three items. Table 16.99
shows the item wording and international item parameters for EMOSUPP.
Table 16.99: Item parameters for Parents' emotional support (EMOSUPP)
Parental involvement in school
The question addressing both parents’ view on school quality and school policies for parental
involvement (PA007) has been modified for each PISA cycle so far. Parents were asked how
much they agreed with the statements about school policies. The response categories included
“Strongly agree”, “Agree”, “Disagree”, and “Strongly disagree”. The responses had to be
reverse-coded so that higher WLEs and higher difficulty correspond to higher levels of parental
involvement in school.
In PISA 2018, two derived variables were built. The trend indicator PQSCHOOL uses seven
trend items to summarize parents’ perceptions of the quality of school learning (PA007Q01TA,
PA007Q02TA, PA007Q03TA, PA007Q04TA, PA007Q05TA, PA007Q06TA, and
PA007Q07TA). All items were reverse-coded. The same scale was used in PISA 2006, 2009,
2012 and 2015. It was scaled in such a way that a trend comparison is possible between PISA
2009 and 2018. Table 16.100 shows the item wording and international item parameters for
PQSCHOOL.
Table 16.100: Item parameters for Parents' perceived school quality (PQSCHOOL)
The scale addressing parental involvement (PASCHPOL) uses six newly developed items to
measure different aspects of parental participation (PA007Q09NA, PA007Q11NA,
PA007Q12NA, PA007Q13NA, PA007Q14NA, and PA007Q15NA). All items were reverse-
coded. Table 16.101 shows the item wording and international item parameters for
PASCHPOL.
Table 16.101: Item parameters for School policies for parental involvement (PASCHPOL)
Previous parental support
PA154 retrospectively asked how frequently their child engaged in reading-related learning
activities at home when he or she was 10 years old and thus inquired about parents’ support for
reading-related activities in the middle childhood years; examples are telling stories or writing
letters or words. This question originates from PISA 2009 and was revised for PISA 2018. The
response categories ranged from “Never or hardly ever”, “Once or twice a month”, “Once or
twice a week”, to “Every day or almost every day”. The corresponding scale PRESUPP
consists of all ten items of this question, some of which had been used in previous PISA cycles.
Table 16.102 shows the item wording and international item parameters for PRESUPP.
Table 16.102: Item parameters for Previous parental support for learning at home (PRESUPP)
Parents’ reading engagement
The parent questionnaire also included a question on parents’ reading engagement
(JOYREADP, PA158) which is parallel to the Student Questionnaire (ST160) and was adapted
from PISA 2009. To allow for trend comparisons, scaling was conducted based on all four
items of PA06 (2009) and all five items of PA158 (2018), and WLE scores reported for 2018
have been transformed so that they can be directly compared to those reported in PISA 2009.
The response categories range from “Strongly agree”, “Agree”, “Disagree”, to “Strongly
disagree”. All items were used for scaling; items 1, 4 and 5 were reverse-coded for scaling
purposes. Higher WLE scores on this index indicate greater parental motivation to engage in
reading activities. Similarly, positive item difficulties indicate motivational attributes of
parents’ own reading engagement that are less frequent. The item wording and international
parameters for IRT scaling are shown in Table 16.103.
Table 16.103: Item parameters for Parents‘ enjoyment of reading (JOYREADP)
Parents and intercultural attitudes
Two questions addressed parents’ intercultural attitudes: PA167 asked about parents’ attitudes
towards immigrants (ATTIMMP) and PA168 addressed their interest in learning about other
cultures (INTCULP). Both questions are new to PISA.
PA167 has been taken from the International Civic and Citizenship Education Study (ICCS;
see Schulz, Ainley & Fraillon, 2011). The response format is a four-point Likert scale with the
response categories “Strongly disagree”, “Disagree”, “Agree”, and “Strongly agree”. For this
scale, all four items were used. Table 16.104 shows the item wording and international item
parameters for ATTIMMP.
Table 16.104: Item parameters for Parents' attitudes towards immigrants (ATTIMMP)
PA168 uses a five-point Likert scale with the response categories “Very much like me”,
“Mostly like me”, “Somewhat like me”, “Not much like me”, and “Not at all like me”. The
derived IRT-Scale is named INTCULP. Four items were reverse-coded before scaling.
Table 16.105 shows the item wording and international item parameters for INTCULP.
Table 16.105: Item parameters for Parents' interest in learning about other cultures (INTCULP)
Awareness of global issues
The scale GCAWAREP is based on PA170 that queries parents’ awareness of global issues.
This question was partly retained from PISA 2015. However, only the question stem is similar,
all items have been newly developed. The response format is a four-point scale with the
response categories “I have never heard of this”, “I have heard about this but I would not be
able to explain what it is really about”, “I know something about this and could explain the
general issue”, and “I am familiar with this and would be able to explain this well”. Table
16.106 shows the item wording and international parameters for GCAWAREP.
Table 16.106: Item parameters for Parents' awareness of global issues (GCAWAREP)
WELL-BEING QUESTIONNAIRE
The Well-Being Questionnaire is an international option that is new to PISA 2018. It addresses
the well-being of students. Three variables were derived from this questionnaire: One being a
simple index and two resulting from IRT scaling. An overview of all derived variables is shown
in Table 16.107, and each will be described in the following sections.
Table 16.107: Derived variables in the optional PISA 2018 Well-Being Questionnaire
Simple questionnaire indices
The only non-scaled derived variable in the Well-Being Questionnaire is STUBMI, indicating
the student’s body mass index (BMI). It is based on two questions, WB151 and WB152, which
asked about the weight and the height of the student, respectively, in the units of measurement
that are more common in the respective country. The index was constructed as the weight
(transformed to kilograms) divided by the square of the body height (transformed to metres).
Derived variables based on IRT scaling
The Well-Being Questionnaire provided data for two scaled indices which will be presented
along with their item content and item parameters in the following sections. Tables 16.108 and
16.109 contain the scale reliabilities (Cronbach’s Alpha coefficients) for all participating
OECD and partner countries and economies respectively.
Table 16.108: Scale reliabilities for all derived variables in the Well-Being Questionnaire in OECD countries
Table 16.109: Scale reliabilities for all derived variables in the Well-Being Questionnaire in partner countries and economies
Body image
Question WB153 asks about a student’s body image. Answers are given on a four-point Likert
scale with response categories ranging from “Strongly disagree”, “Disagree”, “Agree”, to
“Strongly agree”. An additional response option “I don’t have an opinion” was treated as
missing for the purpose of scaling. All items were reverse-coded before scaling. Table 16.110
shows the item wording and international item parameters for BODYIMA.
Table 16.110: Item parameters for Body image (BODYIMA)
Social connection to parents
Question WB163 captures the student’s social connection to his or her parents. Answers are
given on a three-point Likert scale with response options ranging from “Almost never”,
“Sometimes”, to “Almost always”. Table 16.111 shows the item wording and international
parameters for SOCONPA.
Table 16.111: Item parameters for Social Connections: Parents (SOCONPA)
TEACHER QUESTIONNAIRES
Two versions of the Teacher Questionnaire were implemented in PISA 2018: one administered
to test language teachers, and one administered to all other, non-test language teachers. 48
derived variables have been constructed, 22 of which were scaled using the IRT model
described above. Due to the partial overlap in the two teacher questionnaires, some indices can
be reported for all teachers, others only for test language teachers or only for non-test language
teachers.
An overview of all derived variables is shown in Table 16.112. The table also includes
information as to which of the two versions of the Teacher Questionnaires was used to
administer the question. Each derived variable will be described in the following: the first
section covers all simple questionnaire indices, the second section covers those that are based
on IRT scaling.
Table 16.112: Derived variables in the optional PISA 2018 Teacher Questionnaire
Simple questionnaire indices
Employment status
Question TC005 in the Teacher Questionnaire asked about the employment status of teachers
in terms of full-time or part-time employment (full-time/part-time more than 70%/part-time
more than 50%/part-time 50% or less). It was used to build the derived variable EMPLTIM,
indicating the employment time of teachers.
Teacher education
The Teacher Questionnaire addressed two questions about teachers’ initial education and
professional development. This included a question if a teacher education or training
programme was completed (TC014, yes/no). TC015 asked about how the teacher qualification
was received. Response options included “Standard teacher education or training programme”,
“In-service teacher education or training programme”, “Work-based teacher education or
training programme”, “Training in another pedagogical profession”, or “Other”. These two
questions (TC014, TC015) were used to build the derived variables OTT1 (Originally trained
teachers, broad definition) and OTT2 (Originally trained teachers, strict definition). The strict
definition implies that a teacher had intended to be trained as a teacher from the very beginning
of his or her career and has finished a “standard teacher education or training programme at an
<educational institute which is eligible to educate or train teachers>”. In the less strict
definition, the teacher has finished any of the following three programmes: either a “standard
teacher education or training programme at an <educational institute which is eligible to
educate or train teachers>” (option 1 in TC015), an “in-service teacher education or training
programme” (option 2) or a “work-based teacher education or training programme” (option 3
in TC015).
TC018 enquired about the specific subjects that were included in the teacher’s education or
training programme or other professional qualification and asked if the respondents taught
these subjects to the national modal grade for 15-year olds in the current school year. The
derived variables NTEACH1 to NTEACH 11 reflect whether the teacher was trained to teach
a certain subject. The same question is used to build the derived variables STTMG1 to
STTMG11, indicating the subject-specific overlap between initial education and teaching the
modal grade, i.e. whether a teacher currently teaches a certain subject combined with whether
it was included in the teacher’s initial training.
COBN_T is based on question TC186 which asks about the country a teacher is born in, coded
into the following categories: (1) “Country of test” and (2) “Other country”. COBN_T gives
detailed categories of teachers’ original countries of birth within a country.
Derived variables based on IRT Scaling
The PISA 2018 Teacher Questionnaires provided data for 22 scaled indices which will be
presented along with their item content and item parameters in the following sections. Tables
16.113 and 16.114 contain the scale reliabilities (Cronbach’s Alpha coefficients) for all
participating OECD and partner countries and economies, respectively.
Table 16.113: Scale reliabilities for all derived variables in the Teacher Questionnaire in OECD countries
Table 16.114: Scale reliabilities for all derived variables in the Teacher Questionnaire in partner countries and economies
Educational resources
In parallel to the questions addressing shortage of educational resources in the School
Questionnaire (SC017), teachers were asked whether their school’s capacity to provide
instruction is hindered (TC028) due to staff shortage (TCSTAFFSHORT) or shortage of
educational resources (TCEDUSHORT). The four-point Likert scale ranged from “Not at all”,
“Very little”, to “To some extent”, to “A lot”. Tables 16.115 and 16.116 show the item wording
and international item parameters for TCSTAFFSHORT and TCEDUSHORT, respectively.
Table 16.115: Item parameters for Teacher's view on staff shortage (TCSTAFFSHORT)
Table 16.116: Item parameters for Teacher's view on educational material shortage (TCEDUSHORT)
Teaching and test language teacher collaboration
Test language teacher collaboration (COLT) was assessed asking about teachers’ agreement
on a four-point Likert scale ranging from “Strongly disagree“, “Disagree”, “Agree” to
“Strongly agree” regarding different aspects of cooperation (TC031). In a slightly different
form, with focus on science, this question and scale were part of PISA 2015. Table 16.117
shows the item wording and international item parameters for COLT.
Table 16.117: Item parameters for Test language teacher collaboration (COLT)
TC046 addressed teaching-related co-operation using items like “teaching jointly” or
“exchanging teaching materials”. Teachers were asked to rate these activities with the
following response categories “Never”, “Once a year or less”, “2-4 times a year”, “5-10 times
a year”, “1-3 times a month”, and “Once a week or more”. The derived variable EXCHT
indicates exchange and co-ordination for teaching. Table 16.118 shows the item wording and
international item parameters for EXCHT.
Table 16.118: Item parameters for Exchange and co-ordination for teaching (EXCHT)
Job satisfaction and school leadership
Question TC198 asks about teachers’ job satisfaction. Based on four items each, two scales
were constructed, indicating the teachers’ satisfaction with the current job environment
(SATJOB) and satisfaction with the teaching profession (SATTEACH), respectively. The four-
point Likert scale ranged from “Strongly agree”, “Agree”, “Disagree”, to “Strongly disagree”.
The derived variable “Satisfaction with the current job environment” (SATJOB) was scaled
using the items TC198Q05HA, TC198Q07HA, TC198Q09HA, and TC198Q10HA. The
derived variable “Satisfaction with teaching profession” (SATTEACH) was scaled using the
four items TC198Q01HA, TC198Q02HA, and TC198Q04HA (reverse-coded), TC198Q06HA
(reverse-coded). Tables 16.119 and 16.120 show the item wording and international item
parameters for SATJOB and SATTEACH, respectively.
Table 16.119: Item parameters for Teacher's satisfaction with the current job environment (SATJOB)
Table 16.120: Item parameters for Teacher's satisfaction with teaching profession (SATTEACH)
Teacher self-efficacy
The Teacher Questionnaire also addressed teachers’ self-efficacy (TC199). Three scales are
constructed based on the items in this question: (1) SEFFCM, the teacher’s self-efficacy in
classroom-management; (2) SEFFREL, the teacher’s self-efficacy in maintaining positive
relations with students, and (3) SEFFINS, the teacher’s self-efficacy in instructional settings.
Teachers were asked to rate their agreement with different statements on a four-point Likert
scale with the response options “Not at all”, “To some extent”, “Quite a bit”, and “A lot”.
Tables 16.121 to 16.123 show the item wording and international item parameters for
SEFFCM, SEFFREL and SEFFINS, respectively.
Table 16.121: Item parameters for Teacher's self-efficacy in classroom management (SEFFCM)
Table 16.122: Item parameters for Teacher's self-efficacy in maintaining positive relations with students (SEFFREL)
Table 16.123: Item parameters for Teacher's self-efficacy in instructional settings (SEFFINS)
Reading encouragement
TCOTLCOMP is a new scale in PISA 2018. The scale is based on four items in question TC155
capturing opportunities to learn (OTL) focusing on reading comprehension. It asks about the
frequency of OTL, ranging from “Never or almost never”, “Some lessons”, “Many lessons”,
to “Every lesson or almost every lesson”. Table 16.124 shows the item wording and
international item parameters for TCOTLCOMP.
Table 16.124: Item parameters for Opportunity to learn (OTL) aspects of reading comprehension (TCOTLCOMP)
The Test Language Questionnaire contains two questions on how teachers promote reading
strategies, TC156 and TC157. Two different scales were built from these questions:
TCSTIMREAD on teacher’s stimulation of reading engagement and TCSTRATREAD on
teacher’s initiation of reading strategies. TCSTIMREAD consists of four items addressing
teachers’ stimulation of reading and teaching strategies in the test language lessons. It asks
about the frequency on a four-point Likert scale, ranging from “Never or hardly never”, “In
some lessons”, “In most lessons” to “In all lessons”. TCSTRATREAD consists of four items
addressing the development of students’ reading comprehension skills and strategies initiated
by the teacher. It asks about the frequency on a four-point Likert scale, varying from “Never
or almost never”, “Once or twice a month”, “Once or twice a week”, to “Every day or almost
every day”. Tables 16.125 and 16.126 show the item wording and international item parameters
for TCSTIMREAD and TCSTRATREAD, respectively.
Table 16.125: Item parameters for Teacher's stimulation of reading engagement (TCSTIMREAD)
Table 16.126: Item parameters for Teacher's initiation of reading strategies (TCSTRATREAD)
The scale TCICTUSE measures a teacher’s use of specific ICT applications (TC169). It is
adapted from ICILS 2013. The scale is composed of 14 items (all used for scaling) using a
four-point Likert scale ranging from “Never”, “In some lessons”, “In most lessons”, to “In
every or almost every lesson”. Table 16.127 shows the item wording and international item
parameters for TCICTUSE.
Table 16.127: Item parameters for Teacher's use of specific ICT applications (TCICTUSE)
The scale TCDISCLIMA consists of 5 items asking about the disciplinary classroom climate
in the test language lessons (TC170). Response categories on a four-point Likert scale vary
from “Every lesson”, “Most lessons”, “Some lessons”, to “Never or hardly ever”. This scale is
new to PISA 2018. A parallel question is included in the Student Questionnaire (ST097). Table
16.128 shows the item wording and international item parameters for TCDISCLIMA.
Table 16.128: Item parameters for Disciplinary climate in test language classes (TCDISCLIMA)
The scale TCDIRINS which is new to PISA 2018 is based on four items asking about teachers’
direct instruction in the test language lessons (TC171). Response categories on a four-point
Likert scale vary from “Every lesson”, “Most lessons”, “Some lessons” to “Never or hardly
ever”. A parallel question is included in the Student Questionnaire (ST102). For scaling, all of
the items were reverse-coded. Table 16.129 shows the item wording and international item
parameters for TCDIRINS.
Table 16.129: Item parameters for Direct teacher's instruction (TCDIRINS)
The scale FEEDBACK is based on question TC192 which asks about the frequency in which
the teacher provides different kinds of feedback to students. The items use a four-point Likert
scale ranging from “Never or almost never”, “Some lessons”, “Many lessons”, to “Every lesson
or almost every lesson”. Table 16.130 shows the item wording and international item
parameters for FEEDBACK.
Table 16.130: Item parameters for Feedback provided by the teachers (FEEDBACK)
Adaptive instruction and feedback
The Test Language Questionnaire contained an adapted question with 9 items on situations in
the text language lesson (TC202). Response categories on a four-point Likert scale range from
“Never or almost never”, “Some lessons”, “Many lessons”, to “Every lesson or almost every
lesson”. Two scales were constructed based on the items in this question. The scale
ADAPTINSTR informs about the adaptivity of instruction in the test language lessons. For this
scale, items TC202Q01HA, TC202Q02HA, TC202Q03HA and TC202Q04HA were used. The
FEEDBINSTR in the questionnaire for test language teachers is the same as the FEEDBACK
in the questionnaire for general teachers. FEEDBINSTR is based on items TC202Q05HA,
TC202Q06HA, TC202Q07HA, TC202Q08HA and TC202Q09HA. Tables 16.131 and 16.132
show the item wording and international item parameters for ADAPTINSTR and
FEEDBINSTR, respectively.
Table 16.131: Item parameters for Adaptivity of instruction in test language lessons (ADAPTINSTR)
Table 16.132: Item parameters for Feedback provided by the teachers (FEEDBINSTR)
Teachers and multiculturalism
In the Teacher Questionnaire, there were four questions addressing multiculturalism resulting
in four scales on this topic: TCATTIMM (TC196) on teachers’ attitudes toward equal rights
for immigrants, GCTRAIN (TC206) on whether a teacher has received training/education to
teach effectively in multicultural environments, TCMCEG on teachers’ multicultural and
egalitarian beliefs (TC208), GCSELF on teachers’ self-efficacy in multicultural environments
(TC209).
Question TC196 is new to PISA 2018. It is comparable to questions of the International Civic
and Citizenship Education Study (ICSS) (see Schulz, Ainley & Fraillon, 2011). The response
format is a
four-point Likert scale with the response categories “Strongly disagree”, “Disagree”, “Agree”,
“Strongly Agree”. TCATTIMM is based on all four items in TC196. Table 16.133 shows the
item wording and international item parameters for TCATTIMM.
Table 16.133: Item parameters for Teacher's attitudes towards immigrants (TCATTIMM)
Question TC206 is new to PISA 2018. The response format is dichotomous with the response
categories “Yes” and “No”. GCTRAIN is based on all five items in TC206 which have been
reverse-coded before scaling. Table 16.134 shows the item wording and international item
parameters for GCTRAIN.
Table 16.134: Item parameters for Teacher's training on global competence (GCTRAIN)
Question TC208 was adapted from Hachfeld, Hahn, Schroeder, Anders, Stanat and Kunter
(2011). In the PISA 2018 version of this question, teachers are asked to what extent the
statements in the items reflect an opinion shared among their colleagues. The response format
is a four-point Likert scale with options ranging from “Shared among none or almost none of
the teachers”, “Shared among some of the teachers”, “Shared among many of the teachers”, to
“Shared among all or almost all of the teachers”. The original scale is two-dimensional.
However, the two intended dimensions “Multicultural beliefs” and “Egalitarian beliefs” could
not be separated empirically with the PISA 2018 Field Test data. As a result, the scale was
shortened to consist of only four items that proved to be one-dimensional (TCMCEG) while
covering both facets of the original instrument. Table 16.135 shows the item wording and
international item parameters for TCMCEG.
Table 16.135: Item parameters for Teachers' multicultural and egalitarian beliefs (TCMCEG)
Question TC209 is new to PISA 2018. It provides information about a teacher’s self-efficacy
in multicultural environments. It is adapted from a scale developed by Schachner (2014). The
response format is a four-point Likert-scale with the response categories “Strongly disagree”,
“Disagree”, “Agree”, “Strongly agree”. Table 16.136 shows the item wording and international
item parameters for GCSELF.
Table 16.136: Item parameters for Teacher's self-efficacy in multicultural environments (GCSELF)
THE PISA INDEX OF ECONOMIC, SOCIAL AND CULTURAL STATUS (ESCS)
Computation of ESCS
The ESCS is a composite score based on three indicators: highest parental occupation (HISEI),
parental education (PAREDINT), and home possessions (HOMEPOS) including books in the
home (see description of these three derived variables above). The rationale for using these
three components was that the socio-economic status has usually been seen as based on
education, occupational status and income. As no direct income measure has been available
from the PISA data, the existence of household items has been used as a proxy for family
wealth. Figure 16.4 provides a schematic representation of the ESCS and its indicators.
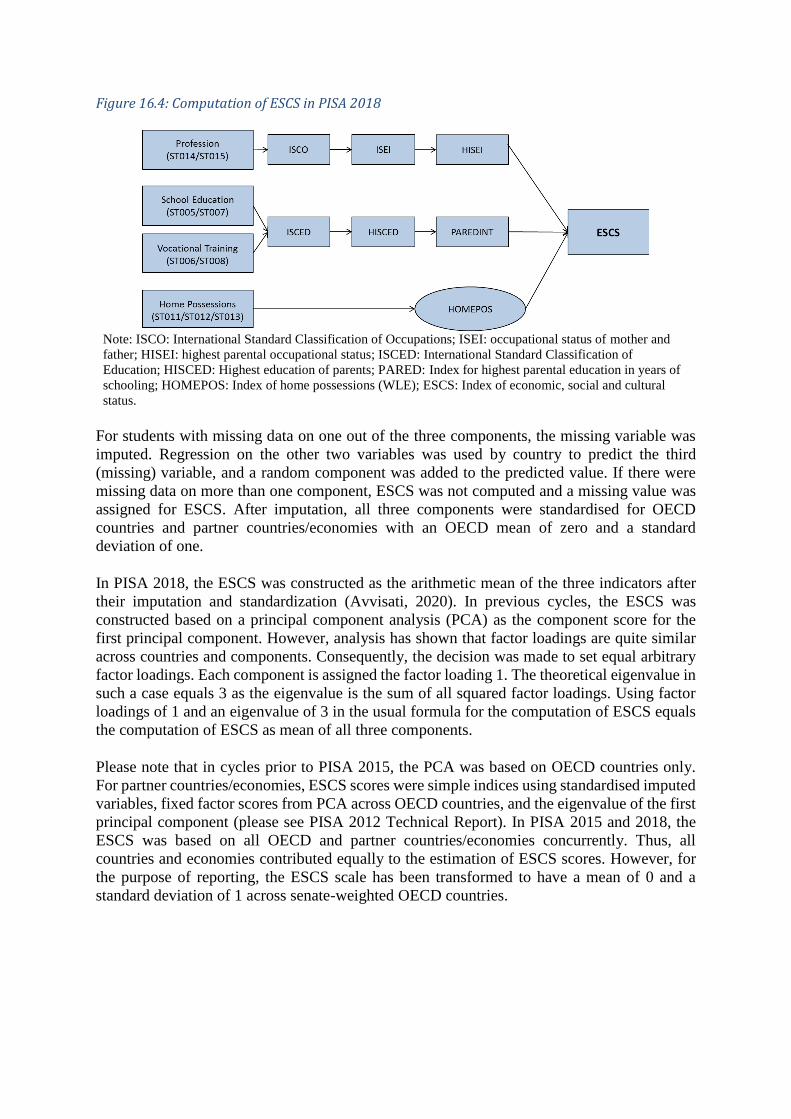
Figure 16.4: Computation of ESCS in PISA 2018
Note: ISCO: International Standard Classification of Occupations; ISEI: occupational status of mother and
father; HISEI: highest parental occupational status; ISCED: International Standard Classification of
Education; HISCED: Highest education of parents; PARED: Index for highest parental education in years of
schooling; HOMEPOS: Index of home possessions (WLE); ESCS: Index of economic, social and cultural
status.
For students with missing data on one out of the three components, the missing variable was
imputed. Regression on the other two variables was used by country to predict the third
(missing) variable, and a random component was added to the predicted value. If there were
missing data on more than one component, ESCS was not computed and a missing value was
assigned for ESCS. After imputation, all three components were standardised for OECD
countries and partner countries/economies with an OECD mean of zero and a standard
deviation of one.
In PISA 2018, the ESCS was constructed as the arithmetic mean of the three indicators after
their imputation and standardization (Avvisati, 2020). In previous cycles, the ESCS was
constructed based on a principal component analysis (PCA) as the component score for the
first principal component. However, analysis has shown that factor loadings are quite similar
across countries and components. Consequently, the decision was made to set equal arbitrary
factor loadings. Each component is assigned the factor loading 1. The theoretical eigenvalue in
such a case equals 3 as the eigenvalue is the sum of all squared factor loadings. Using factor
loadings of 1 and an eigenvalue of 3 in the usual formula for the computation of ESCS equals
the computation of ESCS as mean of all three components.
Please note that in cycles prior to PISA 2015, the PCA was based on OECD countries only.
For partner countries/economies, ESCS scores were simple indices using standardised imputed
variables, fixed factor scores from PCA across OECD countries, and the eigenvalue of the first
principal component (please see PISA 2012 Technical Report). In PISA 2015 and 2018, the
ESCS was based on all OECD and partner countries/economies concurrently. Thus, all
countries and economies contributed equally to the estimation of ESCS scores. However, for
the purpose of reporting, the ESCS scale has been transformed to have a mean of 0 and a
standard deviation of 1 across senate-weighted OECD countries.
REFERENCES
Avvisati, F. (2020), The Measure of Socio-Economic Status in PISA: a Review and Some Suggested
Improvements, Large-scale Assessments in Education, https://doi.org/10.1186/s40536-020-00086-x.
Avvisati, F., Le Donné, N., & Paccagnella (2019). A meeting report: cross-cultural comparability of
questionnaire measures in large-scale international surveys. Measurement Instruments for the Social
Sciences, 1-8. doi: 10.1186/s42409-019-0010-z.
Bempechat, J., Jimenez, N. V., & Boulay B. A. (2002). Cultural-cognitive issues in academic
achievement: New directions for cross-national research. In A. C. Porter & A. Gamoran (eds.),
Methodological Advances in Cross-National Surveys of Educational Achievement, National Academic
Press, Washington, D.C.
Buchholz, J. & Hartig, J. (2018). Comparing Attitudes Across Groups: An IRT-Based Item-Fit
Statistic for the Analysis of Measurement Invariance. Applied Psychological Measurement, 43(3),
241-250.
Buckley, J. (2009). Cross-national response styles in international educational assessments: Evidence
from PISA 2006. https://edsurveys.rti.org/PISA/documents/Buckley_PISAresponsestyle.pdf
Davis, M. H. (1983). The effects of dispositional empathy on emotional reactions and helping: A
multidimensional approach. Journal of personality, 51(2), 167-184.
Dennis, J. P., & Vander Wal, J. S. (2010). The cognitive flexibility inventory: Instrument
development and estimates of reliability and validity. Cognitive therapy and research, 34(3), 241-253.
Ganzeboom, H.B.G. & Treiman, D.J. (2003). Three internationally standardised measures for
comparative research on occupational status. In J.H.P. Hoffmeyer-Zlotnik & C. Wolf (eds.), Advances
in cross-national comparison, A European Working Book for Demographic and Socio-Economic
Variables, 159-193, Kluwer Academic Press, New York.
Glas, C. A. W. & Jehangir, K. (2014). Modeling country-specific differential item functioning. In
L. Rutkowski, M. von Davier & D. Rutkowski (eds.), Handbook of International Large-Scale
Assessment: Background, Technical Issues and Methods of Data Analysis, 97-115, Springer, New
York.
Hachfeld, A., Hahn, A., Schroeder, S., Anders, Y., Stanat, P., & Kunter, M. (2011). Assessing
teachers’ multicultural and egalitarian beliefs: the teacher cultural beliefs scale. Teaching and Teacher
education, 27(6), 986-996.
International Labour Office (2012). International standard classification of occupations, ISCO-08,
www.ilo.org/public/english/bureau/stat/isco/
Martin, M. M. & Rubin, R. B. (1995). A new measure of cognitive flexibility. Psychological reports,
76(2), 623-626.
Masters, G. N. & Wright, B. D. (1997). The partial credit model. In W. J. van der Linden & R. K.
Hambleton (eds.), Handbook of modern item response theory, Springer, New York.
Muraki, E. (1992). A generalized partial credit model: Application of an EM algorithm. ETS Research
Report Series, Vol. 1992/1, i-30.
OECD (2017). PISA 2015 assessment and analytical framework: Science, reading, mathematic,
financial literacy and collaborative problem solving. OECD Publishing, Paris.
http://dx.doi.org/10.1787/9789264281820-en.
OECD (2014). PISA 2012 Technical Report, PISA. OECD publishing, Paris.
OECD (1999). Classifying Educational Programmes: Manual for ISCED-97 Implementation in
OECD Countries, OECD Publishing, Paris. http://www.oecd.org/education/skills-beyond-
school/1962350.pdf
OECD (2018). Global competency for an inclusive world. Paris: OECD Publishing.
https://www.oecd.org/education/Global-competency-for-an-inclusive-world.pdfs
Penfield, R. D., Myers, N. D. & Wolfe, E. W. (2008). Methods for assessing item, step, and threshold
invariance in polytomous items following the partial credit model. Educational and Psychological
Measurement, 68, 717-733.
Rasch, G. (1960). Probabilistic models for some intelligence and attainment tests, Nielsen and
Lydiche, Copenhagen, Denmark.
Schachner, M. (2014). Contextual conditions for acculturation and school-related outcomes of early
adolescent immigrants in Germany. PhD thesis (University of Jena and Tilburg University).
Schulz, W., Ainley, J., & Fraillon. J. (Eds.) (2011). ICCS 2009 technical report. Amsterdam, the
Netherlands: International Association for the Evaluation of Educational Achievement (IEA).
von Davier, M. (2005). mdltm: Software for the general diagnostic model and for estimating mixtures
of multidimensional discrete latent traits models [Computer software]. Princeton, NJ: ETS.
Warm, T. A. (1989). Weighted likelihood estimation of ability in item response theory,
Psychometrika, Vol. 54, 427-450.