Embed Size (px)
Citation preview
Chapter 16: Statistics
Lesson 1: Types of Statistical Studies
Lesson 2: Population Parameters
Lesson 3: The Normal Distribution
Lesson 4: More Practice with Normal Distribution
Lesson 5: Margin of Error
Lesson 6: Statistically Significant
Lesson 7: Linear Regressions
Lesson 8: Other Types of Regressions
This assignment is a teacher-modified version of Chapter 13 Statistics Copyright (c) 2016 eMath
Instruction, LLC used by permission.
Chapter 16: Statistics
Lesson 1
Types of Statistical Studies
Bias and Random Sampling:
A _____________________ is a subset of the entire population. Many times it is not cost-
effective or productive to gather information from an entire population. When this is the case,
a sample is used. It is important that a sample is representative of the entire population.
In statistics, it is important to determine if the information that is presented is
______________, data used in the sample comes from sources that have a particular interest in
the impact of the statistics. When this is the case, the sample is not representative of the
general population, it is said to be biased or skewed.
To avoid a bias, it is important to select subjects randomly.
A sample population is considered to be random if every object has the same probability of
being chosen.
Types of Statistical Studies
1.) Survey: Asks a group of people to _________________ to questions. An example of this
would be a poll. A survey is also a type of observational study.
A census is a type of survey in which an attempt is made to reach the entire
_____________________.
2.) Observational Study: The sample population being studied is measured, or surveyed, as it is.
The researcher observes the subjects and measures variables, but _________________
influence the population in any way or attempt to intervene in the study. Data is simply
gathered and correlations are investigated. Since these studies do not control any variable, the
results can only allow for _______________, not __________________ - you cannot come up
with a cause-and-effect conclusion.
3.) Experiment: Unlike an observational study, an experimental study has the researcher
purposely attempt to ________________ the results. The goal is to determine what effect a
particular treatment has on the outcome. Here, the researcher __________________ the
sample population in some manner. Since variables are controlled in a designed experiment,
the results allow a researcher to claim __________________ - a cause-and-effect conclusion.
(a) A controlled experiment is an experiment in which a sample is divided into groups. All
groups are __________________ in some manner, except for the _________________
group - this group will remain the same.
(b) In a randomized experiment, a researcher controls the _____________________ of the
sample through random methods - like flipping a coin. ___________________ is
important so the researcher can know that it was the treatment given to the population
that caused a change.
Examples:
Complete the questions below.
1.) A doctor wants to test the effectiveness of a new drug on her patients. She separates her
sample of patients into two groups and administers the drug to only one of these groups. She
then compares the results. Which type of study best describes this situation?
(1) census (3) observation
(2) survey (4) controlled experiment
2.) In which method of data collection does the researcher intentionally intervene to arrange
for a comparison of results?
(1) taking a survey (3) filling out a questionnaire
(2) making observations (4) conducting a controlled experiment
3.) Which statement about statistical analysis is false?
(1) Experiments can suggest patterns and relationships in data.
(2) Experiments can determine cause and effect relationships.
(3) Observational studies can determine cause and effect relationships.
(4) Observational studies can suggest patterns and relationships in data.
4.) Describe how a controlled experiment can be created to examine the effect of ingredient X
in a toothpaste.
5.) Howard collected fish eggs from a pond behind his house so he could determine whether
sunlight had an effect on how many of the eggs hatched. After he collected the eggs, he divided
them into two tanks. He put both tanks outside near the pond, and he covered one of the tanks
with a box to block out all sunlight. State whether Howard's investigation was an example of a
controlled experiment, an observation, or a survey. Justify your response.
6.) Which task is not a component of an observational study?
(1) The researcher decides who will make up the sample.
(2) The researcher analyzes the data received from the sample.
(3) The researcher gathers data from the sample, using surveys or taking measurements.
(4) The researcher divides the sample into two groups, with one group acting as a
control group.
7.) Four surveys are described below. Which survey methodology would lead to the least
biased?
(1) One hundred randomly chose heart surgeons were polled by telephone about how
to get children to eat healthier foods.
(2) A country and western radio station asked one hundred of its listeners to call a
telephone number and answer a question about rap music.
(3) From calls made to one hundred randomly generated telephone numbers, people
replied to a question about shows they watch.
(4) The first one hundred people who left the World of Baseball Bookstore replied to a
question about the importance of baseball to society.
8.) Which of these questions is a biased question?
(1) Do you prefer yogurt or pudding for dessert?
(2) Do you prefer to sit on the couch and watch TV or do you like to exercise and stay in
shape?
(3) What sport do you play?
(4) What is your favorite food?
9.) Housing standards in Portland doubled one year. A builder draws a graph showing the
outline of a house 2 cm by 3 cm for the first year and one 4 cm by 6 cm for the second year.
Why is the graph misleading?
Chapter 16: Statistics
Lesson 1: Homework
Types of Statistical Studies
Complete all questions below.
1.) Which statement(s) about statistical studies is true?
I. A survey of all English classes in a high school would be a good sample to
determine the number of hours students throughout the school spending
studying.
II. A survey of all ninth graders in a high school would be a good sample to
determine the number of student parking spaces needed at that high school.
III. A survey of all students in one lunch period in a high school would be a good
sample to determine the number of hours adults spend on social media
websites.
IV. A survey of all Calculus students in a high school would be a good sample to
determine the number of students throughout the school who don’t l ike math.
(1) I, only (2) II, only (3) I and III (4) III and IV
2.) A principal is concerned about the decline in the number of students who purchase food
from the cafeteria. A survey was developed to assist the principal. The most appropriate
method would be for the principal to randomly select 100 students from
(1) the junior class (3) the student directory
(2) the Algebra 2/Trigonometry classes (4) the students who are eating during
fourth period lunch in the cafeteria
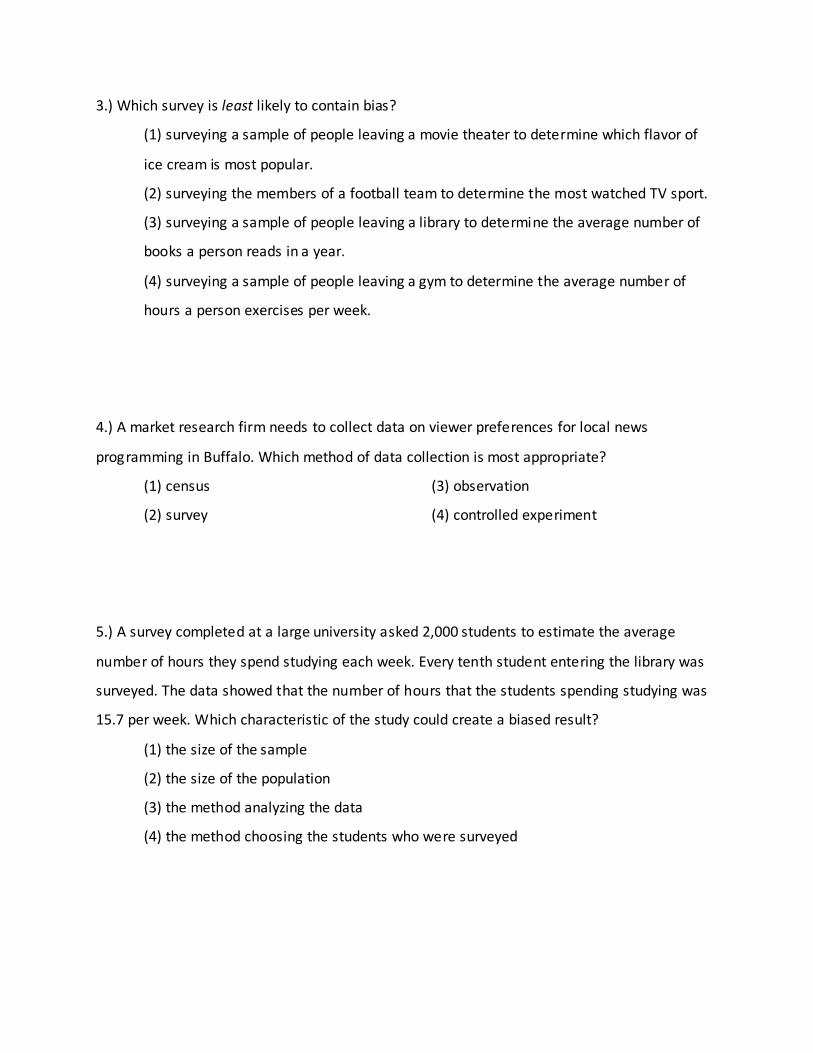
3.) Which survey is least likely to contain bias?
(1) surveying a sample of people leaving a movie theater to determine which flavor of
ice cream is most popular.
(2) surveying the members of a football team to determine the most watched TV sport.
(3) surveying a sample of people leaving a library to determine the average number of
books a person reads in a year.
(4) surveying a sample of people leaving a gym to determine the average number of
hours a person exercises per week.
4.) A market research firm needs to collect data on viewer preferences for local news
programming in Buffalo. Which method of data collection is most appropriate?
(1) census (3) observation
(2) survey (4) controlled experiment
5.) A survey completed at a large university asked 2,000 students to estimate the average
number of hours they spend studying each week. Every tenth student entering the library was
surveyed. The data showed that the number of hours that the students spending studying was
15.7 per week. Which characteristic of the study could create a biased result?
(1) the size of the sample
(2) the size of the population
(3) the method analyzing the data
(4) the method choosing the students who were surveyed
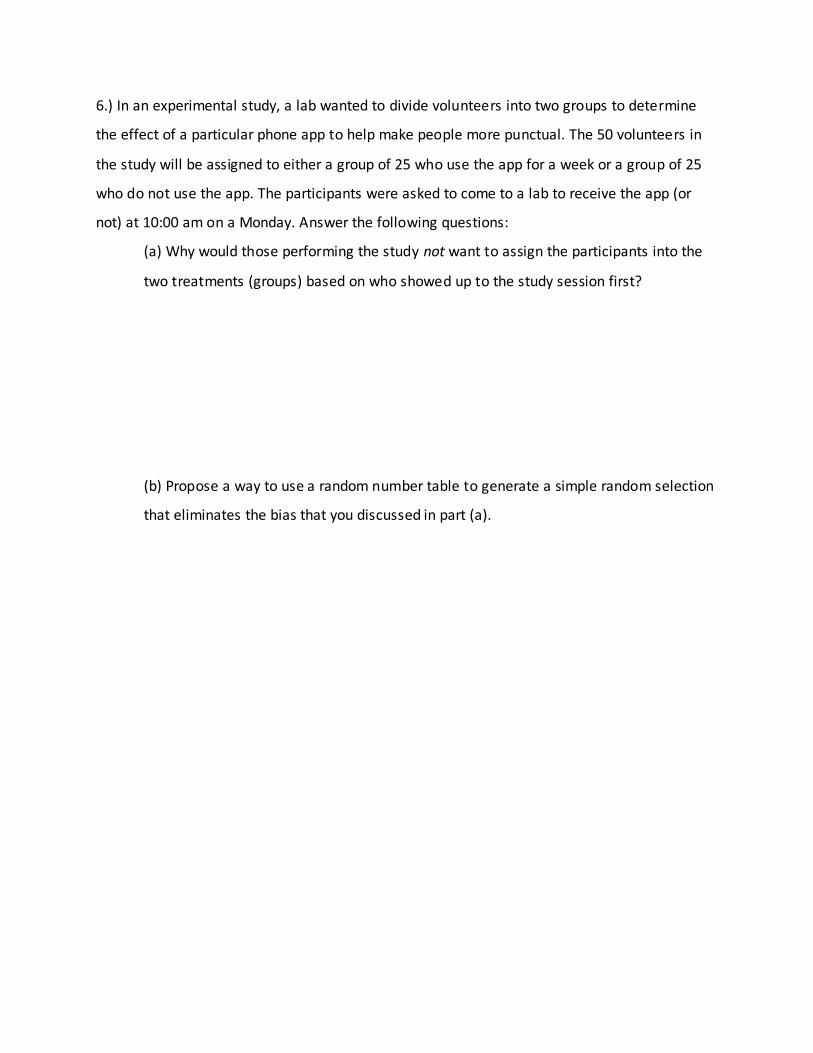
6.) In an experimental study, a lab wanted to divide volunteers into two groups to determine
the effect of a particular phone app to help make people more punctual. The 50 volunteers in
the study will be assigned to either a group of 25 who use the app for a week or a group of 25
who do not use the app. The participants were asked to come to a lab to receive the app (or
not) at 10:00 am on a Monday. Answer the following questions:
(a) Why would those performing the study not want to assign the participants into the
two treatments (groups) based on who showed up to the study session first?
(b) Propose a way to use a random number table to generate a simple random selection
that eliminates the bias that you discussed in part (a).
Chapter 16: Statistics
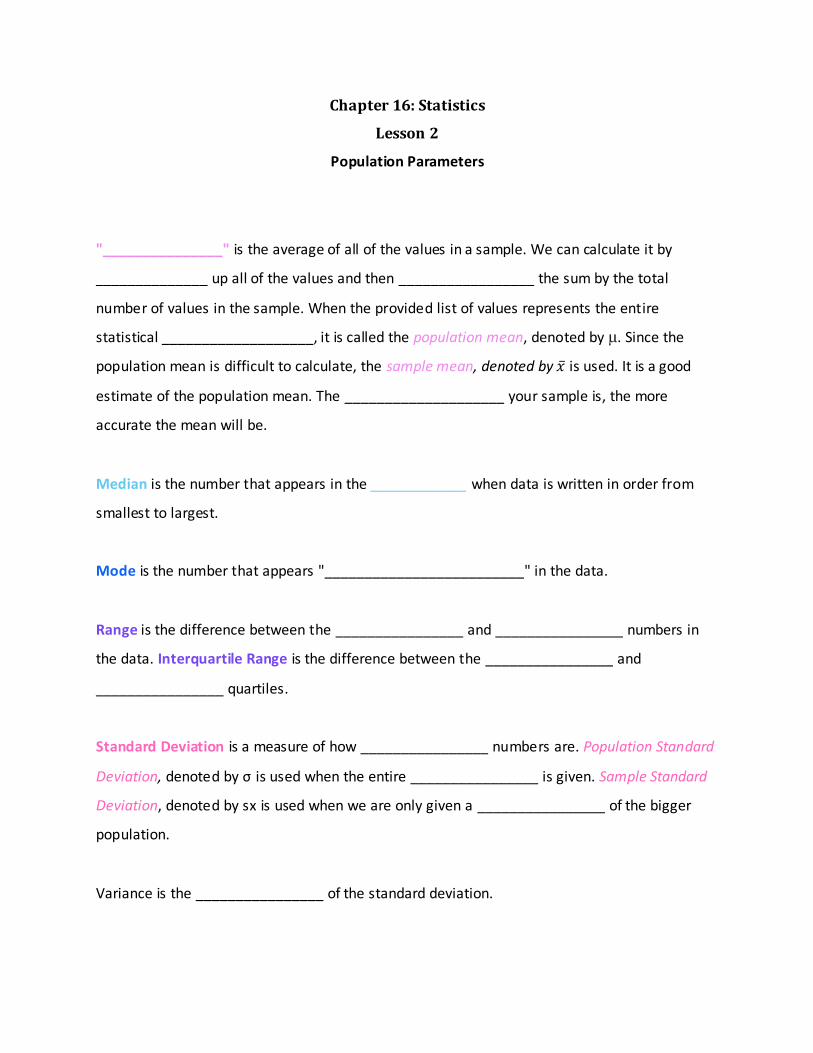
Lesson 2
Population Parameters
"_______________" is the average of all of the values in a sample. We can calculate it by
______________ up all of the values and then _________________ the sum by the total
number of values in the sample. When the provided list of values represents the entire
statistical ___________________, it is called the population mean, denoted by µ. Since the
population mean is difficult to calculate, the sample mean, denoted by is used. It is a good
estimate of the population mean. The ____________________ your sample is, the more
accurate the mean will be.
Median is the number that appears in the ____________ when data is written in order from
smallest to largest.
Mode is the number that appears "_________________________" in the data.
Range is the difference between the ________________ and ________________ numbers in
the data. Interquartile Range is the difference between the ________________ and
________________ quartiles.
Standard Deviation is a measure of how ________________ numbers are. Population Standard
Deviation, denoted by σ is used when the entire ________________ is given. Sample Standard
Deviation, denoted by sx is used when we are only given a ________________ of the bigger
population.
Variance is the ________________ of the standard deviation.
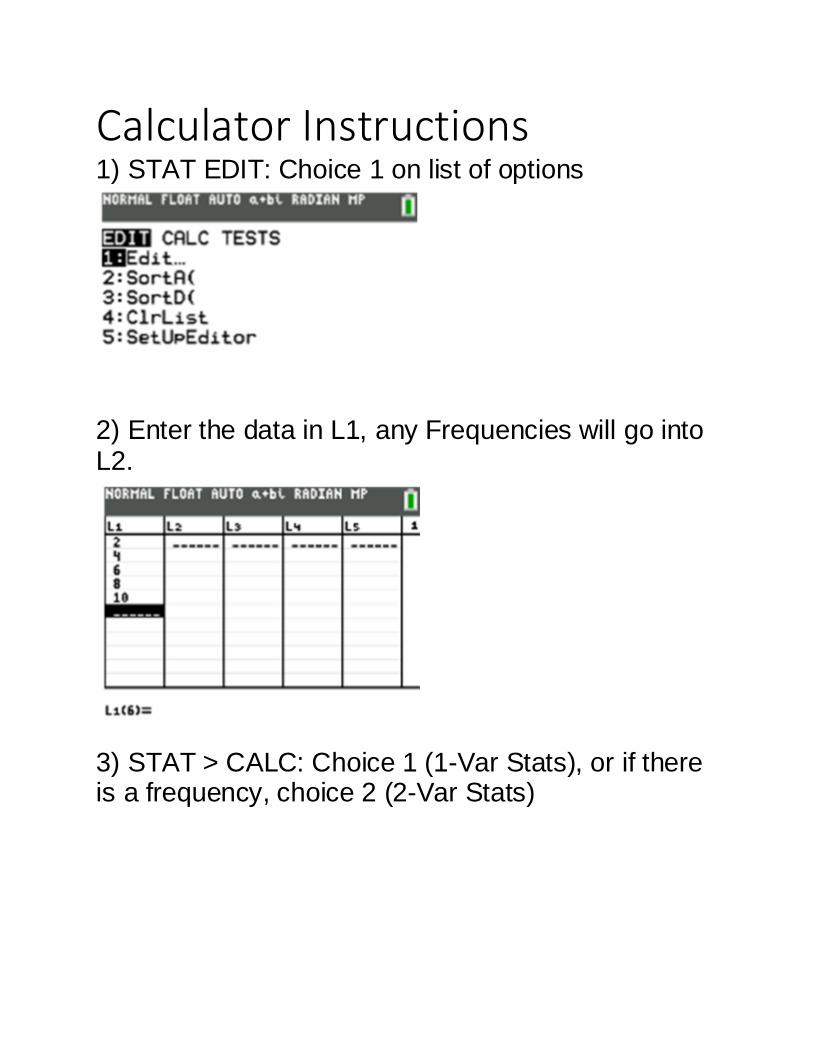
Calculator Instructions
1) STAT EDIT: Choice 1 on list of options
2) Enter the data in L1, any Frequencies will go into L2.
3) STAT > CALC: Choice 1 (1-Var Stats), or if there is a frequency, choice 2 (2-Var Stats)
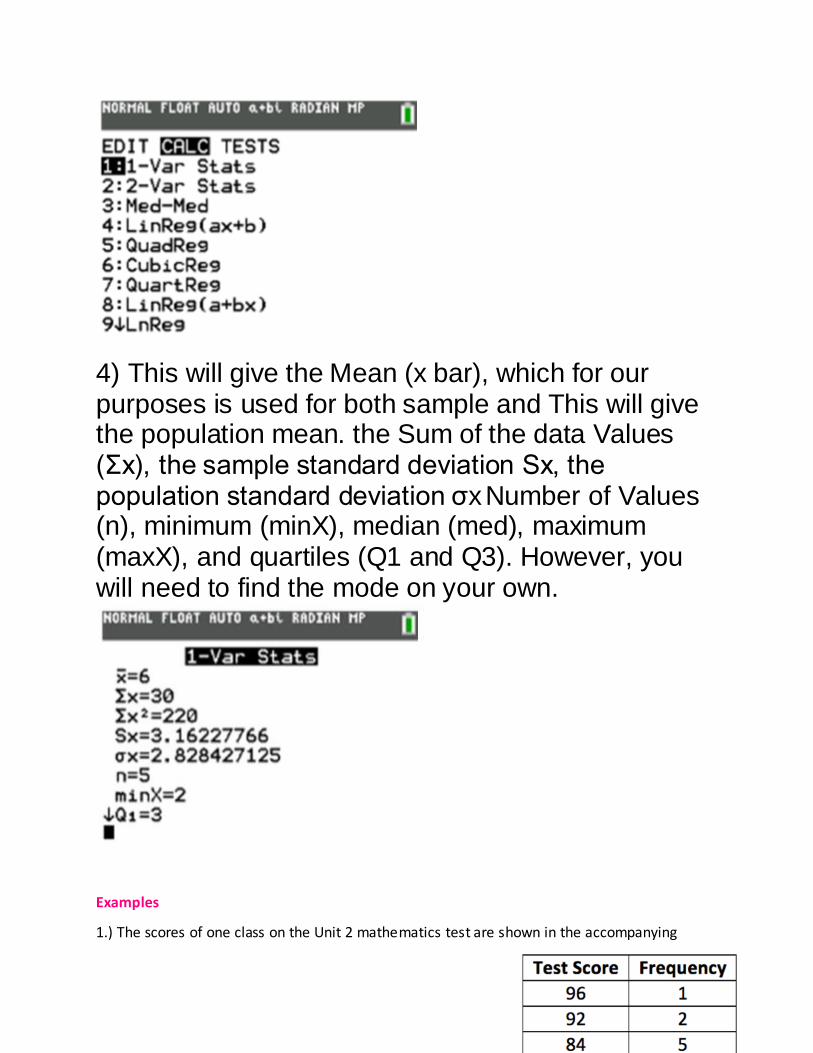
4) This will give the Mean (x bar), which for our purposes is used for both sample and This will give the population mean. the Sum of the data Values (Σx), the sample standard deviation Sx, the population standard deviation σx Number of Values (n), minimum (minX), median (med), maximum (maxX), and quartiles (Q1 and Q3). However, you will need to find the mode on your own.
Examples
1.) The scores of one class on the Unit 2 mathematics test are shown in the accompanying
table. (a) What is the interquartile range?
(b) Find the population standard deviation of these scores, to the
nearest tenth.
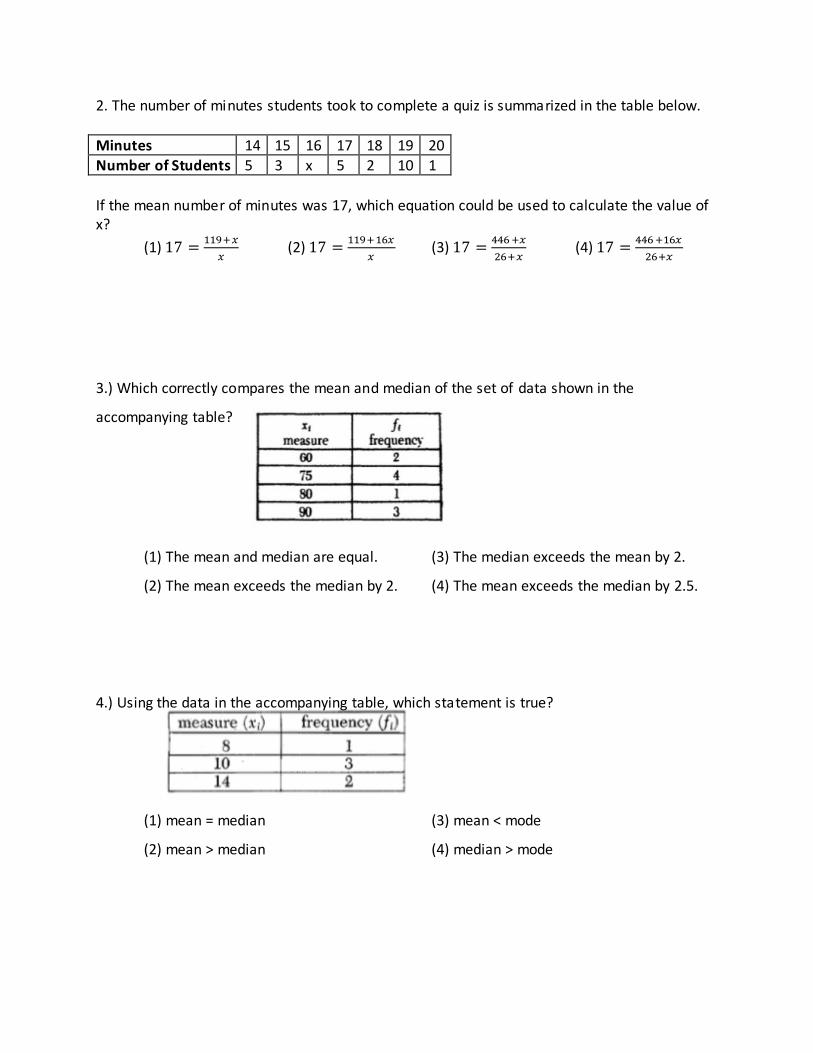
2. The number of minutes students took to complete a quiz is summarized in the table below.
Minutes 14 15 16 17 18 19 20
Number of Students 5 3 x 5 2 10 1
If the mean number of minutes was 17, which equation could be used to calculate the value of x?
(1)
(2)
(3)
(4)
3.) Which correctly compares the mean and median of the set of data shown in the
accompanying table?
(1) The mean and median are equal. (3) The median exceeds the mean by 2.
(2) The mean exceeds the median by 2. (4) The mean exceeds the median by 2.5.
4.) Using the data in the accompanying table, which statement is true?
(1) mean = median (3) mean < mode
(2) mean > median (4) median > mode
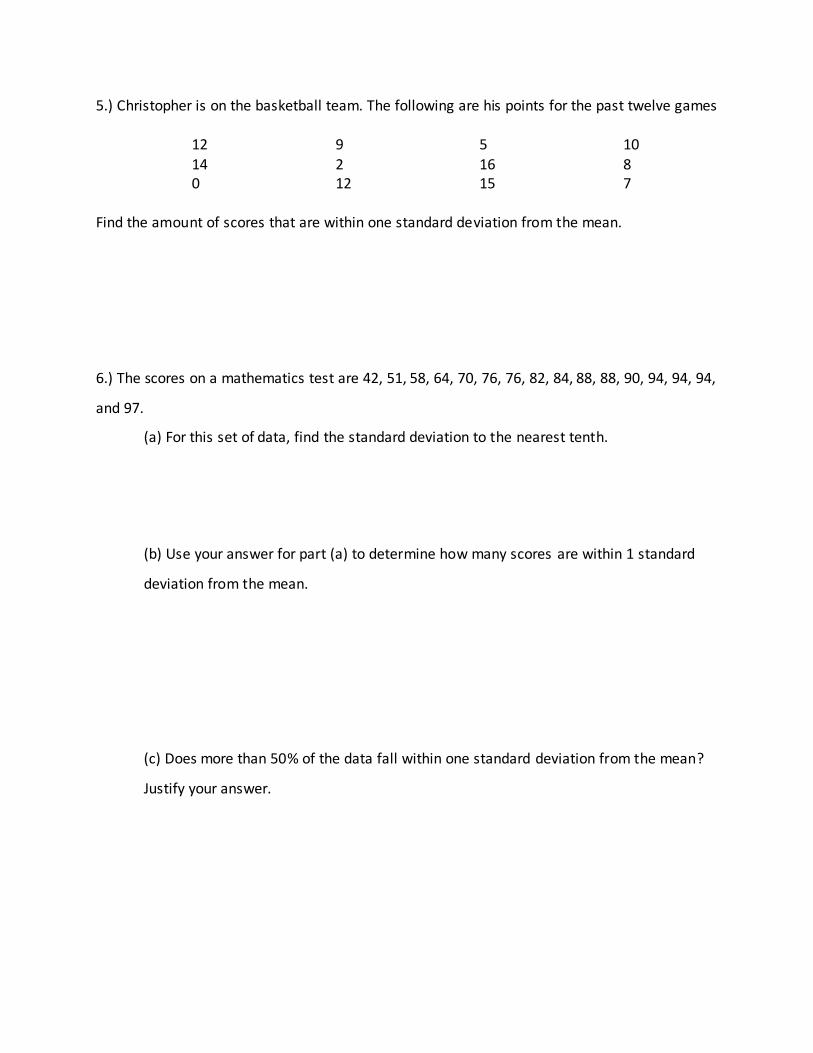
5.) Christopher is on the basketball team. The following are his points for the past twelve games
12 9 5 10
14 2 16 8 0 12 15 7
Find the amount of scores that are within one standard deviation from the mean.
6.) The scores on a mathematics test are 42, 51, 58, 64, 70, 76, 76, 82, 84, 88, 88, 90, 94, 94, 94,
and 97.
(a) For this set of data, find the standard deviation to the nearest tenth.
(b) Use your answer for part (a) to determine how many scores are within 1 standard
deviation from the mean.
(c) Does more than 50% of the data fall within one standard deviation from the mean?
Justify your answer.
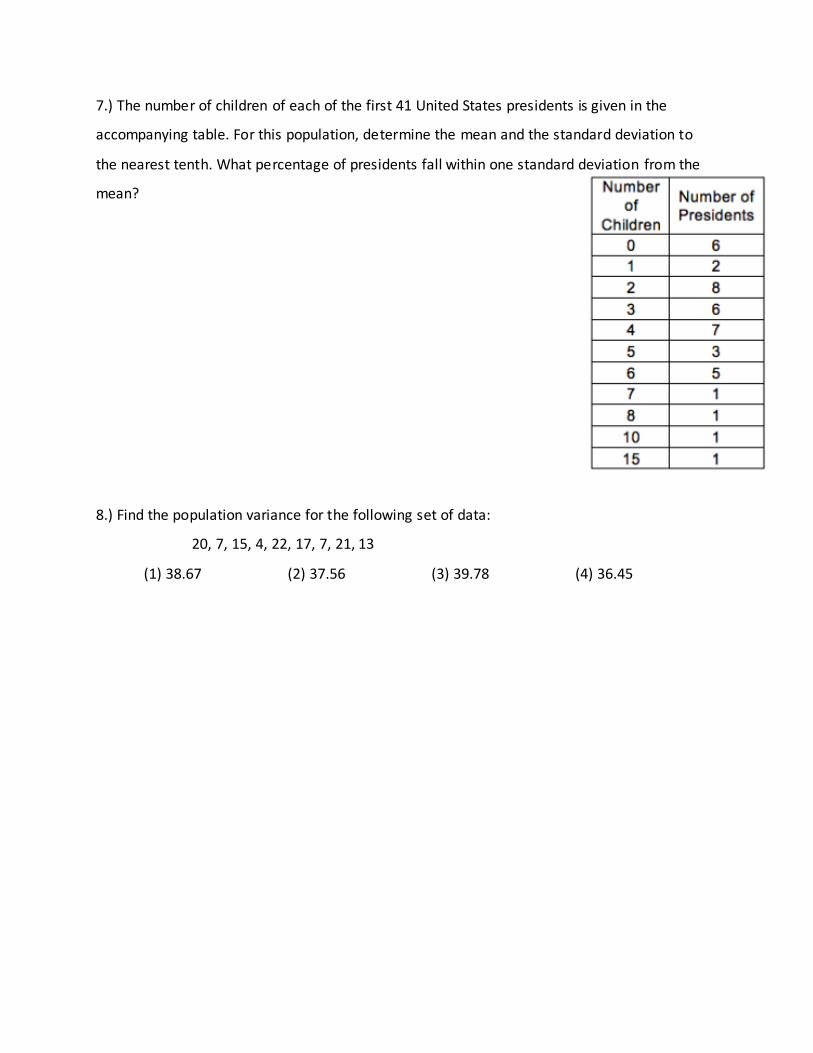
7.) The number of children of each of the first 41 United States presidents is given in the
accompanying table. For this population, determine the mean and the standard deviation to
the nearest tenth. What percentage of presidents fall within one standard deviation from the
mean?
8.) Find the population variance for the following set of data:
20, 7, 15, 4, 22, 17, 7, 21, 13
(1) 38.67 (2) 37.56 (3) 39.78 (4) 36.45
Chapter 16: Statistics
Lesson 2: Homework
Population Parameters
Complete the questions below. Show all work, when necessary.
1.) Julie averaged 85 on the first three tests of the semester in her mathematics class. If she
scores 93 on each of the remaining tests, her average will be a 90. Which equation could be
used to determine how many tests, T, are left in the semester?
(1)
(2)
(3)
(4)
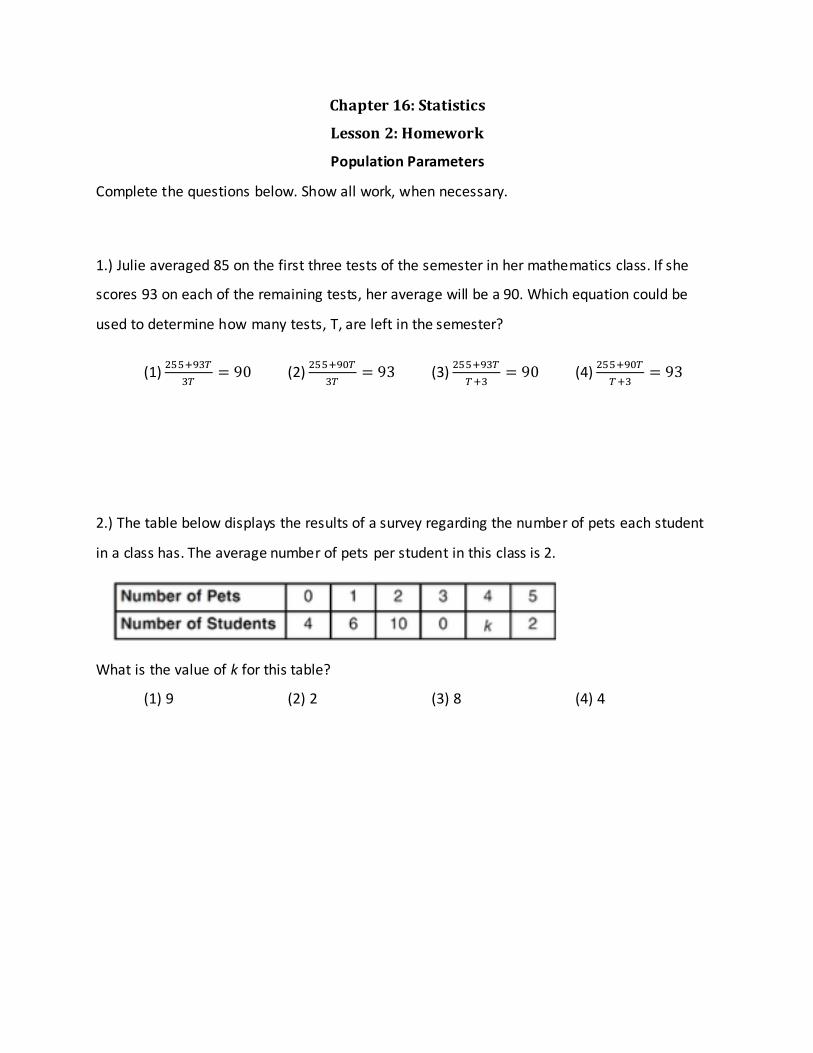
2.) The table below displays the results of a survey regarding the number of pets each student
in a class has. The average number of pets per student in this class is 2.
What is the value of k for this table?
(1) 9 (2) 2 (3) 8 (4) 4
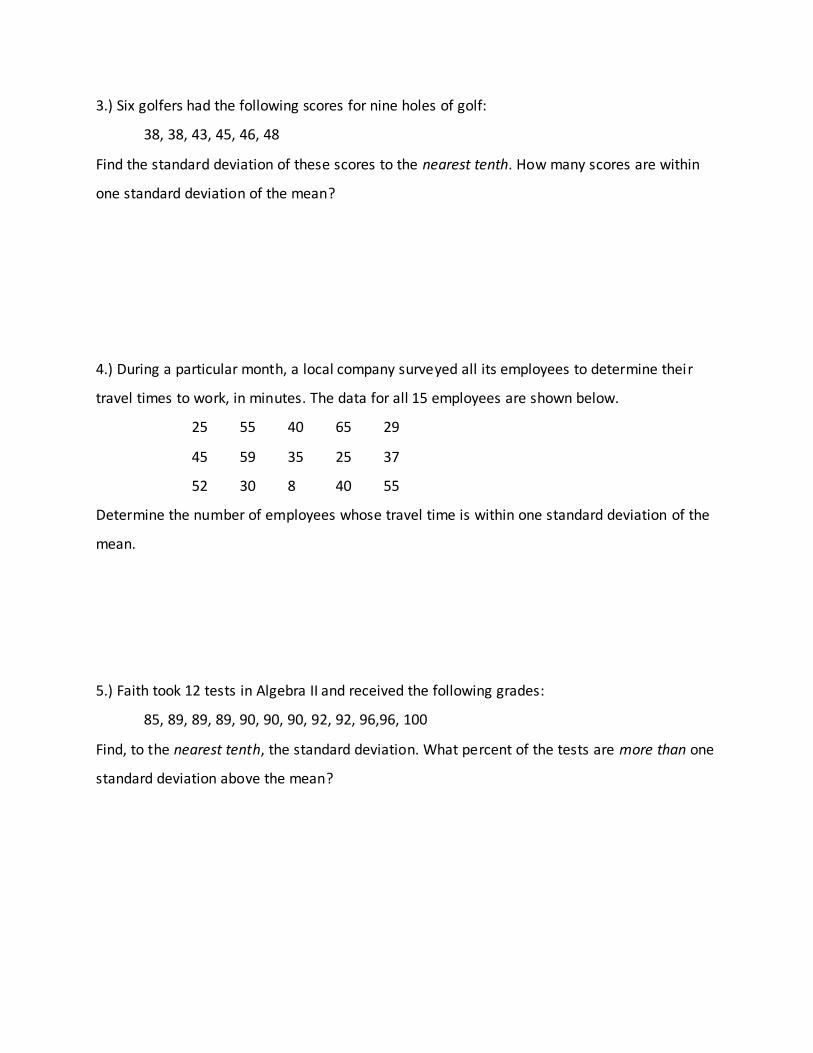
3.) Six golfers had the following scores for nine holes of golf:
38, 38, 43, 45, 46, 48
Find the standard deviation of these scores to the nearest tenth. How many scores are within
one standard deviation of the mean?
4.) During a particular month, a local company surveyed all its employees to determine their
travel times to work, in minutes. The data for all 15 employees are shown below.
25 55 40 65 29
45 59 35 25 37
52 30 8 40 55
Determine the number of employees whose travel time is within one standard deviation of the
mean.
5.) Faith took 12 tests in Algebra II and received the following grades:
85, 89, 89, 89, 90, 90, 90, 92, 92, 96,96, 100
Find, to the nearest tenth, the standard deviation. What percent of the tests are more than one
standard deviation above the mean?
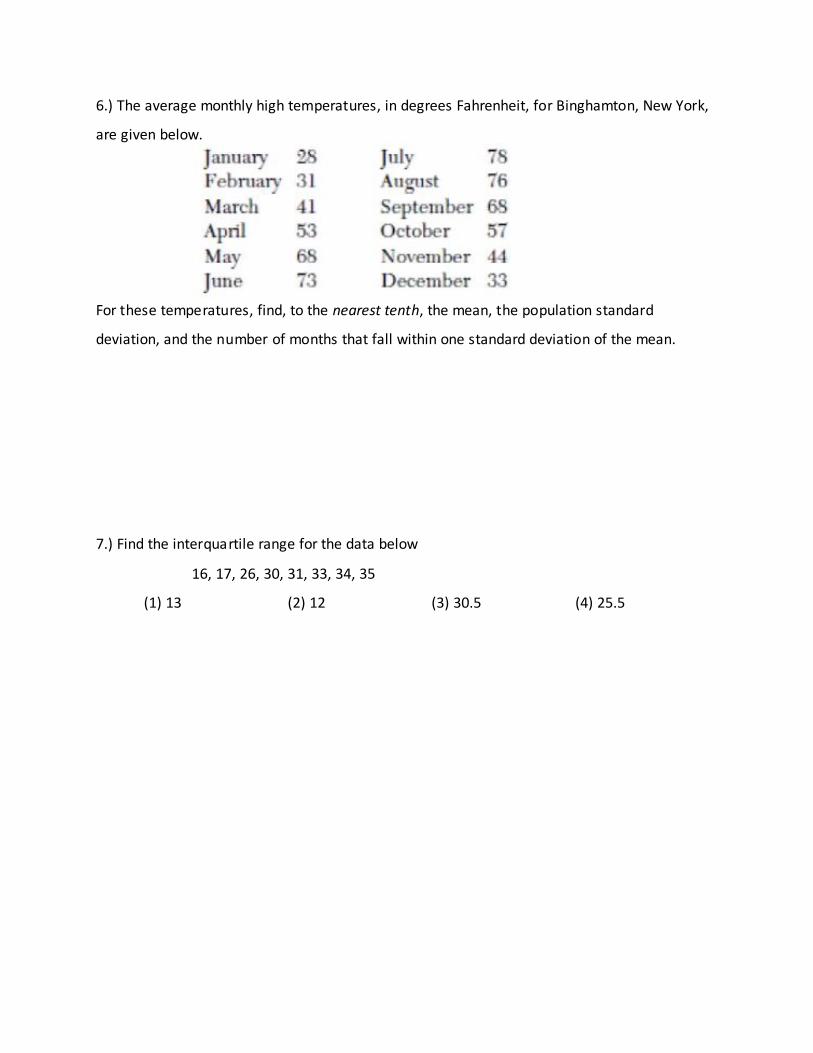
6.) The average monthly high temperatures, in degrees Fahrenheit, for Binghamton, New York,
are given below.
For these temperatures, find, to the nearest tenth, the mean, the population standard
deviation, and the number of months that fall within one standard deviation of the mean.
7.) Find the interquartile range for the data below
16, 17, 26, 30, 31, 33, 34, 35
(1) 13 (2) 12 (3) 30.5 (4) 25.5
Chapter 16: Statistics
Lesson 3
The Normal Distribution
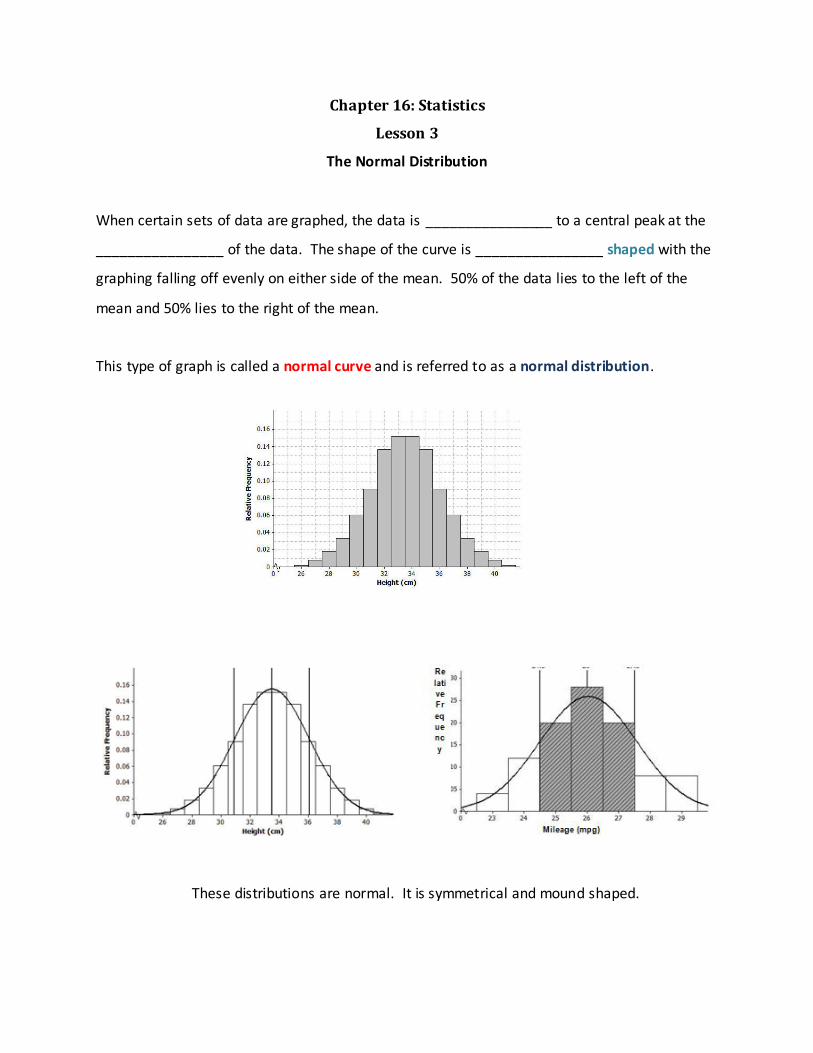
When certain sets of data are graphed, the data is ________________ to a central peak at the
________________ of the data. The shape of the curve is ________________ shaped with the
graphing falling off evenly on either side of the mean. 50% of the data lies to the left of the
mean and 50% lies to the right of the mean.
This type of graph is called a normal curve and is referred to as a normal distribution.
These distributions are normal. It is symmetrical and mound shaped.
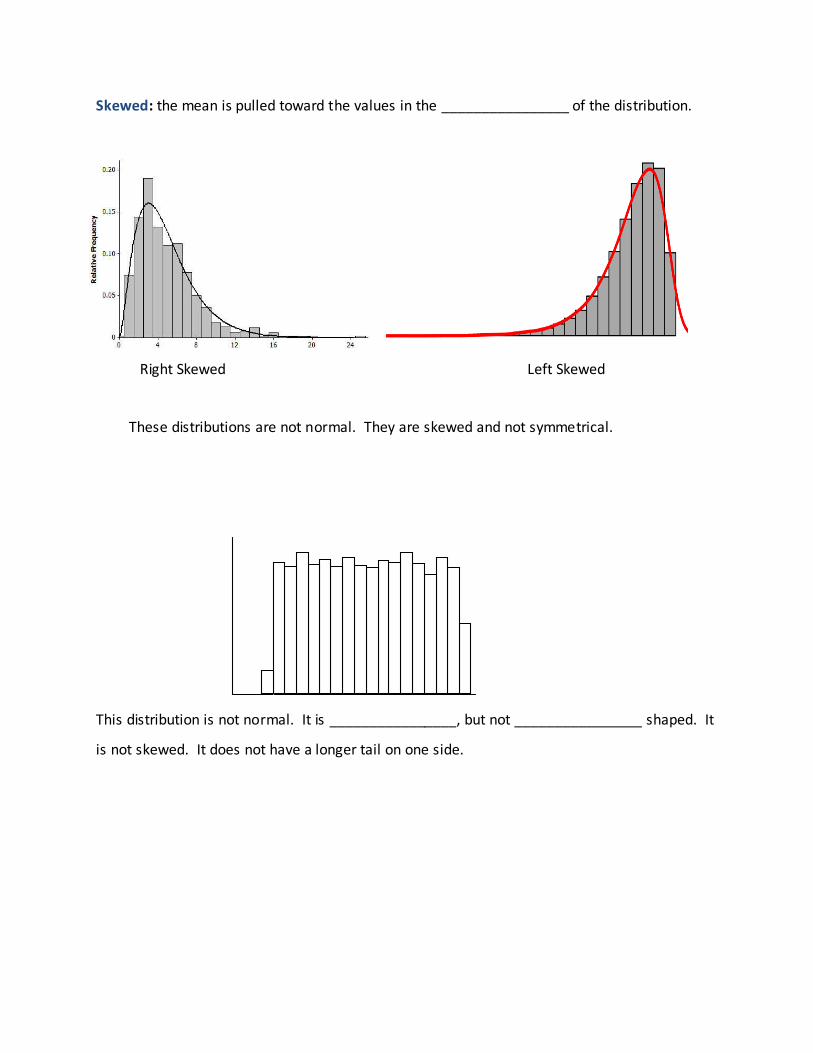
Skewed: the mean is pulled toward the values in the ________________ of the distribution.
Right Skewed Left Skewed
These distributions are not normal. They are skewed and not symmetrical.
This distribution is not normal. It is ________________, but not ________________ shaped. It
is not skewed. It does not have a longer tail on one side.
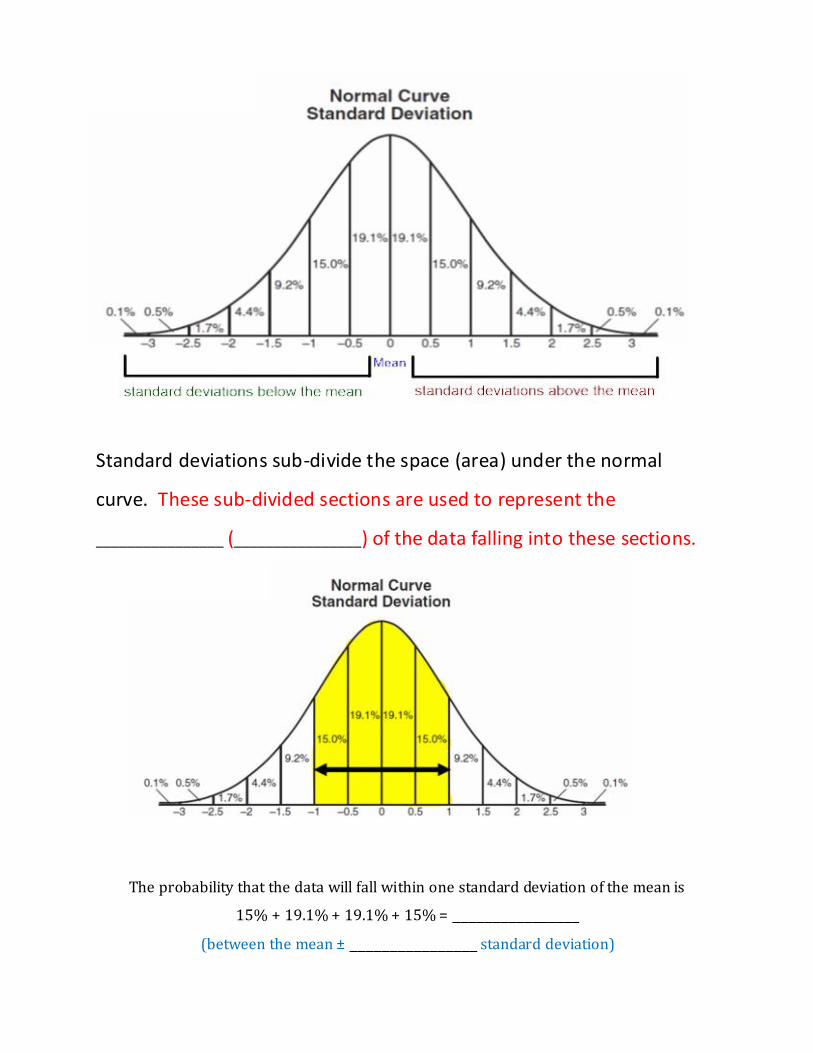
Standard deviations sub-divide the space (area) under the normal
curve. These sub-divided sections are used to represent the
________________ (________________) of the data falling into these sections.
The probability that the data will fall within one standard deviation of the mean is
15% + 19.1% + 19.1% + 15% = ________________
(between the mean ± ________________ standard deviation)
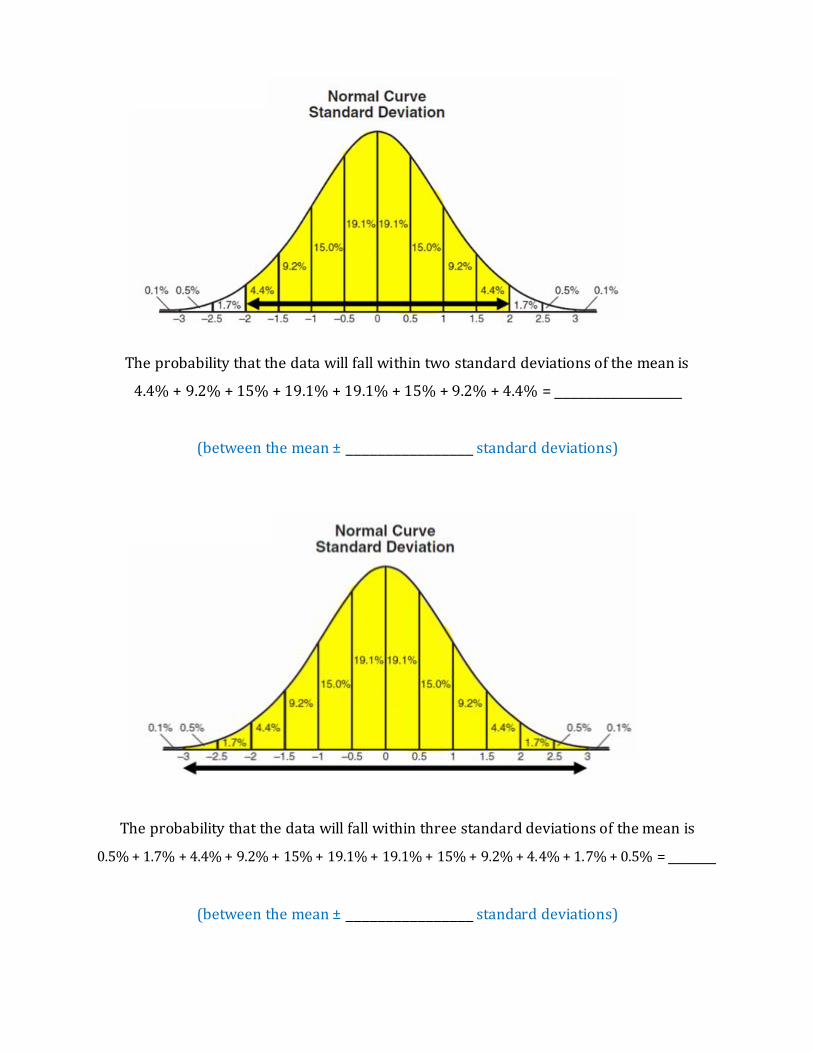
The probability that the data will fall within two standard deviations of the mean is
4.4% + 9.2% + 15% + 19.1% + 19.1% + 15% + 9.2% + 4.4% = ________________
(between the mean ± ________________ standard deviations)
The probability that the data will fall within three standard deviations of the mean is
0.5% + 1.7% + 4.4% + 9.2% + 15% + 19.1% + 19.1% + 15% + 9.2% + 4.4% + 1.7% + 0.5% = ______
(between the mean ± ________________ standard deviations)
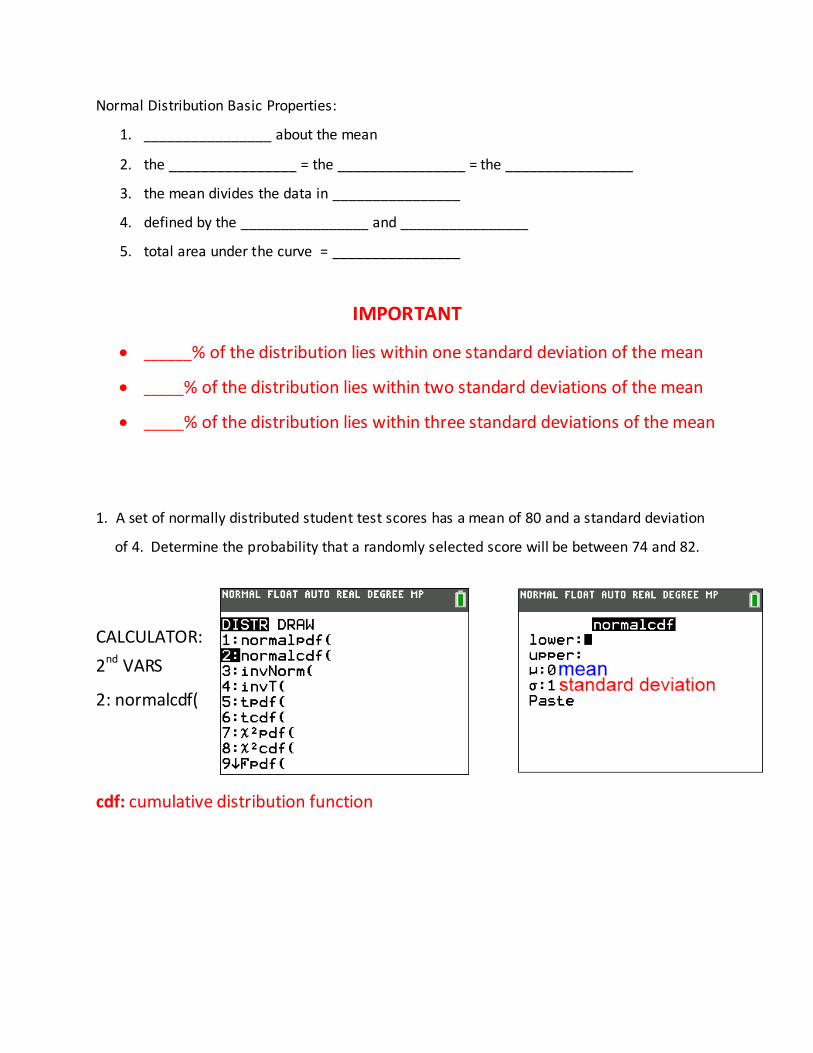
Normal Distribution Basic Properties:
1. ________________ about the mean
2. the ________________ = the ________________ = the ________________
3. the mean divides the data in ________________
4. defined by the ________________ and ________________
5. total area under the curve = ________________
IMPORTANT
______% of the distribution lies within one standard deviation of the mean
_____% of the distribution lies within two standard deviations of the mean
_____% of the distribution lies within three standard deviations of the mean
1. A set of normally distributed student test scores has a mean of 80 and a standard deviation
of 4. Determine the probability that a randomly selected score will be between 74 and 82.
CALCULATOR: 2nd VARS
2: normalcdf(
cdf: cumulative distribution function
2. The national mean for verbal scores on an exam was 428 and the standard deviation was
113. Approximately what percent of those taking this test had verbal scores between 315
and 541?
3. Professor Bartrich has 184 students in her mathematics class. The scores on the final
examination are normally distributed and have a mean of 72.3 and a standard deviation of
8.9. How many students in the class can be expected to receive a score between 82 and 90?
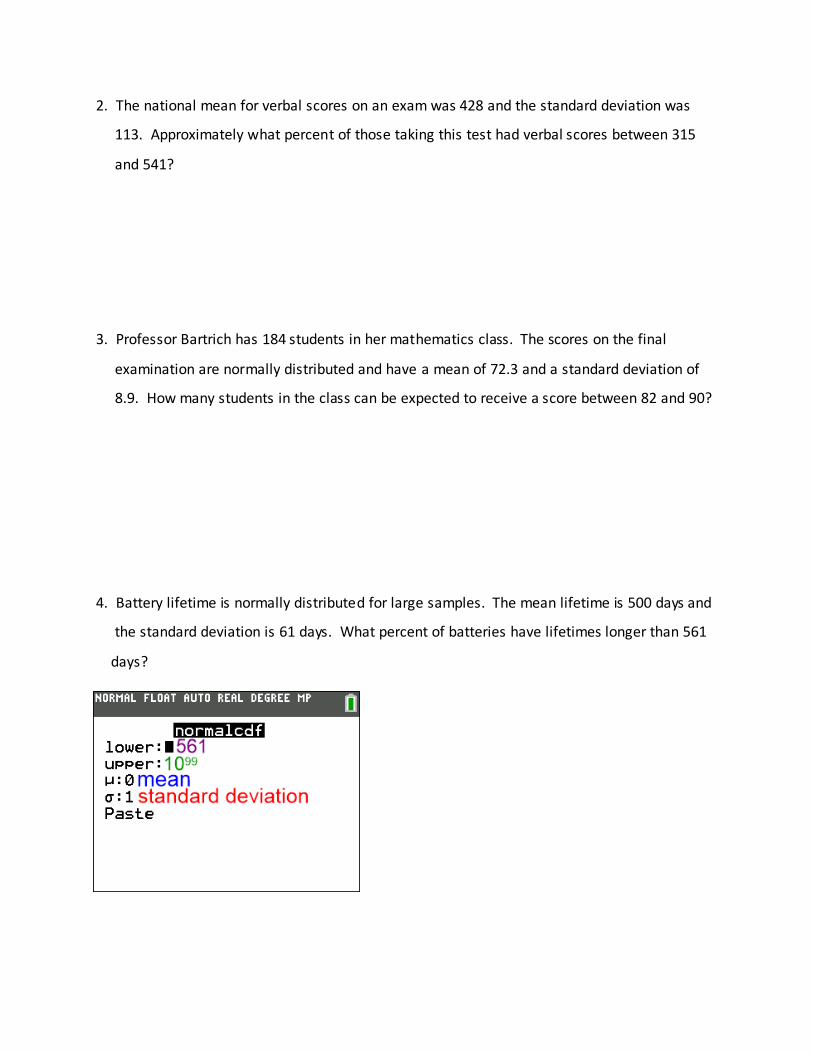
4. Battery lifetime is normally distributed for large samples. The mean lifetime is 500 days and
the standard deviation is 61 days. What percent of batteries have lifetimes longer than 561
days?
5. The amount of ketchup dispensed from a machine at Hamburger Place is normally
distributed with a mean of 0.9 ounce and a standard deviation of 0.1 ounce. If the machine
is used 500 times, approximately many times will it be expected to dispense 1 or more
ounces of ketchup?
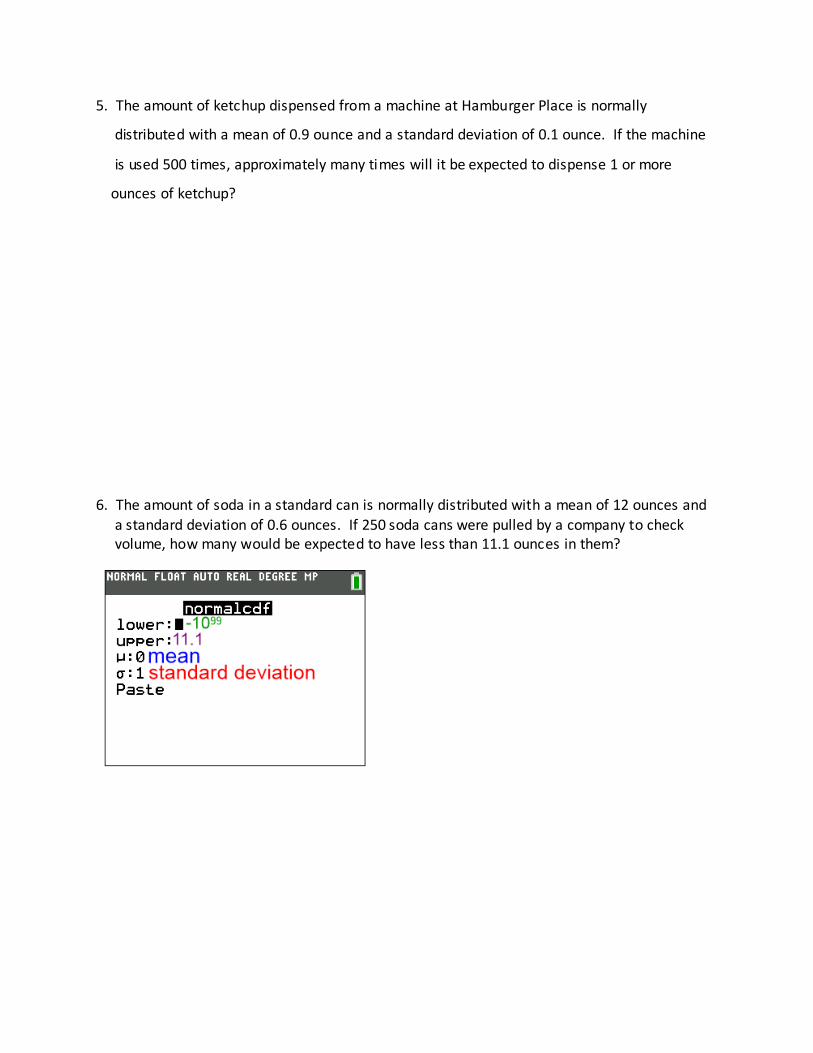
6. The amount of soda in a standard can is normally distributed with a mean of 12 ounces and
a standard deviation of 0.6 ounces. If 250 soda cans were pulled by a company to check volume, how many would be expected to have less than 11.1 ounces in them?
7. In a New York City high school, a survey revealed the mean amount of cola consumed each
week was 12 bottles and the standard deviation was 2.8 bottles. Assuming the survey
represents a normal distribution, how many bottles of cola per week will approximately
68.2% of the students drink?
8. The mean of a normally distributed set of data is 56, and the standard deviation is 5. In
which interval do approximately 95.4% of all cases lie?
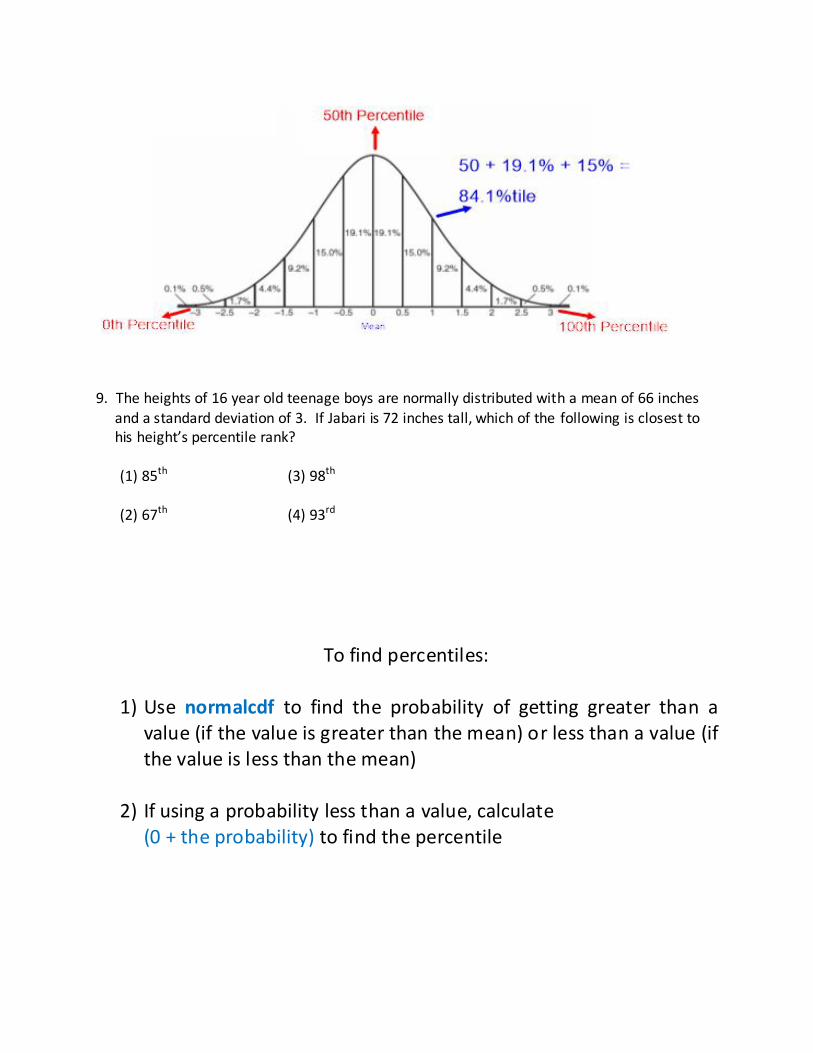
9. The heights of 16 year old teenage boys are normally distributed with a mean of 66 inches
and a standard deviation of 3. If Jabari is 72 inches tall, which of the following is closest to his height’s percentile rank? (1) 85th (3) 98th (2) 67th (4) 93rd
To find percentiles:
1) Use normalcdf to find the probability of getting greater than a value (if the value is greater than the mean) or less than a value (if the value is less than the mean)
2) If using a probability less than a value, calculate
(0 + the probability) to find the percentile
10. SAT scores were originally scaled so that the scores for each section were approximately
normally distributed with a mean of 500 and a standard deviation of 100. Assuming that this scaling still applies, find what percentile a score of 250 would be, to the nearest tenth
of a percent.
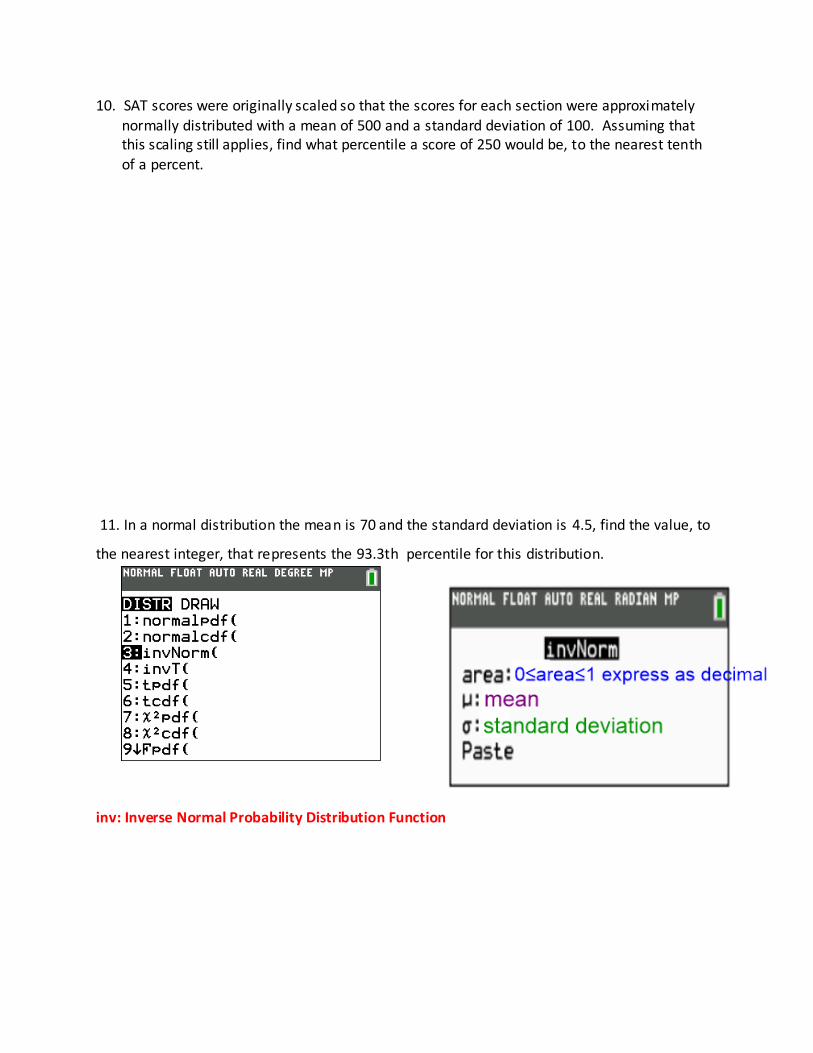
11. In a normal distribution the mean is 70 and the standard deviation is 4.5, find the value, to
the nearest integer, that represents the 93.3th percentile for this distribution.
inv: Inverse Normal Probability Distribution Function
Chapter 16: Statistics
Lesson 3: Homework
The Normal Distribution
1. A variable is normally distributed with a mean of 16 and a standard deviation of 6. Find the percent of the data set that:
(a) is greater than 16 (b) falls between 10 and 22 (c) is greater than 28
(d) is less than 1 (e) falls between 4 and 19 (f) falls between 22 and 31
APPLICATIONS
2. The weights of Siamese cats are normally distributed with a mean of 6.4 pounds and a
standard deviation of 0.8 pounds. If a breeder of Siamese cats has 128 in his care, how many can he expect to have weights between 5.2 and 7.6 pounds?
(1) 106 (3) 98
(2) 49 (4) 111
3. If one quart bottles of apple juice have weights that are normally distributed with a mean of
64 ounces and a standard deviation of 3 ounces, what percent of bottles would be expected to have less than 58 ounces?
(1) 6.7% (3) 0.6%
(2) 15.0% (4) 2.3%
4. Historically daily high temperatures in July in Red Hook, New York, are normally distributed
with a mean of 84 F and a standard deviation of 4 F . How many of the 31 days of July can
a person expect to have temperatures above 90 F? (1) 6 (3) 9 (2) 2 (4) 4
5. The weights of four year old boys are normally distributed with a mean of 38 pounds and a
standard deviation of 4 pounds. Which of the following weights could represent the 90 th percentile for the weight of a four year old?
(1) 47 pounds (3) 43 pounds
(2) 45 pounds (4) 41 pounds
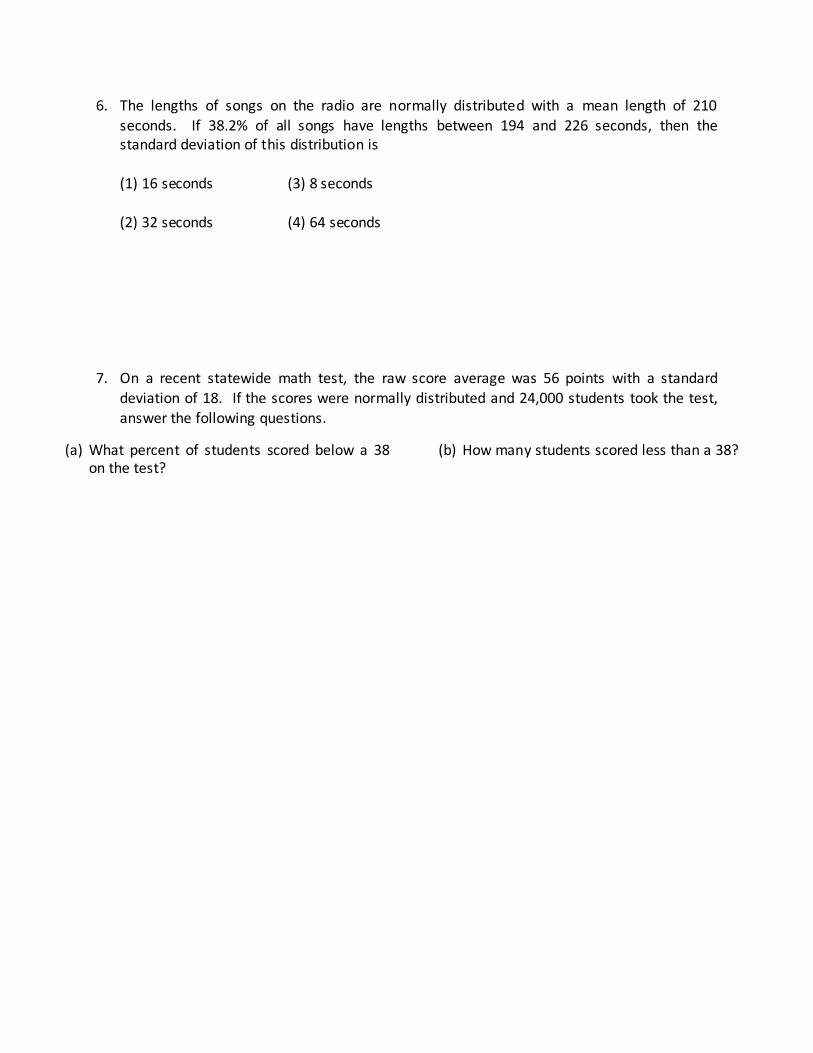
6. The lengths of songs on the radio are normally distributed with a mean length of 210
seconds. If 38.2% of all songs have lengths between 194 and 226 seconds, then the standard deviation of this distribution is
(1) 16 seconds (3) 8 seconds
(2) 32 seconds (4) 64 seconds
7. On a recent statewide math test, the raw score average was 56 points with a standard
deviation of 18. If the scores were normally distributed and 24,000 students took the test,
answer the following questions.
(a) What percent of students scored below a 38 on the test?
(b) How many students scored less than a 38?
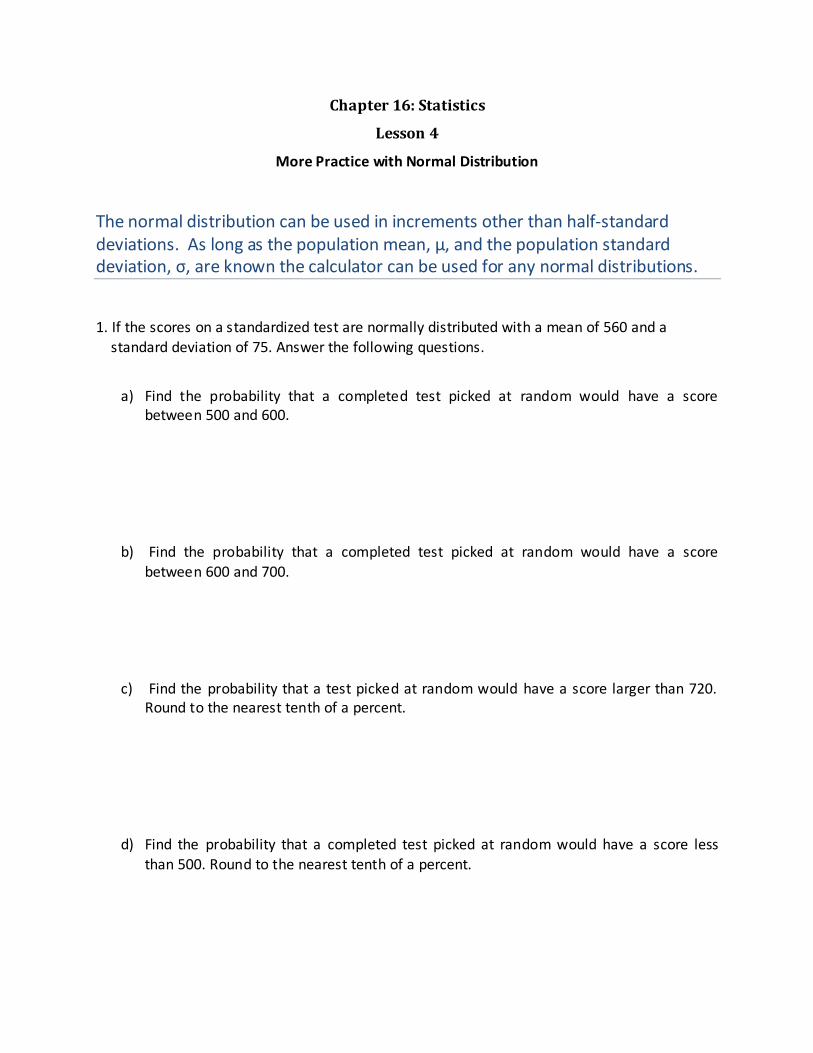
Chapter 16: Statistics
Lesson 4
More Practice with Normal Distribution
The normal distribution can be used in increments other than half-standard deviations. As long as the population mean, µ, and the population standard deviation, σ, are known the calculator can be used for any normal distributions.
1. If the scores on a standardized test are normally distributed with a mean of 560 and a
standard deviation of 75. Answer the following questions.
a) Find the probability that a completed test picked at random would have a score between 500 and 600.
b) Find the probability that a completed test picked at random would have a score between 600 and 700.
c) Find the probability that a test picked at random would have a score larger than 720. Round to the nearest tenth of a percent.
d) Find the probability that a completed test picked at random would have a score less
than 500. Round to the nearest tenth of a percent.
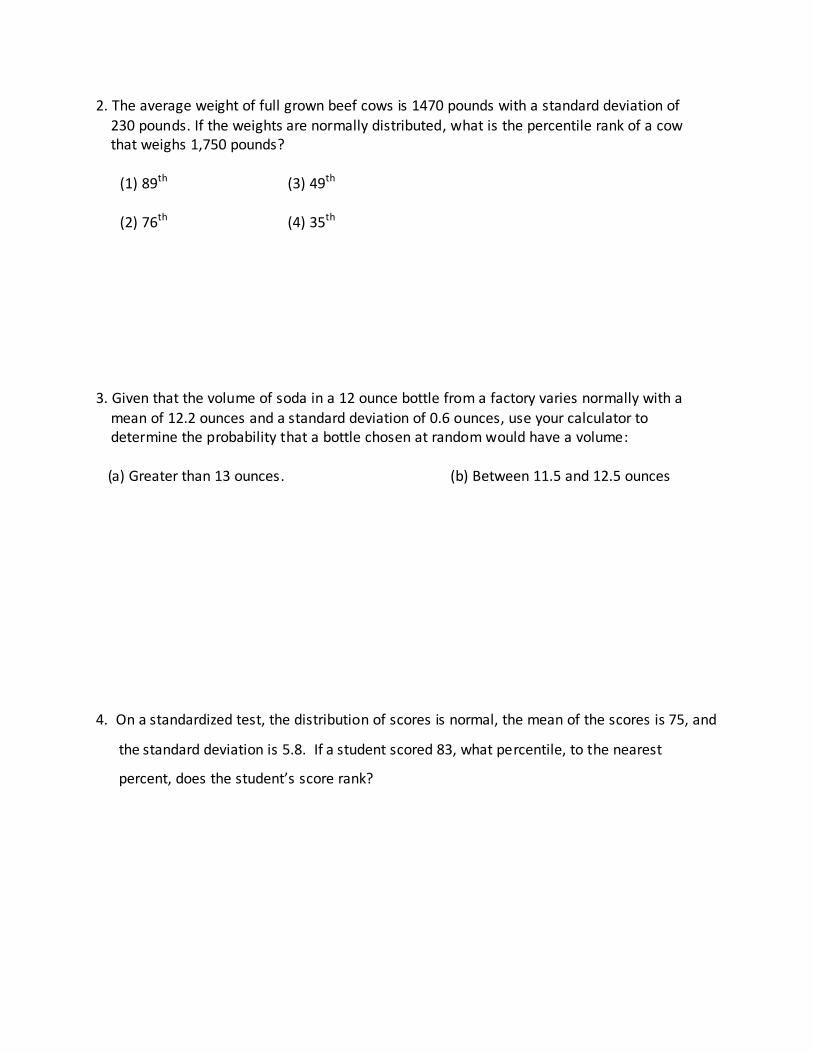
2. The average weight of full grown beef cows is 1470 pounds with a standard deviation of
230 pounds. If the weights are normally distributed, what is the percentile rank of a cow that weighs 1,750 pounds?
(1) 89th (3) 49th
(2) 76th (4) 35th
3. Given that the volume of soda in a 12 ounce bottle from a factory varies normally with a
mean of 12.2 ounces and a standard deviation of 0.6 ounces, use your calculator to determine the probability that a bottle chosen at random would have a volume: (a) Greater than 13 ounces. (b) Between 11.5 and 12.5 ounces
4. On a standardized test, the distribution of scores is normal, the mean of the scores is 75, and
the standard deviation is 5.8. If a student scored 83, what percentile, to the nearest
percent, does the student’s score rank?
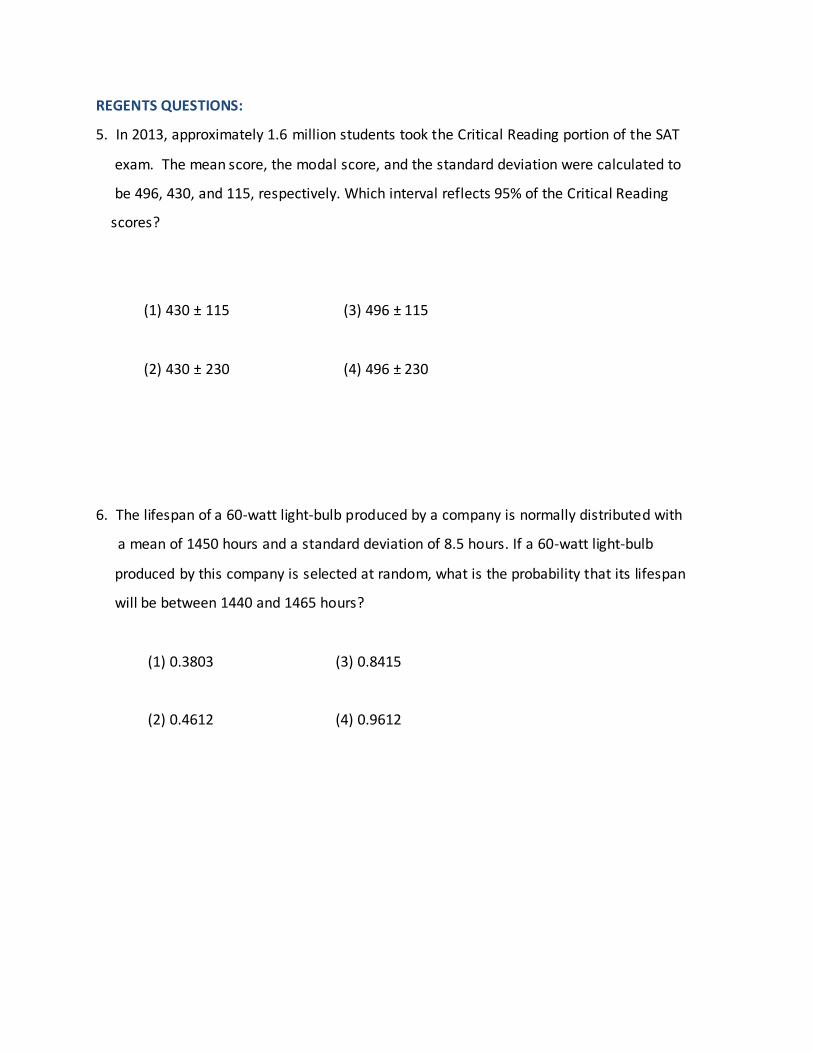
REGENTS QUESTIONS:
5. In 2013, approximately 1.6 million students took the Critical Reading portion of the SAT
exam. The mean score, the modal score, and the standard deviation were calculated to
be 496, 430, and 115, respectively. Which interval reflects 95% of the Critical Reading
scores?
(1) 430 ± 115 (3) 496 ± 115
(2) 430 ± 230 (4) 496 ± 230
6. The lifespan of a 60-watt light-bulb produced by a company is normally distributed with
a mean of 1450 hours and a standard deviation of 8.5 hours. If a 60-watt light-bulb
produced by this company is selected at random, what is the probability that its lifespan
will be between 1440 and 1465 hours?
(1) 0.3803 (3) 0.8415
(2) 0.4612 (4) 0.9612
7. The heights of women in the United States are normally distributed computations with a
mean of 64 inches and a standard deviation of 2.75 inches. The percent of women whose
heights are between 64 and 69.5 inches, to the nearest whole percent, is
(1) 6 (3) 68
(2) 48 (4) 95
8. Elizabeth waited for 6 minutes at the drive thru at her favorite fast-food restaurant the
last time she visited. She was upset about having to wait that long and notified the
manager. The manager assured her that her experience was very unusual and that it
would not happen again. A study of customers commissioned by this restaurant found an
approximately normal distribution of results. The mean wait time was 226 seconds and
the standard deviation was 38 seconds. Given these data, and using a 95% level of
confidence, was Elizabeth’s wait time unusual? Justify your answer.
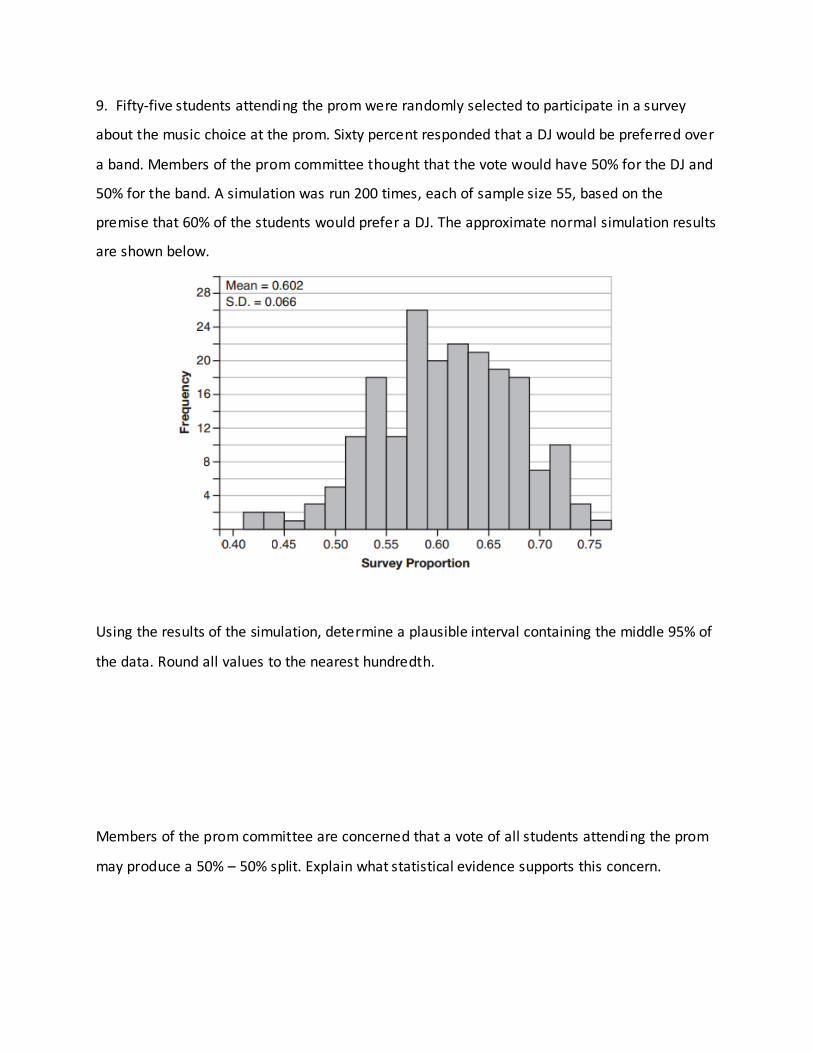
9. Fifty-five students attending the prom were randomly selected to participate in a survey
about the music choice at the prom. Sixty percent responded that a DJ would be preferred over
a band. Members of the prom committee thought that the vote would have 50% for the DJ and
50% for the band. A simulation was run 200 times, each of sample size 55, based on the
premise that 60% of the students would prefer a DJ. The approximate normal simulation results
are shown below.
Using the results of the simulation, determine a plausible interval containing the middle 95% of
the data. Round all values to the nearest hundredth.
Members of the prom committee are concerned that a vote of all students attending the prom
may produce a 50% – 50% split. Explain what statistical evidence supports this concern.
Chapter 16: Statistics
Lesson 4 Homework
More Practice with Normal Distribution
1. A recent study found that the mean amount spent by individuals on a music service website was normally distributed with a mean of $384 with a standard deviation of $48. Which of
the following gives the proportion of the individuals that spend more than $400?
(1) 0.43 (3) 0.12 (2) 0.74 (4) 0.37
2. The hold time experienced by people calling a government agency was found to be normally distributed with a mean of 12.4 minutes and a standard deviation of 4.3 minutes. Which
percent below represents the percent of calls answered in less than 5 minutes?
(1) 4.3% (3) 6.8%
(2) 5.3% (4) 12.9%
3. The national average price per gallon for gasoline is normally distributed with a mean
(currently) of $2.34 per gallon with a standard deviation of $0.26 per gallon. Which of the following represents the proportion of the gas prices that lie between $2.00 and $3.00?
(1) 56% (3) 84% (2) 72% (4) 90%
4. The average rent for a one bedroom apartment (in the Winter of 2015) in New York City is a
whopping $2801 per month with a standard deviation of $920. If rents are normally distributed, what percent of the apartments will be less than $2,500 per month?
5. A national math competition advances to the second round only the top 5% of all participants based on scores from a first round exam. Their scores are normally distributed with a mean of 76.2 and a standard deviation of 17.1. What score, to the nearest whole number, would be necessary to make it to the second round?
Chapter 16 Statistics
Lesson 5 Margin of Error
A general approach for finding a margin of error involves using the standard deviation of a sample proportion. With appropriate sample sizes, ________% of all sample proportions are
within about _________ standard deviations of the true population proportion. Therefore, due to natural sampling variability, 95% of all samples have a sample proportion of true proportion ± 2 sample standard deviation, where 2SD is the _____________. This may be referred to as a ______________________________. The interval estimate may be described as a “95% confidence interval”. This means we expect the true population parameter to fall within the interval estimates 95% of the time. “Margin of Error” is similar to “____________________”. If you were going to a party and you
said that you would be there at 8pm, give or take 10 minutes, the margin of error is the 10 minutes. This means there is a 95% chance that you will arrive between 7:50 and 8:10pm. The 7:50 to 8:10 is the interval estimate. The margin of error allows us to give a range of values that are reasonable for a population parameter based on a sample statistic. We will only consider what is known as the 95% margin of error. Although, there are many others based on other confidence levels. The 95% Margin of Error The ____________________ level that would guarantee a 95% chance that the population
parameter falls within a certain range of values. Data is considered to be statistically significant if it falls within the margin of error. The margin of error decreases as the sample size increases.
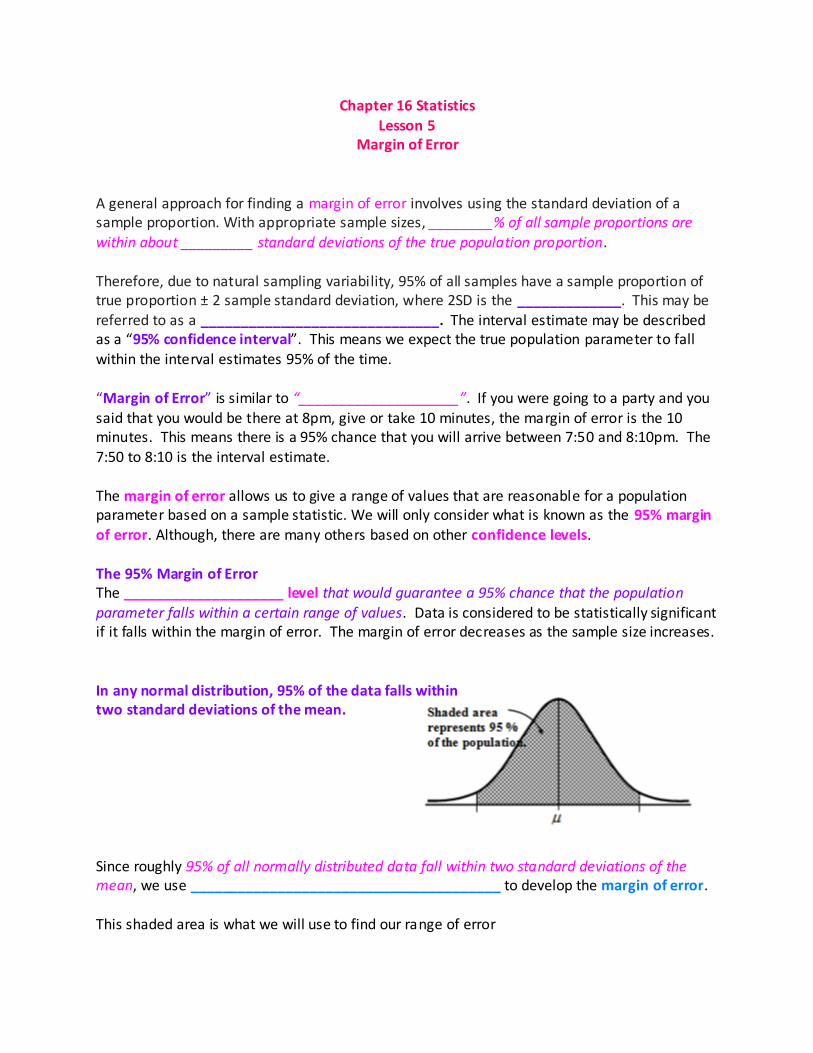
In any normal distribution, 95% of the data falls within two standard deviations of the mean.
Since roughly 95% of all normally distributed data fall within two standard deviations of the mean, we use _______________________________________ to develop the margin of error.
This shaded area is what we will use to find our range of error
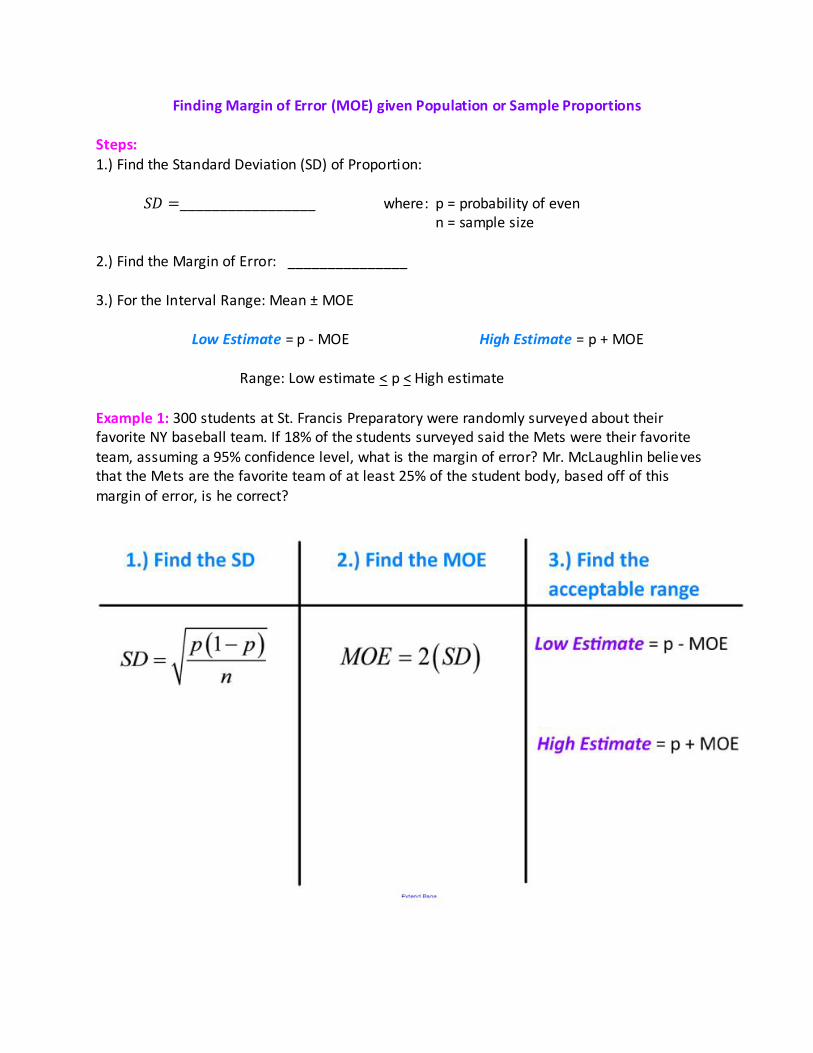
Finding Margin of Error (MOE) given Population or Sample Proportions
Steps:
1.) Find the Standard Deviation (SD) of Proportion:
_________________ where: p = probability of even n = sample size
2.) Find the Margin of Error: _______________ 3.) For the Interval Range: Mean ± MOE Low Estimate = p - MOE High Estimate = p + MOE Range: Low estimate < p < High estimate
Example 1: 300 students at St. Francis Preparatory were randomly surveyed about their favorite NY baseball team. If 18% of the students surveyed said the Mets were their favorite team, assuming a 95% confidence level, what is the margin of error? Mr. McLaughlin believes that the Mets are the favorite team of at least 25% of the student body, based off of this margin of error, is he correct?
Example 2: A recent poll found that 36% of all respondents would vote for Candidate A in an
election. The poll reported a margin of error of 4%. Give an interpretation of what this margin of error means in terms of 36% support for Candidate A.
Example 3: In a sample survey, 50 people were randomly sampled about their favorite soda. If 38% of them listed Soda A as their favorite, then answer the following questions.
(a) Find the sample standard deviation for this proportion.
(b) What is the margin of error for this survey? What would an acceptable range of
values for the population proportion?
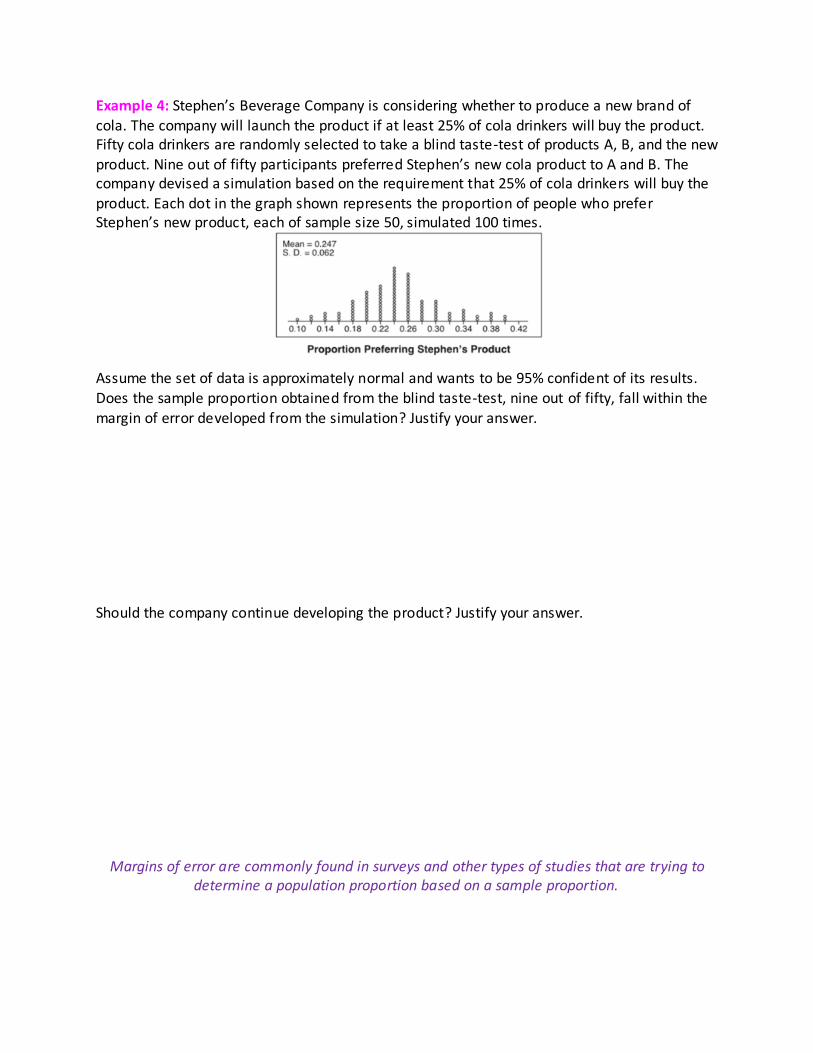
Example 4: Stephen’s Beverage Company is considering whether to produce a new brand of
cola. The company will launch the product if at least 25% of cola drinkers will buy the product. Fifty cola drinkers are randomly selected to take a blind taste-test of products A, B, and the new
product. Nine out of fifty participants preferred Stephen’s new cola product to A and B. The company devised a simulation based on the requirement that 25% of cola drinkers will buy the
product. Each dot in the graph shown represents the proportion of people who prefer Stephen’s new product, each of sample size 50, simulated 100 times.
Assume the set of data is approximately normal and wants to be 95% confident of its results. Does the sample proportion obtained from the blind taste-test, nine out of fifty, fall within the
margin of error developed from the simulation? Justify your answer.
Should the company continue developing the product? Justify your answer.
Margins of error are commonly found in surveys and other types of studies that are trying to determine a population proportion based on a sample proportion.
Example 5: In a poll of 500 potential voters, Candidate A led Candidate B by a 46% to 39%
margin. Could these two candidates actually be tied in the population as a whole? Justify your response.
Example 6: In 2015, a survey of fifty 20 to 24 year olds was done to determine their mean weekly earnings. The survey found a sample mean of $495 with a sample standard deviation of $6.79. If the World Almanac reported the 2014 mean weekly earnings of this age range to be $472, do the results of this survey conclusively imply an increase in the mean weekly earning from 2014 to 2015? Explain.
Chapter 16 Statistics
Lesson 5: Homework Margin of Error
1. Determine the margin of error, to the nearest thousandth, for each of the following proportions with the given sample size. Show the work that leads to your answer. Use this
to find an acceptable range. (a) 0.35 and 40p n (b) 0.72 and 100p n
(c) 0.5 and 50p n (d) 0.25 and 30p n
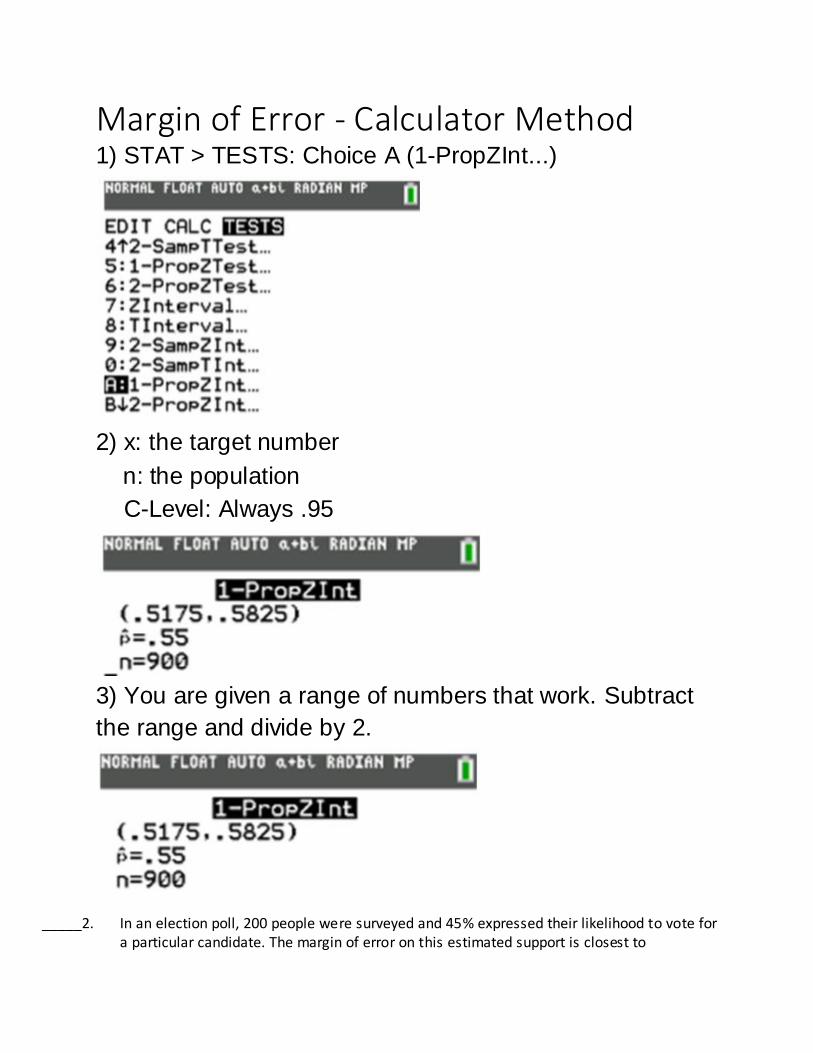
Margin of Error - Calculator Method 1) STAT > TESTS: Choice A (1-PropZInt...)
2) x: the target number
n: the population
C-Level: Always .95
3) You are given a range of numbers that work. Subtract
the range and divide by 2.
_____2. In an election poll, 200 people were surveyed and 45% expressed their likelihood to vote for
a particular candidate. The margin of error on this estimated support is closest to
(1) 2% (3) 7%
(2) 3% (4) 12%
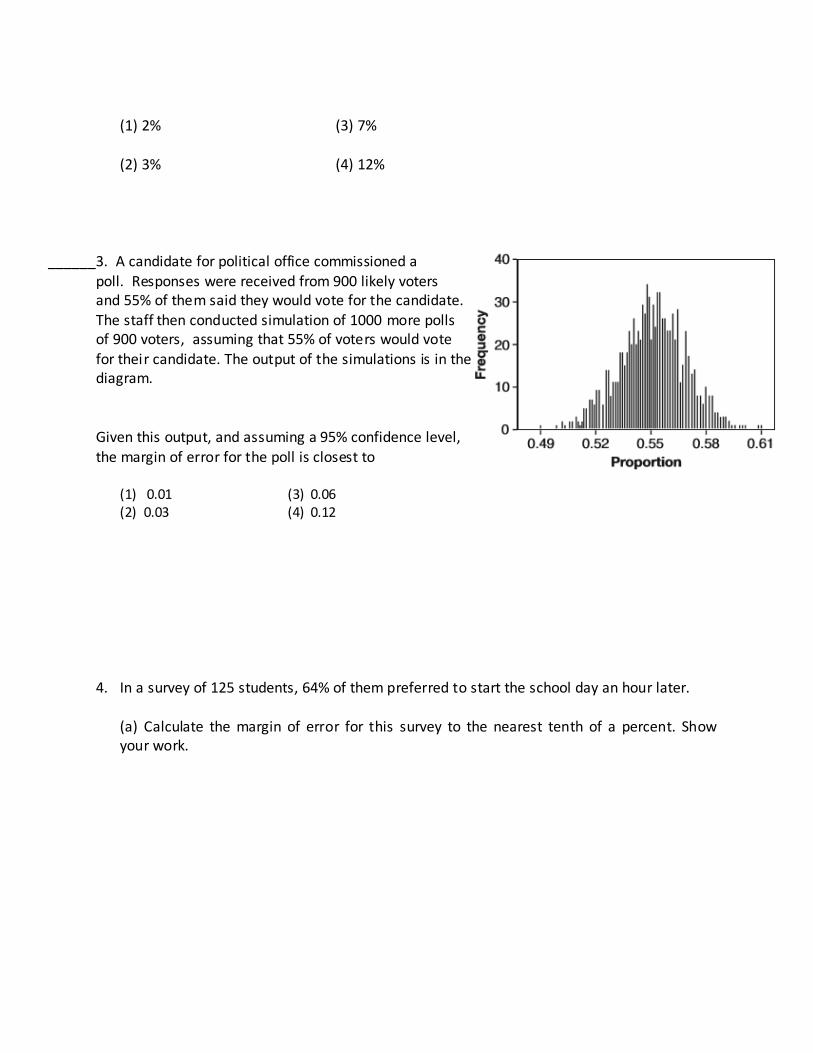
______3. A candidate for political office commissioned a
poll. Responses were received from 900 likely voters and 55% of them said they would vote for the candidate. The staff then conducted simulation of 1000 more polls of 900 voters, assuming that 55% of voters would vote for their candidate. The output of the simulations is in the diagram.
Given this output, and assuming a 95% confidence level, the margin of error for the poll is closest to
(1) 0.01 (3) 0.06 (2) 0.03 (4) 0.12
4. In a survey of 125 students, 64% of them preferred to start the school day an hour later.
(a) Calculate the margin of error for this survey to the nearest tenth of a percent. Show your work.
(b) The administration of the school will only continue to study the feasibility of starting the
day later if there is at least 70% support amongst students. Does this fall within the margin of error of the survey?
5. A consumer group is trying to determine the mean amount that a family of four spends on
food per week. They perform a phone survey of 300 random families of four and find a sample mean of $241.50 with a sample standard deviation of $2.70.
(a) What is the margin of error for the mean amount spent on food per week?
(b) If the World Almanac found that the mean amount spent by all four person families in
2015 was $244.90, was this within the margin of error you found in (b)? Explain or show how you arrived at your conclusion.
Chapter 16: Statistics
Lesson 6 Statistically Significant
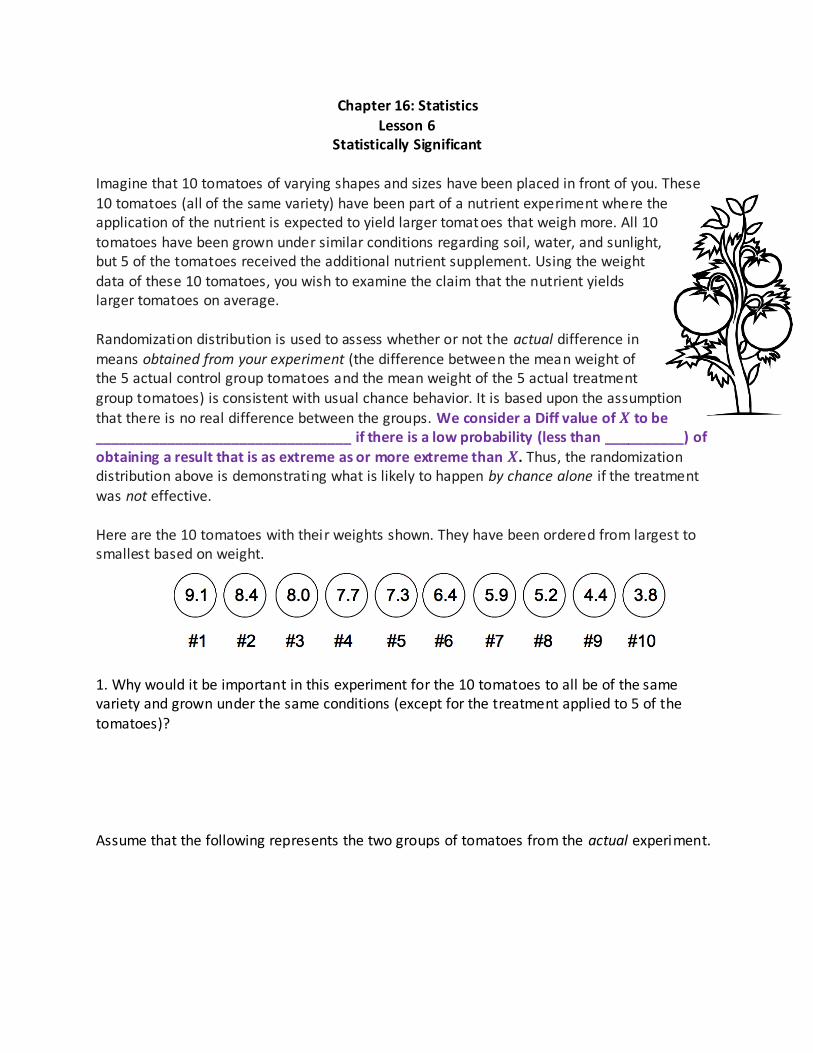
Imagine that 10 tomatoes of varying shapes and sizes have been placed in front of you. These
10 tomatoes (all of the same variety) have been part of a nutrient experiment where the application of the nutrient is expected to yield larger tomatoes that weigh more. All 10
tomatoes have been grown under similar conditions regarding soil, water, and sunlight, but 5 of the tomatoes received the additional nutrient supplement. Using the weight data of these 10 tomatoes, you wish to examine the claim that the nutrient yields larger tomatoes on average. Randomization distribution is used to assess whether or not the actual difference in means obtained from your experiment (the difference between the mean weight of the 5 actual control group tomatoes and the mean weight of the 5 actual treatment group tomatoes) is consistent with usual chance behavior. It is based upon the assumption
that there is no real difference between the groups. We consider a Diff value of to be ________________________________ if there is a low probability (less than __________) of obtaining a result that is as extreme as or more extreme than . Thus, the randomization distribution above is demonstrating what is likely to happen by chance alone if the treatment was not effective. Here are the 10 tomatoes with their weights shown. They have been ordered from largest to smallest based on weight.
1. Why would it be important in this experiment for the 10 tomatoes to all be of the same variety and grown under the same conditions (except for the treatment applied to 5 of the
tomatoes)? Assume that the following represents the two groups of tomatoes from the actual experiment.
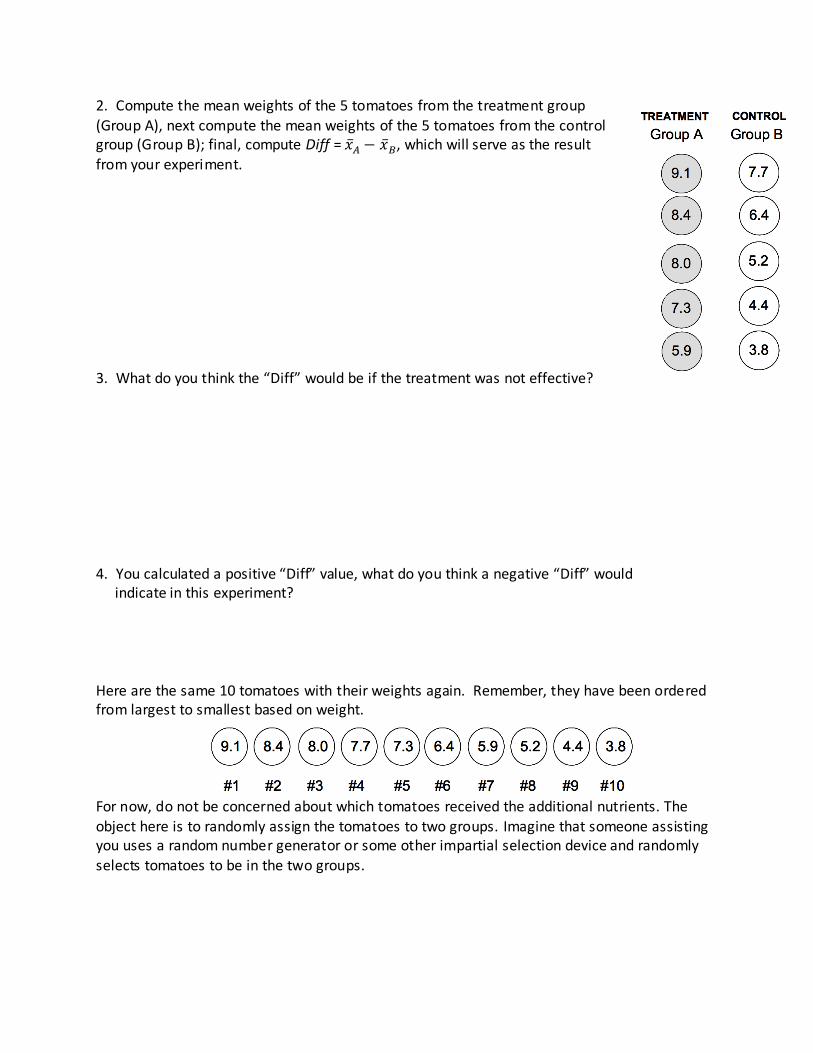
2. Compute the mean weights of the 5 tomatoes from the treatment group
(Group A), next compute the mean weights of the 5 tomatoes from the control group (Group B); final, compute Diff = , which will serve as the result
from your experiment.
3. What do you think the “Diff” would be if the treatment was not effective?
4. You calculated a positive “Diff” value, what do you think a negative “Diff” would indicate in this experiment?
Here are the same 10 tomatoes with their weights again. Remember, they have been ordered from largest to smallest based on weight.
For now, do not be concerned about which tomatoes received the additional nutrients. The
object here is to randomly assign the tomatoes to two groups. Imagine that someone assisting you uses a random number generator or some other impartial selection device and randomly
selects tomatoes to be in the two groups.
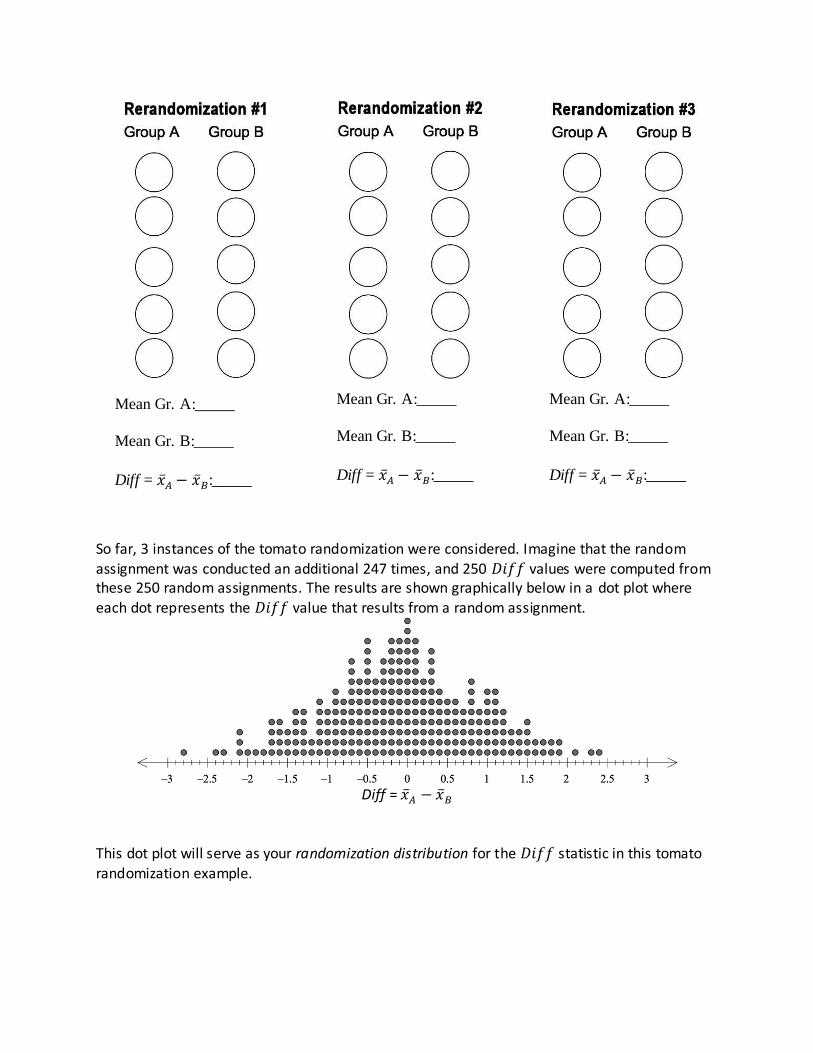
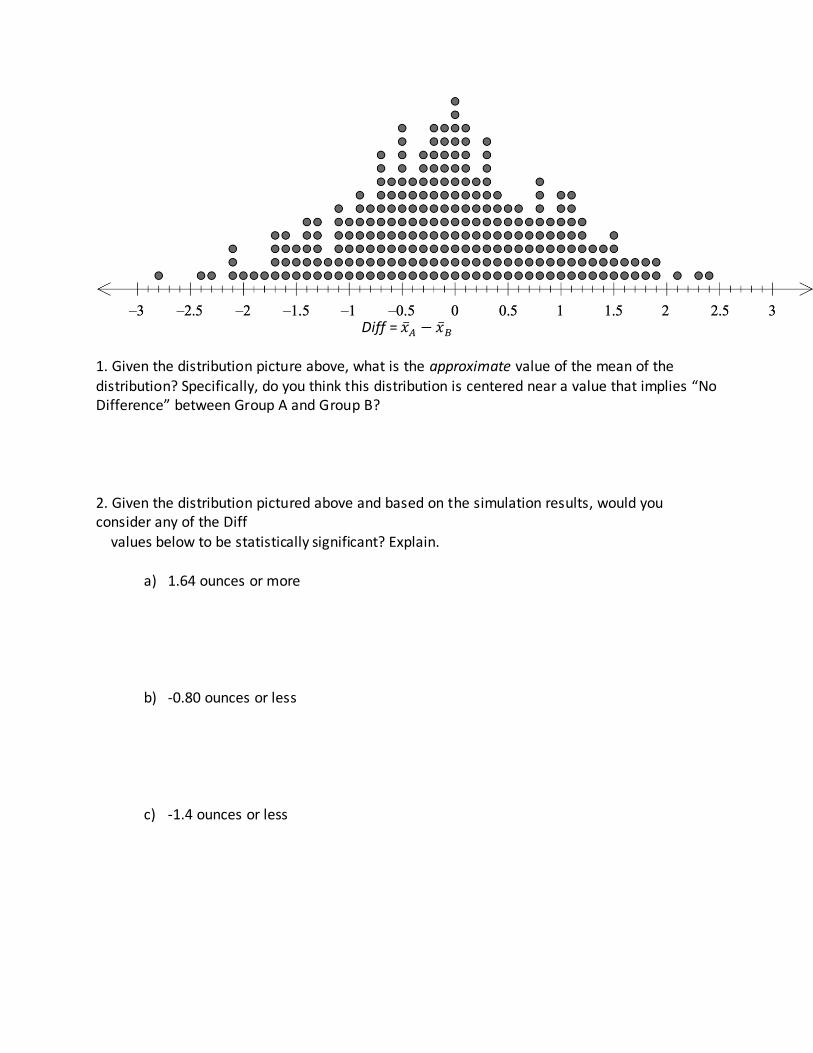
So far, 3 instances of the tomato randomization were considered. Imagine that the random assignment was conducted an additional 247 times, and 250 values were computed from these 250 random assignments. The results are shown graphically below in a dot plot where each dot represents the value that results from a random assignment.
Diff =
This dot plot will serve as your randomization distribution for the statistic in this tomato
randomization example.
Mean Gr. A:_____
Mean Gr. B:_____
Diff = :_____
Mean Gr. A:_____
Mean Gr. B:_____
Diff = :_____
Mean Gr. A:_____
Mean Gr. B:_____
Diff = :_____
Diff =
1. Given the distribution picture above, what is the approximate value of the mean of the distribution? Specifically, do you think this distribution is centered near a value that implies “No Difference” between Group A and Group B? 2. Given the distribution pictured above and based on the simulation results, would you consider any of the Diff
values below to be statistically significant? Explain.
a) 1.64 ounces or more
b) -0.80 ounces or less
c) -1.4 ounces or less
SUMMARY
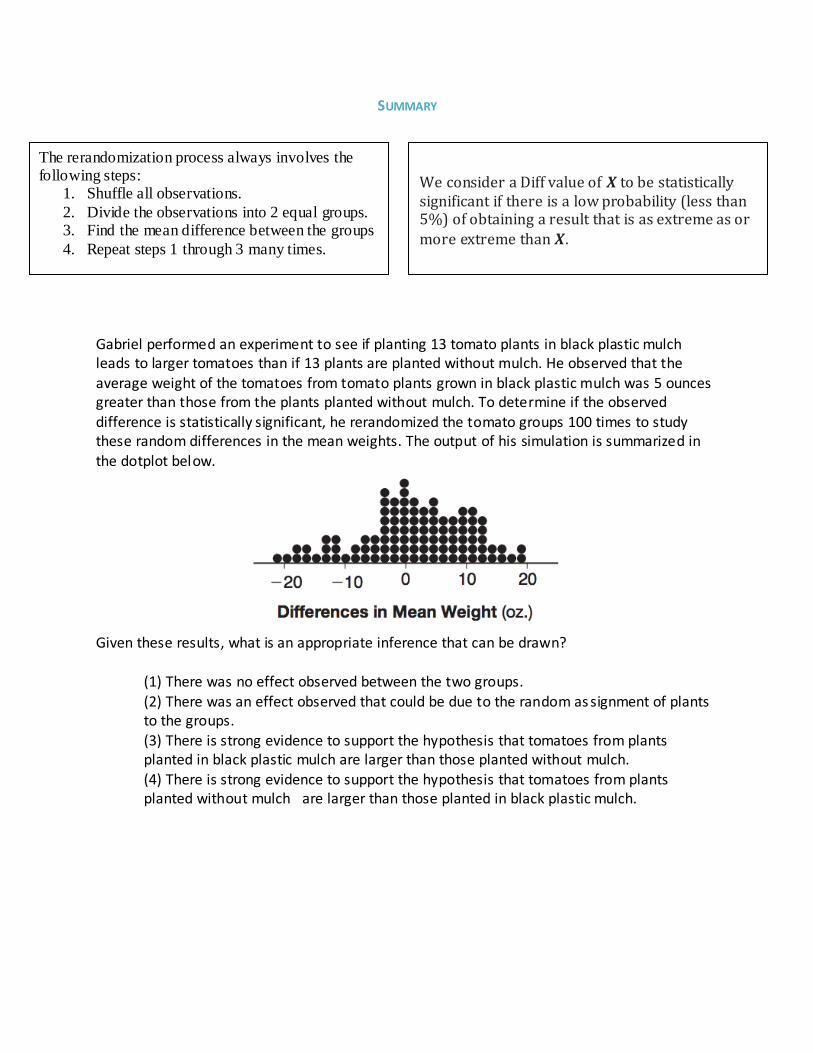
Gabriel performed an experiment to see if planting 13 tomato plants in black plastic mulch leads to larger tomatoes than if 13 plants are planted without mulch. He observed that the
average weight of the tomatoes from tomato plants grown in black plastic mulch was 5 ounces greater than those from the plants planted without mulch. To determine if the observed difference is statistically significant, he rerandomized the tomato groups 100 times to study these random differences in the mean weights. The output of his simulation is summarized in the dotplot below.
Given these results, what is an appropriate inference that can be drawn?
(1) There was no effect observed between the two groups.
(2) There was an effect observed that could be due to the random as signment of plants to the groups. (3) There is strong evidence to support the hypothesis that tomatoes from plants planted in black plastic mulch are larger than those planted without mulch. (4) There is strong evidence to support the hypothesis that tomatoes from plants planted without mulch are larger than those planted in black plastic mulch.
The rerandomization process always involves the following steps:
1. Shuffle all observations.
2. Divide the observations into 2 equal groups. 3. Find the mean difference between the groups
4. Repeat steps 1 through 3 many times.
We consider a Diff value of to be statistically significant if there is a low probability (less than 5%) of obtaining a result that is as extreme as or
more extreme than .
Induced (Variability created because of the treatment the subject was placed in):
Natural (Variability just because people, animals, plants, etcetera, are naturally different):
Seventy-two students are randomly divided into two equally-sized study groups. Each member of the first group (group 1) is to meet with a tutor after school twice each week for one hour. The second group (group 2), is given an online subscription to a tutorial account that they can access for a maximum of two hours each week. Students in both groups are given the same tests during the year. A summary of the two groups’ final grades is shown below:
Calculate the mean difference in the final grades (group 1 – group 2) and explain its meaning in the context of the problem.
A simulation was conducted in which the students’ final grades were rerandomized 500 times. The results are shown below.
Induced variability occurs when two groups are treated in different ways and those differences in treatment then change the results based on which group the subject is in. For example, in an experiment, a scientist might give one set of plants more light and one set less light and this causes variability in how much the plants grow.
Natural variability is always introduced in any experiment because subjects respond differently based on a multitude of factors that have nothing to do with their treatment group. Taking the sample example as before, if a group of plants was given more light than another, the exact amount each plant grew within a group wo uld still vary, even though they got the same amount of light.
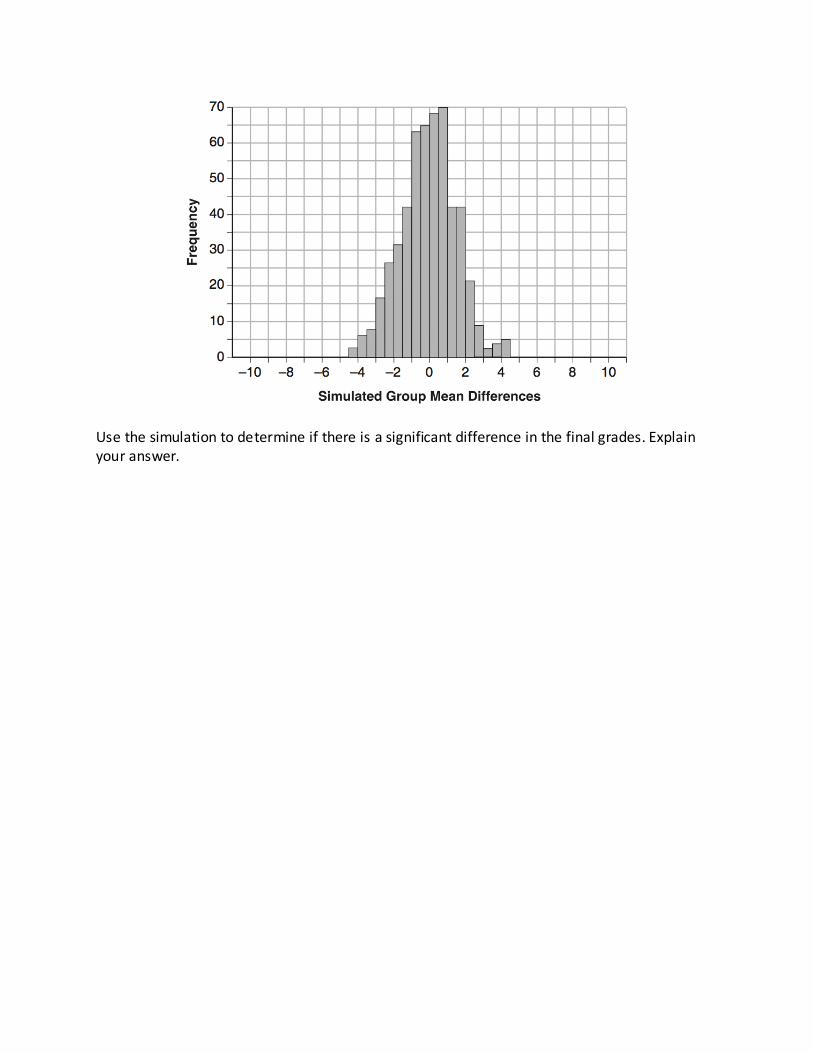
Use the simulation to determine if there is a significant difference in the final grades. Explain your answer.
Chapter 16: Statistics
Lesson 6: Homework Statistically Significant
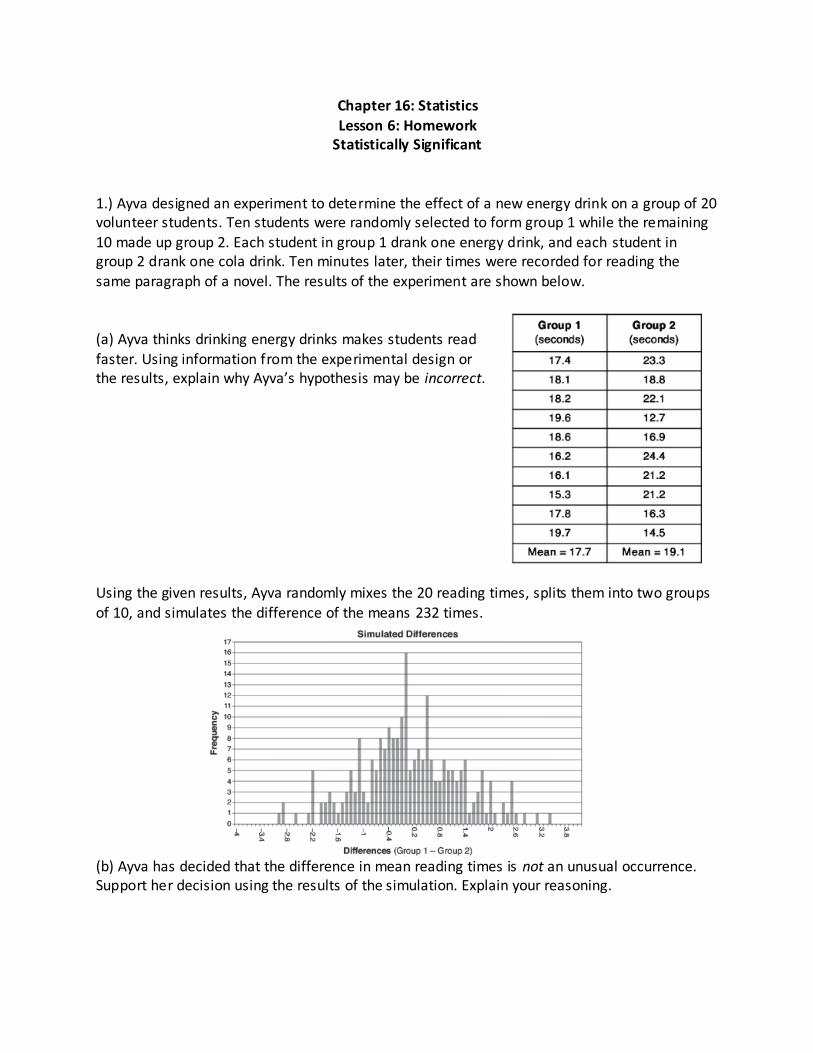
1.) Ayva designed an experiment to determine the effect of a new energy drink on a group of 20 volunteer students. Ten students were randomly selected to form group 1 while the remaining
10 made up group 2. Each student in group 1 drank one energy drink, and each student in group 2 drank one cola drink. Ten minutes later, their times were recorded for reading the same paragraph of a novel. The results of the experiment are shown below. (a) Ayva thinks drinking energy drinks makes students read faster. Using information from the experimental design or the results, explain why Ayva’s hypothesis may be incorrect.
Using the given results, Ayva randomly mixes the 20 reading times, splits them into two groups
of 10, and simulates the difference of the means 232 times.
(b) Ayva has decided that the difference in mean reading times is not an unusual occurrence. Support her decision using the results of the simulation. Explain your reasoning.
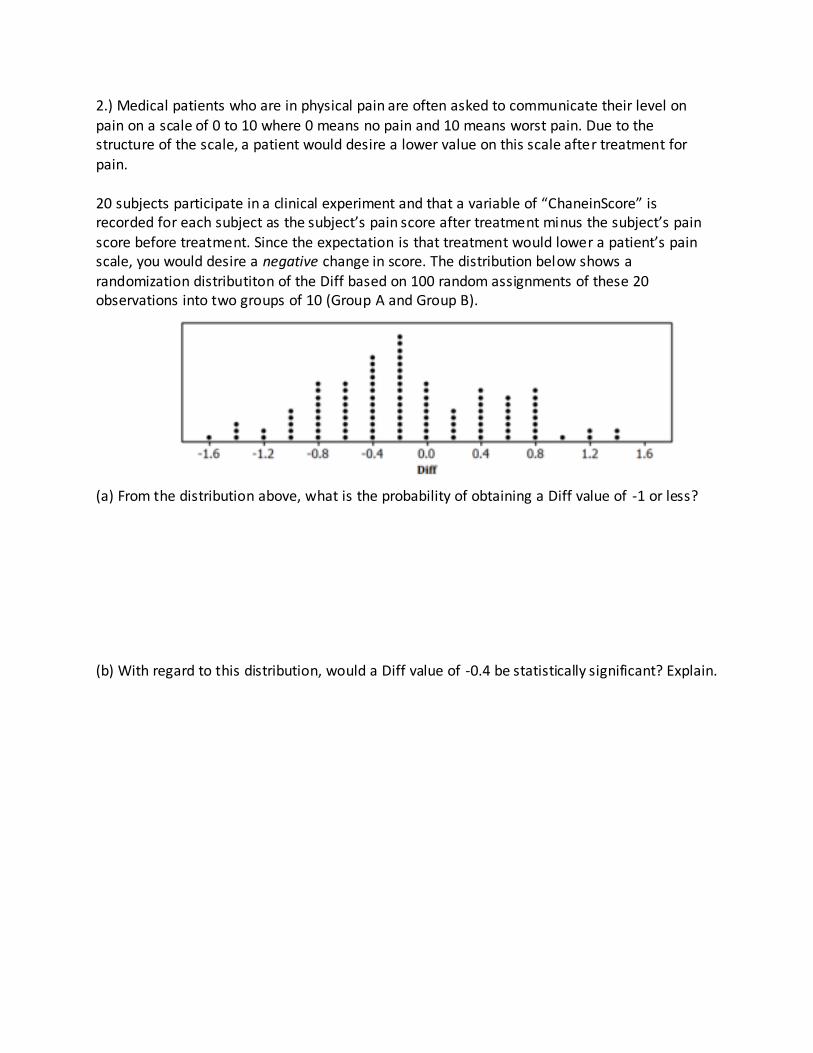
2.) Medical patients who are in physical pain are often asked to communicate their level on
pain on a scale of 0 to 10 where 0 means no pain and 10 means worst pain. Due to the structure of the scale, a patient would desire a lower value on this scale after treatment for
pain.
20 subjects participate in a clinical experiment and that a variable of “ChaneinScore” is recorded for each subject as the subject’s pain score after treatment minus the subject’s pain
score before treatment. Since the expectation is that treatment would lower a patient’s pain scale, you would desire a negative change in score. The distribution below shows a randomization distributiton of the Diff based on 100 random assignments of these 20 observations into two groups of 10 (Group A and Group B).
(a) From the distribution above, what is the probability of obtaining a Diff value of -1 or less?
(b) With regard to this distribution, would a Diff value of -0.4 be statistically significant? Explain.
(c) With regard to how Diff is calculated, if Group A represented a group of patients in your
experiment who received a new pain relief treatment and Group B received a pill with no medicine (called a placebo), how would you interpret a Diff value of -1.4 pain scale units in
context?
(d) Given the distribution above, if a Diff value of -1.4 was obtained from the experiment, would
you consider that to be significant evidence of the new treatment being effective on average in relieving pain? Explain.
Chapter 16
Lesson 7
Linear Regression and the Line of Best Fit
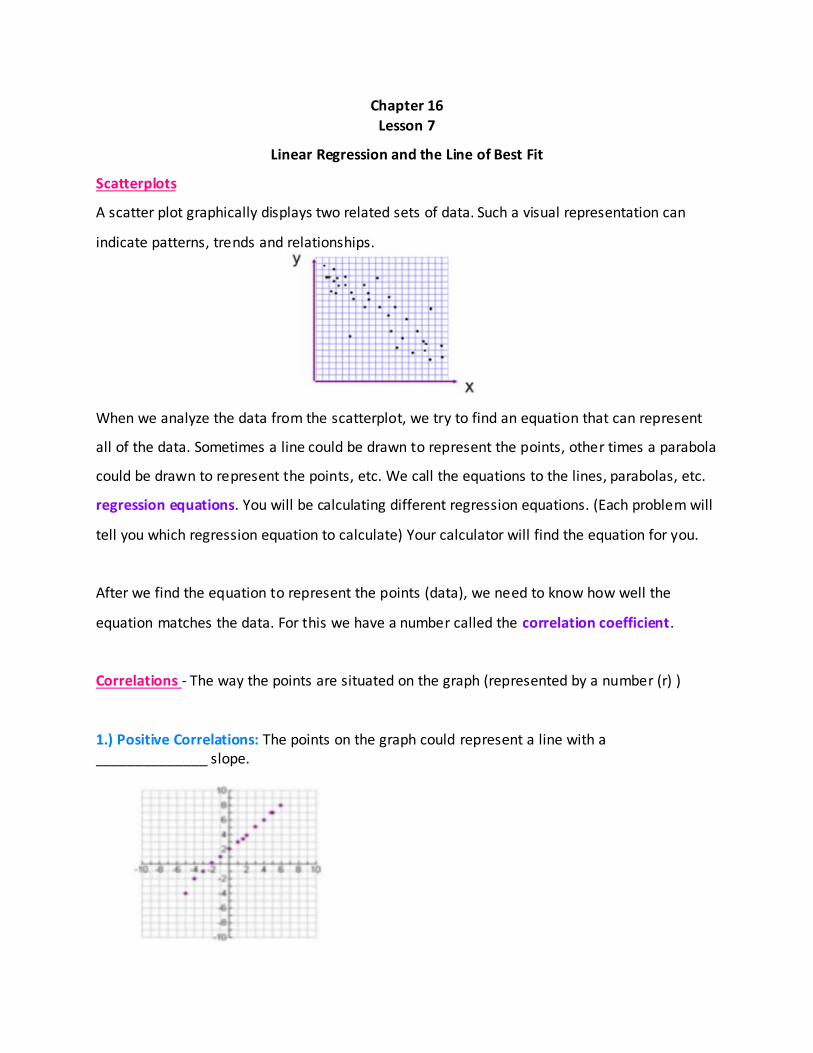
Scatterplots
A scatter plot graphically displays two related sets of data. Such a visual representation can
indicate patterns, trends and relationships.
When we analyze the data from the scatterplot, we try to find an equation that can represent
all of the data. Sometimes a line could be drawn to represent the points, other times a parabola
could be drawn to represent the points, etc. We call the equations to the lines, parabolas, etc.
regression equations. You will be calculating different regression equations. (Each problem will
tell you which regression equation to calculate) Your calculator will find the equation for you.
After we find the equation to represent the points (data), we need to know how well the
equation matches the data. For this we have a number called the correlation coefficient.
Correlations - The way the points are situated on the graph (represented by a number (r) )
1.) Positive Correlations: The points on the graph could represent a line with a ______________ slope.
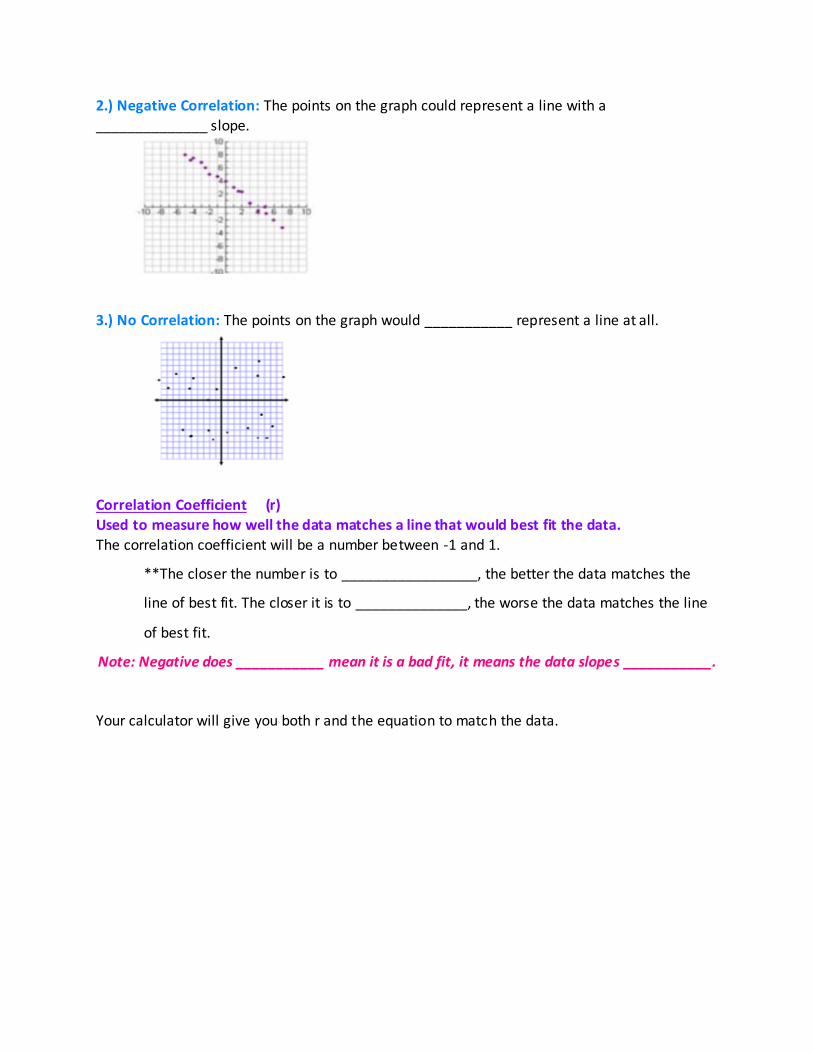
2.) Negative Correlation: The points on the graph could represent a line with a
______________ slope.
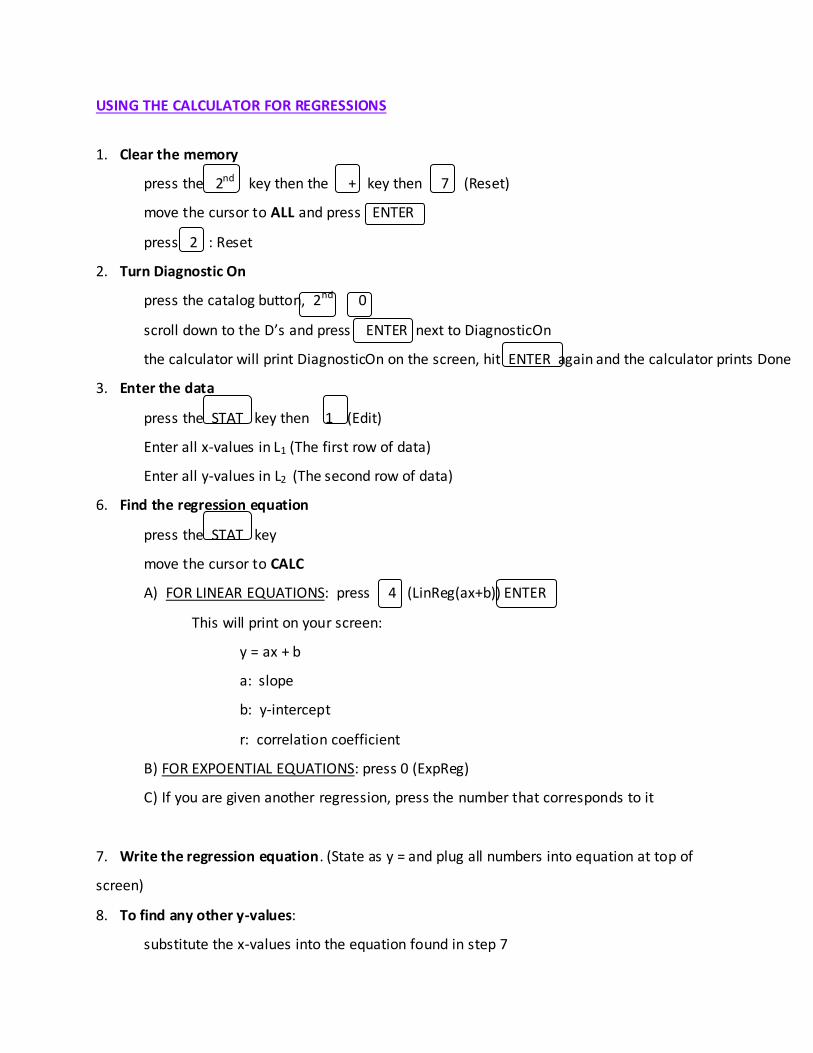
3.) No Correlation: The points on the graph would ___________ represent a line at all.
Correlation Coefficient (r)
Used to measure how well the data matches a line that would best fit the data.
The correlation coefficient will be a number between -1 and 1.
**The closer the number is to _________________, the better the data matches the
line of best fit. The closer it is to ______________, the worse the data matches the line
of best fit. Note: Negative does ___________ mean it is a bad fit, it means the data slopes ___________.
Your calculator will give you both r and the equation to match the data.
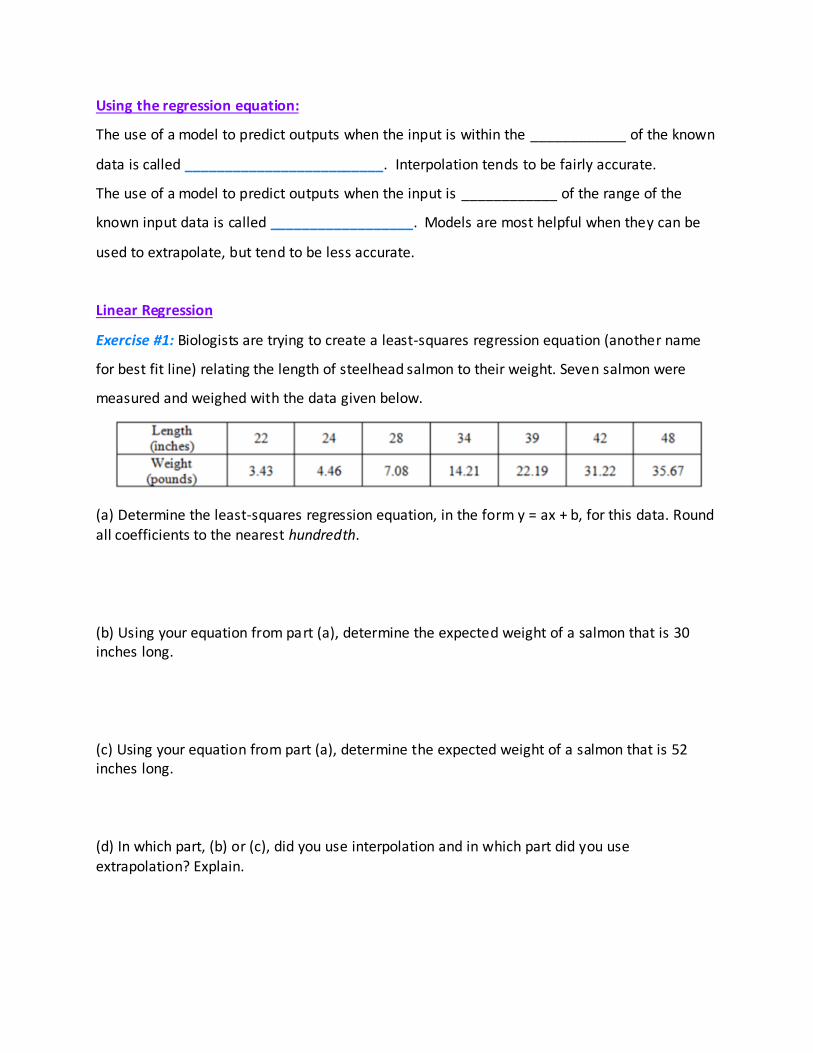
USING THE CALCULATOR FOR REGRESSIONS
1. Clear the memory
press the 2nd key then the + key then 7 (Reset)
move the cursor to ALL and press ENTER
press 2 : Reset
2. Turn Diagnostic On
press the catalog button, 2nd 0
scroll down to the D’s and press ENTER next to DiagnosticOn
the calculator will print DiagnosticOn on the screen, hit ENTER again and the calculator prints Done
3. Enter the data
press the STAT key then 1 (Edit)
Enter all x-values in L1 (The first row of data)
Enter all y-values in L2 (The second row of data)
6. Find the regression equation
press the STAT key
move the cursor to CALC
A) FOR LINEAR EQUATIONS: press 4 (LinReg(ax+b)) ENTER
This will print on your screen:
y = ax + b
a: slope
b: y-intercept
r: correlation coefficient
B) FOR EXPOENTIAL EQUATIONS: press 0 (ExpReg)
C) If you are given another regression, press the number that corresponds to it
7. Write the regression equation. (State as y = and plug all numbers into equation at top of
screen)
8. To find any other y-values:
substitute the x-values into the equation found in step 7
Using the regression equation:
The use of a model to predict outputs when the input is within the ____________ of the known
data is called _________________________. Interpolation tends to be fairly accurate. The use of a model to predict outputs when the input is ____________ of the range of the
known input data is called __________________. Models are most helpful when they can be
used to extrapolate, but tend to be less accurate.
Linear Regression
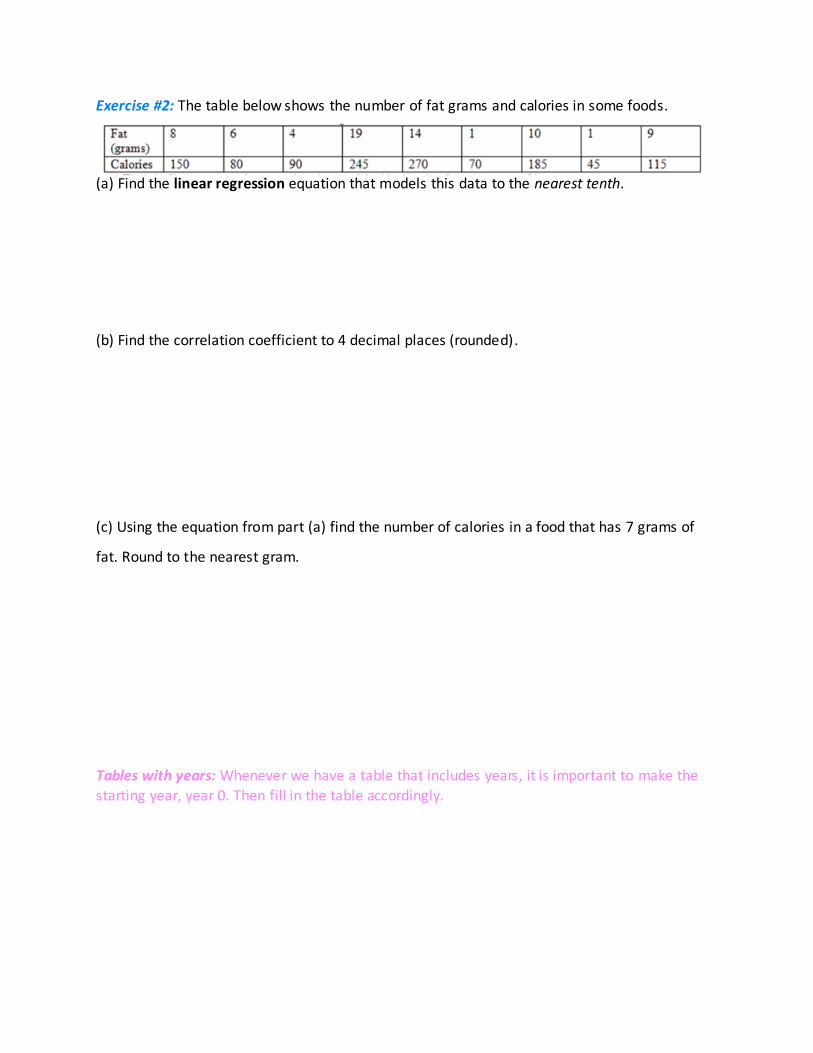
Exercise #1: Biologists are trying to create a least-squares regression equation (another name
for best fit line) relating the length of steelhead salmon to their weight. Seven salmon were
measured and weighed with the data given below.
(a) Determine the least-squares regression equation, in the form y = ax + b, for this data. Round all coefficients to the nearest hundredth.
(b) Using your equation from part (a), determine the expected weight of a salmon that is 30 inches long. (c) Using your equation from part (a), determine the expected weight of a salmon that is 52 inches long.
(d) In which part, (b) or (c), did you use interpolation and in which part did you use
extrapolation? Explain.
Exercise #2: The table below shows the number of fat grams and calories in some foods.
(a) Find the linear regression equation that models this data to the nearest tenth.
(b) Find the correlation coefficient to 4 decimal places (rounded).
(c) Using the equation from part (a) find the number of calories in a food that has 7 grams of
fat. Round to the nearest gram.
Tables with years: Whenever we have a table that includes years, it is important to make the
starting year, year 0. Then fill in the table accordingly.
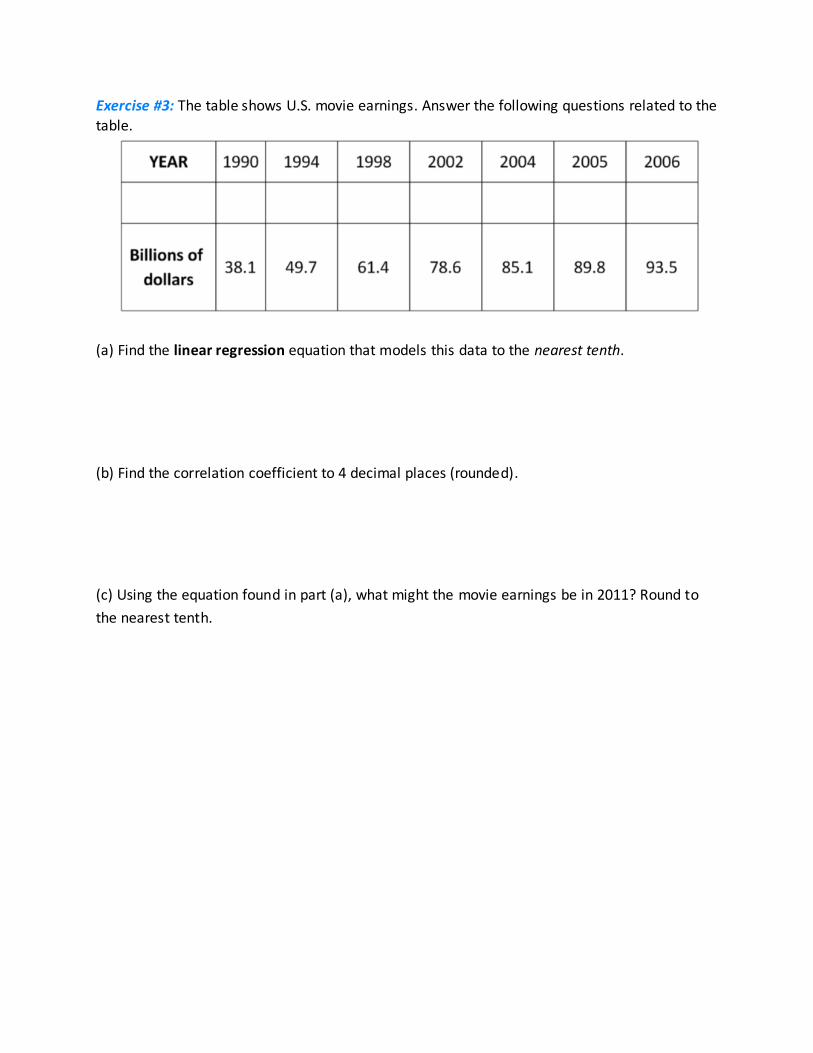
Exercise #3: The table shows U.S. movie earnings. Answer the following questions related to the
table.
(a) Find the linear regression equation that models this data to the nearest tenth.
(b) Find the correlation coefficient to 4 decimal places (rounded).
(c) Using the equation found in part (a), what might the movie earnings be in 2011? Round to
the nearest tenth.
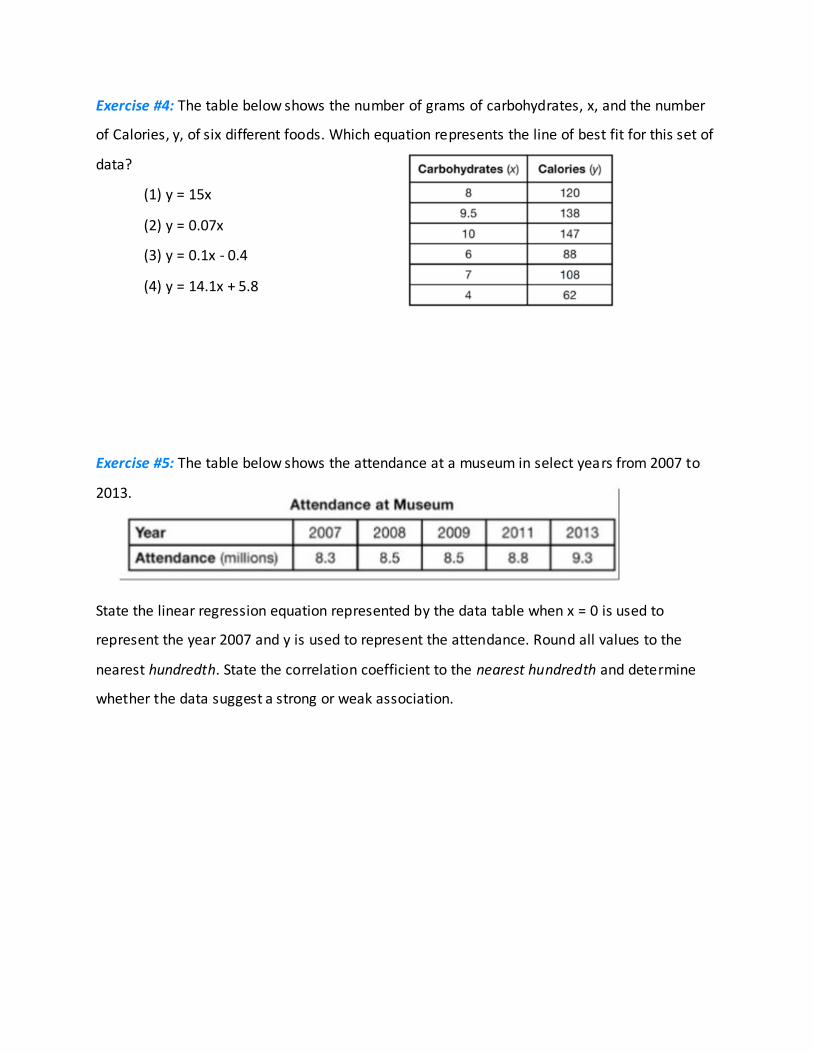
Exercise #4: The table below shows the number of grams of carbohydrates, x, and the number
of Calories, y, of six different foods. Which equation represents the line of best fit for this set of
data?
(1) y = 15x
(2) y = 0.07x
(3) y = 0.1x - 0.4
(4) y = 14.1x + 5.8
Exercise #5: The table below shows the attendance at a museum in select years from 2007 to
2013.
State the linear regression equation represented by the data table when x = 0 is used to
represent the year 2007 and y is used to represent the attendance. Round all values to the
nearest hundredth. State the correlation coefficient to the nearest hundredth and determine
whether the data suggest a strong or weak association.
Chapter 16
Lesson 7: Homework
Linear Regression and the Line of Best Fit
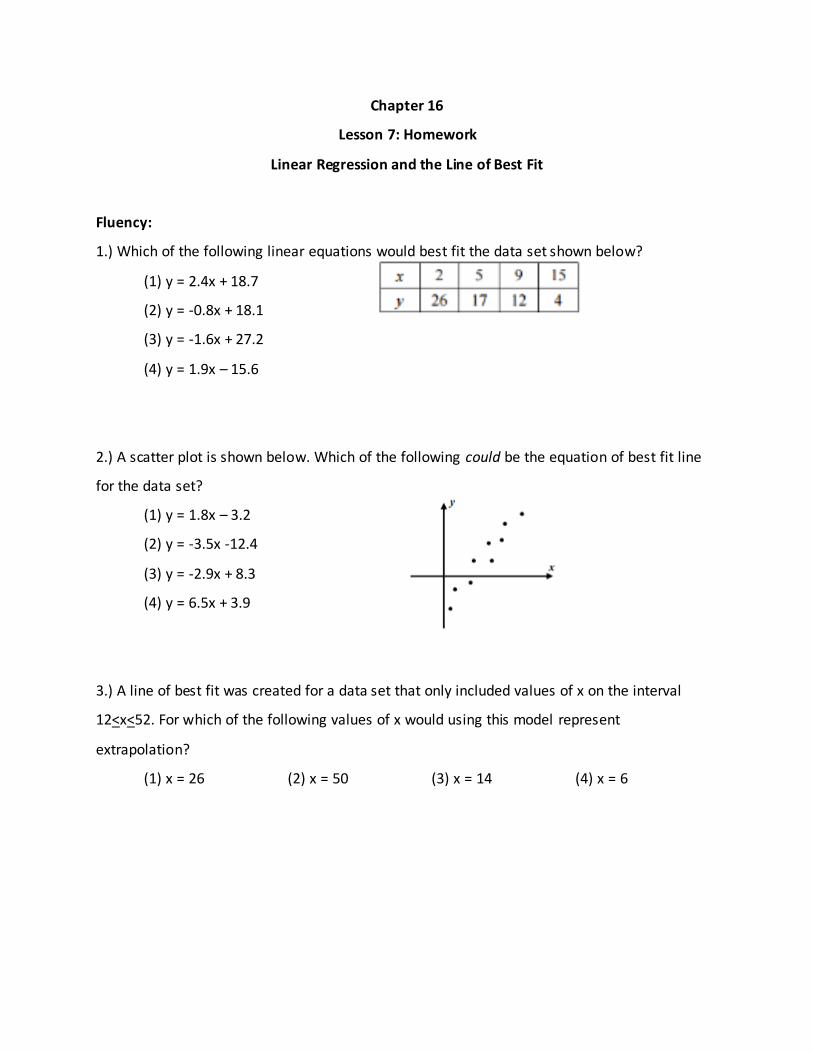
Fluency:
1.) Which of the following linear equations would best fit the data set shown below?
(1) y = 2.4x + 18.7
(2) y = -0.8x + 18.1
(3) y = -1.6x + 27.2
(4) y = 1.9x – 15.6
2.) A scatter plot is shown below. Which of the following could be the equation of best fit line
for the data set?
(1) y = 1.8x – 3.2
(2) y = -3.5x -12.4
(3) y = -2.9x + 8.3
(4) y = 6.5x + 3.9
3.) A line of best fit was created for a data set that only included values of x on the interval
12<x<52. For which of the following values of x would using this model represent
extrapolation?
(1) x = 26 (2) x = 50 (3) x = 14 (4) x = 6
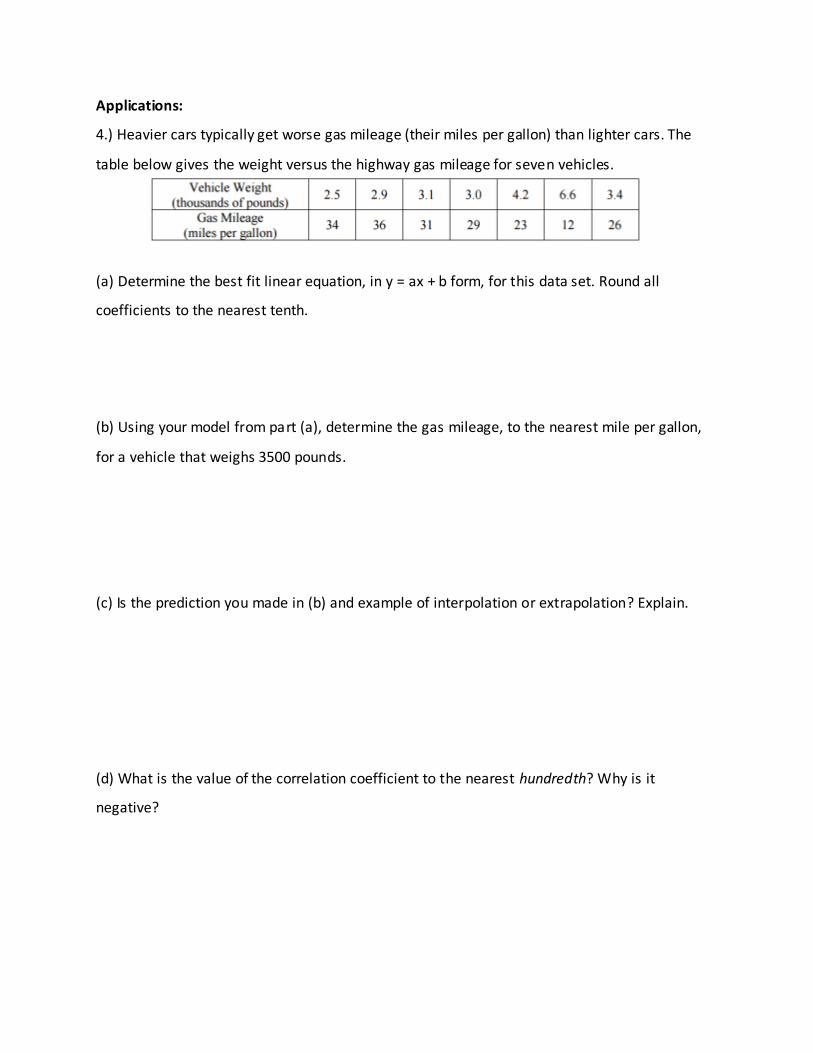
Applications:
4.) Heavier cars typically get worse gas mileage (their miles per gallon) than lighter cars. The
table below gives the weight versus the highway gas mileage for seven vehicles.
(a) Determine the best fit linear equation, in y = ax + b form, for this data set. Round all
coefficients to the nearest tenth.
(b) Using your model from part (a), determine the gas mileage, to the nearest mile per gallon,
for a vehicle that weighs 3500 pounds.
(c) Is the prediction you made in (b) and example of interpolation or extrapolation? Explain.
(d) What is the value of the correlation coefficient to the nearest hundredth? Why is it
negative?
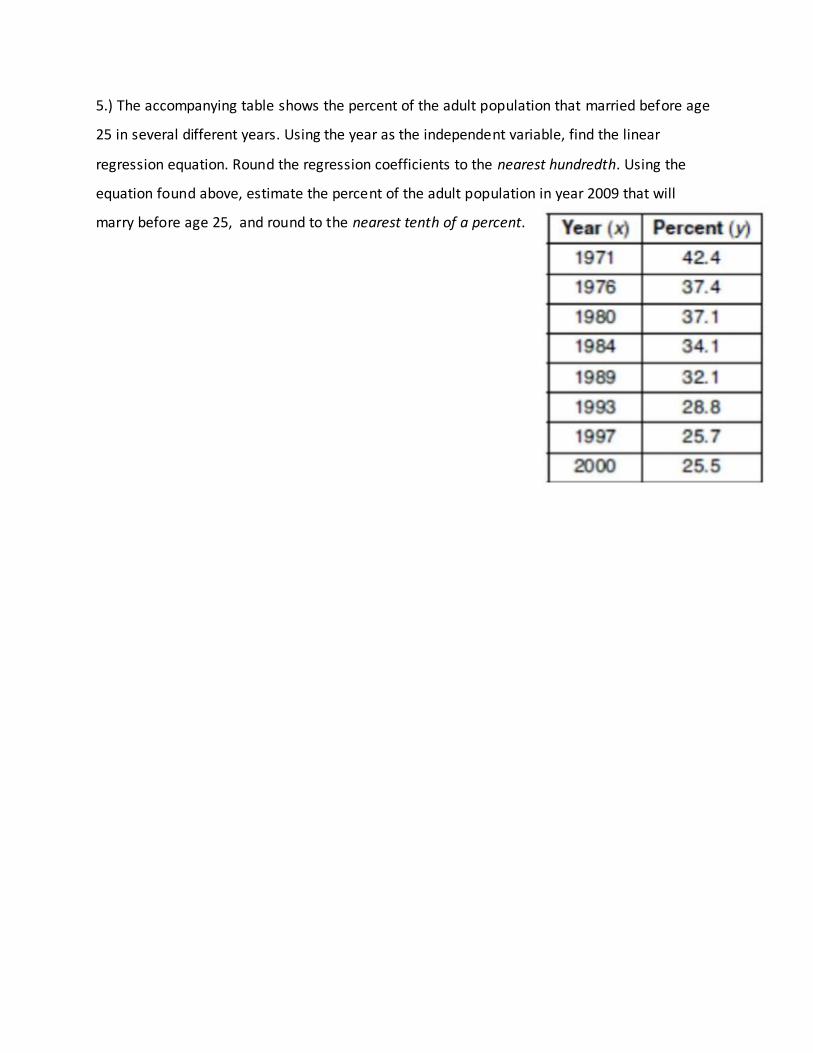
5.) The accompanying table shows the percent of the adult population that married before age
25 in several different years. Using the year as the independent variable, find the linear
regression equation. Round the regression coefficients to the nearest hundredth. Using the
equation found above, estimate the percent of the adult population in year 2009 that will
marry before age 25, and round to the nearest tenth of a percent.
Chapter 16
Lesson 8
Other Types of Regressions
Just as we fit data with a linear model we can also fit data with other mathematical models. The
process is done the same way. Two of those models are exponential regression and sinusoidal
regressions.
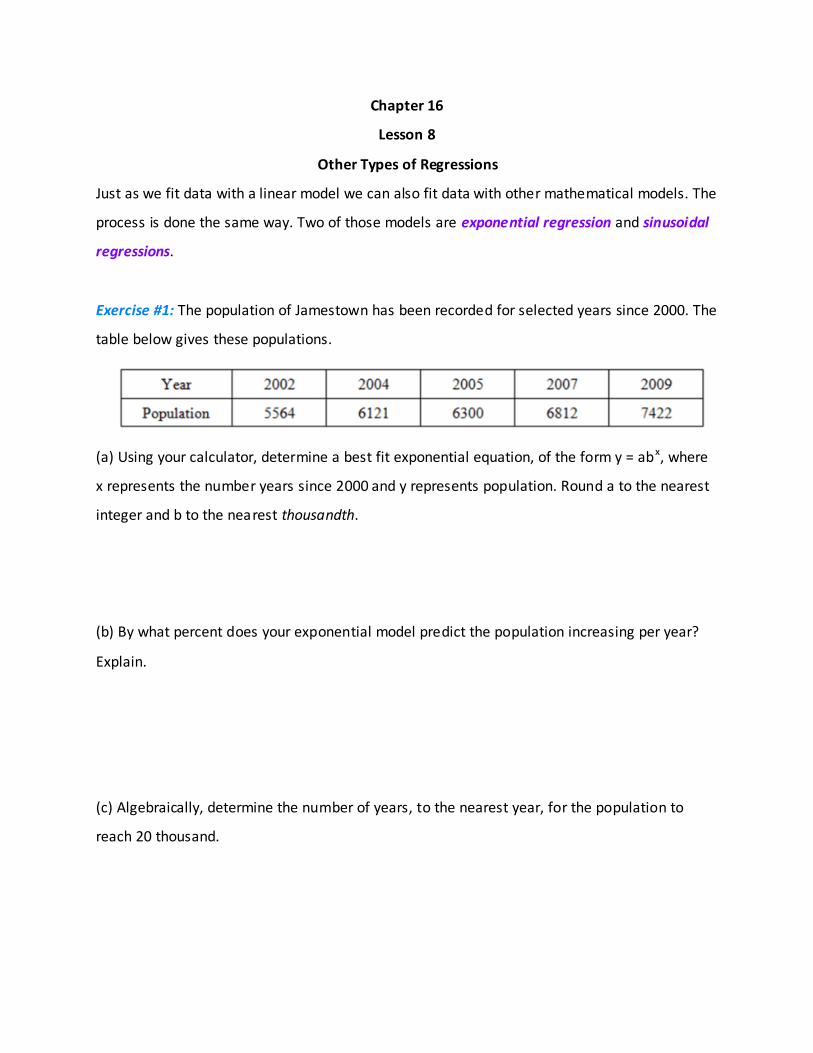
Exercise #1: The population of Jamestown has been recorded for selected years since 2000. The
table below gives these populations.
(a) Using your calculator, determine a best fit exponential equation, of the form y = abx, where
x represents the number years since 2000 and y represents population. Round a to the nearest
integer and b to the nearest thousandth.
(b) By what percent does your exponential model predict the population increasing per year?
Explain.
(c) Algebraically, determine the number of years, to the nearest year, for the population to
reach 20 thousand.
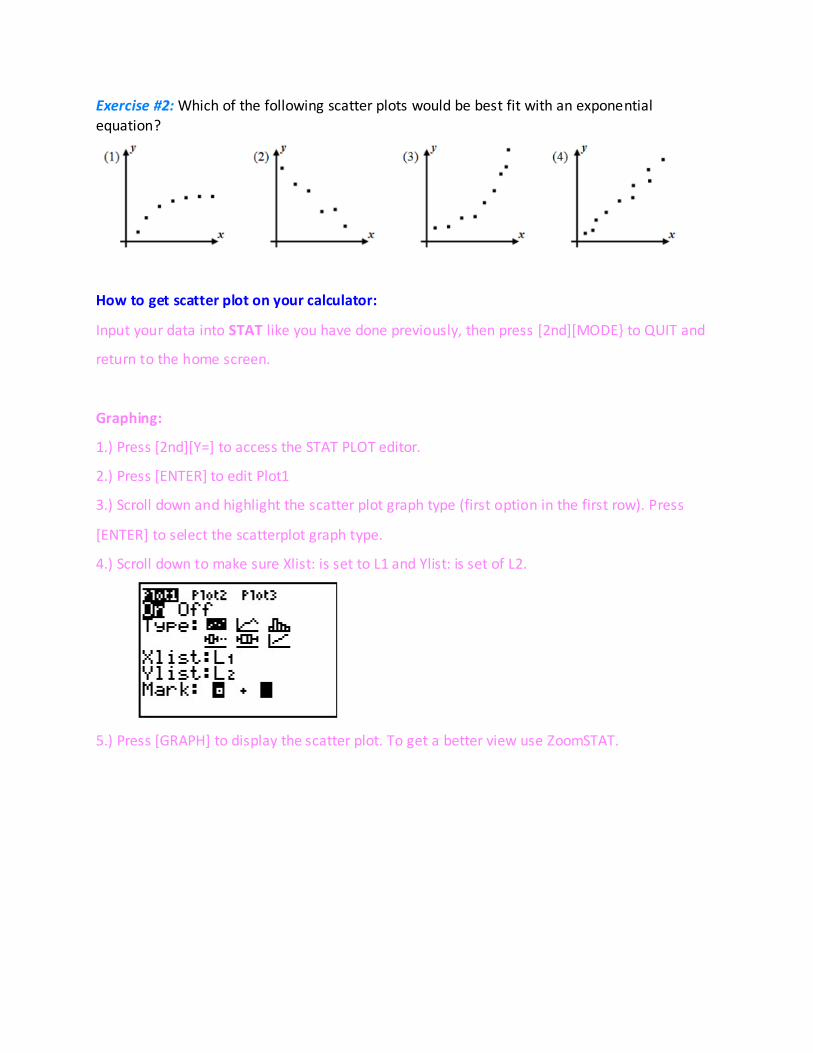
Exercise #2: Which of the following scatter plots would be best fit with an exponential
equation?
How to get scatter plot on your calculator:
Input your data into STAT like you have done previously, then press [2nd][MODE} to QUIT and
return to the home screen.
Graphing:
1.) Press [2nd][Y=] to access the STAT PLOT editor.
2.) Press [ENTER] to edit Plot1
3.) Scroll down and highlight the scatter plot graph type (first option in the first row). Press
[ENTER] to select the scatterplot graph type.
4.) Scroll down to make sure Xlist: is set to L1 and Ylist: is set of L2.
5.) Press [GRAPH] to display the scatter plot. To get a better view use ZoomSTAT.
Recall: Sinusoidal, or trigonometric, functions are periodic in nature (the cycles repeat). We use
sinusoidal regressions when the situations appear to be cyclic. In order to do sinusoidal
regressions our calculators must be in radian mode.
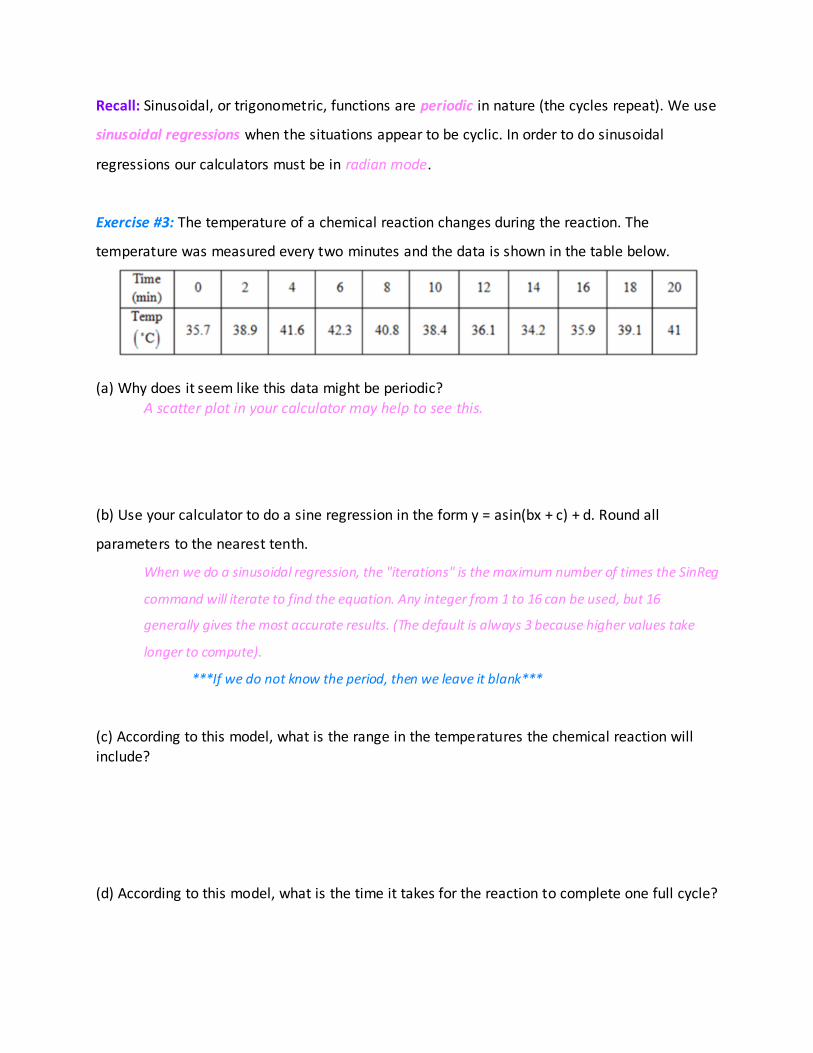
Exercise #3: The temperature of a chemical reaction changes during the reaction. The
temperature was measured every two minutes and the data is shown in the table below.
(a) Why does it seem like this data might be periodic?
A scatter plot in your calculator may help to see this.
(b) Use your calculator to do a sine regression in the form y = asin(bx + c) + d. Round all
parameters to the nearest tenth.
When we do a sinusoidal regression, the "iterations" is the maximum number of times the SinReg
command will iterate to find the equation. Any integer from 1 to 16 can be used, but 16
generally gives the most accurate results. (The default is always 3 because higher values take
longer to compute).
***If we do not know the period, then we leave it blank***
(c) According to this model, what is the range in the temperatures the chemical reaction will
include?
(d) According to this model, what is the time it takes for the reaction to complete one full cycle?
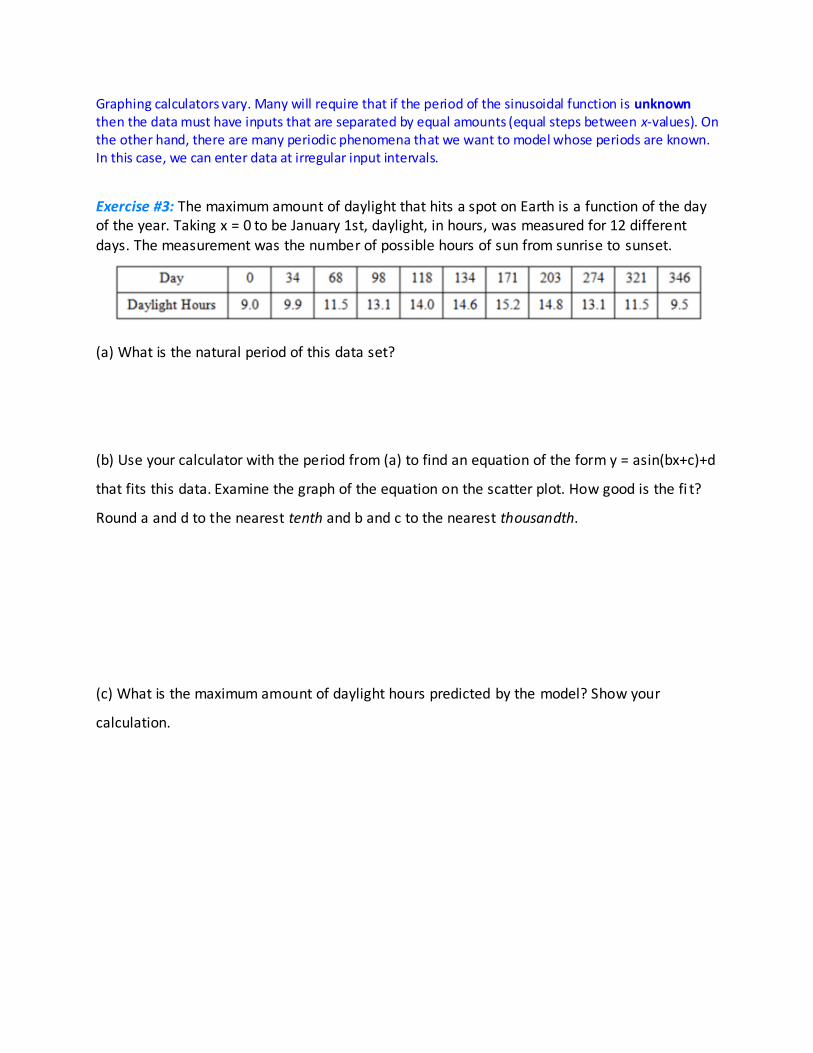
Graphing calculators vary. Many will require that if the period of the sinusoidal function is unknown then the data must have inputs that are separated by equal amounts (equal steps between x-values). On the other hand, there are many periodic phenomena that we want to model whose periods are known. In this case, we can enter data at irregular input intervals.
Exercise #3: The maximum amount of daylight that hits a spot on Earth is a function of the day of the year. Taking x = 0 to be January 1st, daylight, in hours, was measured for 12 different days. The measurement was the number of possible hours of sun from sunrise to sunset.
(a) What is the natural period of this data set?
(b) Use your calculator with the period from (a) to find an equation of the form y = asin(bx+c)+d
that fits this data. Examine the graph of the equation on the scatter plot. How good is the fi t?
Round a and d to the nearest tenth and b and c to the nearest thousandth.
(c) What is the maximum amount of daylight hours predicted by the model? Show your
calculation.
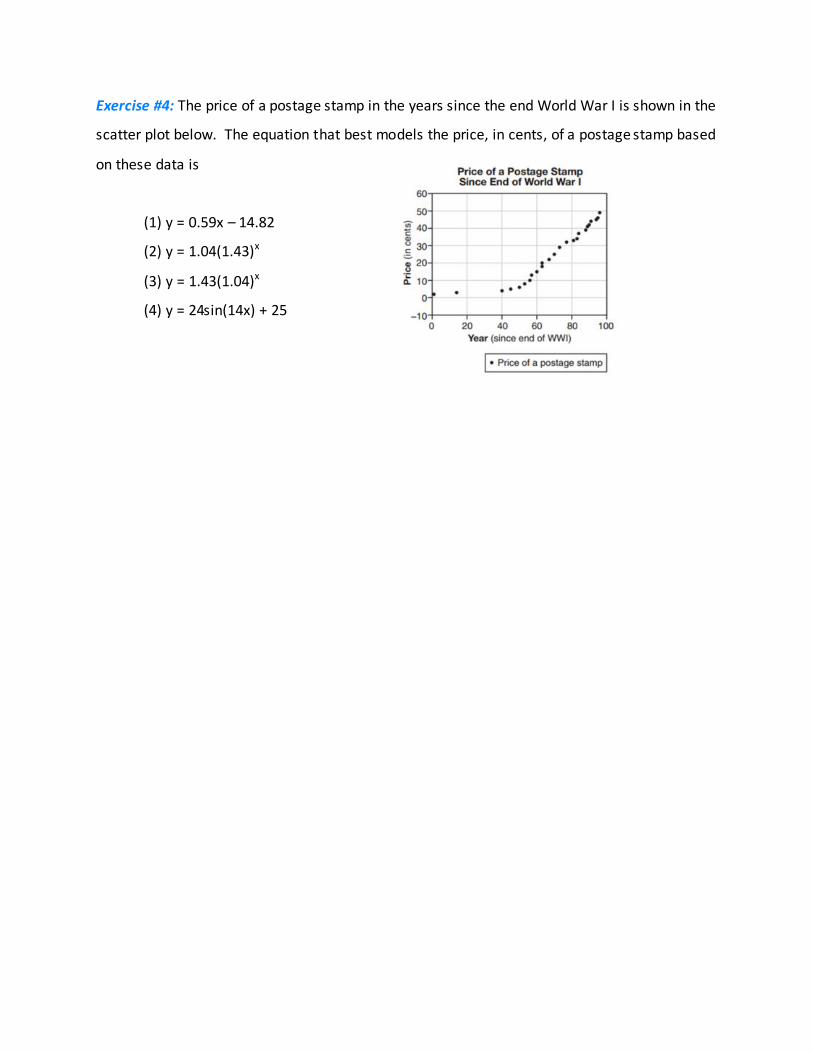
Exercise #4: The price of a postage stamp in the years since the end World War I is shown in the
scatter plot below. The equation that best models the price, in cents, of a postage stamp based
on these data is
(1) y = 0.59x – 14.82
(2) y = 1.04(1.43)x
(3) y = 1.43(1.04)x
(4) y = 24sin(14x) + 25
Chapter 16
Lesson 8: Homework
Other Types of Regressions
Fluency:
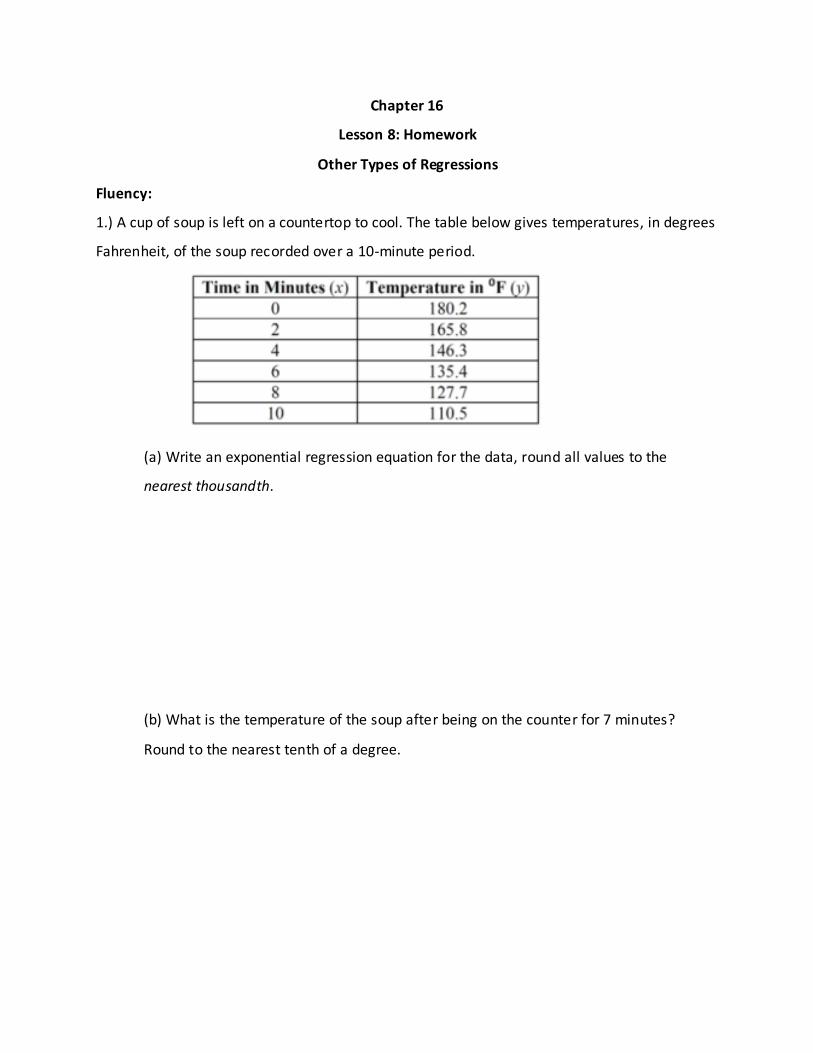
1.) A cup of soup is left on a countertop to cool. The table below gives temperatures, in degrees
Fahrenheit, of the soup recorded over a 10-minute period.
(a) Write an exponential regression equation for the data, round all values to the
nearest thousandth.
(b) What is the temperature of the soup after being on the counter for 7 minutes?
Round to the nearest tenth of a degree.
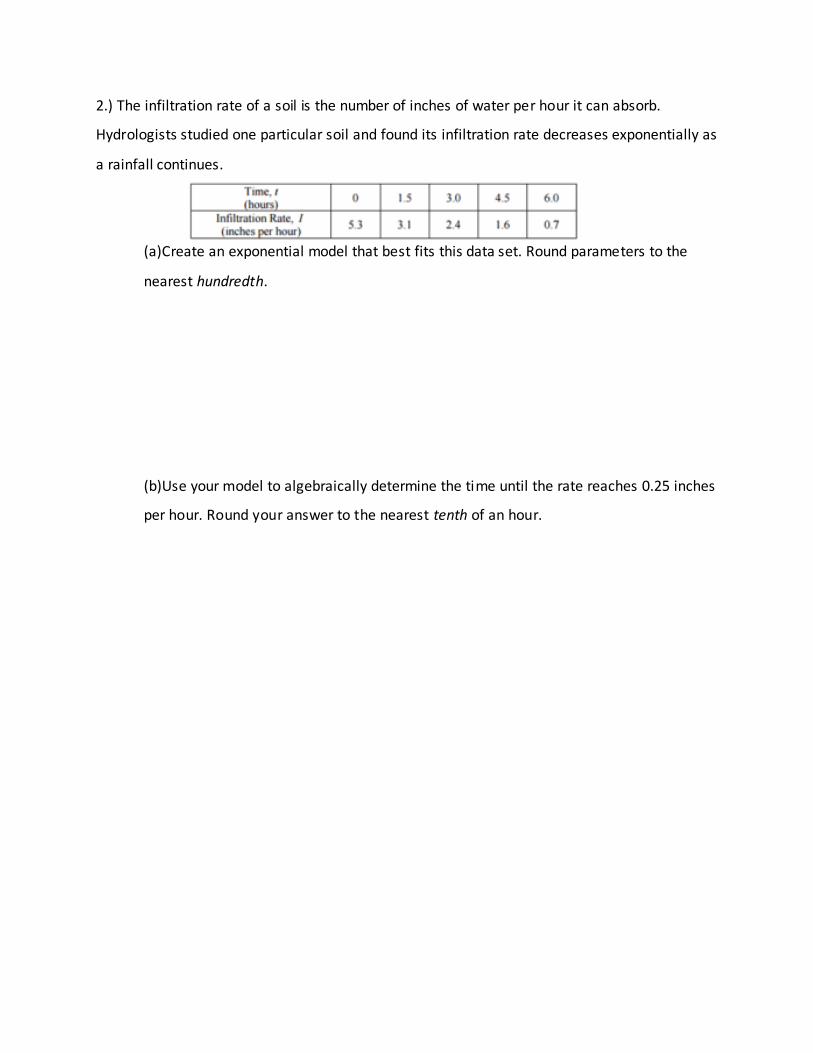
2.) The infiltration rate of a soil is the number of inches of water per hour it can absorb.
Hydrologists studied one particular soil and found its infiltration rate decreases exponentially as
a rainfall continues.
(a)Create an exponential model that best fits this data set. Round parameters to the
nearest hundredth.
(b)Use your model to algebraically determine the time until the rate reaches 0.25 inches
per hour. Round your answer to the nearest tenth of an hour.
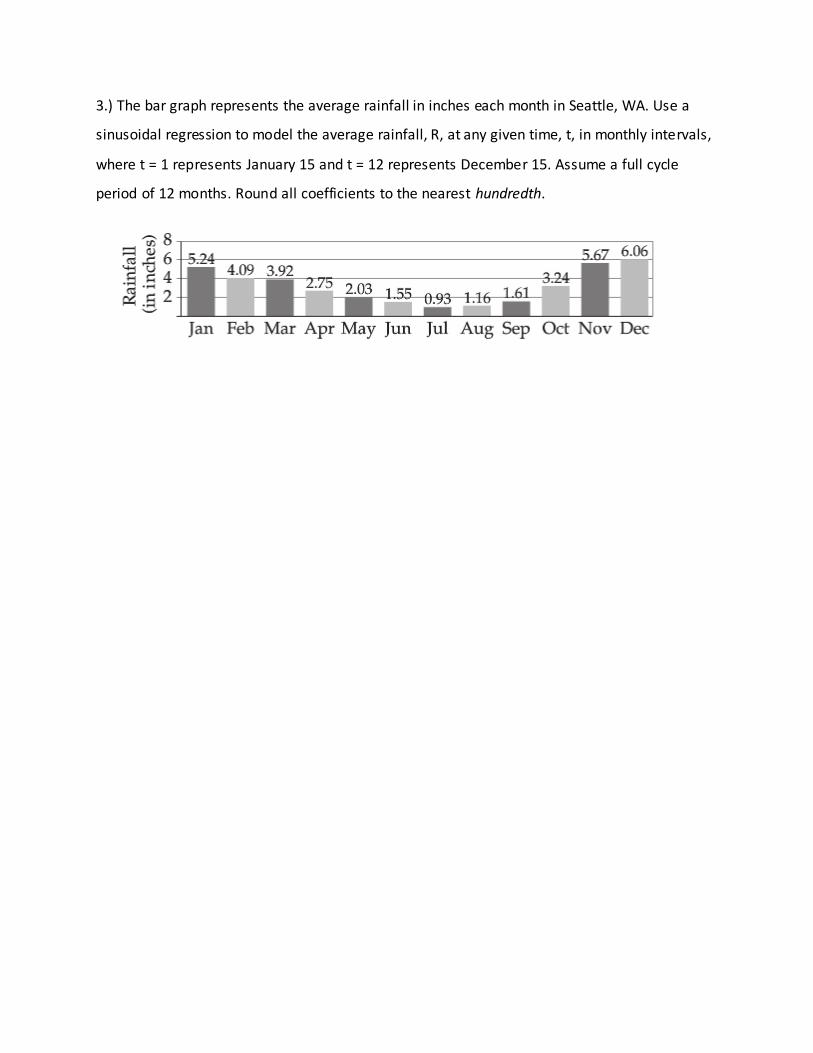
3.) The bar graph represents the average rainfall in inches each month in Seattle, WA. Use a
sinusoidal regression to model the average rainfall, R, at any given time, t, in monthly intervals,
where t = 1 represents January 15 and t = 12 represents December 15. Assume a full cycle
period of 12 months. Round all coefficients to the nearest hundredth.
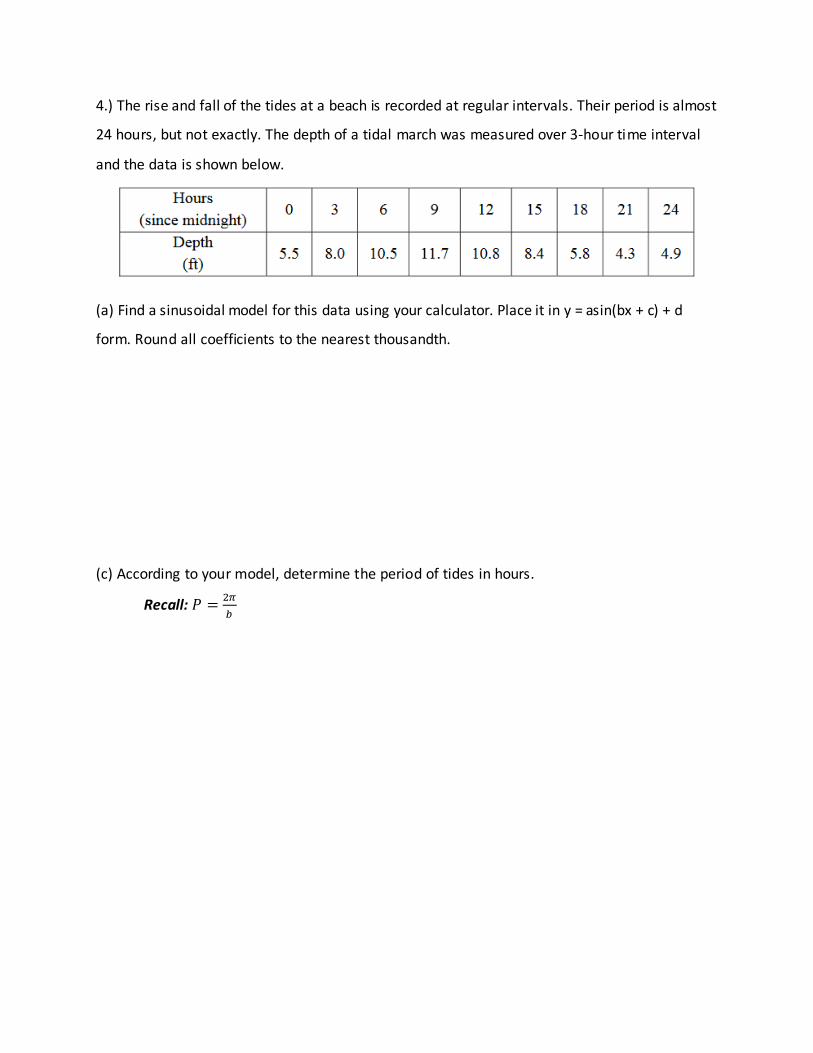
4.) The rise and fall of the tides at a beach is recorded at regular intervals. Their period is almost
24 hours, but not exactly. The depth of a tidal march was measured over 3-hour time interval
and the data is shown below.
(a) Find a sinusoidal model for this data using your calculator. Place it in y = asin(bx + c) + d
form. Round all coefficients to the nearest thousandth.
(c) According to your model, determine the period of tides in hours.
Recall: