Embed Size (px)
Citation preview

415
17 Sensory Evaluation in Fruit Product Development
Deborah dos Santos Garruti, Heliofábia Virginia de Vasconcelos Facundo, Janice Ribeiro Lima, and Andréa Cardoso de Aquino
CONTENTS
17.1 Introduction.................................................................................................. 41617.2 ClassificationofSensoryMethods............................................................... 417
17.2.1 DiscriminationTests......................................................................... 41717.2.2 DescriptiveTests............................................................................... 41917.2.3 AffectiveTests.................................................................................. 421
17.2.3.1 PreferenceTests................................................................. 42217.2.3.2 AcceptanceTests................................................................ 42217.2.3.3 QualitativeAffectiveTests................................................ 425
17.3 PlanningSensoryTestsinaProductDevelopmentProgram....................... 42517.4 DevelopingaTropicalFruitNectar:ACaseStudy...................................... 43017.5 TrendsinConsumerResearch...................................................................... 432
17.5.1 GettheConsumertoDescribe.......................................................... 43217.5.1.1 FlashProfile....................................................................... 43217.5.1.2 Check-All-That-Apply(CATA).......................................... 43217.5.1.3 FreeListing........................................................................ 43317.5.1.4 ProjectiveMapping............................................................ 43317.5.1.5 IdealProfiles...................................................................... 434
17.5.2 UnderstandingConsumers................................................................ 434Acknowledgments.................................................................................................. 435References.............................................................................................................. 435

416 Advances in Fruit Processing Technologies
17.1 INTRODUCTION
Letusnotforgetthatthemillionsofdollarsinvestedinourbusinessesdependonthatsmallfeelingthatourproductsevokeinourcustomers’mouth
(Platt)
Wedon’tsellproducts,wesellsensoryproperties
(Alejandra Muñoz)
Basedonthesethoughts,wehavetoagreewithMeilgaardetal.(1999)thatthepri-maryfunctionofsensorytestingistoprovidereliabledataonwhichsounddecisionsmaybemade. It isan integrated,multidimensionalmeasurewith three importantadvantages: it identifies thepresenceofnotabledifferences, identifiesandquanti-fiesimportantsensorycharacteristicsinafastway,andidentifiesspecificproblemsthatcannotbedetectedbyotheranalyticalprocedures,asconsumerpreference,forinstance(NakayamaandWessman,1979).Comprisingasetoftechniquesforaccu-rate measurement of human responses to foods under minimum potentially bias-ingeffectsonconsumerperception,sensoryanalysisattemptstoisolatethesensoryproperties of foods themselves and provides important and useful information toproductdevelopers,foodscientists,andmanagersaboutthesensorycharacteristicsandacceptabilityoftheirproducts(LawlessandHeymann,1999).
Demands for sensory methodology and technology have grown tremendouslyaroundtheworld,duemainlytotheadventoftotalquality.Inaddition,theneedforunderstandingpeopleasconsumersissomethingthathasbeenconstantlygrowingandbecomingatargetofallfoodindustry.Sensoryanalysisfitsintothiscontextasananalyticaltoolusedtotranslatethelinkbetweenfoodproductsandtheconsumer,expressingnumericalvaluesthatcanbeanalyzedandverifyingitsaccuracythroughstatistical support. Nowadays, most large consumer food companies have depart-mentsdedicatedtosensoryevaluation.
Theimportanceofsensoryanalysisinthefruit-basedfoodsectorisunquestion-able,giventhevarietyofapplicationsinfoodscienceresearch,productdevelopment,andqualitycontrol:
• Improvementofplantvarietiesandproductionsystems,selectionofsourcesofsupply
• Improvement/developmentofnewproductsandprocesses• Productmodificationsderivedfromsubstitutionofingredientsandsuppli-
ers,changesinprocessingandpackaging,andcostreduction• Formulationofaproductsimilartoamarketleader• Nutritionalenrichment• Determinationofshelflife• Developmentofqualitystandards• Quality control (raw material and suppliers, processing, end product,
packaging)• Market control (determination of product’s acceptability and consumer
preferences,determinationofmarketsegmentation)

417Sensory Evaluation in Fruit Product Development
However,aquestionarises:whydowehavetodosensoryanalysis?Whycannotwemonitorthosechangesbyanalyticalmeans?Theproblemisthatsensoryqualityisnotanintrinsicpropertyofafooditem.Itistheresultofaninteractionbetweenfoodand thehumanbeing.Aparticular foodhas itsstructural,physical,andchemicalproperties thatdetermine itssensorycharacteristics,whilemancarries itscultureandfoodhabits.Itisalsoimportanttoconsiderhispsychologicalconditionwhenheisanalyzingtheproduct,whichisinfluencedbyhisemotionalstateandphysiologi-calandsocioeconomicconditionssuchasage,sex,education,income,anddegreeofurbanizationamongothers.
Insum,thesensoryqualityofaproductisthewayhumansperceivethem.Andhumanperceptionsaretheresultsofcomplexprocessesthatinvolvesensoryorgansandthebrain.Itnowbecomesclearthatsensoryqualitymustbemeasuredbysen-sorytechniques.Onlyhumansensorydataprovideinformationonhowconsumersperceiveorreacttofoodproductsinreallife.Instrumentalmeasurementsareusefulonlywhentheyshowgoodcorrelationwithsensorydata(Schiffman,1996).
However,whenmanisusedasameasuringinstrument,strictcontrolofthecondi-tionsoftestsapplicationandmethodologytobeusedisrequired,inordertoavoiderrorsofpsychologicalorphysiologicalnature.Theprinciplesandpracticesofsen-soryevaluationgivestrictrulesforthepreparation,coding,andservingofsamplesundercontrolledconditionssothatthebiasingfactorsareminimizedandusetech-niquesdrawnfrombehavioralsciencethatallownumericaldatatobecollectedandstatisticallytreated,establishinglawfulrelationshipsbetweenproductcharacteris-ticsandhumanperception.
17.2 CLASSIFICATION OF SENSORY METHODS
Insensoryevaluation,scientificmethodsareusuallyclassifiedaccordingtotheirpri-maryobjective(Table17.1).Twotypesofmethodsaregenerallyrecognizedbythesensoryscientists,analyticmethodsandaffectivemethods,whichcomprise threeclassesoftests:discriminative,descriptive,andaffectivetests.Moredetaileddiscus-sionsandexplanationsonhowtoconduct,analyze,andinterpreteachmethodaregivenbyAmerineetal.(1965),Moskowitz(1983),StoneandSidel(1993),LawlessandHeymann(1999),Meilgaardetal.(1999).
17.2.1 Discrimination tests
Discrimination or Discriminative tests answer whether any noticeable differenceexistsamongproducts. It ispossible for twoormore samples tobephysicallyorchemically different, but this difference may not be perceived by humans. If thedifferenceamongsamplesisverylargeandobvious, thendiscriminativetestsarenotnecessary.Forexample,usethesetests ifproductsresultingfromachangeiningredients,processing,packaging,orstorageshowsubtledifferencesandyouwanttoknowiftheywillbeperceptibletopeople.
Discriminationtestsarealsocalleddifferencetests.Meilgaardetal.(1999)sub-dividethemintooverallanddirectionaldifferencetests.
418 Advances in Fruit Processing Technologies
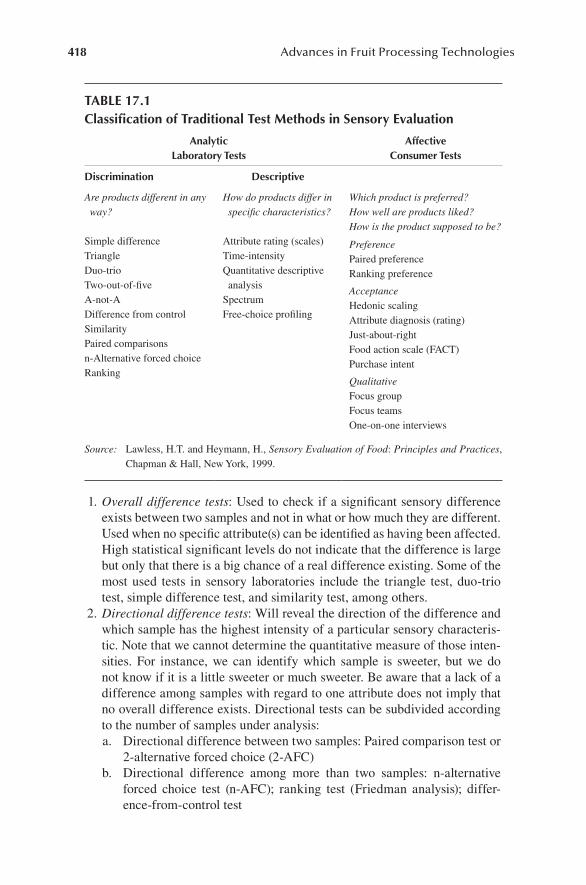
1.Overall difference tests:Usedtocheckifasignificantsensorydifferenceexistsbetweentwosamplesandnotinwhatorhowmuchtheyaredifferent.Usedwhennospecificattribute(s)canbeidentifiedashavingbeenaffected.Highstatisticalsignificantlevelsdonotindicatethatthedifferenceislargebutonlythatthereisabigchanceofarealdifferenceexisting.Someofthemostused tests in sensory laboratories include the triangle test,duo-triotest,simpledifferencetest,andsimilaritytest,amongothers.
2.Directional difference tests:Willrevealthedirectionofthedifferenceandwhichsamplehasthehighestintensityofaparticularsensorycharacteris-tic.Notethatwecannotdeterminethequantitativemeasureofthoseinten-sities. For instance, we can identify which sample is sweeter, but we donotknowifitisalittlesweeterormuchsweeter.Beawarethatalackofadifferenceamongsampleswithregardtooneattributedoesnotimplythatnooveralldifferenceexists.Directionaltestscanbesubdividedaccordingtothenumberofsamplesunderanalysis:
a. Directionaldifferencebetweentwosamples:Pairedcomparisontestor2-alternativeforcedchoice(2-AFC)
b. Directional difference among more than two samples: n-alternativeforced choice test (n-AFC); ranking test (Friedman analysis); differ-ence-from-controltest
TABLE 17.1Classification of Traditional Test Methods in Sensory Evaluation
AnalyticLaboratory Tests
AffectiveConsumer Tests
Discrimination Descriptive
Are products different in any
way?
How do products differ in
specific characteristics?
Which product is preferred?
How well are products liked?How is the product supposed to be?
SimpledifferenceTriangleDuo-trioTwo-out-of-fiveA-not-ADifferencefromcontrolSimilarityPairedcomparisonsn-AlternativeforcedchoiceRanking
Attributerating(scales)Time-intensityQuantitativedescriptiveanalysis
SpectrumFree-choiceprofiling
PreferencePairedpreferenceRankingpreference
AcceptanceHedonicscalingAttributediagnosis(rating)Just-about-rightFoodactionscale(FACT)Purchaseintent
QualitativeFocusgroupFocusteamsOne-on-oneinterviews
Source: Lawless,H.T.andHeymann,H.,Sensory Evaluation of Food:Principles and Practices,Chapman&Hall,NewYork,1999.

419Sensory Evaluation in Fruit Product Development
17.2.2 Descriptive tests
Thesecondmajorclassofsensorytestscomprisesmethodsthatquantifytheper-ceivedintensitiesofthesensorycharacteristicsofaproduct.Theseproceduresareknownasdescriptiveanalyses.Alldescriptiveanalysismethodsinvolvethedetec-tionandthedescriptionofboththequalitativeandquantitativesensoryaspectsofaproduct.Trainedpanelistsdescribethesensoryattributesofasample,oftencalleddescriptors.Inaddition,theyratetheintensityofeachdescriptortodefinetowhatdegreeitispresentinthatsample.Meilgaardetal.(1999)explainshowtwoproductsmaycontainthesamequalitativedescriptors,butmaydiffermarkedlyintheinten-sityofeach,thusresultinginquitedifferentandeasilydistinctivesensoryprofiles.
Descriptiveanalysesarethemostsophisticated,comprehensive,andinformativesensoryevaluationtool.Thesetechniquesallowthesensoryscientisttoobtaincom-plete sensorydescriptionofproducts andhelp identifyunderlying ingredient andprocess variables andother researchquestions in food product development.Theinformationcanbe related toconsumeracceptanceand to instrumentalmeasuresbymeansof statistical techniques suchasmultivariate regressionandcorrelation(Murrayetal.,2001).
Quantitative descriptive analysis or QDA, developed by Stone et al. (1974), isstillthemostuseddescriptivemethod.Duringseveraltrainingsessions,thesensorypanelisexposedtomanypossiblevariationsoftheproductandhasthetaskofgen-eratingasetofterms(descriptors)thatdescribedifferencesamongsamples.Then,throughconsensusjudgesestablishdefinitionsforeachtermandreferencestandardsthat should be used to calibrate the intensity scales. However, the actual productevaluation is performed by each judge individually, in booths. Unstructured linescales,anchoredwithintensityterms,alsogeneratedbythepanel(e.g.,weak–strong)areused, allowingQDAdata tobe analyzedbybothunivariate andmultivariatestatisticaltechniques:ANOVAofeachdescriptor,multivariateanalysisofvariance,principalcomponentanalysis(PCA),factoranalysis,clusteranalysis,andmanyoth-ers.Graphicalrepresentationofthedataisusuallydonebyradarplots,alsoknownas“cobwebgraph”or“stardiagram”(Figure17.1).
Today many product development groups use variations of QDA. The relativesimplicityofthistechniqueallowsittobeadaptedinmanydifferentways;however,anyadaptationinvalidatestheuseofthenameQDAtodescribetheprocedure.
Infree-choiceprofiling,developedbyWilliamsandArnold(1984),thereislit-tleornotrainingatall.Itallowsthepaneliststouseasmanytermsastheywanttodescribe thesensorycharacteristicsofasetofsamples.Thedataareanalyzedbygeneralizedprocrustesanalysis (GPA) (Gower,1975),amultivariate techniquethatadjustsfortheuseofdifferentpartsofthescalebydifferentpanelistsandthenmanipulatesthedatatocombinetermsthatappeartomeasurethesamecharacteris-tic.Thistechniqueisveryusefulinstabilitystudies,wherewedonotknowaprioriwhatsensorycharacteristicswillbedevelopedinthesamples,andsowecannottrainjudgestorecognizeandmeasurethem.Itisalsohelpfulinconsumerstudieswheretheobjectiveistoinvestigatehowconsumersperceivetheproducts.
Measuring a single descriptor of interest, using scales to express the inten-sity of a perceived attribute (sweetness, hardness, smoothness, etc.), is also a

420 Advances in Fruit Processing Technologies
descriptive technique. The most known scales are category scales, line scales,andmagnitudeestimationscales,butmethodsofscalingareunderintensivestudyaround theworld:cross-modalitymatching (StevensandMarks,1980), labeledmagnitude scale (Green et al., 1993, 1996), indirect scaling using Thurstonianmodel(BairdandNorma,1978;Frijtersetal.,1980;BrockoffandChristensen,2010),amongothers.
However,perceptionoftastes,flavors,andtextureinfoodsisadynamicphe-nomenondue to thedynamicnatureofprocessesofbreathing,chewing, saliva-tion,swallowing,temperaturechanges,andtonguemovements(DijksterhuisandPiggott, 2001). By means of conventional scaling methods, panelists can onlymake a static measurement, which can be a function of an integral of the per-ceptionover time,or,moreoften, a response to thehighest intensityperceived.In manycases,thismaybetheonlyinformationrequiredbutinothersituationsitisimportanttoknowwhenthesensationstarts,whenitreachesthemaximumintensity,andhowlong itsduration is.Typicalexamplesarechewinggumsandextrudedsnacks.Inthefirstone,theflavorhastoremainaslongaspossible,andintheotheronetheflavorneedsto“explode”inthemouthandextinguishquickly.Time-intensity(T-I)sensoryevaluationprovidestheopportunitytoscaletheper-ceivedsensationsovertime.Today,severalcommercialsensoryanalysissoftwarebring T-I scales, but it is possible to develop your own software to collect T-Idata.AnexampleistheSCDTI—Sistema de Coleta de Dados Tempo-Intensidade(inPortuguese),whichmeansT-Idatacollectingsystem,developedat theStateUniversityofCampinas, Brazil.
T-Ianalyseshavebeenwidelyusedinstudiesofsensoryresponsetosugar-freefoods, since they have to mimic all the sucrose sweetness sensations. Bitternessand astringency in several productshave alsobeen investigatedby time-intensityanalysis.
Visual consistency
Dark spots
Lumps
Bacuri odor
Sweet odor
Green odorPungent odor
Bacuri taste
Sweet taste
Acid taste
Consistency
Sweet aftertaste
Astringent tasteColor
FIGURE 17.1 Star diagram of sensory profile of bacuri nectars by descriptive analysis.—10%pulpwithoutenzyme;—20%pulpwithpectinase1andcellulase;—20%pulpwithpectinase2andcellulase.

421Sensory Evaluation in Fruit Product Development
17.2.3 affective tests
Nowadays, it is crucial that the industry understands the consumers’ needs andtheirdesiresandexpectationsabouttheproducts.However,tomaketheconsumerdescribeisnotalwayseasy,aspeoplegenerallyhavedifficultyinclearlydescribingwhattheywant.Itisveryimportant,then,tohavecleargoalsandusesimplemeth-odstomatchtheproducts’characteristicstotheconsumer’sexpectation.
The sensory tests that assess subjective personal responses of customerstowardaproductarecalledaffectivetests.Affectivetestsmeasureattitudessuchasacceptanceandpreference.Preference testsdeterminethecustomer’sprefer-enceofaproductovertheother(s).Acceptancetestsquantifythedegreeoflikingordisliking.
Whenever an affective test is conducted, a groupof subjects must be selectedasasampleofthetargetpopulation,thatis,thepopulationtowhomtheproductisintended.Thereisnosenseintestingtheacceptabilityofaproductwithpeoplewhodonotlikeordonotusethatkindofproduct.Inaddition,formulatingaproductforelderlypeopleisdifferentfromformulatingproductsforteenagers,forexample.Inthesamerespect,developingproductsforconsumersinahighlyurbanizedareamaybedifferentfromdoingitforpeopleinaruralzone.
Affective testsmaybedesignedas in-housepanels (in the lab)orashall tests(conductedatcentrallocationslikefairs,supermarkets,etc.),alsocalledconsumertests.Asageneralrule,onecanusein-housepanelsformostjobsandthencalibrateagainstconsumertestsassoonaspossible.Somekindofproductsrequiremorethanthat—requiringthattheproductbetestedunderitsnormalconditionsofuseattheconsumer’shome(homeusetestsorhomeplacementtests),whereheisanactiveagent,preparing,serving,proving,andevaluatingallaspectsofproducts:package,preparation instructions, sensoryattributes,quantityof theportion,andother rel-evantquestions.
Typically,anaffective testmayinvolvefrom50to100consumers in labtests,until300to500incentrallocationandhomeusetests.Thelargersizeofanaffec-tivetestarisesduetothehighvariabilityofindividualpreferencesandthusaneedtocompensatewithincreasednumbersofpeopletoensurestatisticalpowerandtestsensitivity(LawlessandHeymann,1999).
It is crucial to note that finding no significant preference/acceptance for onesampleoveranotherdoesnotmeanthattherearenoperceptibledifferencesamongsamples.Onecanequallylikebothorangeandmangojuices,butstilltheorangewillbedifferentfrommango!
Otherusualmistakesintheinterpretationofresultsare,whenonesampleratesorscoreshigherpreference/acceptancethananother,toconcludethat“productXwasbetter”thantheother.Affectivetestsdonotmeasurequality.Asitwasalreadymen-tioned,byaffectivetestswemayassesssubjectivepersonalresponsesofaspecificgroupofcustomerstowardaproduct.Thinkaboutaproductyoulikealot.Letussayitisafruitcandy.Probablyitisnotthebestcandyintheworld,maybeitistoohard,ortoosticky,butitistheoneyoulikebest.Then,therightconclusionwouldbe“productXwaspreferred”or“productXwasmostaccepted”andnot“wasbetter”because“better”impliesqualityjudgment.

422 Advances in Fruit Processing Technologies
Commontobothpreferenceandacceptancetestsisaproblemwiththeunivariateanalysesofdata.Thereisanimplicitassumptionthatallsubjectsexhibitthesamebehaviorandthatasinglevalueisrepresentativeofallsubjects.However,individu-als’opinionsvaryorclusterintosimilargroups,andiftheyshowoppositeopinionsabout the products, mean values will be similar for all products. Although thiswouldsuggestthattherewasnodifferenceinacceptabilityamongtheproducts,thiswouldclearlynotbetrue.Onesolution,whenworkingwithalargenumberofprod-ucts(minimum6),istouseamultivariatestatisticalanalysiscalledpreferencemap-ping(MacFieandThomson,1988).Thebasicdataarecollectedbyalargernumberofsubjectsandthenindividualdifferencesarenotaveraged,butarebuiltintothemodelandplayanintegralroleinthefittingalgorithm.Inthecasedescribedearlier,preferencemappingwouldshoweachindividualresponseandindicatethedifferentopinionsofthetwogroupsveryclearly.
GreenhoffandMacFie(1994)explainthetwodistinctwaysofdealingwiththedata, includingcase studies: internalpreferencemap (MDPREF),whichachievesa multidimensional representation of the stimuli, based only on the acceptance/preferencedata;andexternalpreferencemap(PREFMAP),whichrelatesproductacceptabilitytoamultidimensionalrepresentationofstimuliderivedfromdescrip-tiveanalysisorinstrumentaldata.
17.2.3.1 Preference TestsWhentheobjectiveistolookforthepreferenceofoneproductorformulationagainstanother, as in product improvement or comparison with a competitive brand, thetechniqueusedisthepairedpreferencetest,similartothepairedcomparisontest.Judgesreceivetwocodedsamplesandmustchoosethesamplethatispreferred.Itisasimpletest.Choiceisanevery-daytaskforconsumers.Whentheresearchrequiresassessingthepreferenceamongmorethantwosamples,onecandoseriesofpairedpreferences,butarankingpreferencetestistimesavingandeasiertointerpret.Thismethodisalsoaforcedchoice,sincetheparticipanthastorankseveralproductsineitherdescendingorascendingorderofpreferenceandisnotallowedtohavetiesintheranking.Theproblemwithchoicetestsisthattheyarenotveryinformativeabouthowwelltheproductswerelikedbytheconsumers.Ifallproductsarebad,participantswillchoosetheleastbadproduct.
17.2.3.2 Acceptance TestsWhen it becomesnecessary todeterminehowwell theproduct is likedby con-sumers, we will have to collect hedonic or attitude responses from consumersusingscales.Fromrelativeacceptancescores,onecaninferpreference;thesamplewiththehigherscoreispreferred.However,notalwaysasinglemeasureoflikinganddislikingwhena food is tasted in isolation represents the real feelingaboutit.People’shistoricalpreferencesmayfail topredict theiracceptance forcertainfoodsorbeverages inanactual tasting(CardelloandMaller,1982).Contextandexpectationscanaffectsimplehedonicjudgments(DelizaandMacFie,1996).Forthisreason,hedonic testscanbecomplementedbyother tests like theoneswithappropriatenessapproach(whatjudgethinksisagoodproduct)andotherbehavior-allyorientedtests.

423Sensory Evaluation in Fruit Product Development
17.2.3.2.1 Hedonic ApproachThemostpopularscaleamongsensoryanalystsisthe9-pointhedonicscale(Figure17.2A),developedattheU.S.ArmyfoodandContainerInstitute(Jonesetal.,1955;PeryamandPilgrim,1957).Thismethodprovidesabalancedscaleforlikingwithcategorieslabeledwithadverbsthatrepresentpsychologicallyequalintervals,withacenteredneutralpoint.Thus,thisscalehasruler-likeproperties,whoseequalinter-vals favor theassignmentofnumericalvalues to the responses and the statisticaltreatmentofthedata.
However, ithasbeencriticized fora long time forpresentinga seriesof limi-tations. Themainproblems are related to the lackof requirements demanded byparametricstatisticalanalysesthatareoftenappliedtothedata.The9-pointhedonicscaleisacategoryscale,andassuch,generatesdiscretedata.Italsofrequentlyfailstosatisfythestatisticalassumptionsofnormality,homoscedasticity,andadditivityrequiredbytheAnalysisofVariancemodels(McPhersonandRandall,1985;Pearceetal.,1986;Vieetal.,1991).Withaviewtoovercomingtheseproblems,variousauthorshaveproposedalternativemethodstogenerateandstatisticallyanalyzesen-sorydata(Miller,1987;GayandMead,1992;WilkinsonandYuksel,1997).
Villanuevaetal. (2000)compared theperformanceof the9-pointhedonicscaleandself-adjustingscale(Figure17.2B),withreferencetothediscriminativepowerandstatisticalassumptionsrequiredbytheusualANOVAmodels,underrealconsumertestconditions.Inaposteriorwork(Villanuevaetal.,2005),thesameauthorsproposedahybridhedonicscale(Figure17.2C).Althoughthemeanvaluesderivedfromeachscale,foreachsample,wereverysimilar,the9-pointhedonicscaleshowedthesmall-eststandarddeviationvalues.However,thisscalepresentedproblemswiththeinequal-ityofsample’svariances(lackofhomoscedasticity).Theself-adjustingscalepresentedproblemswithnonnormalityoftheresiduals.Forthisreason,thesignificancelevelsassociatedwiththeFsamplesvalues,forbothscales,areonlyapproximate.Theauthors
Name: __________________________________
Name: _____________________________________Age: _______ Date: _______
Name: ____________________________________Age: _______ Date: _______
Age: ______________ Date: ________________
Sample number: ________
Sample: ________
You are receiving --- codi�ed samplesof ---. Please TASTE them from left to right andcheck the box that best describes your overallopinion of each sample.
You are receiving --- codi�ed samples of ---. Please TASTE the samples from left to right and evaluate them in OVERALL ACCEPTANCE. First choose the sample that you liked most and then that you liked least and mark their codes respectively in the right and left extremes of the scale below. Following, evaluate the remaining samples, comparing them with that placed in the extremes, marking an “x” and the sample code at the point on the scale you think that, comparatively, it best represents how much you liked or disliked each sample.
You are receiving --- codi�ed samples of ---. Please TASTE them from left to right and mark an “x” at any point on the scale (including between dots) which best represents how much you liked or disliked each sample with respect to OVERALL ACCEPTANCE.
Like extremelyLike very muchLike moderatelyLike slightlyNeither like nor dislikeDislike slightlyDislike moderatelyDislike very muchDislike extremely
Like least
(A) (C)
(B)Like most
X
0 5 10
X
Dislikeextremely
Neither likenor dislike
Likeextremely
FIGURE 17.2 Example of hedonic scales: (A) 9-point hedonic scale; (B) self-adjustinghedonicscale;(C)hybridhedonicscale.

424 Advances in Fruit Processing Technologies
suggestthatthesedatashouldnotbeanalyzedbystatisticalmethodsbasedonassump-tionsofnormalityandhomoscedasticitybutbymeansofalternativeproceduressuchasgeneralizedlinearmodels(GLM),analysisofcategoricaldata,nonparametrictests,ordatatransformationfornormality.Infact,whenproceedinganalysisofvariance,oneshouldalwayscarryoutfirstacheckingoftheresidualsinordertofindoutanymodel inadequaciesorviolationsof theANOVAmodel’sassumptions.Thus,whentheANOVAmodelisappropriate,advantagesaretakenofthegreatersimplicityandclarityofinterpretationthatitprovides.Byitsturn,thehybridhedonicscaledatawereshowntobeadequateinthisdiagnosisoftheANOVAmodel.Thisscalealsopresentedaslightlysuperiordiscriminativepowerthantheothertwo.
Villanueva and Da Silva (2009) studied the performance of these three scalesalsoregardingthegenerationoftheinternalpreferencemap(MDPREF).Therewerestrongsimilaritiesamongtheproductspaces,buttheMDPREFobtainedfromthehybridscaleshowedaslightsuperiorityoverthe9-pointhedonicandself-adjustingscaleswithrespecttosamplesegmentation,consumersegmentation,numberofsig-nificantdimensions,andtheproportionofsignificantlyfittedconsumers.
However, in those works, authors mentioned that additional experiments mustbecarriedouttoconfirmtheresultssofar.Inouropinion,differencesinthescales’performancearenotbigenoughtojustifyanystrongendorsementofthehybridscalenoranycondemnationof the traditional9-pointscale.This isalso theopinionofLawless(2010).Infact,wehavefoundthehybridscalemoredifficulttouseforbothconsumersandtechnicians.Ifthelabfacilitiesdonothavesoftwaretocollectdata,itwillbenecessarytousearulertomeasureeachrespondent’sevaluationsheet.
Hedonicscalingcanalsobeappliedtochildrenandilliteratepeople.Ithasusedfacescales,cartoonscharacters,orrealisticpicturesofchildrenoradultfaces,rep-resentingeachoneoftheverbalpoints.Inmanycases,thesescalesdonotperformwell.Kroll(1990)showedthatverbaldescriptorsof“good”and“bad,”theso-calledP&Kscale,workedbetter forchildren.Below4–5yearsold, acceptancemustbeinferredfrombehaviors,suchasoralinterviewsandadlibidumsituationsorbytheamountofingestionfromastandardizedsample.
17.2.3.2.2 Appropriateness ApproachAspartofaconsumertest,researchersoftendesiretodeterminethereasonsforanypreference or rejection by asking additional questions about the sensory attributes.Meilgaardetal.(1999)usedcategoryandlinescalestoassesstheintensityofspecificattributesandcalleditattributediagnosis.Forexample,thequestionwouldbe“Howintenseisthesweetnessofthisjuice?”Andthescalewouldvaryfrom“veryweek”to“verystrong.”Differently,just-rightscales(Vickers,1988),alsoknownasjust-about-right,assesstheintensityofanattributerelativetosomementalcriterionofthesubjectsfortheproductthatisunderanalysis.Example:forthesamequestiongivenearlieraboutthesweetnessofthejuice,thescalewouldvaryfrom“notatallsweetenough”to“muchtoosweet,”withamiddlepointcorrespondingtotheidealsweetness(“justright”).
17.2.3.2.3 Behavioral ApproachThefoodactionscale(FACT)developedbySchutz(1965)isanexampleofabehav-ioralapproach toassessingfoodacceptability. It isbasedonconsumers’attitudes

425Sensory Evaluation in Fruit Product Development
inrelationtothefrequencyatwhichtheywouldbewillingtoconsumetheproductinagivenperiod.Examplesofcategorylabelsareasfollows:“IwouldeatiteveryopportunityIhad”and“IwouldeatitonlyifIwereforcedto.”FACTscaleisrecom-mendedfortestingproductswithwhichconsumersarenotfamiliar.
PurchaseintentscalesareverysimilartoFACTscales,basedonconsumers’atti-tudesinrelationtotheirwillingnesstobuytheproductifitwasforsale.Examplesofcategorylabelsinclude“Icertainlywouldnotbuyit”;“Iprobablywouldbuyit”;and“Icertainlywouldbuyit.”
17.2.3.3 Qualitative Affective TestsQualitativemethodsareused to studyconsumerhabits andattitudes thatmaybeusefulinpredictingthebehaviorofconsumersandtodeveloptheterminologyusedbythemtodescribethesensoryattributesoftheconceptorprototypeofaproduct.Themaininterestofthesetestswouldgeneratethemostvariedandpossibleideasandreactionsonagivenproduct.Itisquiteusefulinproductdevelopment.Insmallgroupsor individual interviews, consumers verbalize their opinions and expecta-tionsabout theproduct.Themostused techniques so farare focusgroups, focusteams,andone-on-oneinterviews(McQuarrieandMcIntyre,1986;McNeilletal.,2000;BrusebergandMcDonagh-Philp,2002).Inthefocusgrouptechnique,agroupofparticipants,usually6–8,sit togetherforamoreor lessopen-endeddiscussionaboutaproductoraspecifictopic.Thediscussionmoderatorletsparticipantsintro-ducethemselvesandfeelcomfortableandmakessurethatthetopicsofsignificancearebroughtup.Tohelpparticipantsverbalizetheirneeds,interactionamonggroupmembersisencouraged.Theproductsmayormaynotbeserved.Thereportsum-marizeswhatwassaidandperhapsdrawsinferencesfromwhatwassaidandleftunsaidinthediscussion.Generally,thesessionsarevideotaped.
17.3 PLANNING SENSORY TESTS IN A PRODUCT DEVELOPMENT PROGRAM
Sensoryresultsareonlyusefulwheninterpretedinthecontextofhypotheses,back-groundknowledge,andimplicationsfordecisionsandactionstobetaken.Definingtheneedsoftheprojectisthemostimportantrequirementforconductingtherighttest.Thus,sensoryspecialistsshouldbefullpartnerswiththeirclients,takinganactiveroleindevelopingtheresearchprogram,collaboratingonthechoosingoftheattributestobeanalyzed,andsettingtheexperimentaldesigns,whichultimatelywillbeusedtoanswerthequestionsposed.Onlythroughaprocessoftotalinvolvementtheycanbeinapositiontoselectthemostappropriatetestsnecessaryateverypointofaresearchproject.Theywillalsobeabletocontributeinterpretationsandsuggestactions,sincetheybestunderstandthelimitationsoftestsandwhattheirrisksandliabilitiesmaybe.
LawlessandHeymann(1999)andMeilgaardetal.(1999)presentsomeguidelinesandgeneralstepsforchoiceoftechniques(Figure17.3),remindingusthatthoserulesaregeneralizationsandsometimesthegoals,requirements,andresourcesavailablein a particular situation will dictate deviations of those principles. Figure 17.3Ashowsasensoryevaluationflowchart,withanoverviewofthetasksanddecisionsinsettingupandconductingasensorytest.

426 Advances in Fruit Processing Technologies
1.Problem definition:Firstofall,definetheproblem.Wemustdefinewhatwewanttomeasure.Startanalyzingthenatureoftheprojectandwhatisexpectedfromthesamples.Forexample,isitanewproductdevelop-ment;productimprovement;ingredients,equipment,orprocesschange;orproductmatching?Aredifferencesdesirableoristheaccentonprov-ingthatnodifferenceexistsbetweenthesampleandanotherorformerproduct? Does the product vary only in one or several attributes? Isthereanycuelikecolor,consistency,orothersthatmayintroducesen-sorybiases?
2.Definition of test objective: Once the objective of the project is clearlystated, the sensory analyst and the project leader can determine the testobjective:overalldifferenceorattributedifference?determineacompletesensoryprofile?andrelativepreferenceoracceptability,etc.?
However,manyprojectsneedasequenceoftestsforachievingthegoalratherthanasingletest.Itisasequentialdecisionprocessasinanyotherproblem-solvingactivity.Figure17.3Bshowstheflowofasensoryevalu-ating testing program during product development/product improvementprojects.First,defineexactlywhatsensorycharacteristicsneed improve-mentorneedtobeevaluated,thendeterminethattheexperimentalprod-uct is indeeddifferent,andfinallyconfirmthat theexperimentalproductis liked better than the control. If working with ingredients, equipment,
Sensory evaluation �owchart
Problem denition
Test objective denition
Methods selection
Panel selection
Experimental design
Conducting experiment
Statistical analyses
Reporting results
Sensory testing sequence
Bench-top testing
Di�erence test with lab panel
Descriptive tests
Hedonic testspilot consumer panel
Central location or home testswith representative consumers
Shelf-life determination
(A) (B)
FIGURE 17.3 Generalguidelinesinsensoryevaluation:(A)Tasksanddecisionsinsettingupandexecutingasensorytest;(B)Theflowofasensoryevaluationtestingprogram.(FromLawless, H.T. and Heymann, H., Sensory Evaluation of Food: Principles and Practices,Chapman&Hall,NewYork,1999;Meilgaard,M.etal.,Sensory Evaluation Techniques,CRCPress,BocaRaton,FL,1999.)

427Sensory Evaluation in Fruit Product Development
orprocess changes confirm thatnodifferenceexists, and if adifferencedoesexist,determinehowconsumersviewthedifference.
a. Bench-top testing: This test is mandatory to get familiar with prod-uctattributes;choosetheonesthatwillbeevaluatedandcheckifsen-soryvariationsareobviousoradifferencetestisneeded.Allsensorypropertiesshouldbeexamined:appearance,aroma,basictastes,flavor,texture,mouthfeelings,aftertastes,andaftermouthfeelings.Productsvary inwhichattributes?Oneattributemay influence theanalysisofotherattributes?
b. Difference tests:Althoughourultimateinterestmaylieinwhethercon-sumerswilllikeordislikeanewproductvariation,wemustconductasimpledifferencetestfirsttoseewhetheranychangeisperceivableatall.Thelogicinthissequenceisthefollowing:Ifascreenedandexpe-rienceddiscriminationpanelcannottellthedifferenceundercarefullycontrolled conditions in the sensory lab, then a more heterogeneousgroupof consumers is unlikely to see adifference in their less con-trolledandmorevariableworld.Ifnodifferenceisperceived,therecanlogicallybenosystematicpreference.Soamoretime-consumingandcostlyconsumertestcansometimesbeavoidedbyconductingasimplerbutmoresensitivediscriminationtestfirst.
c. Descriptive tests:Ifadifferenceexists,itisusuallynecessarytoknowthe sensory profile of prototypes or monitoring specific attributes inordertoevaluatetheeffectofprocessoringredientvariations.Inthiscase,descriptivetestsshouldbeapplied.Thissensoryprofilewillalsobeuseful indetermining the specific reasons as towhyaproduct ispreferredovertheothers.
d. Affective tests:Pilot consumer panels.Consumersensoryevaluationisusuallyperformedtowardtheendoftheproductdevelopmentorrefor-mulation cycle. At this time, the alternative product prototypes haveusuallybeennarroweddowntoamanageablesubsetthroughtheuseofanalyticalsensory tests.With in-housepanelsexploredegreesof lik-ing/dislikingandidentifypotentialproblemsforrework.Ingeneral,aproducttestedundertrueconditionswillnotgivethesameresultasaproducttestedbypilotpanels.However,testinginpilotpanelswillhelptoselectsamplesthatshouldbeevaluatedinrealconditionstests,whicharetimeconsumingandinvolvehighercostandlogistics.
e. Affective tests:Central location panels.Centrallocationevaluationisused toanswer thequestion: Iswhatwefindinpilotpanels tests thesameaswhatwouldbefoundbyreal-worldconsumers?Thetestalsoexplores degrees of liking/disliking but requires time and expensesandisusuallyperformedbycompaniesthatwillactuallyintroducetheproductinthemarket.Forscientificpurposes,answersfrompilotcon-sumerpanelsarefoundtobesufficient.
f. Determination of shelf life: The sensory testing sequence usuallyends with a stability study, performed to know how product qualitychanges during storage and allows establishing shelf life. Shelf life

428 Advances in Fruit Processing Technologies
canbedefinedastheperiodbetweenmanufactureandretailpurchaseofa foodproductduringwhich theproduct isof satisfactoryquality(Dethmers,1979); inotherwords, the lengthof time for theproducttobecomeunacceptableforsale.Apracticaluseforstabilitystudiesisopendatingoffoods.Opendatesareplacedonthelabelsoffoodprod-uctstohelpconsumersinthepurchasedecision(Labuza,1982).
Sensoryanalysisisasimportantaschemical,physical,andmicro-biological analysesbecause it indicateswhether the storageproductsstillconformtostandardsforappearance,aroma,flavor,taste,texture,andfunctionality.Besides,sensoryanalysisindicateswhetherthefoodisstillacceptabletotheconsumers.
3.Methods selection a. Discriminative testing: The issue here is the kind of difference you
wanttoinvestigateandthenumberofsamples,asstatedearlier.Iftheobjectiveis tochecktheoveralldifferencebetweentwosamples, tri-angletestisthemostsensitivetest,becausetheprobabilitythepanelisthas to check the odd sample by chance is one-third while in pairedcomparisonandduo-triotestsitisone-half.
However,ifthesamplesarecomplexinanywayuseduo-triotest,since the taskofcomparingsamples toastandard iseasier topanel-ists.LawlessandHeymann(1999)say thatduo-trio test isalsomoresensitivethanthetrianglewhensubjectsarefamiliarwiththereferencematerial.Forexample,ifthereferenceisaproductwithalongcompanyhistory and a great deal of ongoing evaluation, deviations from thisfamiliaritemmaybereadilynoticed.Iftheproblemreliesonasingleattribute,forced-choicetestswillbemoresensitive,sincepanelistswillfocusintheintensityofthatspecificattribute,evenifthereareothersourcesofvariation.
b. Descriptive testing:Whendifferencesinthetargetattributeareobviousamongsamples,oryouneed tomeasure thedifference inmore thanoneattribute,usedirectscaling.However,youmustfollowthedescrip-tive test methodology, since humans are not good absolute measur-inginstrumentsandneedreferencesamplesofwhatisalowintensityandwhatisahighintensityofthoseattributesinthatspecificproduct.Panelistswillcalibratethemselvesaccordingtothatframeofreferencesandwillbeabletobecomeagoodrelativemeasuringinstrument.
ChooseQDAoroneofitsfreeadaptationswhenacompletesensoryprofileof thesamples isneeded, inorder tospecify thenatureofallsensory changes or differences in a set of samples. Sensory profilescanalsobecorrelated toaffectivedata to investigate the reasons forpeople’slikingsanddislikingaboutasetofproducts.
c. Affective testing:Affective testsbring theconsumer into theproductdevelopment.Chooseacceptancetesttodeterminehowwelltheprod-uctislikedbyconsumers.Forexample,hownectarblendsfromvari-ous fruitswillbeacceptable toconsumerswhoareused todrinking

429Sensory Evaluation in Fruit Product Development
traditionalone-fruitnectar.Choosepreferenceteststodeterminepref-erenceofoneproductagainstanother.Forexample, todecidewhichsweetenerispreferablewhenformulatingasugar-freefruitjam.
d. Shelf-life tests:Theselectionofaparticularsensoryevaluationproce-dureforevaluatingproductsinstorageisdeterminedbythetestpur-pose.Acceptabilityassessmentbyuntrainedpanelsisessentialforopendating.Discriminative testswith trainedpanels areusefulwhenonecharacteristicismoreimportantthanothersorwhensomedegradationproblemsarealreadyexpected.Descriptiveanalysiscanbeusedwithnewproducts,whenthereisnoinformationonthebehavioroftheprod-uctunderstorage.
Dependingon the foodcharacteristics, several failure criteria canbe used to terminate a shelf-life study (Labuza and Schmidl, 1988).Besidesmicrobiologicalgrowthandphysicalchanges,therearemanysensorycriteriatodeterminetheendofthetest(Gacula,1975):
i. Anincreaseordecreaseinxnumberofunitsinameanpanelscore.Forexample, inshelf-lifedatingofoils,anincreasein2unitsofoxidationflavorbya trainedpanelmaydetermine theendof thetest.
ii. Failuretime,whenasamplereachesanaveragepanelscore.Thiscriterionisusefulwhenoverallacceptanceisusedinthestabilitytest.Forexample,whena4.5scoreisobtainedina9-pointscaleforastoredjuice.
iii. Justnoticeabledifference,whenthedifferencebetweenthequalityofsamplesintestandcontrolsamplescanbedetectedbytrainedpanels.Inthiscase,acontrolthatcanbemaintainedwithonlyneg-ligiblechangeovertimeisessential.
iv. Resultsofaprofiledescriptiveanalysis.Comparisonbetweenpro-filesbeforeandafter storagemaybeused to indicatechanges inimportantcharacteristics.
Aquestioninstabilityexperimentsiswhetherwereallyneedtoknowthetrueendofshelflifeofaproduct.Usually,theanswerisnegative.Mostofthetime,theproducersneedtheassurancethattheproductwillbeacceptableifitisheldinthedistributionsystemforagivenperiodoftimeatcertaintemperatureandhumidity.Forthosesituations,stabilitytestscanbeplannedforaspecifictime,shorter than thatnecessary for establishing shelf life.Later, as acomplementary data, shelf life can be determined by regressiontechniquesoranyotherstatisticalapproach.
Anotherquestioniswhetherstoringofafoodproductleadsonlyto deterioration. Actually, some food products require controlledagingtodevelopcharacteristicaroma,flavor,andtexture.Themostknown examples are the aging process for wine and cheese. Inthoseproducts, sensoryanalysiscanalsobeused formonitoringtheproduct’schanges.

430 Advances in Fruit Processing Technologies
4.Panel selection:Eachkindoftestwillrequiredifferenttypesofpanelists. a. Discriminative tests:Itismandatorythatsubjectsarescreenedfornor-
malsensoryacuity,especiallyregardingvision,smell,andtaste,andfortheirabilitytodetectdifferencesamongsimilarproductswithingredi-entorprocessingvariables.Discriminationpanelscanreceivealittletraining,buttheyareusuallyonlyorientedinthetestmethod.
b. Descriptive tests: Panelists are screened for normal sensory acuity,discriminativeability,andmotivation.Descriptivepanelsaretrained,exceptinfree-choiceprofiling.Theyareaskedtoputpersonalhedonicreactionsaside,astheirjobisonlytospecifywhatattributesarepresentintheproductandatwhatlevelsofintensity,extent,amount,ordura-tion.Ithasbeenacentralprincipleinsensoryanalysisthatyoushouldnotrelyonconsumersforaccuratedescriptiveinformation.Consumersnotonlyactinanonanalyticalframeofmindbutalsooftenhavefuzzyconceptsaboutspecificattributes,confusing,sour,andbitter,forexam-ple.However,inrecentyears,someresearchersarebreakingthispara-digm,aswearegoingtoseeaheadinthischapter.
c. Affective tests:Participantsmustbechosencarefullytoensurethattheresultsgeneralizetothepopulationofinterest.Theycanberecruitedamong users or at least potential users of the new product, who arefrequentusersof similarproducts.Theypossess reasonableexpecta-tionsandaframeofreferencewithinwhichtheycanformanopinionrelativetoothersimilarproductstheyhavetried.Neveruseapanelistwhohasbeentrainedtoevaluatethatparticularproductasaconsumer,eventhoughheorsheusestoconsumethatproduct.Duringtraining,thesepanelistshavebeenaskedtoassumeananalyticalframeofmindandwillnotbeableanymoretolookatthatproductinanintegrativeform. Consumers’ reactions, on the other hand, are often immediateandbasedontheintegratedpattern,althoughtheirattentionissome-timescapturedbyaspecificaspect.
5.Experimental design 6.Conducting the experiment 7.Statistical analyses 8.Reporting results
Theselastfourstepsinvolvemanydetailsandparticularitiesthatarenotcoveredinthisbook,thoughtheymustbediscussedwiththesensoryspecialists.
17.4 DEVELOPING A TROPICAL FRUIT NECTAR: A CASE STUDY
Next,weseehowsensorytestswereconductedinanew-productdevelopingproject,helpingtomakeimportantdecisions.
Bacuri,aBrazilian tropical fruit,hasapulpwithadistinct, strong,acid-sweet,andagreeableflavor (Clement andVenturieri, 1990).However, it showsveryhighconsistency,whichhamperstheindustrialprocessingstepssuchasfiltrationandcon-centration.Inaddition,ithasnotbeenpossibleyettoelaboratebacurinectarswithin

431Sensory Evaluation in Fruit Product Development
Brazilianlegislationrequirements:30%fruitpulporatleast20%pulpforfruitswithhighconsistency(Brasil,2003).Nazaré(2000)andSilvaetal.(2007)observedgoodacceptabilityonlyforthenectarformulatedwith10%–12%pulp.Onewaytoreducethepulpconsistencyisthroughthetechnologyofenzymaticmaceration.
Atfirst,pulpwasmaceratedwithapectinase(P1),andnectarswith20%and30%maceratedpulpwereformulatedandcomparedwiththecontrolnectar(10%pulpwithoutmaceration) inabench-top testing.The formulationwith30%maceratedpulpprovedtobetooconsistentandwasdiscarded.Nectarwith20%maceratedpulpwasstillmoreconsistentthanthecontrolandalsotooacidic.
Inthenextstep,wetriedtocorrectthehighacidityaddingsugar.Weusedanin-housepaneltomakehedonicevaluations,sinceinthiscaseitmatteredtoknowhowsweetpeoplelikedthenectartobe.Wefoundthatitwasnecessarytoaddtoomuchsugartobringthenectartoagoodlevelofacceptability.
With those results,we turned to testotherenzymepreparations, searching forone thatcould reduceconsistencyanddidnotyieldsomuchacid.We tested twopectinasescombined(P1+P2)intwodifferentproportions,andeachoneofthesecombinedtoacellulase(P1+CandP2+C).Adifference-from-controltestwasper-formedwithnectarselaboratedwith20%maceratedpulps,wherethecontrolsam-plewasnectarfromP1maceratedpulp,inordertoseeifthoseformulationscouldreducetheconsistencyandacidityobservedforthisnectaronthebench-toptesting.Onlyformulationscontainingcellulaseshowedreducedconsistencyandacidity.
Acentralcompositedesignwasusedtodeterminethebestcombinationandcon-centrationsofpectinasesandcellulase.Dependentvariablesweretotalacidity,con-sistency,andsugarcontent,alldeterminedbymeansofchemicalandinstrumentalanalyses.ThebestperformanceswereobservedforP1+C(1:2)andP2+C(1:2).
Inordertoinvestigatewhetherthemacerationprocesscouldmodifysensoryprop-ertiesofbacurinectars,adescriptiveprofilewasdeterminedforproductsformulatedbytheoptimizedenzymepreparationsandcomparedwiththecontrolsample(10%nonmaceratedpulp).Figure17.1presents thestardiagram.Bothenzymeprepara-tionsproducednectarswithsimilarsensoryprofiles,butverydifferent fromcon-trolsample.Maceratednectarsreachedthesameconsistencyof10%nonmaceratedsamplebutwerestillmoreacid.Thecharacteristicaromaofbacuriwasenhanced,and panelists perceived stronger green and pungent aromas. However, they weredarkerincolorandshowedmoredarkspotsandlumps.Betweenmaceratednectars,enzymeP1causedlesslumpformation,butthenectarwasmoreacidandastringentthannectarmaceratedbyP2.
Thefinalstepwastoevaluatethenewproducts’acceptancebyconsumersandcompareitwiththewell-established10%pulpnectar.HedonictestswereperformedintwoBrazilianregions:theNorthregion,wherebacuriiswellknownandappre-ciated, and the Northeastern region, where this fruit is almost unknown. Globalacceptanceandattributeacceptancewereevaluated.Consumersfrombothregionsaccepted the macerated samples as much as the control nectar, but in the Northregion,thescoreswerehigher,asexpected.Sensoryresultsindicatedthatthisbacurinectarhasagreatpotentialinthemarket,eveninregionswhereconsumersarenotused to this fruit, and the enzymaticmaceration studies should continueuntil anoptimizedproductismade.

432 Advances in Fruit Processing Technologies
17.5 TRENDS IN CONSUMER RESEARCH
Inordertoput thebestpossibleproductonthemarketorevenachievethe“idealproduct,”itisessentialtounderstandconsumerproductperceptionandpreferencesandrelatehedonicresponsestosensoryproductspecifications(Worchetal.,2010).Newtrendsinsensoryanalysishavebeenrelatedtotwogreatchallengesforcon-sumerresearchers:(1)gettheconsumertodescribefoodpropertiesand(2)under-standconsumers’reactions(Kleefetal.,2005;Hough,2010).
17.5.1 Get the consumer to Describe
Insensoryanalysis,theclassicalapproachhasbeentouseatrainedpanelforsen-sorydescriptionofproductsandconsumersonlyforhedonicevaluations.However,descriptivemethodscanbeexpensiveandtimeconsuming(bothintermsofpanelisttrainingandtestingtime).Inaddition,itishardtomaintainatrainedpanel,espe-ciallyintheindustry,wherethereisahighturnoverofemployees.Inrecentyears,researchershavebeenbreaking theparadigmandadvocating theuseofconsum-ers to generate sensory profiling to leadproduct development. Husson and Pàges(2003)showedthatconsumersmeettherequirementsofdiscrimination,consensus,and reproducibility,Worch et al. (2009) foundno significant differencesbetweenproductsprofiledbytrainedorconsumerpanels.AlreadyknownmethodslikeKellyrepertorygrid(Kelly,1955)andmorerecentmethodshavebeenpresentedlikeflashprofile(FP),check-all-that-apply(CATA),projectivemappingtechniques,freelist-ing,andidealprofile,amongothers.
17.5.1.1 Flash ProfileFlashprofile(DairouandSieffermann,2002)isadaptedfromfree-choiceprofiling,whereuntrainedsubjects select theirown terms todescribeandevaluatea setofproductssimultaneously.Thedifferenceisthatsubjectsranktheproductsonanordi-nalscaleforeachtermtheyindividuallycreated,insteadofrating.Theyareaskedtofocusonthedescriptiveterms,notonthehedonicterms.Flashprofiling(FP)canalsobeusedattheinitialstageofaprojecttocreatethesensoryattributesfortheconventionaldescriptiveanalyses(DelarueandSieffermann,2004)andshowsprac-ticalfeasibilityintheevaluationofalargefoodproductset.Theindividualsensorymapsaretreatedwithgeneralprocrustesanalysis(GPA)tocreateaconsensuscon-figuration.ClusteranalysiscanalsobeperformedaftertheGPAonthedescriptivetermstoassistintheinterpretation.
17.5.1.2 Check-All-That-Apply (CATA)IntheCATAmethod(LancasterandFoley,2007),consumersareaskedtocheckall perceived attributes in a specific product, from a list of prechosen terms(Figure17.4).Theactualgenerationoftermscanbeperformedinmanyways:theconsumerscanchoosewordstodescribetheproductduringthetest(likeinfree-choiceprofiling), termscanbegeneratedbyconsumersnot testing theproduct(i.e.,afocusgroup),ortermscanbegivenbyatrainedpanel(descriptiveanaly-sis).CATAmethodrequiresminimalinstruction;itisrelativelyeasytoperform

433Sensory Evaluation in Fruit Product Development
andiscompletedquickly.Itisdifferentfromscalingsincenointensitiesaregiventotheattributes.Thedataareformedbythecountsorpercentagesofconsumersthatcheckedeachtermforeachsample.Frequentlylisteddescriptorswouldbemorerelevantthanthoselessfrequentlylisted.Dataareanalyzedbymultivari-atestatistical toolssuchascorrespondenceanalysisormultiple factoranalysis,generatingasensoryspacesimilartoPCA.CATAdatacanalsobeusedforthecreationofpreferencemapscorrelatinghedonicjudgmentwithsensoryattributes(Dooleyetal.,2010).
17.5.1.3 Free ListingFreelisting(Aresetal.,2010;HoughandFerraris,2010)isavariationofCATAandisalsocalledopen-endedquestion.Insteadofusingalistofterms,consum-ersareaskedtousetheirowntermstodescribethesamples.Similarwordsaregrouped,andthematrixoffrequenciesisalsoanalyzedbycorrespondenceormul-tiple factor analysis. Cluster analysis can reveal associated descriptors, becausetheyaresimilarstimuli,forexamplecrispyandcrunchy,orbecausetheybelongtosimilarcategoriesinthemindoftheconsumer,likeappleandfruity.
17.5.1.4 Projective MappingProjectivemapping(Risviketal.,1994)studiesdonotinvolvenumericaljudgments.Theyareholisticapproachesofcharacterizingsimilaritiesanddifferencesinsen-soryattributesofproductsorassessingtheirpreferenceorliking.Amongthetech-niquesthathavebeengainingpopularityarenapping(Pagès,2005),partialnapping(PfeifferandGilbert,2008),freesorting(Abdietal.,2007),andacombinationofthem called sorted napping (Lê et al., 2009). Assessors position the products onatwo-dimensionalsurface(e.g.,largesheetofpaper)accordingtooverallsensorysimilaritiesanddifferencesbeingfreetochoosethevariouscriteriausedtoseparatetheproducts(Figure17.5).Theyareoftenaskedtoenhancethemapwithdescriptiveterms for each product or drivers for liking and disliking. Multiple factor analy-sisprovidesaquickprofileshowingrelationshipbetweenproductsanddescriptors,similartoPCAresultsfromconventionalprofiling.
Check all attributes that describe this sample:
ButterySweetMilk/dairy �avorCustard/eggy �avorCorn syrupArti�cial vanillaNatural vanillaCreamy �avorSoftHardGummyIcyCreamy/smooth
FIGURE 17.4 ExampleofaCATAquestionnaire.

434 Advances in Fruit Processing Technologies
17.5.1.5 Ideal ProfilesWhilethejust-about-right(JAR)scaleonlyasksthedeviationsfromidealforeachattributeandproductcombination,intheidealprofilemethod(Punter,2008;Worchetal.,2009),bothperceivedandidealintensitiesareaskeddirectly(theJARques-tion“isitjustright,toomuch,ortoolittle”isreplacedbythequestion“howstrongisitandwhatwouldbetheidealstrength”).Worchetal.(2010)comparedtwodif-ferentmethodologiestoanalyzeJARandidealprofiledataandsuggestedPLSondummyvariables(XiongandMeullenet,2006)fortheanalysisofJARdata,andtheFishbonemethodfortheanalysisofIdealProfiledata.
17.5.2 unDerstanDinG consumers
The psychophysical approach of sensory evaluation (sensory scales) is based onthe idea that people are rational and can give explicit reasons for their behavior.However,accordingtoKoster(2009),paradigmslikeuniformity,consistency,objec-tivity,andconsciouschoicearefallaciesinhumanbehavior.Inotherwords,peoplearedifferentfromoneanotherandyoucannotaveragetheirbehavior;peoplechangetheirownbehavior,evaluationsaresubjective,andchoicesarenotalwaysrationalandconscious.Theauthorconsidersthattheuseofscalesisefficientbuttheydonotcontainallthenecessaryinformation.
Sensorysciencehasappropriatepsychophysicsandmarketingtechniquestodeter-mineconsumers’driversoflikingandpreference.Theyallowusnotonlytohearwhatpeoplesay they likeor theydobut to see their realbehavior,allowingus toobtainasnapshotofpeople’slives,theirexperiences,andtheirrelationships.Itcapturesthesubject’sinnerthoughts,feelingsandemotions,theirvalues,andrulesthatguidethem,becauseitiscarriedoutinhisorherownenvironment(Deliza,2009).Somestudiesarealsoreaching,invading,andexploringthedomesticenvironment.Tohandlethiskindofdata,somemethodshavebeenusedlikecategoryappraisal,conjointanalysis,experi-mentaldesign,focusgroup,freelisting,Bayesiannetworks,ladderingempathicdesign,andinformationacceleration.Someofthesearebrieflydiscussedinthefollowing.
Free listing can also be used to explore behaviors and habits, foods consideredappropriateforcertainusesoroccasions,andfeelingsrelatedtofoodconsumption.Forexample,asubjectcanbeaskedtolistallthethingsheorshefeelswhileeat-ingabaroftheirfavoritechocolate.Frequentlylistedfeelingscanbeusefulfromaconceptdevelopmentperspective.Associatedfeelingslike,forexample,“fattening”associatedto“guilty”canhelpdiscoverwhychocolatehasanegativeimageinthemindsofsomeconsumers.
SweetAcid
Pulpy
YellowConsistent
A E
F
G
DC
H
B
FIGURE 17.5 Exampleofaprojectivemappingballot.

435Sensory Evaluation in Fruit Product Development
Bayesian networks(CraignouandJouffe,2008;CraignouandBezault,2009),alsoreferredtoasbeliefnetworks,Bayesnetsorcausalprobabilisticnetworksareamod-erndataanalysistoolthatcanhandlevariabilityanduncertaintyusingprobabilitydistributions. These techniques can be used for explanation, exploration of infor-mation,andpredictionofsystembehaviorsandfordecisionmaking.Despitetheirpopularityinvariousfieldssuchasfinance,medicaldiagnosis,robotics,andgenet-ics,theirapplicationtofood-relatedproblemshaveonlyrecentlyemerged.Mostcur-rentBayesiannetworkalgorithmsrequirediscretevariables.ModelingwithBayesnetsenablestheuseofexpertknowledgeaswellasthecombinationofdatafromdifferentstudies.
Empathic design(Polanyi,1966;Ulwick,2002).Amultifunctionalteamiscreatedtoobservetheactualbehaviorandenvironmentofconsumers.Avisualrecordismadeofconsumersinteractingwiththeirenvironment.Photographs,videotape,sketches,andnotesare tools thatmakea recordofbehavior.Datacanaswellbegatheredthroughresponsestoquestionslike“whyareyoudoingthat?”Teammembershaveabrainstormingsessiontotransformobservationsintographic,visualrepresentationsofpossiblesolutions.Anonfunctional,two-orthree-dimensionalmodelofaproductconceptprovidesavehicleforfurthertestingamongpotentialconsumers.
Information acceleration (Urbanetal.,1997).Theresearcherconstructsavirtualbuyingenvironment that simulates the information that is available toconsumersatthetimetheymakeapurchasedecision.Respondentsare“accelerated”intothefuturebyprovidingthemalternativefutureenvironmentsthatarefavorable,neutral,orunfavorabletowardthenewproduct.Inthisvirtualbuyingenvironment,theyareallowedtosearchforinformationorshop.Measuresaretakenofrespondents’likeli-hoodofpurchase,perceptions,andpreferences.Basedonthesemeasures,amodelisdevelopedtoforecastsalesandsimulatestrategyalternatives.
ACKNOWLEDGMENTS
TheauthorsareverygratefultoVictorCostaCastroAlvesandIdilaAraujoforfig-uredesigns,MariaAparecidaAzevedoPereiradaSilva,forvaluablesuggestionsandideasforthetext,GustavoSaavedraPinto,formakingavailablebacurinectarresults.
REFERENCES
Abdi, H.,Valentin, D., Chollet, S., and Chrea, C. 2007.Analyzing assessors and productsin sorting tasks: DISTATIS, theory and applications. Food Quality and Preference18:627–640.
Amerine,M.A.,Pangborn,R.M.,andRoessler,E.B.1965.Principles of Sensory Evaluation of Food.NewYork:AcademicPress.
Ares,G.,Giménez,A.,Barreiro,C.,andGámbaro,A.2010.Useofanopen-endedquestiontoidentifydriversoflikingofmilkdesserts.Comparisonwithpreferencemappingtech-niques.Food Quality and Preference21:286–294.
Baird, J.C. and Norma, E. 1978. Fundamentals of Scaling and Psychophysics. NewYork:Wiley.

436 Advances in Fruit Processing Technologies
Brasil.2003.MinistériodaAgriculturaedoAbastecimento.SecretariadeDefesaAgropecuária.Instrução Normativa n° 12, de 4 de setembro de 2003. Diário Oficial da República Federativa do Brasil,Brasília,September9,2003.
Brockoff,P.B.andChristensen,R.H.B.2010.Thurstonianmodelsforsensorydiscriminationtestsasgeneralizedlinearmodels.Food Quality and Preference21:330–338.
Bruseberg,A.andMcDonagh-Philp,D.2002.Focusgroups tosupport the industrial/prod-uct designer:A review based on current literature and designers’ feedback. Applied Ergonomics33:27–38.
Cardello,A.V.andMaller,O.1982.Relationshipsbetweenfoodpreference.Journal of Food Science47:1552.
Clement, C.R. and Venturieri, G.A. 1990. Bacuri e cupuassu. In: Fruits of Tropical and Subtropical Origin. Composition, Properties and Uses, eds.S.Nagy,P.E.Shaw,andW.G.Wardowiski,pp.178–192.LakeAlfred,FL:FloridaDepartmentofCitrus.
Craignou,F.andBezault,M.L.2009. Identifyingdriversof liking forfine fragranceswithBayesian networks. In: 8th Pangborn Sensory Science Symposium, Florence, Italy.DelegateManualPL4.3.
Craignou,F.andJouffe,L.2008.StudyingconsumerdriverswithBayesianNetworks.In:9th Sensometrics Meeting,May28–30,StCatharine,Ontario,Canada.OralPresentation.
Dairou,V.andSieffermann,J.M.2002.Acomparisonof14jamscharacterizedbyconven-tionalprofileandaquickoriginalmethod, theflashprofile.Journal of Food Science67:826–834.
Delarue, J. andSieffermann, J.M.2004.Sensorymappingusingflashprofile.Comparisonwithaconventionaldescriptivemethodfortheevaluationoftheflavouroffruitdairyproducts.Food Quality and Preference15:383–392.
Deliza,R.2009.Investigatingthevoiceoftheconsumerinrelationtoliking.In:8th Pangborn Sensory Science Symposium,July,Florence,Italy.Oralpresentation.
Deliza,R.andMacFie,H.J.H.1996.Thegenerationofsensoryexpectationsbyexternalcuesanditseffectsonsensoryperceptionsandhedonicratings:Areview.Journal of Sensory Studies11:103–128.
Dethmers, A.E. 1979. Utilizing sensory evaluation to determine product shelf life. Food Technology33:40–42.
Dijksterhuis,G.B.andPiggott,J.R.2001.Dynamicmethodsofsensoryanalysis.Trends in Food Science and Technology11:284–290.
Dooley, L., Lee, Y-S., and Meullenet, J.F. 2010. The application of check-all-that-apply(CATA)consumerprofilingtopreferencemappingofvanillaicecreamanditscompari-sontoclassicalexternalpreferencemapping.Food Quality and Preference21:394–401.
Frijters,J.E.R.,Kooistra,A.,andVereijken,P.F.G.1980.Tablesofd’forthetriangularmethodsandthe3-AFCsignaldetectionprocedure.Perception and Psychophysics27:176–178.
Gacula,M.C.1975.Thedesignofexperimentsforshelflifestudy.Journal of Food Science40:399–403.
Gay,C.andMead,R.1992.Astatisticalappraisaloftheproblemofsensorymeasurement.Journal of Sensory Studies7:205–208.
Gower,J.C.1975.GeneralizedProcrustesanalysis.Psychometrika40:35–50.Green, B.G., Dalton, P., Cowart, B., Shaffer, G.S., Ranking, K., and Higgins, J. 1996.
Evaluatingthe“labeledmagnitudescale”formeasuringsensationsoftasteandsmell.Chemical Senses21:323–334.
Green,B.G.,Shaffer,G.S.,andGilmore,M.M.1993.Derivationandevaluationofaseman-ticscaleoforalsensationmagnitudewithapparentratioproperties.Chemical Senses18:683–702.
Greenhoff,K.andMacFie,H.J.H.1994.Preferencemappinginpractice.In:Measurement of Food Preferences,eds.H.J.H.MacFieandD.M.H.Thomson.Glasgow,U.K.:BlackieAcademic&Professional.

437Sensory Evaluation in Fruit Product Development
Hough,G.2010.Latesttrends—KeynotepresentationinrecentPangbornandSensometricsSymposia. In: 6 Ibero-American Sensory Analysis Symposium, August 19–21, SãoPaulo,Brazil.Oralpresentation.
Hough,G.andFerraris,D.2010.Freelisting:Amethodtogaininitialinsightofafoodcat-egory.Food Quality and Preference21:295–301.
Husson,F.andPagés,J.2003.Comparisonofsensoryprofilesdonebytrainedanduntrainedjuries:Methodologyandresults.Journal of Sensory Studies18:453–464.
Jones,L.V.,Peryam,D.R.,andThurstone,L.L.1955.Developmentofascaleformeasuringsoldiers’foodpreferences.Food Research20:512–520.
Kelly,G.A.1955.The Psychology of Personal Constructs.NewYork:Norton.Kleef,E.,Trijp,H.C.M.,andLuning,P.2005.Consumerresearchintheearlystagesofnew
productdevelopment:Acriticalreviewofmethodsandtechniques.Food Quality and Preference16:181–201.
Koster,E.P.2009.Diversityinthedeterminantsoffoodchoice:Apsychologicalperspective.Food Quality and Preference20:70–82.
Kroll,B.J.1990.Evaluatingratingscalesforsensorytestingwithchildren.Food Technology44:78–86.
Labuza,T.P.1982.Shelf Life Dating of Foods.Westport,CT:FoodandNutritionPress.Labuza,T.P.andSchmidl,M.K.1988.Useofsensorydataintheshelflifetestingoffoods:
Principlesandgraphicalmethodsforevaluation.Cereal Foods World33:193–206.Lancaster,B.andFoley,M.2007.Determiningstatisticalsignificanceforchoose-all-that-apply
question responses. 7th Pangborn Science Symposium, August 12–16, Minneapolis,MN.
Lawless,H.T.2010.Commentaryon“Comparativeperformanceof thenine-pointhedonic,hybridandself-adjustingscales in thegenerationof internalpreferencemaps.”Food Quality and Preference21:165–166.
Lawless,H.T.andHeymann,H.1999.Sensory Evaluation of Food: Principles and Practices.NewYork:Chapman&Hall.
Lê,S.,Cardoret,M.,andPagès,J.2009.Combiningthebestoftwoworlds,the“sortednap-ping.”8th Pangborn Sensory Science Symposium,July26–30,Florence,Italy.DelegateManualW5.3.
MacFie, H.J.H. and Thomson, D.M.H. 1988. Preference mapping and multidimensionalscaling. In:Sensory Analysis of Foods,ed.J.R.Piggot,pp.381–410.London,U.K.:Elsevier.
McNeill, K.L., Sanders, T.H., and Civille, G.V. 2000. Using focus groups to develop aquantitative consumer questionnaire for peanut butter. Journal of Sensory Studies15:163–178.
McPherson,R.S.andRandall,E.1985.Linelengthmeasurementsasatoolforfoodprefer-enceresearch.Ecology of Food and Nutrition17:149–156.
McQuarrie,E.F.andMcIntyre,S.H.1986.Focusgroupsandthedevelopmentofnewproductsbytechnologicallydrivencompanies:Someguidelines.Journal of Product Innovation Management1:40–47.
Meilgaard, M., Civille, G.V., and Carr, B.T. 1999. Sensory Evaluation Techniques. BocaRaton,FL:CRCPress.
Miller,A.J.1987.Adjusting tastescores forvariations inuseofscales.Journal of Sensory Studies2:231–242.
Moskowitz,H.R.1983.Product Testing and Sensory Evaluation of Foods.Westport,CT:FoodandNutritionPress.
Murray, J.M., Delahunty, C.M., and Baxter, I.A. 2001. Descriptive sensory analysis: Past,presentandfuture.Food Research International34:461–471.
Nakayama,M.andWessman,C.1979.Applicationofsensoryevaluationtotheroutinemain-tenanceofproductquality.Food Technology33:38–44.

438 Advances in Fruit Processing Technologies
Nazaré,R.F.R.2000.Produtosagroindustriaisdebacuri,cupuaçu,graviolaeaçai,desenvolvi-dospelaEmbrapaAmazôniaOriental.Belém: Embrapa Amazônia Oriental.Manaus,Brazil:EmbrapaAmazôniaOriental.
Pagès, J. 2005. Collection and analysis of perceived product interdistances using multiplefactoranalysis:Applicationtothestudyof10whitewinesfromtheLoireValley.Food Quality and Preference16:642–649.
Pearce,J.H.,Korth,B.,andWarren,C.B.1986.Evaluationofthreescalingmethodsforhedon-ics.Journal of Sensory Studies1:27–46.
Peryam,D.R.andPilgrim,F.J.1957.Hedonicscalemethodofmeasuringfoodpreferences.Food TechnologySeptember1957:9–14.
Pfeiffer,J.C.andGilbert,C.C.2008.Nappingbymodality:Ahappymediumbetweenana-lyticandholisticapproaches.In:9th Sensometrics Meeting,July20–23,StCatharine,Ontario,Canada.Oralpresentation.
Polanyi,M.1966.The Tacit Dimension.NewYork:Doubleday.Punter,P.H.2008.BridgingthegapbetweenR&Dandmarketing:Theidealprofilemethod.In:
Third European Conference on Sensory and Consumer Research,Hamburg,Germany.Risvik,E.,McEwan,J.A.,Colwill,J.S.,Rogers,R.,andLyon,D.H.1994.Projectivemap-
ping:Atoolforsensoryanalysisandconsumerresearch.Food Quality and Preference5:263–269.
Schiffman,H.R.1996.Sensation and Perception: An Integrated Approach.NewYork:JohnWiley&Sons.
Schutz,H.G.1965.Afoodactionratingscaleformeasuringfoodacceptance.Journal of Food Science30:365–374.
Silva,V.K.L.,Figueiredo,R.W.,Maia,G.A.,Sousa,P.H.M.,Figueiredo,E.A.T.,andPinheiro,E.S.2007.Otimizaçãodaformulaçãodenéctardebacuri(Platonia insignis Mart.).In:7º̄SimpósioLatinoAmericanodeCiênciasdeAlimentos,November4–7,Campinas,SP,Brazil.BookofAbstracts(CDROM).
Stevens,J.C.andMarks,L.M.1980.Cross-modalitymatchingfunctionsgeneratedbymagni-tudeestimation.Perceptions and Psychophysics27:379–389.
Stone,H.andSidel,J.L.1993.Sensory Evaluation Practices.SanDiego,CA:AcademicPress.Stone,H.H.,Sidel,J.,Oliver,S.,Woolsey,A.,andSingleton,R.C.1974.Sensoryevaluationby
quantitativedescriptiveanalysis.Food Technology28:24–31.Ulwick,A.W.2002.Turncustomerinputintoinnovation.Harvard Business ReviewJanuary
1:92–97.Urban,G.L.,Hauser,J.R.,Qualls,W.J.,Weinberg,B.D.,Bohlmann,J.D.,andChicos,R.A.
1997. Information acceleration: Validation and lessons from the field. Journal of Marketing Research34:143–153.
Vickers,A.1988.Sensoryspecificsatietyinlemonadeusingajust-rightscaleforsweetness.Journal of Sensory Studies3:1–8.
Vie,A.,Gulli,O.,andO’Mhonny,M.1991.Alternativehedonicmeasures.Journal of Food Science56:1–5.
Villanueva,N.D.M.andDaSilva,M.A.A.P.2009.Comparativeperformanceofthenine-pointhedonic,hybridandself-adjustingscalesinthegenerationofinternalpreferencemaps.Food Quality and Preference20:1–12.
Villanueva,N.D.M.,Petenate,A.J.,andDaSilva,M.A.A.P.2000.PerformanceofthreeaffectivemethodsanddiagnosisoftheAnovamodel.Food Quality and Preference11:363–370.
Villanueva,N.D.M.,Petenate,A.J.,andDaSilva,M.A.A.P.2005.Performanceofthehybridhedonicscaleascomparedtothetraditionalhedonic,self-adjustingandrankingscales.Food Quality and Preference12:691–703.
Wilkinson,C.andYuksel,D.1997.Modelingdifferencesbetweenpanelistsinuseofmeasure-mentscales.Journal of Sensory Studies12:55–68.

439Sensory Evaluation in Fruit Product Development
Williams,A.A. andArnold,G.M.1984.Anewapproach to sensory analysis of foods andbeverages.InProgress in Flavour Research. Proceedings of the 4th Weurman Flavour Research Symposium,ed.J.Adda,pp.35–50.Amsterdam,theNetherlands:Elsevier.
Worch,T.,Dooley,L.,Meullenet,J-F.,andPunter,P.H.2010.ComparisonofPLSdummyvariablesandFishbonemethodtodetermineoptimalproductcharacteristicsfromidealprofiles.Food Quality and Preference21:1077–1087.
Worch,T.W.,Le,S.,andPunter,P.2009.Howreliableareconsumers?Comparisonofsensoryprofilesfromconsumersandexperts.Food Quality and Preference21:309–318.
Xiong,R.andMeullenet,J.F.2006.APLSdummyvariableapproachtoassesstheimpactofJARattributesonliking.Food Quality and Preference17:188–198.