Embed Size (px)
Citation preview

16
CH
AP
TER
2
Philip Pilosian/Shutterstock.com
Copyright ©2021 by SAGE Publications, Inc. This work may not be reproduced or distributed in any form or by any means without express written permission of the publisher.
Do not
copy
, pos
t, or d
istrib
ute

Chapter 2 • ANALYZING ECONOMIC INEQUALITIES 17
ANALYZING ECONOMIC INEQUALITIESDawn R. Norris
2.1 What are social class and economic inequality?
2.2 What are the different viewpoints on economic inequality?
2.3 How are wealth and income distributed in the United States and globally?
2.4 What is the likelihood of moving up or down in social class in the United States?
2.5 What has led to high levels of economic inequality in the United States?
2.6 What are some social problems caused by high levels of economic inequality?
2.7 What can we do to reduce economic inequality?
LEARNING QUESTIONS
Economic Inequality and Social Problems2.1 What are social class and economic inequality?
Think about the last time you noticed that someone had a lot more money than you. Now think about a time you encountered someone much poorer than you. What were those experiences like? How did you feel? Did you think about how they became rich or poor? Did you make any judgments about them based on those assumptions? Did you make any judgments about yourself? Does it surprise
you that, while individuals’ efforts sometimes affect how much money they have, large-scale factors such as gov-ernment policies and the national and global economies, gender roles, and institutional racism are the primary causes of economic inequality? Why do you think you might be surprised?
Defining Economic InequalityIt is no secret that some people have more money, prop-erty, and material goods than others. This income or wealth gap among individuals, groups, or even entire countries is known as economic inequality. Economic inequality differs from economic growth or contraction, which refers to how much money, goods, and resources exist overall. John Iceland (2013:81) describes these two concepts using the analogy of a delicious pie. The shift-ing size of the pie overall—a small, medium, or large pie—illustrates economic growth or contraction. On the other
Why should you care about how much economic inequality exists in your society?
CONSIDER THIS 2.1
Copyright ©2021 by SAGE Publications, Inc. This work may not be reproduced or distributed in any form or by any means without express written permission of the publisher.
Do not
copy
, pos
t, or d
istrib
ute
18 UNIT I • INEQUALITIES AS SOCIAL PROBLEMS
hand, economic inequality refers to how the pie is cut into different-size pieces (with some getting bigger pieces than others). The two do not necessarily correlate. For example, in a society with a booming economy but a high degree of economic inequality, a few people may get huge slices of a very large pie while most people get only a few crumbs of that big pie.
Almost all societies are stratified, or separated into ranked groups with different levels of material goods (aka pie), prestige, and power. Types of stratification include slavery, caste, estate, and social class systems.
Slavery: In a slavery system of stratification, some people own other people as property. Dominant racial groups often use race to decide who should be a slave and then create laws to support their decisions. In these types
of societies, movement out of slave status is impossible. The pre–Civil War United States operated under a slavery system in which Blacks were legally defined as property and forced into labor, without legal rights of their own.
Caste: The caste system, found pri-marily in South Asian countries, forbids movement up or down in the social and economic hierarchy. People must remain in the caste into which they were born and interact almost exclusively with others in their own caste. Cultural and religious beliefs justify this system. People tend to be reluctant to challenge the system because they believe that deities intend for them to inhabit their own caste.
Estate: In the estate system, which operated in Europe from about 500 A.D. to the late 1700s, most people stayed in the hierarchical position into which they were born. Under special circum-stances (e.g., through marriage, becoming a member of the clergy, losing an inheritance), however, a few peo-ple moved up or down in the hierarchy. Feudal societ-ies, which contained nobility, serfs, clergy, and knights, were an example of an estate system. As with other stratification systems, people with less power had little to no voice in shaping the system.
Social Class: In the social class system (the focus of this chapter), people can move up or down in the hierarchy. Sociologists use education level, occupa-tion, and income to indicate people’s class positions.
HOW I GOT ACTIVE IN SOCIOLOGY
Some people have a bigger slice of the economic pie than others.iStockphoto.com/Bartosz Luczak
DAWN NORRIS
One day, after a long conversation about social class, my friend told me, “You’re in the wrong major.” At the time I was a psychology major, so
she urged me to take an introductory sociology course. I did, and that semester I realized there was a field of study that examined all the things I had always questioned about society.
During my politically active undergraduate career, I used sociology to work on a presidential candidate’s
campaign and to participate in social movements. I also loved explaining sociology to my classmates and doing research. As I approached graduation, I had the opportunity to attend a sociology conference. It was there that I realized I could also work toward social justice through teaching and research. Today, I am thrilled that my career allows me to introduce others to what I hold so dear—a love of sociology.
Copyright ©2021 by SAGE Publications, Inc. This work may not be reproduced or distributed in any form or by any means without express written permission of the publisher.
Do not
copy
, pos
t, or d
istrib
ute

Chapter 2 • ANALYZING ECONOMIC INEQUALITIES 19
Social class also includes cultural characteristics, such as tastes and preferences. Upper, middle, working, and lower classes are examples of social class catego-ries. The United States and other democratic Global North (highly developed) countries (e.g., France, Denmark, Japan, Germany) operate under social class systems.
U.S. laws technically grant the same rights to all social classes, but wealthy people tend to have the most influence over the creation and enforcement of laws. Laws are part of the social structure, the social arrangements of a society established through laws, interactions, and expected behaviors. The way a soci-ety is structured largely determines its level of economic inequality.
In the United States, a core cultural belief is that the nation is a meritocracy, a society in which the greatest economic rewards go to people who work the hardest and do the best work. In an actual meritocracy, people could move up in class by working hard and “pulling themselves up by their bootstraps,” and people born rich would not stay rich if they did not work hard and earn their position. The cultural belief in a U.S. meritocracy masks the structural causes of inequality, convincing people that those in the lower classes simply do not try hard enough and that wealthy people are rich because they have worked hard and deserve it. These ideas can make it difficult to gain public support for policies that will reduce inequality (Wyly et al. 2009). The degree of economic inequality, however, also influences support
for such policies and whether people see it as a social problem.
Check Your Understanding1. How does economic inequality differ from eco-
nomic growth or contraction?
2. What is social class? How does it differ from other systems of stratification?
3. What three factors do sociologists use to measure social class?
Explaining Economic Inequality2.2 What are the different viewpoints on economic inequality?
Sociologists use theories to understand patterns of economic inequality. As noted in Chapter 1, theories are like lenses that shape what we see. For example, if we look at a green-and-red brochure through a lens that is particularly good at picking up green print, we will focus on the words in green. If we switch to a lens that highlights red ink, we will pay more attention to the red words. Likewise, looking at economic inequal-ity through the lens of social reproduction theory versus the Davis-Moore hypothesis provides a very differ-ent picture that leads to different explanations and responses. It even influences whether we view economic inequality as a social problem at all.
Social Reproduction TheorySocial reproduction the-ory reflects the viewpoint that inequality is bad for society. Karl Marx’s ([1867] 1977) idea that society is composed of groups competing for power forms the basis of this theory. According to social reproduction theorists, a system of unequal access to resources (such as money, edu-cation, nutrition, safe neigh-borhoods) causes economic inequality, and this leads to unequal opportunities for some groups of people, through no fault of their own. Social repro-duction theorists argue that the upper classes use their money We often incorrectly assume people can become wealthier if they just try hard enough.
iStockphoto.comTempura
Copyright ©2021 by SAGE Publications, Inc. This work may not be reproduced or distributed in any form or by any means without express written permission of the publisher.
Do not
copy
, pos
t, or d
istrib
ute

20 UNIT I • INEQUALITIES AS SOCIAL PROBLEMS
Davis-Moore HypothesisThe second explanation, the Davis-Moore hypothesis (Davis and Moore 1945), ref lects the view-point that inequality is good for soci-ety because it ensures that people who contribute the most to society gain the most rewards. This expla-nation is built on the functionalist theoretical perspective that claims a social condition (such as economic inequality) will not exist unless it serves a purpose for society. People favoring this explanation argue that people take on careers to which they are most suited and are rewarded based on their contributions to soci-ety. Economic inequality based on these different rewards inspires motivated, talented people to train
for the most critical occupations and ensures that the best and brightest people will fill those jobs.
If we use the Davis-Moore hypothesis to exam-ine economic inequality, we look for evidence that (1) economic inequality benefits society; (2) people who perform lower-level jobs are still relatively happy in their jobs because these jobs are a good fit for them; (3) people who carry out the most important tasks gain the most rewards; and (4) the most talented, hardworking peo-ple regularly enter the most important and difficult occupa-tions, regardless of their starting social class.
Overall, we can use these two explanations of eco-nomic inequality to help us answer several questions: What causes inequality? What are its effects? Do high levels of inequality create social problems? And if so, how can we reduce economic inequality in society?
Check Your Understanding
1. According to social reproduction theory, why does inequality exist?
2. According to the Davis-Moore hypothesis, why does inequality exist?
Which of these perspectives comes closest to what you were raised to believe about economic inequality in the United States or your home country? Explain.
CONSIDER THIS 2.2
Our starting point in life often depends on our parents’ wealth.iStockphoto.com/takasuu
The Davis-Moore hypothesis states that people with more important jobs get paid more.iStockphoto.com/MilanMarkovic
and power to make sure that this unequal access continues. They create laws that benefit themselves and restrict access to opportunities for poorer people. This makes it hard for talented and hardworking people to move up in social class and to contribute all they can to society. Social class then gets reproduced from generation to generation. When we use social reproduction theory to explain economic inequality, we see high inequality levels as extremely harm-ful to individuals and societies.
If we use social reproduction theory to examine eco-nomic inequality, we look for evidence that (1) high eco-nomic inequality levels harm society; (2) wealthier people restrict access to resources (especially by making laws that benefit the wealthy and hurt the poor); (3) talented, hard-working people experience difficulty moving up in class; (4) people tend to remain in the social class into which they were born; and (5) people born wealthy remain wealthy regardless of how hard they work (or even if they work!).
Copyright ©2021 by SAGE Publications, Inc. This work may not be reproduced or distributed in any form or by any means without express written permission of the publisher.
Do not
copy
, pos
t, or d
istrib
ute

Chapter 2 • ANALYZING ECONOMIC INEQUALITIES 21
Use the chart below and record your answers to the following questions. To the extent that you are comfortable doing so, you should be
prepared to share findings, discuss difficulties you encountered, and brainstorm advantages and disadvantages of your social class or social class in general. You do not have to disclose your personal information, but you can always talk about social class in general.
1. List each parent’s highest level of education (e.g., some college).
2. List each parent’s occupation.
3. List or estimate each parent’s annual pre-tax income.
4. Given your answers to questions 1 through 3, what is your social class and why?
5. What questions arose that may have made it diffi-cult to answer questions 1 through 4?
6. What advantages does your social class give you (and others like you) over those in lower social classes?
7. What disadvantages does your social class give you (and others like you) compared with those in higher social classes?
CONFRONTING SOCIAL PROBLEMS 2.1Determining Your Own Social Class
Social Class Education OccupationAnnual Individual Income Other
Upper class Four-year degree or more, usually from an Ivy League University
No financial need to work; may work for other reasons in any field (e.g., businessperson, entrepreneur, investor)
$2 million + Socially exclusive; typically come from generations of wealth
Upper-middle class
Graduate degree Professional (e.g., doctor, lawyer, professor)
$150,000–$2 million
Have lots of autonomy at work, good work benefits (e.g., health insurance); income may be somewhat lower in some cases
Middle-middle class
Four-year college degree
Nonmanual job or management (e.g., accountant, computer programmer, pharmacist)
$70,000–$150,000 Have good work benefits and live comfortably
Lower-middle class
Two-year college degree or high school diploma
Lower paid nonmanual job (e.g., grade school teacher, data entry clerk)
$40,000–$70,000 May or may not have work benefits; less prestigious work
Working class
High school diploma, sometimes with technical training
Skilled manual labor job (e.g., plumber, electrician, paramedic)
$25,000–$40,000 May or may not have work benefits; may struggle to pay bills; income may be much higher in some cases
Working poor
High school diploma or GED
Unskilled manual labor (e.g., child care worker, cashier)
$15,000–$25,000 No benefits; serious struggle to pay bills
Underclass Less than high school diploma
Unskilled manual labor (e.g., day laborer)
< $15,000 Come from generations of poverty and impoverished communities; may have long periods of unemployment
Copyright ©2021 by SAGE Publications, Inc. This work may not be reproduced or distributed in any form or by any means without express written permission of the publisher.
Do not
copy
, pos
t, or d
istrib
ute

22 UNIT I • INEQUALITIES AS SOCIAL PROBLEMS
Wealth and Income Gaps: How Much Inequality Exists?2.3 How are wealth and income distributed in the United States and globally?
Most societies have unequal wealth and income distribu-tions. This can become problematic, especially in coun-tries with high levels of inequality. Sociologists typically look at gaps in wealth and income to determine the extent of economic inequality.
Wealth is the value of your assets (what you own, like a house, car, or boat) minus the value of your debts (what you owe), whereas income refers to money earned or received through paid work, renting out property, government benefits (e.g., a Social Security check), and the like. Sociologists examine economic inequalities at several levels. For example, they may look at inequal-ity among people in a country or, alternately, among the countries themselves.
Several large-scale factors cause inequality. In the United States, these include free-market economic poli-cies, a stagnant minimum wage, globalization, automa-tion and technology that replace human workers, and the decline of labor unions. Racism, sexism, and educational inequalities also cause economic inequality. You’ll read more about these causes later in the chapter.
Wealth Inequality in the United States and GloballyA small percentage of people own most of the world’s wealth. In fact, the richest 1% of people in the world own almost half (47%) of the world’s wealth (Credit Suisse 2018). Wealth inequality in the United States tends to be higher than that in most other Global North nations
(Credit Suisse 2018). As you will see, a country’s policies and laws can create higher or lower levels of economic inequality.
Among Global North nations, the United States has a high level of wealth inequality. For example, the rich-est 10% of U.S. households own about 80% of the United States’ wealth. In contrast, the richest 10% of Canadian, Belgian, and Japanese households own only about 51%, 43%, and 41% of their nation’s wealth, respectively (Bal-estra and Tonkin 2018). Figure 2.1 provides more detail on the United States’ wealth concentration compared with that of other Global North countries.
As you see in Figure 2.2, the wealthiest 1% of people in the United States own almost 40% of all U.S. wealth, but the poorest 80% of the U.S. population own only 10% of the United States’ wealth. In fact, many people in the United States owe more than the value of what they own! This is referred to as negative wealth (Wolff 2017a). The concentration of wealth becomes even greater when we look at the wealthiest 0.1% of people in the United States, who own a full 19% of all U.S. wealth (Zucman 2018).
Let’s look at stock ownership, or investments in publicly owned businesses—one asset that goes into calculating wealth. As of 2016, only 14% of all households in the United States owned stock directly, and less than half owned stock in any form, including through indirect ownership such as retirement accounts. Moreover, the wealthiest 10% of Americans owned 91% of the monetary value of all stocks (Wolff 2017b), and the richest 1% of Americans—alone—owned 40% of the value of Dow
q FIGURE 2.1
Shares of Household Income and Wealth Held by Units in the Top 10 of the Distribution
2015 or latest available year
90%
80%
70%
60%
50%
40%
30%
20%
10%0%
SVKJP
NPOL
GRCBEL
ITA FINESP
AUSHUN
SVNLU
XFRA
CANNOR
OECO 27GBR
PRTNZL
IRLAUT
ESTCHL
DEULV
ADNK
NLDUSA
Income-top 10% share Wealth-top 10% share (�)
Source: Carlotta Balestra and Richard Tonkin (2018). Inequalities in household wealth across OECD countries: Evidence from the OECD Wealth Distribution Database. OECD Statistics Working Papers, https://www.oecd-ilibrary.org/docserver/7e1bf673-en.pdf?expires=1557855912&id=id&accname= guest&checksum=BE475F4AE1C503303883F1ADE2FDC88A
q FIGURE 2.2
Percentage of U.S. Wealth (Net Worth) Owned by Each Wealth Group (2016)
39.6%
10.1%
23.2%
27.1%
Wealth group
Top 1%
Next 4%
Next 15%
Bottom 80%
Source: Adapted from Wolff (2017b).
Copyright ©2021 by SAGE Publications, Inc. This work may not be reproduced or distributed in any form or by any means without express written permission of the publisher.
Do not
copy
, pos
t, or d
istrib
ute

Chapter 2 • ANALYZING ECONOMIC INEQUALITIES 23
Jones stocks (30 of the largest publicly owned companies, across various industries) in the United States (Wolff 2017b).
Wealth inequality in the United States has increased since 1978 and is now greater than at any point since the stock market crash in 1929. For example, in 1978 the wealthiest 0.1% of people in the United States owned 7% of all U.S. wealth, but by 2016 they owned about 19% of all the wealth in the United States (Zucman 2018).
Institutionalized racism and sexism as manifested through hiring and promotion discrimination (Benard and Correll 2010; Pager, Western, and Bonikowski 2009), residential segregation, and school funding inequalities (U.S. Commission on Civil Rights 2018) magnify wealth inequality. You’ll explore these problems in more depth in subsequent chapters.
Income Inequality in the United States and GloballyLike wealth inequality, U.S. income inequality has increased since the late 1970s (Iceland 2013; Jacobs and Dirlam 2016), as shown in Figure 2.3. Since 1979, the after-tax income of the wealthiest 1% of people in the United States has grown by 242%. During that same time, however, the after-tax income of the poorest 20% grew by less than one-third of that amount (79%) (Con-gressional Budget Office 2018).
Globally, as industrialization spread into relatively poorer countries between 1980 and 2000, income inequality among nations decreased by 8.4% between 1980 and 1998 (Firebaugh and Goesling 2004). This trend has continued into the new millennium, mostly due to strong economic growth in India and China (Niño-Zarazúa, Roope, and Tarp 2017). However,
despite economic growth (the pie getting bigger) in many nations, income inequality (i.e., differences in the size of each slice of pie) within most nations has also grown since 1990 (ElGindi 2017).
Check Your Understanding1. How unequal is the distribution of wealth and
income among individuals in the United States?
2. How has the extent of wealth and income inequality among individuals changed in the United States over time?
3. How do wealth and income inequality levels among U.S. individuals compare with those in other Global North countries?
4. Within most nations, has economic inequality increased since 1990?
The Question of Mobility2.4 What is the likelihood of moving up or down in social class in the United States?
In a meritocracy, the importance, extent, and quality of your work determine your economic rewards and social class. Therefore, even if you are born into a lower social class, you should be able to work hard and move up into the middle or upper classes. This ability to move up or down in social class is called mobility.
There are two types of mobility: intergenerational and intragenerational mobility. In intergenerational mobility, one generation moves up or down in social class compared with the previous generation. For exam-ple, a child might achieve a higher social class than their parents. In intragenerational mobility, an individual moves up or down in social class within their own life-time. An example is a middle-class person who loses their job and eventually falls into the lower class.
Trends in MobilityDuring most decades of the 1900s, intergenerational income mobility increased in the United States (Pfef-fer and Hertel 2015) and in most other Global North countries (Breen 2004). However, since about 1980, as
Do you expect to end up in a higher or lower social class than your parents? Why?
CONSIDER THIS 2.3
q FIGURE 2.3
Measuring Income Inequality: U.S. Census Bureau
Gini coefficient of household money income inequality:1967-2014
0.50
0.45
0.40
0.35
0.301965 1970 1975 1980 1985 1990 1995 2000 2005 2010 2015
1979-2014
+17%
Source: Burtless (2016); graph adapted from U.S. Census Bureau, https://www.brookings.edu/on-the-record/alternative-methods-for-measuring-income-and-inequality/
Copyright ©2021 by SAGE Publications, Inc. This work may not be reproduced or distributed in any form or by any means without express written permission of the publisher.
Do not
copy
, pos
t, or d
istrib
ute

24 UNIT I • INEQUALITIES AS SOCIAL PROBLEMS
economic inequality increased, intergenerational income mobility in the United States began to decrease (Pfeffer and Hertel 2015). Figure 2.4 shows this by illustrating the substantial decrease in the percentage of people who earned more than their parents by age 30.
Intragenerational income mobility has also decreased in the United States since 1980. People are less likely to move up in income brackets throughout their lives regardless of the social class into which they were born (Carr and Wiemers 2016). Social class reproduction, remaining in the same social class into which you were born, typically stems from structural factors that make mobility more difficult.
The decrease in both mobility types suggests that despite the myth of “pulling yourself up by your
bootstraps,” the United States is not actually a meritocracy. Although merit may still play some role in people’s success, these data suggest that it is unlikely to be the strongest factor; instead, one of the strongest predictors of one’s ultimate social class is the class into which one is born.
The Social Register is a list of members of the U.S. upper class. Its website provides information about activities, news, and products of interest to that class. It can give you some insight into the upper-class lifestyle, and illustrates factors (other than individual effort) that help people born into the upper class stay there. Confronting Social Problems 2.2 will guide you through exploring this site.
The next section of this chapter lays out the causes of increased economic inequality. If we know the causes, we can design effective solutions.
Why Mobility Has Declined in Recent DecadesIn the United States, factors leading to greater economic inequality include neoliberal economic policies, globalization, a stagnant minimum wage, automation/technology, and the decline of labor unions. These structural factors have made it more difficult for people to move up the social class ladder and have led to many falling from the middle class to the lower class. Furthermore, because women and people of color are more highly concentrated in low-paying occupations to begin with, these phenomena make it especially hard for them to move up in social class.
q FIGURE 2.4
The Fading American Dream
1940
50
100
Pct
. of C
hild
ren
Ear
ning
Mor
e T
han
Par
ents
90
80
70
60
1945 1950 1955 1960 1965Year in Which Child Is Born
Percentage of Children Earning More Than Their Parents, by Year of Birth
1970 1975 1980 1985
Source: Chetty et al. (2017).
Explore the Social Register website (http://www .socialregisteronline.com/) and write your answers to the following questions.
1. What is your first impression (in 30 seconds) when looking at the site?
2. Click on “About Us,” then “Clubs Listed in the SR.” A list of yacht clubs and general (non-yacht) clubs will appear. Explore at least one of each type of club. List the clubs you explored. What kinds of things do Social Register members do for fun in these clubs? What might it be like to be a member of these clubs?
3. Return to the home page. You’ll see six changing pictures there. Once one of these changes to text
that reads “Weddings,” click on it. Explore at least three Social Register members’ weddings. What do you notice about people’s names/ancestors? Their educational backgrounds? Their honeymoon locations?
4. Click on one of the ads at the bottom of the page. What products or services are offered? What is unique about these products or services?
5. What is notably missing from the site? What (or whom) do you not see?
6. Finally, imagine yourself spending a day with peo-ple from the Social Register at one of their events. Would you feel comfortable? Why or why not?
CONFRONTING SOCIAL PROBLEMS 2.2 The Social Register
Copyright ©2021 by SAGE Publications, Inc. This work may not be reproduced or distributed in any form or by any means without express written permission of the publisher.
Do not
copy
, pos
t, or d
istrib
ute

Chapter 2 • ANALYZING ECONOMIC INEQUALITIES 25
Neoliberal Economic Policies: Broadly speaking, neoliberalism is a political and economic perspective that promotes an economic marketplace free of gov-ernment regulations (a free-market economic system). Neoliberal economic policies typically advocate for reducing taxes, government regulations, and workers’ rights. In short, neoliberals would like to strengthen the power of corporations and weaken the influence of the government and workers.
Since 1980, neoliberal policies have lowered tax rates for corporations and the wealthy. For example, a law passed in 2017 lowered the U.S. corporate tax from 35% to 21% (Pomerleau 2018). The highest individual federal tax rate (for the wealthiest individuals) before 1980 was 70%, but after 1980 it ranged from 28% to 40% (El-Sibaie 2018; Schlozman, Brady, and Verba 2017). As of 2018, the top tax rate for individuals was 37% (El-Sibaie 2018).
When we examine the rate of income taxes paid by employees plus the rate of payroll taxes paid by employ-ers, the United States’ tax rate (30%) for an average-paid worker is quite low compared with those of other Global North nations. For example, Denmark and Norway (36%), Sweden (43%), and Belgium (53%) all have higher tax rates than the United States (Organisation for Eco-nomic Co-operation and Development 2019).
Redistribution policies are laws or procedures that allow the government to move money/resources from one group of people to another (and/or to public institutions) to reduce economic inequality. In the United States, programs that once existed to help redistribute wealth to parents and children in need have been modified to provide fewer benefits. For example, the 1996 welfare reform (Temporary Assistance for Needy Families legis-lation) established a time limit for how long families could receive benefits (Edin and Shaefer 2015).
Meanwhile, federal tax loopholes and deductions tend to favor wealthier people (Schlozman et al. 2017). For example, in 2015, the wealthiest 1% of people (incomes of $471,000 or higher) paid taxes on only 5% of their income, whereas people with the lowest 20% of incomes paid taxes on 11% of their income (Davis et al. 2015).
Globalization: Globalization, the process of cre-ating a world economy with few restrictions on trade, has increased economic inequality among nations and ensured that multinational corporations have more power than in the past. With improved transportation systems and computer technology, companies can operate where labor is cheapest. Mult inat ional
corporations can create their goods in nations with low taxes, few government regulations, and minimal workers’ rights.
Automation/Technology: New technology has auto-mated many of the jobs previously done by people. Although this technology also creates some jobs, they are fewer in number and restricted to those with advanced training. So people who have technological skills have relatively good chances of securing a job, but workers with few skills find themselves limited to minimum-wage jobs. This divide between people who have and do not have technological skills increases economic inequality (Jacobs and Dirlam 2016).
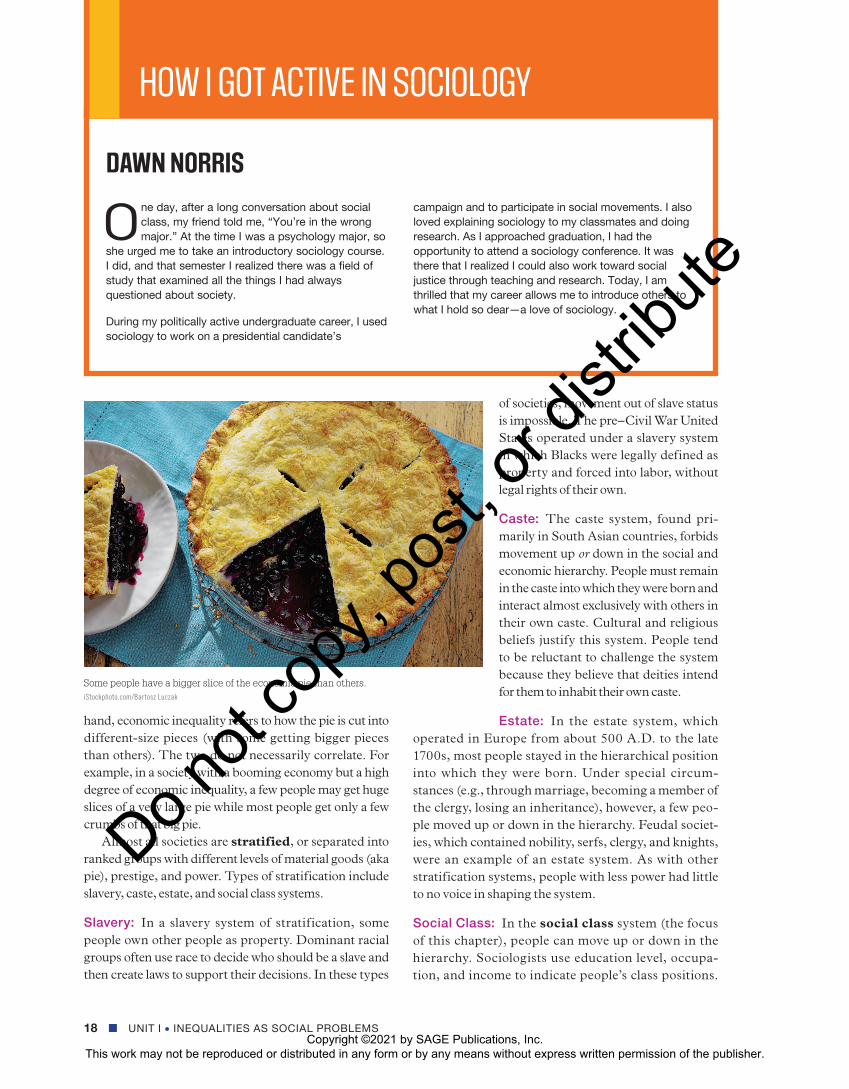
Decline of Unions: Neoliberal policies, globaliza-tion, and automation have contributed to the decline of unions. Labor unions are organizations that bring employees together collectively to fight for better wages, benefits, and worker protections. Labor union mem-bership has boosted income and benefits, such as health insurance and paid sick days, for union members as well as for their nonunion counterparts in the same industry (Rosenfield, Denice, and Laird 2016). As seen in Figure 2.5, nonunion members tend to earn just 82% of full-time union members’ median weekly earnings ($1,051 vs. $860) (U.S. Department of Labor 2019a).
Today, however, a smaller percentage of people are benefiting from the gains that labor unions can provide. In the past few decades union membership has fallen from 20.1% of employees in 1983 to 10.5% of employees in 2018 (U.S. Department of Labor 2019a). Figure 2.6 illustrates this decline, which is due in part to anti-union laws and court decisions that you’ll read about later in this chapter.
q FIGURE 2.5
Weekly Median Earnings by Union Membership—Full-Time Employees 2018
1000
800
Wag
es in
Dol
lars
600
400
200
0Not a Union Member Union Member
Union Membership
Source: U.S. Department of Labor (2019a).
Copyright ©2021 by SAGE Publications, Inc. This work may not be reproduced or distributed in any form or by any means without express written permission of the publisher.
Do not
copy
, pos
t, or d
istrib
ute
26 UNIT I • INEQUALITIES AS SOCIAL PROBLEMS
Check Your Understanding1. Why is mobility essential for an actual meritoc-
racy to exist?
2. What is the difference between intergenerational and intragenerational mobility?
3. How has the likelihood of intergenerational mobility in the United States changed over time? How about intragenerational mobility?
4. What is social class reproduction?
5. Why has mobility in the United States decreased over the past several decades?
Social Problems That Cause Economic Inequality2.5 What has led to high levels of economic inequality in the United States?
While the structural changes described above have led to higher levels of inequality in the United States and within other nations, other factors also can lead to economic inequality. Social problems such as racism, sexism, and educational inequality can create or perpetuate wealth and income gaps among various groups in society.
RacismThe United States’ history of racial discrimination created structural barriers to economic opportunities
for people of color that still impact many people today. From the annihilation of most American Indians, the enslavement of African Americans, and the internment of Japanese Americans to discrimination against Black and Latinx people in mortgage lending, the United States has a history of keeping income and wealth opportunities away from people of color that continues today (Edin and Kefalas 2005; Pager et al. 2009; Patterson and Fosse 2015).
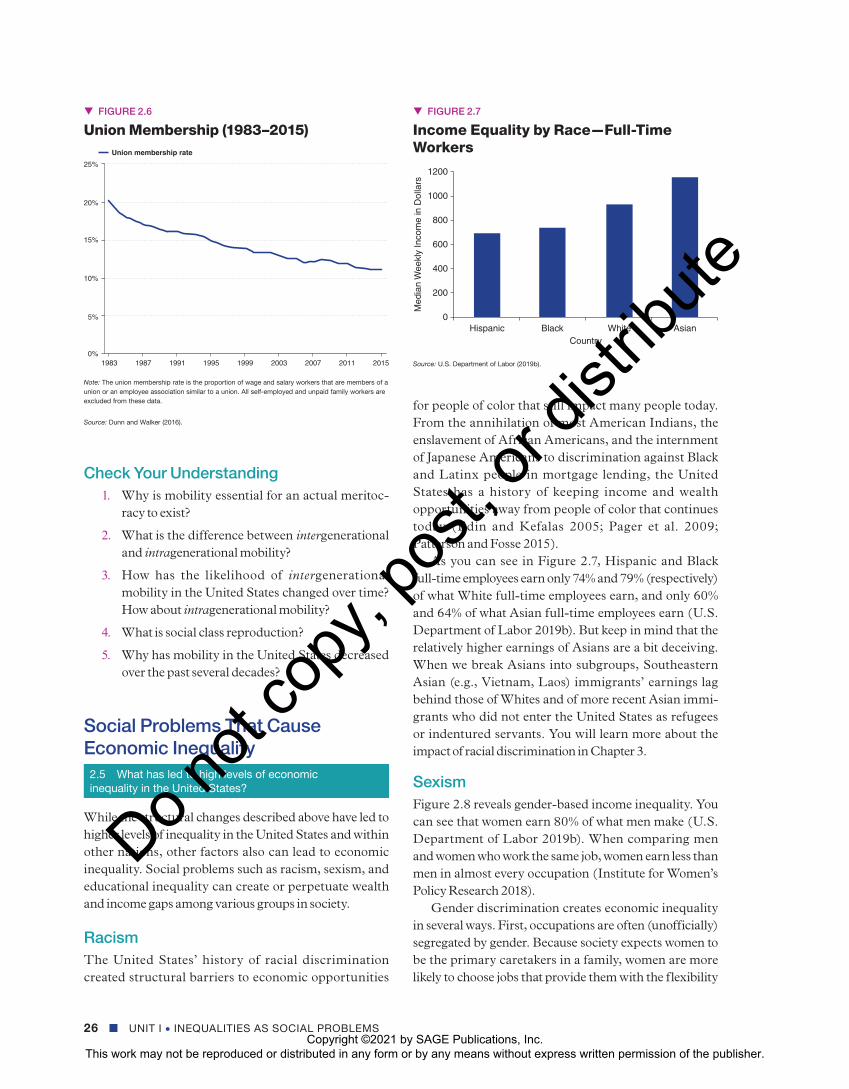
As you can see in Figure 2.7, Hispanic and Black full-time employees earn only 74% and 79% ( respectively) of what White full-time employees earn, and only 60% and 64% of what Asian full-time employees earn (U.S. Department of Labor 2019b). But keep in mind that the relatively higher earnings of Asians are a bit deceiving. When we break Asians into subgroups, Southeastern Asian (e.g., Vietnam, Laos) immigrants’ earnings lag behind those of Whites and of more recent Asian immi-grants who did not enter the United States as refugees or indentured servants. You will learn more about the impact of racial discrimination in Chapter 3.
SexismFigure 2.8 reveals gender-based income inequality. You can see that women earn 80% of what men make (U.S. Department of Labor 2019b). When comparing men and women who work the same job, women earn less than men in almost every occupation (Institute for Women’s Policy Research 2018).
Gender discrimination creates economic inequality in several ways. First, occupations are often (unofficially) segregated by gender. Because society expects women to be the primary caretakers in a family, women are more likely to choose jobs that provide them with the flexibility
q FIGURE 2.6
Union Membership (1983–2015)
19830%
5%
10%
15%
20%
25%
Union membership rate
1987 1991 1995 1999 2003 2007 2011 2015
Note: The union membership rate is the proportion of wage and salary workers that are members of a union or an employee association similar to a union. All self-employed and unpaid family workers are excluded from these data.
Source: Dunn and Walker (2016).
q FIGURE 2.7
Income Equality by Race—Full-Time Workers
Hispanic
1200
Med
ian
Wee
kly
Inco
me
in D
olla
rs
1000
800
600
400
200
0Black White
CountryAsian
Source: U.S. Department of Labor (2019b).
Copyright ©2021 by SAGE Publications, Inc. This work may not be reproduced or distributed in any form or by any means without express written permission of the publisher.
Do not
copy
, pos
t, or d
istrib
ute

Chapter 2 • ANALYZING ECONOMIC INEQUALITIES 27
to do so, and these jobs generally pay less than other jobs (e.g., Gafni and Siniver 2015). Women are expected to (and in fact do) spend more hours caring for children and doing household chores (Kamp Dush, Yavorsky, and Schoppe-Sullivan 2018). Furthermore, there are fewer female mentors for women in male-dominated jobs. We discuss all this in more detail in Chapter 4.
Educational InequalitiesAs Figure 2.9 shows, different education levels also can lead to income inequality. Full-time employees age 25 and older who did not graduate from high school earn only 43% of what a four-year college graduate work-ing full-time makes. High school graduates working full-time earn 55% of college graduates’ earnings (U.S. Department of Labor 2019b).
A college education increases the chances of upward mobility for those in the lower classes. But as you will read more about in Chapter 13, neighborhood and regional inequalities in funding for the U.S. K–12 education system make it tough for people born in low-income areas to gain the necessary skills for college admission and success. Additionally, many states have reduced their funding for universities, so schools have had to increase tuition to cover their expenses (Hanson and Noterman 2017).
Therefore, even if someone from a poor background is admitted to college, they may have to work full-time to pay tuition, leaving little time for studying. By contrast, most wealthier children enter an elite school-to-career “pipeline.” They attend expensive first-rate preschools, followed by well-funded, high-quality public schools or elite private K–12 preparatory schools that groom them for college (Jackson 2017). These children tend to attend
exceptional state or private four-year colleges or (for the wealthiest children) elite Ivy League universities such as Harvard or Yale (Chetty et al. 2017). Children fortunate enough to be born into the upper class are thus prepared to enter prestigious, well-paying, powerful occupations. Especially for the wealthiest children, this includes high-level careers in law, business, and finance (National Public Radio 2014)—areas where they can maintain their strong influence on policies that benefit the wealthy.
In addition to exposure to stronger formal education, wealthier children develop valuable social capital, connections to people who can help them access jobs or other positions to advance in society. Wealthy children are more likely to have prestigious connections that can help them get ahead. For example, someone from an upper-class family may have a family friend who can help them obtain a coveted position clerking for a prominent judge, whereas a working-class person’s family friend may be able to help them get a cashier position at the local diner.
Children from higher social classes also absorb those classes’ cultural capital, or the informal knowledge, tastes, and preferences learned in a specific social class that help convince others that one belongs in that class. For example, middle-class children may know more than working-class children about the timeline and expecta-tions for applying to college. Middle-class cultural cap-ital makes navigating middle-class institutions, such as college and white-collar workplaces, much easier. This paves the way for entering and succeeding in college, as well as prestigious, well-paying occupations (Lareau 2003). For example, a medical school applicant who mentions hobbies such as skiing and golf in their inter-view will likely have a better chance of admission than
q FIGURE 2.8
Income Equality by Gender—Full-Time Workers
MenWomen
1000
Med
ian
Wee
kly
Inco
me
in D
olla
rs
900
800
700
600
500
400
300
200
100
0
Gender
Source: U.S. Department of Labor (2019b).
q FIGURE 2.9
Income Equality by Education—Full-Time Workers Age 25 and Older
No high schooldiploma
High school diploma Bachelor's degree
Education Level
1400
Med
ian
Wee
kly
Inco
me
in D
olla
rs
1200
1000
800
600
400
200
0
Source: U.S. Department of Labor (2019b).
Copyright ©2021 by SAGE Publications, Inc. This work may not be reproduced or distributed in any form or by any means without express written permission of the publisher.
Do not
copy
, pos
t, or d
istrib
ute

28 UNIT I • INEQUALITIES AS SOCIAL PROBLEMS
one who mentions preferring to shoot pool and watch NASCAR, simply because they seem similar to the pres-tigious people making admission decisions.
Check Your Understanding1. How do race, gender, and education level relate to
economic inequality?
2. What factors create economic inequality among racial groups?
3. What factors create economic inequality between men and women?
4. What kinds of things make it easier for middle- class and wealthy children to be financially successful?
5. What are cultural capital and social capital, and how do they affect mobility?
Social Problems Caused by Economic Inequality2.6 What are some social problems caused by high levels of economic inequality?
Some people argue that the absolute amount of money people have is more important for well-being than how equally it is distributed. However, high levels of economic inequality—regardless of how much money each person
has—create problems for individuals and entire societ-ies. These problems include physical and mental health problems, human rights violations, society’s loss of tal-ented people’s contributions, limited social class mobil-ity, environmental problems, violence, and government problems, just to name a few. In fact, this chapter on eco-nomic inequality comes first because it connects to all the other social problems covered in this book. Be sure to keep economic inequality’s influence in mind as you read the subsequent chapters.
Health Problems and Human Rights ViolationsHigh economic inequality levels lead to higher rates of physical and mental health problems and reduced life expectancy. In part, lower-income people’s lack of access to high-quality health care (particularly within the United States) contributes to these overall effects by worsening their health. Additionally, people in more eco-nomically unequal societies are less happy, less likely to feel like they are part of a community, less trusting, and more anxious about their social status (Buttrick and Oishi 2017). Health inequalities are covered in greater detail in Chapter 14. Finally, human rights violations, including loss of civil liberties and government repres-sion, are also more likely to occur in societies with high levels of economic inequality (Abouharb and Cingranelli 2007; Landman and Larizza 2009; Sen 1999).
Economic inequality can create differences in cultural capital—class-based informal knowledge, tastes, and preferences—that can make moving up
the social class ladder harder for those with fewer resources.
View the Stanford Center on Poverty and Inequality’s video explaining the connection between family life, social class, and cultural capital at https://www.youtube.com/watch?v=5DBEYiBkgp8. Then view this video about first-generation college students at https://www.nytimes.com/2015/04/12/education/edlife/first-generation-students-unite.html?_r=0. Write your answers to the questions below. (You are not expected to disclose personal information you do not wish to share.)
1. Besides money, what kinds of things make attend-ing college more challenging for students who do not come from middle-class backgrounds?
2. What are some of the unique strengths of students who do not come from middle-class backgrounds?
3. Consider your own social class. What are some examples of your cultural capital? How has this advantaged and/or disadvantaged you in college? If you are not comfortable sharing your personal information, discuss someone else you know.
4. How could these advantages or disadvantages affect mobility?
5. Given your answers, what policies would you sug-gest to even the playing field for under-resourced students in higher education?
CONFRONTING SOCIAL PROBLEMS 2.3 Cultural Capital and Mobility
Copyright ©2021 by SAGE Publications, Inc. This work may not be reproduced or distributed in any form or by any means without express written permission of the publisher.
Do not
copy
, pos
t, or d
istrib
ute

Chapter 2 • ANALYZING ECONOMIC INEQUALITIES 29
Loss of Contributions to SocietyCountries with high levels of economic inequality are less likely to have occupational and income mobility than are other societies (Gregg et al. 2017; Gugushvili 2017). This means that talented people from lower social classes—such as someone poor who has the ability and drive to become an outstanding medical doctor (or even find a cure for cancer!)—may not have the opportunities needed to achieve their goals, and society will not benefit from their full potential contributions.
Harm to the EnvironmentWhen economic inequality is high, it harms the natural environment. High levels of economic inequality lead to increased consumption, which encourages more production and depletes natural resources, as you will read about in Chapter 8. Too much economic inequality also creates unequal levels of political power, which makes it harder for poorer people to prevent the placement of pollutants in their neighborhoods (Cushing et al. 2015). For example, it is relatively common for Japanese residents to negotiate with companies about pollution. However, the growing power, money, and privilege gap between the residents and industry representatives has reduced residents’ bargaining power and led to a decline in air quality in urban Japan’s residential and commercial areas (Kasuga and Takaya 2017). High levels of income inequality have also contributed to high levels of carbon dioxide emissions in many other areas of the world, especially in Brazil, India, and China (Mahalik et al. 2018).
Increased ViolenceRates of violent crimes, including homicide ( Fajnzylber, Lederman, and Loayza 2002; Kawachi, Kennedy, and Wilkinson 1999; Wilkinson and Pickett 2009), are higher
in states and countries with higher levels of economic inequality, as Figure 2.10 illustrates. In fact, economic inequality is the best predictor of homicide rates (Daly 2016) and explains more than half of the difference in mur-der rates among U.S. states (Kennedy et al. 1998). Non-violent property crimes are also higher in U.S. states with higher economic inequality levels (Kawachi et al. 1999).
Government InstabilityFinally, high levels of economic inequality produce numerous problems for governments. Governments tend to become less stable (Jung and Sunde 2014; Korotayev et al. 2017) and more corrupt (You 2011) as economic inequality rises. Economic inequality creates polarization and tension between various groups of “haves” and “have-nots” (Jung and Sunde 2014), which can spark more acts of terrorism and antigovernment demonstrations (Koro-tayev et al. 2017) and can lead democracies to devolve into oligarchies or dictatorships (Jung and Sunde 2014).
Problems for IndividualsHigh economic inequality levels that affect society create problems that bleed over into individuals’ everyday lives. As mentioned earlier, people who live in countries with more economic inequality are more likely to be sick, anx-ious, less trustful of others, less happy, and less connected to others, and to die at younger ages (Buttrick and Oishi 2017). People living in areas with high levels of income inequality are more likely to have children before mar-riage and to remain single, which can put additional eco-nomic strain and emotional stress on parents (Cherlin, Ribar, and Yasutake 2016; Ishizuka 2018).
Economic downturns can exacerbate inequality and play havoc on individuals and families. For example, during the Great Recession of 2008, home values in the United States plummeted, many people lost their jobs, and economic inequality spiked (Wolff 2017b). Middle- class people struggled to pay their bills, and many lost their homes. People’s identities, strongly tied to their jobs, were threatened. When people are unsure of who they are, they can become depressed, anxious, and angry (Norris 2016). It is easy to feel hopeless if, despite great effort, you cannot pay your bills, live up to your potential, or move up in social class (Gugushvili 2017).
Check Your Understanding1. What kinds of problems can high levels of
economic inequality create for society?
2. What kinds of problems can high levels of economic inequality create for individuals?
q FIGURE 2.10
Homicide Rates Are Higher in More Unequal Rich Countries
Hom
icid
es p
er m
illio
n
Por
tuga
l
US
A
r = 0.47p-value = 0.02
Low Incom inequality High
Sin
gapo
re
New
Zea
land
UKA
usta
lia
Italy
Isre
l
Fra
nce
Gre
ece
Irel
andSw
itzer
land
Net
herla
nds
Ger
man
y
Aus
tria
Den
mar
k
Nor
way
Japa
n
Spa
in
Fin
land
Sw
eden
Bel
gium Can
ada
60
40
20
0
Source: Based on Wilkinson and Pickett (2009).
Copyright ©2021 by SAGE Publications, Inc. This work may not be reproduced or distributed in any form or by any means without express written permission of the publisher.
Do not
copy
, pos
t, or d
istrib
ute

30 UNIT I • INEQUALITIES AS SOCIAL PROBLEMS
Solving the Social Problem of Economic Inequality: Policies, Movements, and Action2.7 What can we do to reduce economic inequality?
If, as you have read, government policies can create and exacerbate economic inequality, they can also reduce it. How, then, can you get your government to address eco-nomic inequality? Here’s a hint: sociological tools can help you do so!
Evaluating SolutionsAs you evaluate potential solutions to economic inequality, it will help to revisit social reproduction theory and the Davis-Moore hypothesis. They provide criteria by which to measure successful solutions. As you will see, both perspectives suggest solutions to high levels of economic inequality that can strengthen societies and benefit individuals as well.
Solutions Based on Social Reproduction Theory: To review, social reproduct ion theory states that powerful people’s control of resources and laws lim-its poorer people’s resources and opportunities, which creates excessive economic inequality. A successful solution based on social reproduction theory would ensure that
• people born rich don’t stay rich simply because they were born into wealth and people born poor don’t stay poor simply because they were born into poverty;
• similar resources for economic success are available to everyone, regardless of social class;
• talented, hardworking people can achieve their occupational and financial goals, regardless of their class of origin; and
• laws and policies do not advantage some people over others.
Solutions Based on the Davis-Moore Hypothesis: Recall that this perspective states that economic inequal-ity is good because it ensures that people are willing to do the most difficult and important jobs (for the most rewards) and that people take the jobs they are most capa-ble of doing well. Working from this perspective, some people might even say we do not need to do anything about economic inequality. However, hard evidence shows that high levels of economic inequality are bad for individuals and society.
A successful solution based on the Davis-Moore hypothesis would ensure that
• the smartest, most talented people enter the most important and challenging jobs, and they are happy and fulfilled in those jobs;
• people enter jobs that best fit their skills, talents, and work ethic, ensuring that society overall benefits from a good person–job fit;
• people move up in social class if they are talented and work hard;
• people are not rewarded if they do not contribute to society, even if they are born rich; and
• the most difficult and important jobs pay the most.
Consider the aims of both perspectives as you evaluate the policies that countries have implemented.
U.S. Policies That Decreased Economic Inequality in the PastRemember, U.S. economic inequality has not always been as extreme as it is today. Government policies have helped reduce economic inequality during various times in the history of the nation. We now look at two collections of such policies: the New Deal and the War on Poverty.
The New Deal: The New Deal era, from 1933 to 1939, was a collection of programs and regulations devised by President Franklin D. Roosevelt’s administration to reverse the high unemployment rates and financial system collapse brought on by the Great Depression (Berkin et al. 2011). Programs such as the Public Works Administration boosted employment by hiring peo-ple to build roads, bridges, airports, and other elements of U.S. infrastructure. Laws such as the Glass-Steagall Act of 1933 ensured that the risky bank practices that brought on the Great Depression could no longer occur (Krugman 2012). The New Deal also provided direct money transfers to those in need. For example, the Food Stamp Plan redistributed tax revenue to poor people to help them buy groceries (Moran 2011).
New Deal programs helped bring about economic recovery and reduced economic inequality (Billington and Ridge 1981). Workers’ rights were written into law. The National Labor Relations Act of 1935 guaranteed workers the right to form labor unions and engage in collective bargaining for better wages and working conditions (Kennedy 2001). The Fair Labor Standards Act of 1938 established a maximum number of weekly hours employees could work, set a minimum hourly
Copyright ©2021 by SAGE Publications, Inc. This work may not be reproduced or distributed in any form or by any means without express written permission of the publisher.
Do not
copy
, pos
t, or d
istrib
ute

Chapter 2 • ANALYZING ECONOMIC INEQUALITIES 31
wage, and made child labor illegal. Many workers’ wages rose as a result, even as weekly working hours fell (Clements 2008).
These programs, along with the effects of World War II, helped the economy recover and the poor, working, and middle classes gain more income and opportunities to climb the social class ladder. In 1928, just before the Great Depression, the richest 1% of Americans received about 24% of all U.S. income; by 1940, after New Deal programs went into effect, their share had decreased to about 16% (Piketty and Saez 2013). This did not happen at the expense of overall economic growth; the U.S. econ-omy grew, on average, by 7.7% per year between 1933 and 1941 (U.S. Census Bureau 1975). Unemployment rates also dropped, from about 25% in 1933 to about 10% in 1941 (Smiley 1983).
The War on Poverty: Although the New Deal helped reduce inequality, poverty rates were still high, rang-ing from 19% to 22% between 1959 and 1964, and even higher for children and adults over age 65 (Semega, Fontenot, and Kollar 2017a). Additionally, some of the root causes of poverty—a lack of affordable health care and education—had not been fully addressed. So between 1964 and 1968, President Lyndon B. Johnson declared a war on poverty and initiated a collection of poverty-fighting programs, including Head Start, Work Study (to help college students fund their education), Medicaid (health insurance for impoverished people), and the Job Corps, and expanded funding for subsidized public housing and community health centers. President Johnson also increased Social Security payments and created Medicare (health care coverage for people over age 65) to reduce senior citizens’ poverty rates (Bailey and Danziger 2013).
Although some analysts claim the War on Poverty failed (because poverty still exists), the policies did help reduce U.S. poverty rates, especially for senior citizens,
as shown in Figure 2.11. Between 1963 and 1973, eco-nomic inequality decreased, with wages growing for low earners and remaining steady for high earners (Bailey and Danziger 2013).
Today, some of the War on Poverty programs still exist, but a comprehensive, well-funded government approach to combating poverty and economic inequality has essentially been abandoned in favor of neoliberal pol-icies. The result is higher levels of economic inequality.
Current Policies and Economic InequalityThere is no “quick fix” for high levels of economic inequality. We must consider each country’s political and social circumstances to successfully address it (Kerbo 2006). However, if we know what causes economic inequality and what policies have successfully reduced it, we can start working toward a solution.
Neoliberal and Economic Redistribution Policies: As you read earlier, U.S. economic inequality is high, in part because U.S. policies differ from those of other Global North nations and from those of the United States during other eras. Most other Global North nations today redistribute more wealth through taxation and government programs than the United States does.
Progressive tax policies are the first step in economic redistribution, and in reducing economic inequal-ity. Countries with higher tax rates generally have less income inequality and higher mobility rates. As Figure 2.12 shows, the typical tax rate for a single, childless U.S. worker with an average salary is low compared with those for workers in other Global North nations. As Figure 2.13 reveals, Ireland, Belgium, and Norway have reduced their income inequality by 40%, 39%, and 32% (respectively) by implementing progressive tax policies and cash transfers (Thévenot 2017). Denmark, Greece,
q FIGURE 2.11
Poverty Rates by Age (1959–2014)Percent Recession
Aged 18 to 64
50
45
40
35
30
25
20
15
10
5
01959 1965 1970 1975 1980 1985 1990 1995 2000 2005 2010 2014
Aged 65 and older
21.1%
13.5%10.0%
Under age 18
Source: U.S. Census Bureau.
q FIGURE 2.12
2018 Employee/Employer Combined Taxation Rates by Country
United States Norway Denmark Sweden Belgium
60
50
40
30
20
10
0
Per
cent
age
of L
abor
Cos
ts G
oing
to T
axes
Country
Source: Adapted from Organisation for Economic Co-operation and Development (2019).
Copyright ©2021 by SAGE Publications, Inc. This work may not be reproduced or distributed in any form or by any means without express written permission of the publisher.
Do not
copy
, pos
t, or d
istrib
ute

32 UNIT I • INEQUALITIES AS SOCIAL PROBLEMS
and Portugal, among other countries, have implemented similar policies with similar results (Thévenot 2017). U.S. redistributive policies are comparatively minimal (Schlozman et al. 2017), resulting in only a 19% reduc-tion in income inequality.
Redistribution policies that reduce economic inequal-ity can also increase intergenerational mobility. For example, as Figure 2.14 shows, in Nordic countries (such as Denmark) sons’ incomes are much less closely asso-ciated with their fathers’ incomes than they are in the United States (Corak 2013; Gregg et al. 2017).
Minimum-wage laws also inf luence economic inequality. In contrast to several other Global North
countries (see Figure 2.15), U.S. laws have suppressed the federal minimum wage to very low levels that have not kept up with inflation or economic growth. This means that low-wage workers rarely get raises compared with high-earning individuals, which widens the income gap. For example, in 2017 the annual pay of the average CEO was 361 times what the average production worker earned in a year (AFL-CIO 2018).
The Decline of Labor Unions: As we saw with New Deal legislation, ensuring workers’ and unions’ rights is another way to reduce economic inequality (Cole 2015). But the reverse has happened in the United States as labor union membership and power have declined (Iceland 2013:88). As noted earlier, labor union mem-bership has dropped to almost half of what it was three decades ago (U.S. Department of Labor 2019a).
Neoliberal political efforts to reduce labor union membership and weaken the power of unions have left unions relatively powerless (Jacobs and Myers 2014). As of 2018, 28 U.S. states have adopted “right-to-work” laws (National Conference of State Legislatures 2018). Despite the name, these laws do not guarantee anyone a job. Instead, they make it illegal for unions to require non-union members to pay dues. But laws still require unions to represent all the employees—even those who did not pay dues. So unions must try to do the same job of rep-resenting workers’ rights with fewer resources, leaving them less effective. The June 2018 Janus vs. AFSCME U.S. Supreme Court decision affirmed the legality of so-called right-to-work laws (U.S. Supreme Court 2018).
Right-to-work laws leave both union and nonunion employees with lower pay, even when controlling for other factors that could affect wages (Gould and Kimball 2015). They also make it less likely for employees to have health benefits (Gould and Shierholz 2011). These limits
q FIGURE 2.13
Percent Reduction in Income Inequality Through Redistributive Policies
50
40
30
20
10
0
Per
cent
Red
uctio
n in
Inco
me
Ineq
ualit
y
United States Norway Belgium
Country
Ireland
Source: Schlozman et al. (2017); Thévenot (2017).
q FIGURE 2.14
Social Class Reproduction by Country
Str
engt
h of
Cor
rela
tion
Bet
wee
n Fa
ther
s' a
nd S
ons'
Inco
me*
0.5
0.4
0.3
0.2
0.1
0United States Sweden Norway
Country
Denmark
Source: Corak (2013).
*Higher numbers reflect less mobility
q FIGURE 2.15
2017 Hourly Minimum Wage by Country in U.S. Dollars
Min
imum
Wag
e in
Dol
lars
12
10
8
6
4
2
0United States Ireland Netherlands Belgium Luxembourg
Country
Source: Organisation for Economic Co-operation and Development (2018c).
Copyright ©2021 by SAGE Publications, Inc. This work may not be reproduced or distributed in any form or by any means without express written permission of the publisher.
Do not
copy
, pos
t, or d
istrib
ute

Chapter 2 • ANALYZING ECONOMIC INEQUALITIES 33
on unions reduce their power and resources, potentially increasing economic inequality as pay and benefits con-tinue to decrease.
Social Movements to Reduce Economic InequalityWhen many people get together to try to make a change in society, they may create a social movement. Several social movements geared toward reducing economic inequality have developed in recent years. One example is the Occupy Wall Street movement.
Occupy Wall Street: The Occupy Wall Street move-ment began in 2011 as a protest and ultimately spread throughout many U.S. cities. Large groups of people camped out for several months in New York City’s finan-cial district (near banks and other Wall Street offices) and in foreclosed homes. Protesters aimed to call attention to high economic inequality levels, especially to the concen-tration of wealth owned by the richest 1%. Protesters also wanted to show how high economic inequality levels con-strain opportunities and wealth accumulation for poor and middle-class people.
The Occupy Wall Street movement was effective in some ways but not in others. It drew national attention to the problem of high levels of economic inequality (Gitlin 2013), which even became a major focus during the 2012 presidential election. Both major party presidential can-didates (Barack Obama and Mitt Romney) referenced it in their campaigns (Boxer 2011; Memoli 2011). The movement also helped spur on the highly visible fast-food worker strikes throughout the nation (Sanburn 2013), as well as the movement for a $15/hour minimum wage (Chicago Tribune 2016).
The Occupy Wall Street movement swayed the pres-idential election results toward Barack Obama, a pro-gressive candidate, but it did not hold the attention of the public long enough to sustain the creation of policies that would have reduced inequality (Gitlin 2013). The U.S. government ultimately broke up the Occupy camps, and the movement largely faded away and became less pow-erful (Gitlin 2013). Nevertheless, Occupy Wall Street
Which approaches to reducing inequality best meet the criteria for a “good” solution according to social reproduction theory? How about according to the Davis-Moore hypothesis?
CONSIDER THIS 2.4
seems to have led to an ongoing awareness of economic inequality in the United States.
Anger about economic inequality and a “status quo” government played a role in widespread support for Democratic presidential candidate Bernie Sanders and, ultimately, the election of Republican Donald Trump as president. But instead of people building solidarity around the idea of redistribution, several groups with opposing interests have emerged. Some of these groups continue to fight for changes in tax policy, wage and union laws, and more equal economic distribution. Oth-ers turn to blaming groups such as immigrants for the high levels of economic inequality. (See Chapters 3 and 7 for more information on racism and immigration.)
How Sociological Tools Can Help Us Understand and Address Economic InequalityHigh economic inequality levels are not inevitable. Movements such as Occupy Wall Street show that people are becoming more aware of the extent of economic inequality and want to change it. Other countries, and the United States in the 1930s and 1960s, have made structural changes that reduced economic inequality. You can start working toward reducing economic inequality by using your sociological imagination to recognize how large-scale forces, such as the structure of our economy and our cultural beliefs about why people are poor, affect your life and the lives of others. You can then use your sociological imagination to envision ways to influence society. You can use sociological skills to research inequality and evaluate social programs and policies (see Chapter 1), to understand the facts about inequality and create effective solutions. Furthermore, you can evaluate potential solutions by using sociological frameworks like social reproduction theory and the Davis-Moore hypoth-esis as guides. You can also work with others to put your proposed solutions into action through social activism.
Many sociologists put their skills to work at nonprofit and government organizations, as community organiz-ers, researchers, and program evaluators. For example, Jonathan Fuentes (see the “Sociologist in Action” box) uses his understanding of culture and structure to help people find jobs. Likewise, researchers at the nonprofit Economic Policy Institute in Washington, D.C., look for social patterns in economic inequality, track new govern-ment policies on wages and taxes, and critically evaluate how power plays a role in the creation of laws. Like others who do sociological work and activism every day, you can be an effective part of the change you want to see in soci-ety by using the sociological skills you have learned.
Copyright ©2021 by SAGE Publications, Inc. This work may not be reproduced or distributed in any form or by any means without express written permission of the publisher.
Do not
copy
, pos
t, or d
istrib
ute

34 UNIT I • INEQUALITIES AS SOCIAL PROBLEMS
Check Your Understanding1. What policies has the United States implemented
in the past to decrease economic inequality?
2. What pol icies have other Global North nations used to successfully reduce economic inequality?
3. What current policies support high levels of eco-nomic inequality in the United States?
4. How did Occupy Wall Street contribute to fight-ing economic inequality?
5. How can you use sociological tools to reduce ine-quality in the United States?
JONATHAN FUENTES
As an undergraduate student in sociology, I learned how structural and cultural factors can shape an individual’s opportunities and life
chances. Today, I work in case management and realize how these factors impact clients’ lives and their ability to access a very important resource—employment. The data collection and analysis skills I obtained as a sociology major also help me understand my clients’ needs and customize a plan for them that takes into account the impact of societal forces.
As an employment case manager for Catholic Charities, I assist low-income clients with their job searches through résumé building, applying for jobs, and preparing for interviews. When a client seeks help with their employment search, the solution is not always as straightforward as creating a résumé. Often, my clients deal with problems that expand past the scope of employment. In addition to services directly related to finding a job, I also assist with preventing evictions and utility disconnection, providing financial assistance to families, improving food security, and making referrals to other organizations for additional services.
Before addressing my clients’ needs, I conduct an intake. This allows me to learn in depth about a client’s life and their current situation. Through a series of questions, I collect information on the clients’ demographics, life events, income, education, and employment history. I then identify factors that can limit a client’s access to employment, which helps me create a descriptive baseline and framework that I can reference when seeking services and resources for the client. Cultural, social, institutional,
or even physical factors outside of the control of my clients can constrain their potential employment outcomes.
I once worked with a client who was a doctor in his home country. He was authorized to work in the United States; however, he did not speak English fluently. This created a barrier to employment, as he could not communicate during interviews. Another client I assisted had just finished a graduate program in the medical field but had recently lost a job and transitioned into a homeless shelter. Most job applications require a home address. Once the housing issue was resolved, we discovered that the brief event of homelessness had led to a lowering of his credit score. This could have become another obstacle to finding employment, as it has become common practice for employers to require a credit review in addition to a background check.
Ultimately, my work in case management is geared toward helping clients meet their needs. To do so, I have to make sense of the information a client provides. By using data collection and analysis skills, I can note and understand the structural and cultural factors that shape a client’s life experience. With that knowledge, I can assist my clients by creating alternative pathways to employment.
Jonathan Fuentes graduated from St. Mary’s College of Maryland with a bachelor’s degree in sociology and works as an employment case manager at Catholic Charities in Washington, D.C.
Discussion Questions: How have structural and cultural factors, such as those Jonathan describes, affected your ability to get a job? Why?
SOCIOLOGIST IN ACTIONUsing Sociology to Help People Get Better Jobs
Copyright ©2021 by SAGE Publications, Inc. This work may not be reproduced or distributed in any form or by any means without express written permission of the publisher.
Do not
copy
, pos
t, or d
istrib
ute

Chapter 2 • ANALYZING ECONOMIC INEQUALITIES 35
CONCLUSION
As we’ve seen, some people contend that economic inequality is necessary to motivate people to do the hardest jobs, or to spend many years training for jobs that require extensive education. However, others maintain that high inequality levels are purposefully created and worsened by the wealthiest people so they can keep their wealth and power. Data show that too much inequality is bad for individuals and society, and that racist and sexist policies contribute to this inequality.
Fortunately, you can use your sociological skills to help reduce economic inequality. Your knowledge of the power of social
structure can help you evaluate and propose policies that address economic inequality. You can support candidates who work toward reducing economic inequality and discrimination, engage in collective action, or like Jonathan Fuentes, work in a helping profession either as a paid employee or volunteer. In Chapter 3, you’ll read about another social problem with ser ious negat ive consequences—racism and racial inequalities—and what you can do to combat that social problem as well.
Is economic inequality necessary to motivate people to do the work a society needs done? Write a short essay (three paragraphs) presenting an argument that inequality is necessary
and a contrasting argument that inequality is not necessary in your
town, region, state, or country. Which argument do you find most convincing? Provide evidence to bolster the argument that you choose as most convincing.
CONFRONTING SOCIAL PROBLEMS 2.4Does Society Need Economic Inequality?
REVIEW
1. What are social class and economic inequality?
Social class is one’s position in a hierarchical society, defined by education, occupation, and income. In a class-based society, upward or downward movement is permissible. Economic inequality refers to the income and/or wealth gap among individuals, groups, or countries. People often remain in the social class in which they were born, in part because high levels of economic inequality make it difficult to move up or down in social class.
2. What are the different viewpoints on economic inequality?
Social reproduction theory maintains that high economic inequality levels exist because of conscious efforts of the wealthiest people, who want to keep their advantages in society. Social reproduction theorists also argue that too much economic inequality is bad for individuals and society, and does not allow talented, hardworking people to reach their full potential. People who favor the Davis-Moore hypothesis believe some economic inequality is good because without it people would not invest money and time to get the training to do difficult jobs (e.g., medical doctor).
3. How are wealth and income distributed in the United States and globally?
Within the United States, wealth and income are distributed very unequally, with the wealthiest 1% owning almost 40% of all U.S. wealth (vs. the poorest 80%, who own only 10% of U.S. wealth). Although economic inequality exists around the world, many other Global North countries have smaller wealth gaps. Economic inequality within the United States has grown sharply since the late 1970s. On the global level, economic inequality among nations has decreased somewhat, but it has increased within nations. Women and people of color are especially likely to be on the lower end of the wealth and income scales.
4. What is the likelihood of moving up or down in social class in the United States?
Since the early 1980s, mobility has decreased in the United States. Social class reproduction is now much more likely than it was between 1900 and 1980, especially for people born into the wealthiest and poorest families. As economic inequality increases, the likelihood of moving into a different social class than the one into which you were born decreases. Mobility is more likely in many other Global North nations than in the
Copyright ©2021 by SAGE Publications, Inc. This work may not be reproduced or distributed in any form or by any means without express written permission of the publisher.
Do not
copy
, pos
t, or d
istrib
ute

36 UNIT I • INEQUALITIES AS SOCIAL PROBLEMS
United States because of those countries’ strong redistribution policies that reduce economic inequality and promote mobility. Racist and sexist policies and other structural factors also limit mobility for members of nondominant groups.
5. What has led to high levels of economic inequality in the United States?
Neoliberal policies, globalization, automation, and the decline of unions have increased economic inequality. Other social problems, such as racism, fixed gender roles, and educational inequalities also contribute to economic inequality.
6. What are some social problems caused by high levels of economic inequality?
High levels of economic inequality lead to physical and mental health problems, human rights violations, society’s loss of
talented people’s contributions, limited social class mobility, environmental problems, violence, and corrupt and ineffective government.
7. What can we do to reduce economic inequality?
There are several ways to reduce economic inequality, inc luding progress ive taxat ion pol ic ies, weal th redistribution, a higher minimum wage, and laws that strengthen unions. You can help tackle economic inequality by using sociological concepts and skills to help inform and promote inequal i ty-reducing pol ic ies and social movements, and by fighting racism and sexism. You can also work in a helping profession as a paid employee or volunteer.
KEY TERMS
cultural capital 27
Davis-Moore hypothesis 20
economic inequality 17
globalization 25
income 22
intergenerational mobility 23
intragenerational mobility 23
meritocracy 19
mobility 23
negative wealth 22
neoliberalism 25
redistribution policies 25
social capital 27
social class 18
social class reproduction 24
social reproduction theory 19
social structure 19
stratified 18
wealth 22
SUGGESTED LINKS
• “Wealth Inequality in America”—https://truthout.org/video/wealth-inequality-in-america/
• “Gilded Age 2.0: U.S. Income Inequality Increases to Pre-Great Depression Levels”—http://fortune.com/2019/02/13/us-income-inequality-bad-great-depression/
• “Is America Dreaming? Understanding Social Mobility”—https://www.youtube.com/watch?v=t2XFh_tD2RA
• Born Rich (full film $4.99 to view/download on Prime Video)—https://www.amazon.com/Born-Rich-Georgina-Bloomberg/dp/B0002MPPVU
• “Occupy Wall Street: The Story Behind Seven Months of Protest”—https://www.theguardian.com/world/video/2012/apr/13/occupy-seven-months-of-protest-video
Get the tools you need to sharpen your study skills. SAGE edge offers a robust online environment featuring an impressive array of free tools and resources. Access practice quizzes, eFlashcards, video, and multimedia at edge.sagepub.com/atkinson.
Copyright ©2021 by SAGE Publications, Inc. This work may not be reproduced or distributed in any form or by any means without express written permission of the publisher.
Do not
copy
, pos
t, or d
istrib
ute

Copyright ©2021 by SAGE Publications, Inc. This work may not be reproduced or distributed in any form or by any means without express written permission of the publisher.
Do not
copy
, pos
t, or d
istrib
ute