Embed Size (px)
Citation preview

1

2
CHAPTER 2
Question 1 Aim / Objective To investigate different cellular structures that present in a plant cell and
animal cell that can be seen under light microscope
Problem statement 1. Do cellular structures in plant cell differ from that of in animal cell? 2. How can we see plant cell and animal cell?
Hypothesis 1. More cellular components can be seen in plant cell compared to animal cell
2. Plant cell different from animal cell
Variables Manipulated variable: types of cells Responding variable: the presence of cellular components Fixed variable: same microscope, same magnification
Apparatus and materials
Materials: cheek cell, onion bulb, iodine solution, distilled water, methylene blue Apparatus: a light microscope, glass slide, cover slips, a scalpel, forceps, a glass dropper, mounting needle and filter paper
Procedure 1. Obtain scale leaf from onion bulb 2. Using a pair of forceps, peel of the transparent epidermis from the
inner surface of onion scale leaf 3. Put a drop of water onto the middle of the slide and place the
epidermis on the drop of water 4. By using mounting needle, cover the specimen with cover slip 5. Add a drop of iodine solution onto one side of cover slip 6. Place a filter paper at the opposite end of the cover slip to allow the
iodine solution to spread through the epidermis 7. Use a piece of filter paper to absorb the excess iodine solution 8. Examine the slide under the light microscope using the low power
objective lens and then the high power objective lens 9. Draw the epidermis and label the structure which can be observe
Presentation of data Correct diagram, Labelling – cell membrane, cell wall, nucleus, vacuole Magnification

3
Chapter 3
Question 1
1(a)
Number of triangles surfaces
Time taken/min
4 42
8 28
16 13
1 (b)(i)
Able to state two correct observations based on the following aspect: P1: Number of triangles surfaces P2: Time taken for salt solution to move from mark A to mark B Sample answer
1 When the number of triangles surfaces is 4, the time taken for salt solution to move from mark A to mark B is 42 minutes.
2 When the number of triangles surfaces is 16, the time taken for salt solution to move from mark A to mark B is 13 minutes.
3 Increase the number of triangles surfaces increase the time taken for salt solution to move from mark A to mark B.
1(b)(ii)
Able to state two inferences correctly based on the following aspect: P1: surface area P2: diffusion of distilled water / rate of diffusion Sample answer
1 (4 triangular) increase / more the total surface area (of the potato block), increase rate of diffusion / more (water will diffuse into the potato block.
2 (16 triangular) decrease total surface area of the potato block is the decrease, rate of diffusion of (water) into the potato block
3 The surface area of the potato block is the lowest/highest, rate of distilled water diffusion is lowest/highest.
1(c) Able to state all 3 variables and the 3 methods to handle the variable correctly. Sample Answer:
Variables Method to handle the variable correctly
Manipulated variable Number of triangles surfaces / Total surface area
Use different number of triangles (surfaces which are 4, 8, 16)/ Change the number of triangles surfaces that are 4, 8, 16.

4
Responding variable Duration/ Time taken for salt solution to move from mark A to mark B/ Rate of Diffusion
Measure and record the time taken for salt solution to move from mark A to mark B by using stopwatch. Calculate the rate of diffusion by using the formula:
𝐷𝑖𝑠𝑡𝑎𝑛𝑐𝑒 𝑓𝑟𝑜𝑚 𝐴 𝑡𝑜 𝐵 (𝑐𝑚)
𝑇𝑖𝑚𝑒 𝑡𝑎𝑘𝑒𝑛 𝑓𝑜𝑟 𝑠𝑎𝑙𝑡 𝑠𝑜𝑙𝑢𝑡𝑖𝑜𝑛 𝑡𝑜 𝑚𝑜𝑣𝑒 𝑓𝑟𝑜𝑚 𝑚𝑎𝑟𝑘 𝐴 𝑡𝑜 𝑚𝑎𝑟𝑘 𝐵 (min)
Constant variable Concentration of salt solution / Distance from A to B / Size of potato block
Fix the same concentration of salt solution that is 10%. / Fix the same distance from A to B which is 3 cm / used the same size of potato block is 5cm x 7cm
1(d) Able to make a hypothesis based on the following aspect: P1: Manipulated variable: Number of triangular surface / total surface P2: Responding variable; Time taken for salt solution move from A to B / rate of diffusion R: Relationship Sample Answer:
1 The higher / the number of triangles surfaces, the shorter the time taken for salt solution to move from A to B./ vice versa
2 The higher the total surfaces area of potato block, the shorter the time taken for salt solution to move from A to B./ vice versa
3 The higher the number of triangles surfaces, the higher the rate of water diffusion/vice versa
4 The higher the total surfaces area of potato block, the shorter the time taken for salt solution to move from A to B/ vice versa
1(e)(i) Able to construct a table which contain the following aspects: P1: Able to state the 3 titles with units correctly. P2: Able to record all data correctly. P3: Able to calculate the rate of diffusion Sample answer:
Number of triangular surfaces
Time taken for salt solution to move from A to B/cm
Rate of Diffusion/cmmin-1
4 42 0.07
8 28 0.11
16 13 0.23
1(e)(ii) Able to plot the graph correctly:

5
Criteria: P: Correct Axis with label, uniform scale and unit: Y axis, Rate of Diffusion: X axis, Number of triangles surfaces T: All points plotted B: Joint all 3 points
1(f) Able to explain the relationship between the number of triangular surface and the rate of diffusion accurately. Sample answer: R1: Increase the number of triangular surface increase the rate of diffusion of water E1: Increase total surface area E2: More water molecule diffuses in the potato block in the short time
1(g) Able to state the operational definition of rate of diffusion based on the following aspects: P1: Shows time taken of salt solution move from A to B P2: in different number of triangular surface of potato block P3: increase the total surface of potato, increase rate of diffusion of water // rate of diffusion of water depends on the total surface of potato block Sample answer The rate of diffusion is time taken for salt solution to move from A to B when different number/size of triangles surface is used. Increase the total surface area of potato block, increase the rate of diffusion / of (distilled water) diffused into the potato block.
1(h) Able to predict using all the following criteria: P1: Correct prediction, state the value E1: Reason E2: Effect Sample answer P1: Time taken for salt solution move from A to B is less than 13 minutes // any value less than 13 minutes. E1: High gradient concentration between distilled water and 30% salt solution E2: The rate of water diffusion into potato block will be faster / Increase / more than 0.23cmminutes-1 // More water molecule diffuse into potato block in the short time.
1(i) Able to classify all the organ in table correctly:
Organs having well adapted surfaces for their effective function
Organs without surfaces well adapted for their effective function
Small intestines Lungs Brain
Esophagus Pancreas
Liver Heart

6
Question 2
1(a) Able to record all 4 readings for the difference in mass of visking tubing correctly Sample answer:
Concentration of sucrose solution (%)
Difference in mass of visking tubing after 30
minutes (g)
10 0.65
20 0.90
30 1.45
40 2.65
1 (b)(i) Able to state two correct observations based on the following criteria C1 – concentration of sucrose solution C2 – difference in mass of visking tubing Sample answer: Horizontal observations
1. In 10% concentration of sucrose solution, the difference in mass of the visking tubing after 30 minutes is 0.65 g.
2. In 40% sucrose solution, the difference in mass of the visking tubing after 30 minutes is 2.65 g.
Vertical observation
1. The difference in mass of visking tubing after 30 minutes in 10% concentration of sucrose solution is lower than in 40% concentration of sucrose solution.
2. The higher the concentration of sucrose solution, the larger the difference in mass of visking tubing after 30 minutes.
1(b)(ii) Able to state all correct inferences for the observation based on the criteria:
• C1: lower/higher concentration of sucrose solution
• C2 : less / more water molecules diffuse into the visking tubing
• C3 : by osmosis
Sample answer: Horizontal observations
1. In lower concentration of sucrose solution// dilute solution, less water molecules diffuse into the visking tubing by osmosis
2. In higher concentration of sucrose solution// concentrated solution, more water molecules diffuse into the visking tubing by osmosis.
Vertical observation

7
1. Less water molecules diffuse into the visking tubing in lower concentration of sucrose solution compared to higher concentration of sucrose solution by osmosis.
2. The higher the concentration of sucrose solution, the more water molecules diffuse into the visking tubing by osmosis.
1(c) Able to state all 3 variables and the 3 methods to handle the variable correctly. Sample Answer:
Variables Method to handle the variable correctly
Manipulated variable Concentration of sucrose solution
Use different concentration of sucrose solutions 10%, 20%, 30% and 40% // Change the concentration of 10% into 20%, 30% and 40% of sucrose solution
Responding variable Difference in / final mass of visking tubing after 30 minutes Rate of osmosis
Measure and record the difference in / final mass of visking tubing after 30 minutes by using electronic balance /weighing balance Calculate the rate of osmosis by using formula=
𝐹𝑖𝑛𝑎𝑙 𝑚𝑎𝑠𝑠 − 𝑖𝑛𝑖𝑡𝑖𝑎𝑙 𝑚𝑎𝑠𝑠 (𝑔𝑚𝑖𝑛 − 1)
𝑇𝑖𝑚𝑒 𝑡𝑎𝑘𝑒𝑛
Constant variable Time taken Volume of sucrose solution
Fix the time taken for 30 minutes Fix the volume of sucrose solutions at 10cm3
1(d) Able to state the hypothesis correctly based on the following criteria:
• R1 – concentration of sucrose solution
• R2 – difference in / final mass of visking tubing (after 30 minutes) // rate of osmosis
• H – the relationship Sample answer:
1. As the concentration of sucrose solution increases, the difference in mass of visking tubing (after 30 minutes)// rate of osmosis increases.
2. The higher the concentration of sucrose solution, the higher the difference in mass of visking tubing(after 30 minutes) //rate of osmosis
1(e)(i) Able to construct a table and record the result of the experiment with the following criteria
• C1: able to state the titles with units correctly

8
• C2: able to record all the data correctly
• C3: able to calculate the rate of osmosis correctly Sample answer:
Concentration of sucrose
solution (%)
mass of visking tubing after 30 minutes (g)
Difference in mass of
visking tubing
(g)
Rate of osmosis (g min -1 Initial mass (g) Final mass (g)
10 10.64 11.29 0.65 0.022/0.02
20 10.80 11.70 0.9 0.030/0.03
30 10.25 11.70 1.45 0.048/0.05
40 10.22 12.87 2.65 0.088/0.09
1(e)(ii) Able to draw the graph correctly with the following aspects:
• Axes (A) – both axis are labeled with units and uniform scales
• Point (P) – all points are correctly plotted / transferred correctly
• Shape (S) – able to join all the points to form a smooth curve graph.(reject straight line)

9
1(f) Able to interpret data correctly and explain the relationship based on
the following aspects
• P1 : distilled water is hypotonic to the concentration of sucrose solution( in visking tubing) // the concentration of sucrose solution is higher / hypertonic compared to distilled water // vice-versa
• P2 : increase the mass of visking tubing
• P3 : the rate of water molecules diffuse into the visking tubing is higher compared to the rate of water diffuse out of the visking tubing by osmosis
Sample answer: The mass of visking tubing increases (P2) as the distilled water (in the beaker) is hypotonic to the concentration of sucrose solution (in visking tubing) (P1). So the rate of water molecules diffuse into the visking tubing is higher compared to the rate of water diffuse out of the visking tubing by osmosis (P3).

10
1(g) Able to predict and explain the outcome of the experiment correctly based on the following item:
• P1: the difference in mass of visking tubing is less than 0.9 g
• R1: the hypertonic solution // the higher concentration of solution in the beaker compared to the solution in the visking tubing
• R2: more water molecules diffuse out of the visking tubing into the beaker by osmosis
Sample answer: The mass of visking tubing is less than 0.9 g because the solution in the beaker is hypertonic// the higher concentration of solution in the beaker compared to the solution in the visking tubing. So more water diffuse out of the visking tubing into the solution in the beaker by osmosis.
1(h) Able to define operationally based on the result of the experiment with the following aspects:
• C1: movement/diffusion of water molecules in / out across the visking tubing
• C2 :difference in mass /final mass of visking tubing (after 30 minutes)
• C3: different concentration of sucrose solution
Sample answer: Osmosis is the net movement / diffusion of water molecules in/ out of the visking tubing results in the difference in mass // final mass of visking tubing(after 30 minutes). It is affected by different concentration of sucrose solution
1(i) Able to classify all 3 solutions concentration and types of solution correctly
Solution concentration (%) Types of solution compared to the osmotic concentration of cell sap
0.25% Sodium chloride solution Hypotonic
0.80 % Sodium chloride solution Isotonic
1.10% Sodium chloride solution Hypertonic

11
Question 3
Aim / Objective
Problem statement What is the relationship between total surface area per volume ratio and the rate of diffusion?
Hypothesis The larger the total surface area per volume ratio / the smaller the size of cube, the faster the rat of diffusion
Variables Manipulated variable: total surface area per volume ratio / the size of cubes Responding variable: Rate of diffusion Fixed variable: Colored water temperature / time taken
Apparatus and materials
Materials: Potato, colored water Apparatus: Penknife, white tiles, beaker, forceps, basin, gridded transparency
Procedure 1. Potato are cut into 0.5cm, 2 cm, 3 cm and length of sides cubes each. 2. Then the cubes are immersed into a basin containing 100ml of
colored water 3. All the cubes are left for 30 minutes 4. After 20 minutes, the outer surface of the cubes are dried with filter
paper and cut into two halves 5. The percentage of colored area in each cube is estimated by using a
gridded transparency 6. The rate of diffusion of each cube is calculated by using a formula:
Rate of diffusion = 𝑃𝑒𝑟𝑐𝑒𝑛𝑡𝑎𝑔𝑒 𝑜𝑓 𝑐𝑜𝑙𝑜𝑟𝑒𝑑 𝑎𝑟𝑒𝑎 (%𝑚𝑖𝑛−1)
𝑡𝑖𝑚𝑒 𝑡𝑎𝑘𝑒𝑛
7. The results are recorded in the table 8. Beware of using knife
Presentation of data
Cube Length of side
/cm
Total surface
area cm2
Volume cm3
TSA/V ratio cm-1
Volume of
stained part
Percentage of
coloured area /%
A 0.5 1.5 0.125 12
B 1 6 1 6
C 2 24 8 3
D 3 54 27 2
E 4 96 64 1.5

12
CHAPTER 4
Question 1
1(a)
Test tube P Q R
Time taken for the starch to be hydrolyzed completely (min)
18 12 10
1 (b)(i) Able to state two correct observations correctly Each observation must have value for both MV and RV Sample answer
1 In test tube P/0.5% amylase enzyme, the time taken for the starch to be hydrolysed completely 18 minutes
2 In test tube R/1.5% amylase enzyme, the time taken for the starch to be hydrolysed completely 10 minutes
1(b)(ii) Able to state two inferences correctly based on the following aspect: P1: concentration of enzyme P2: rate of amylase enzyme reaction Sample answer
1 (In test tube P), the concentration of enzyme us low so rate of enzyme reaction is slow
2 (In test tube Q), the concentration of enzyme is high so rate of enzyme reaction is fast
1(c) Able to state all 3 variables and the 3 methods to handle the variable correctly. Sample Answer:
Variables Method to handle the variable correctly
Manipulated variable Concentration of amylase enzyme (%)
Use different concentration of amylase enzyme which are 0.5,1.0,1.5% of amylase enzyme
Responding variable Time taken for the starch to be hydrolysed completely (min)
Record the time taken for the starch to be hydrolysed completely by using stopwatch

13
Rate of amylase enzyme reaction
Calculate and record the rate of amylase enzyme reaction by using formula:
1
𝑇𝑖𝑚𝑒 𝑡𝑎𝑘𝑒𝑛 𝑓𝑜𝑟 𝑡ℎ𝑒 𝑠𝑡𝑎𝑟𝑐ℎ 𝑡𝑜 𝑏𝑒 ℎ𝑦𝑑𝑟𝑜𝑙𝑦𝑠𝑒𝑑 𝑐𝑜𝑚𝑝𝑙𝑒𝑡𝑒𝑙𝑦 (min)
Constant variable Temperature Volume of amylase enzyme
Fix the temperature of the solutions used at room temperature//37C Fix the volume of amylase enzyme at 2 ml
1(d) Able to make a hypothesis based on the following aspect: P1: Manipulated variable: concentration of amylase enzyme P2: Responding variable; Time taken for the starch to be hydrolyzed completely R: Relationship Sample Answer:
1 As the concentration of amylase enzyme increases, the time taken for the starch to be hydrolysed completely changes
1(e)(i) Able to construct a table which contain the following aspects: P1: Able to state the 3 titles with units correctly. P2: Able to record all data correctly. P3: Able to calculate the rate of enzyme reaction Sample answer:
Concentration of amylase enzyme (%)
Time taken for the starch to be hydrolysed completely (min)
The rate of enzyme amylase activity, 1/t
(minute-1)
0.5 18 0.056
1.0 12 0.083
1.5 10 0.100
1(e)(ii) Able to plot the graph correctly: Criteria: P: Correct Axis with label, uniform scale and unit: Y axis, Rate of enzyme activity: X axis, concentration of amylase enzyme T: All points plotted B: Joint all 3 points
1(f) Able to explain the relationship between the concentration of amylase enzyme and the rate of enzyme activity Sample answer: R1: The increase in the concentration of amylase enzyme will increase the number of active site E1: because more enzyme molecule is present E2: higher rate of enzyme activity
1(g) Able to state the operational definition of rate of diffusion based on the following aspects: P1: Chemical substance reacts on amylase

14
P2: Different concentration of amylase enzyme P3: time taken for the starch to be hydrolysed completely Sample answer Enzyme is the chemical substance that reacts on amylase which the different concentration of amylase enzyme affects the time taken for the starch to be hydrolysed completely
1(h) Able to predict using all the following criteria: P1: Correct prediction, state the value E1: Reason E2: Effect Sample answer P1: The time taken for the starch to be hydrolysed completely will increase/more than 10 minutes E1: Rate of enzyme reaction will be slower R: Because the enzyme has denatured due to high temperature
1(i) Able to classify all the organ in table correctly:
Materials Type of medium
Sodium hydroxide Hydrochloric acid
Distilled water
Alkali Acidic
Neutral

15
Question2 Problem statement 1 What is the effects of enzyme concentration on the activity of salivary
amylase on starch//the time taken for the hydrolysis of starch to be completed?
2 How does the enzyme concentration affect the activity of the salivary amylase//the time taken for the hydrolysis of starch to be completed?
Hypothesis 1 The higher the enzyme concentration, the higher the rate of enzyme reaction
2 When the enzyme concentration increase, the rate of enzyme reaction increase
Variables Manipulated variable: Enzyme concentration Responding variable: The rate of enzyme reaction//the time taken for hydrolysis of starch Constant variable: Temperature // volume of enzyme//concentration of substrate/starch
Apparatus and materials
Apparatus: (A) 1.Water bath // (Beakers +distilled water+ thermometer) 2.Tile with grooves 3.Test tube 4.Thermometer 5.Syringe 6.Stopwatch Note: the use of water bath is equal to (beaker + water + thermometer) Materials: (M) 1.starch suspension 2.saliva 3. distilled water 4.iodine solution
Procedure 1. Prepare three test tubes and label with A- C 2. Fill test tube A with 10% amylase enzyme concentration solution 3. Immerse the test tube in water bath set at 37C throughout the experiment 4. Meanwhile, add few drops of iodine solution onto the grooves of white tile 5. Add 4 ml of 1% starch suspension to the test tube by using a syringe 6. Immediately, start the stopwatch 7. Stir the mixture in the test tube by using a glass rod 8. Remove a small amount of the mixture and test with iodine solution on the tile 9. Repeat iodine test at 30-second intervals until the mixture does not turn blue-black when tested with iodine solution 10. Record the time taken for the hydrolysis of starch to be completed 11. Calculate the rate of enzyme reaction by using formula = 1 (min –1) time 12. Repeat step 2 to 11 with 15% and 20% of amylase enzyme concentration 13. Record the results in a table.

16
Presentation of data
Concentration of amylase (%)
Time taken for the hydrolysis of
starch to be completed (min)
Rate of enzyme reaction
(1/ t) (min-1)
10
15
20

17
CHAPTER 6
Question 1
1(a)
Type of fruit juice Volume of fruit juice used to decolourise 1ml DCPIP
solution (ml) Q R
Lime 1.6
Lemon 2.2
Orange 2.8
1 (b)(i) Able to state two different observations correctly: P1 – Type of fruit juice P2 – Volume of fruit juice used to decolourise 1ml DCPIP solution Sample answers Horizontal observation: 1. Volume of lime juice used to decolourise 1ml DCPIP solution is 1.6 ml 2. Volume of orange juice used to decolourise 1ml DCPIP solution is 2.8 ml Vertical observation:
1 Volume of lime juice used is less than orange juice to decolourise 1 ml of DCPIP.// vice versa
1(b)(ii) Able to make two inferences correctly based on the following criteria (Any two criteria’s) criteria: P1: more/less ascorbic acids P2: percentage/concentration of vitamin C more/less Sample answers
1 Lime juice contains more ascorbic acid due to high percentage/concentration of vitamin C.
2 Orange juice contains less ascorbic acid due to low percentage/concentration of vitamin C.
1(c) Able to state all 3 variables and the 3 methods to handle the variable correctly. Sample Answer:
Variables Method to handle the variable correctly
Manipulated variable

18
Type of fruit juices Use different type of fruit juice Use lime juice, lemon juice and orange juice
Responding variable Volume of fruit juice used to decolourise DCPIP solution The percentage of vitamin C
Record the volume of fruit juice used to decolourise 1ml DCPIP solution by using a syringe. Calculate the percentage of vitamin C using a formula 𝑉𝑜𝑙𝑢𝑚𝑒 𝑜𝑓 0.1% 𝑎𝑠𝑐𝑜𝑟𝑏𝑖𝑐 𝑎𝑐𝑖𝑑 𝑠𝑜𝑙𝑢𝑡𝑖𝑜𝑛
𝑣𝑜𝑙𝑢𝑚𝑒 𝑜𝑓 𝑓𝑟𝑢𝑖𝑡 𝑗𝑢𝑖𝑐𝑒 X 0.1%
Constant variable Volume of DCPIP solution Concentration of DCPIP
Fixed/use the same volume of DCPIP solution at 1 ml in each experiment Fixed/use the same concentration of DCPIP solution at 1.0% in each experiment
1(d) Able to state a hypothesis relating manipulated variable and responding variable correctly with the following aspect: P1 – Manipulated variable –Lime, lemon and orange juices (all) / Type of fruit juices P2 – Responding variable – Volume of fruit juice used to decolourise DCPIP solution / percentage of vitamin C R - relationship – greater/less/more Sample answer
1 Volume of lime juice used is less/more compared to /than lemon and orange juice to decolourise 1 ml of DCPIP solution
2 Lime juice has higher/lower percentage of Vitamin C than lemon and orange juice.
1(e)(i) Able to construct a table which contain the following aspects: (T): Titles with correct units (3 titles) (D): Record all data correctly (C): Calculate the percentage of vitamin C Sample answer:
Type of fruit juice Volume of fruit juice to decolourise 1ml DCPIP
solution (ml)
Percentage of vitamin C (%)
Lime 1.6 0.063
Lemon 2.2 0.045
Orange 2.8 0.036
1(e)(ii) Able to plot the graph correctly: Criteria: Axes (P) – both axes are labelled with correct units and uniform scales Points(T)- Able to draw 3 bars correctly Shape(B)- Three bars are labelled (must same width)

19
1(f) Able to explain the relationship between the volume of fruit juice used to decolourise
DCPIP solution based on following aspects: R1- state the relationship E1- lime juice contain the most/highest ascorbic acid/ orange juice contain the least/lowest ascorbic acid E2- concentration of vitamin C is the highest/lowest Sample answer
1 The lower the volume of fruit juice used to decolourise DCPIP solution the higher the percentage of Vitamin C in the fruit juice. Lime juice contain the highest ascorbic acid therefore the concentration of vitamin C is the highest among lemon and orange juices.
2 The higher the volume of fruit juice used to decolourise DCPIP solution the lower the percentage of Vitamin C in fruit juice. Orange juice contain the lowest ascorbic acid therefore the concentration of vitamin C is the lowest among lime and lemon juices.
1(g) Able to state the definition of population distribution on the following criteria: P1 - The content of ascorbic acids in a fruit juice P2 - That can be determined with the volume of fruit juice to decolourise 1ml DCPIP solution P3 - it is affected by the different type of fruit juice Sample answer Vitamin C is the content of ascorbic acids in a fruit juice (lime/lemon/orange juice) determine by the volume of fruit juice to decolourise 1ml DCPIP solution and it is affected by the different type of fruit juice.
1(h) P1 – The volume of lemon juice used to decolourise DCPIP solution is less than 2.2 ml (any number less than 2.2 ml) P2 – Vitamin C is oxidized P3 – ascorbic acid content is less/concentration of vitamin C is less/lower Sample answer The volume of lemon juice used to decolourise DCPIP solution is less than 2.2 ml due to vitamin C in fruit juice is oxidized causes the content of ascorbic acid is less / concentration of vitamin C is less.

20
1(i) Able to classify all the organ in table correctly:
Reagent Material to be tested
Ascorbic acid solution 1.0% DCPIP solution 0.1%
Apple juices Pineapple juice

21
Question 2
1(a) Able to record the length of maize plant roots correctly Sample answer:
Solution The final length of maize plants roots after 3 days (cm)
Maize plant root 1 Maize plant root 2
A 3.2cm 4.4cm
B 1.2cm 1.6cm
1 (b)(i) Able to state the correct observations based on the following criteria: P1: Manipulated variable (type of solution) P2: Responding variable (the final length of maize plant roots 1 and 2) Sample answer:
1. In solution A/ complete Knop’s solution, the length of maize roots 1 is 3.2 cm and the length of maize roots 2 is 4.4 cm
2. In solution B/ incomplete Knop’s solution, the length of maize roots 1 is 1.2 cm and the length of maize root 2 is 1.6 cm
1(b)(ii) Able to state correct inference for each observation based on any two aspects: (any 2P) P1: more/ less minerals // phosphate presence/absence // complete / incomplete Knop’s solution P2: more/ less growth rate of maize plants roots Sample answer:
1 The length of maize plant root is longer because all mineral required are presence/ phosphate presence /complete / Knop’s solution, so the growth rate of maize plant root is higher
2 The length of maize plant root is shorter because lack of mineral / phosphorus / incomplete Knop’s solution, so the growth rate of maize plant root is lower
1(c) Able to state all 3 variables and the 3 methods to handle the variable correctly. Sample Answer:
Variables Method to handle the variable correctly
Manipulated variable Types of solution // complete or incomplete Knop’s solution // the absence or presence of
Used different // change types of solution which is complete Knop’s solution to incomplete Knop’s solution // the presence to absence of phosphate in Knop’s solution

22
phosphate in Knop’s solution
Responding variable The length of maize plant root 1 and root 2 // The change in length of maize plant root 1 and 2// The average change in length of maize plant roots //
Record the length of maize plant roots 1 and roots 2 by using ruler. Calculate the change in length of maize plant roots 1 and 2 by using formula Final – initial length in maize plant roots or Calculate the average change in length of maize plant roots by using formula
𝑐ℎ𝑎𝑛𝑔𝑒 𝑖𝑛 𝑙𝑒𝑛𝑔𝑡ℎ 𝑜𝑓 𝑚𝑎𝑖𝑧𝑒 𝑝𝑙𝑎𝑛𝑡 𝑟𝑜𝑜𝑡𝑠 1 +𝑐ℎ𝑎𝑛𝑔𝑒 𝑖𝑛 𝑙𝑒𝑛𝑔𝑡ℎ 𝑜𝑓 𝑚𝑎𝑖𝑧𝑒 𝑝𝑙𝑎𝑛𝑡 𝑟𝑜𝑜𝑡𝑠 2
2
Or Calculate the growth rate of maize plant roots by using formula
𝑎𝑣𝑒𝑟𝑎𝑔𝑒 𝑐ℎ𝑎𝑛𝑔𝑒 𝑖𝑛 𝑙𝑒𝑛𝑔𝑡ℎ 𝑜𝑓 𝑚𝑎𝑖𝑧𝑒 𝑝𝑙𝑎𝑛𝑡 𝑟𝑜𝑜𝑡𝑠
3 𝑑𝑎𝑦𝑠
Constant variable Type of plants // the size of seedlings // the amount of solutions
Use the same types of plants which is maize plants // Use the same size of seedlings// The same amount of solutions
1(d) Able to state all three criterias correctly based on: P1: state the manipulated variable. P2: state the responding variable R: relationship between P1 and P2 Sample answer: In complete Knop’s solution,/ solution A/ in presence of phosphate , the growth rate of maize plant roots is higher compared to incomplete Knop’s solution / solution B/ absence of phosphate
1(e)(i) Able to construct a table and record all the data correctly based on: T: Title with correct units D: Correct data (final length of maize plant roots) S: Correct calculations of change in length, average change in length and growth rate of maize plant roots

23
Sample answer:
Solutions The final length of maize plant
roots (cm)
Change in length of maize
plant roots (cm)
Average change in length of maize plants roots (cm)
Growth rate of maize plants roots (cm/days) Maize
plant roots 1
Maize plant roots
2
Maize plant
roots 1
Maize plant
roots 2
A Complete
Knop’s
3.2 4.4 2.2 3.4 2.8 0.93/0.9
B Incomplete
Knop’s
1.2 1.6 0.2 0.6 0.4 0.13/0.1
1(e)(ii) Able to draw a bar chart graph based on the following criteria: P: Correct axis label with unit/ uniform scale. T: all points are plotted correctly. B: Correct shape of graph

24
1(e)(iii) Able to explain the relationship between the growth rate of maize against the type of solution (R + any 2P ) Rcorrect conclusion :The growth rate of maize plant roots higher in solution A // complete Knop’s solution compared to solution B // incomplete Knop’s solution P1: all mineral // phosphate presence / incomplete minerals //absence of phosphate P2: stimulate/ suitable (for the growth of roots) // P3: cells divide by mitosis causes the length of maize plants roots increases Sample answer: The growth rate of maize plant roots is higher in complete Knop’s solution compared to in incomplete Knop’s solution because phosphate is presence which stimulate /suitable for the growth of roots causes the length of maize plant roots increases.
1(h) Able to define operationally based on: P1: process of changes in length of maize plant roots P2: shown by the final length of maize plant roots 1 and maize plant roots 2 P3: affected by the type of solution // complete Knops solution // the presence of phosphate Sample answer: Growth is the changes in length of maize plant roots which is shown by the final length of maize plant roots 1 and maize plant roots 2. Growth is affected by the type of solution / complete Knop’s solution / the presence of phosphate
1(g) Able to predict the growth maize plant roots correctly based on: P1: more than 0.3 cm/days P2: more minerals / phosphate presence // required by roots P3: stimulate increases the changes in length of maize plant root // suitable for growth // cells divide by mitosis rapidly Sample answer: The growth rate of maize plant roots is more than 0.3 cm/days because more phosphate is presence which stimulate the increases changes in length of maize plant roots
1(i) Able to classify macronutrient and micronutrients correctly
Macronutrients Micronutrients
Pottasium Calcium Sulphur
Magnesium
Boron Molibdenum
Copper Ferum

25
Question 3 1(a) Able to record the increase in water temperature correctly
Sample answer:
Type of food sample
Increase in water
temperature (0C)
P/ Bread 32- 29 03
Q / Anchovy 38- 29 09
R / Cashew nut 44- 29 15
1 (b)(i) Able to state correct observations based on the manipulated and responding variables: Sample answer: Observation 1
1. For P or Bread, the increase in water temperature is 3°C 2. For P or Bread, the final water temperature is 32°C 3. For Q or Anchovy, the increase in water temperature is 90 °C. 4. For Q / Anchovy, the final water temperature is 38°C
Observation 2
1. For R / Cashew nut, the increase in water temperature is 150°C. 2. For R / Cashew nut, the final water temperature is 44°C.
1(b)(ii) Able to state correct inference for each observation based on any two aspects: (any 2P) Sample answer: Inference 1
1. P / Bread is carbohydrate classes of food which has lowest energy value 2. P / Bread released the least /lowest heat energy which is absorbed by water /
has lowest energy value. 3. Q/ Anchovy is protein classes of food which has low energy value. 4. Q / Anchovy release lower / less heat energy which is absorbed by water / has
low energy value. Inference 2
1. Q/ Cashew nut is protein classes of food which has highest energy value. 2. Q/ Cashew nut released more /most heat energy which is absorbed by water./
has highest energy value
1(c) Able to classify the apparatus and materials correctly based on Diagram 2 OR Any 6 correct ticks Sample answer:
Apparatus Materials

26
Needle Retort stand Boiling tube
Thermometer
Burning bread Distilled water
1(d) Able to state all 3 variables and the 3 methods to handle the variable correctly. Sample Answer:
Variables Method to handle the variable correctly
Manipulated variable Type of food sample// P,Q and R // Bread, anchovy and cashew nut
Used different types of food sample // Change bread to anchovy and cashew nut
Responding variable Energy Value // Increase in water temperature
Calculate the energy value using formula
4.2 𝑥 𝑚𝑎𝑠𝑠 𝑜𝑓 𝑤𝑎𝑡𝑒𝑟 𝑥 𝑡𝑒𝑚𝑝𝑒𝑟𝑎𝑡𝑢𝑟𝑒 𝑖𝑛𝑐𝑟𝑒𝑎𝑠𝑒
𝑚𝑎𝑠𝑠 𝑜𝑓 𝑓𝑜𝑜𝑑
/Record the increase in water temperature using thermometer
Constant variable Initial water temperature
Used 29° C water temperature.
1(e) Able to state all three criterias correctly based on: P1: state the manipulated variable. P2: state the responding variable R: relationship between P1 and P2 Sample answer: Bread /P has the lowest energy value / increase in water temperature compare to Anchovy(Q) and Cashew nut (R)// vice versa
1(f) Able to record all the data correct ly in a Table based on T= Correct title and Units D= Correct data E = Correct energy value Sample answer:
Type of food sample
Mass of food sample (g)
Increase in water temperature (° C)
Energy Value (Jg-1)
P/ Bread 0.6 03 420
Q/ Anchovy 0.8 09 945
R/ Cashew nut 1.2 15 1050
1(g)(i) Able to plot a graph with the following aspect s:
27
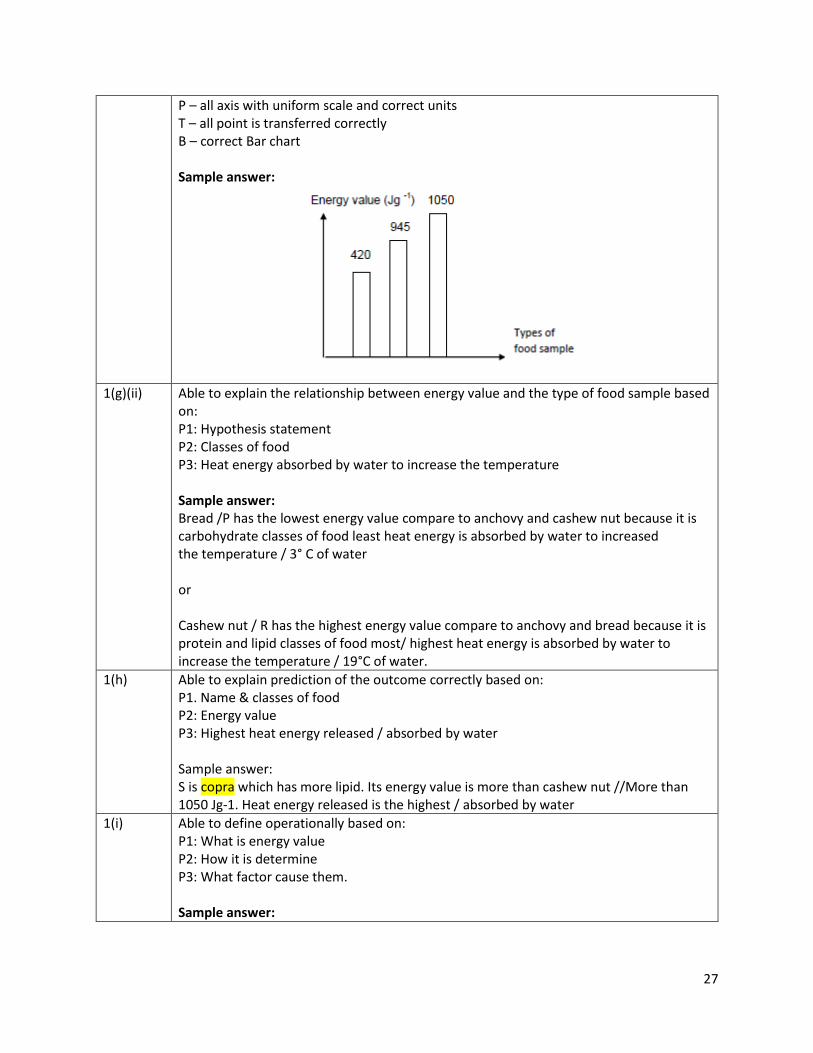
P – all axis with uniform scale and correct units T – all point is transferred correctly B – correct Bar chart Sample answer:
1(g)(ii) Able to explain the relationship between energy value and the type of food sample based on: P1: Hypothesis statement P2: Classes of food P3: Heat energy absorbed by water to increase the temperature Sample answer: Bread /P has the lowest energy value compare to anchovy and cashew nut because it is carbohydrate classes of food least heat energy is absorbed by water to increased the temperature / 3° C of water or Cashew nut / R has the highest energy value compare to anchovy and bread because it is protein and lipid classes of food most/ highest heat energy is absorbed by water to increase the temperature / 19°C of water.
1(h) Able to explain prediction of the outcome correctly based on: P1. Name & classes of food P2: Energy value P3: Highest heat energy released / absorbed by water Sample answer: S is copra which has more lipid. Its energy value is more than cashew nut //More than 1050 Jg-1. Heat energy released is the highest / absorbed by water
1(i) Able to define operationally based on: P1: What is energy value P2: How it is determine P3: What factor cause them. Sample answer:

28
Energy value is the quantity of heat (energy) produce by bread / anchovy / cashew nut / food sample. which is absorbed by water to increase them to 03°C/ 9°C / 15°C. or determine / shown by the increase in water temperature. The energy value is affected by the type of food sample.

29
Question 4
Problem statement Able to state the problem statement of the experiment correctly that include criteria:
Manipulate variables Responding variables Relation in question form and question symbol [?]
Sample answers: 1. Does the concentration of carbon dioxide affect the rate of photosynthesis in aquatic plants? 2. What is the relationship between the concentration of carbon dioxide and the rate of photosynthesis in aquatic plants?
Hypothesis Able to state the hypothesis correctly according to the criteria: Manipulate variables Responding variables Relationship of the variables
Sample answers: 1. The higher the concentration of carbon dioxide the higher the rate photosynthesis in aquatic plants. 2. At (very) high concentration of carbon dioxide, the rate of photosynthesis in aquatic plants remains constant.
Variables Able to state the three variables correctly Sample answers: Manipulated variable: Concentration of carbon dioxide // Percentage of sodium hydrogen carbonate solution Responding variable: Number of bubbles released (in five minutes) // The rate of photosynthesis Controlled variable: Type of (aquatic) plant / Hydrilla sp. // Volume of (hydrogen carbonate) solutions
Apparatus and materials
Able to state all functional materials / 2*materials + 1 other material and 2*apparatus + 2 other apparatus for the experiment. Materials: *Aquatic plants / Hydrilla sp., * sodium hydrogen carbonate solution, distilled water, and plasticine. Apparatus: *Stopwatch, measuring cylinder, ruler, boiling tube / test tube, beaker, filter funnel, capillary tube, rubber tubing, light source / box, and paper clip.
Procedure 1. (Diagram of experimental setup with at least 5 functional labels). 2. Fill a boiling tube with 150 ml of 1% sodium hydrogen carbonate
solution. 3. Fix a paper clip / plasticine to a sprig of aquatic / Hydrilla sp. plant. 4. Submerge / put the aquatic plant into the boiling tube / 1% sodium
hydrogen carbonate solution. 5. Put the boiling tube into a water bath at room temperature (20-30oC) 6. Place the boiling tube at distance of 50 cm from a lighted bulb. 7. Put aside the boiling tube for 5 minute (for the aquatic plant to
adjust)

30
8. Start the stopwatch. 9. Count the number of bubbles release in 20 minutes. 10. Record the result is a table. 11. Repeat steps 2 until 9 using 2%, 3% and 4% of sodium hydrogen
carbonate solutions. 12. Calculate the rate of photosynthesis.
Presentation of data Able to tabulate the correct table with observations. Sample answers:
Concentration of sodium hydrogen
carbonates solution (%)
Number of bubbles released
in 20 minutes
Rate of photosynthesis (number / minute)
1
2
3
4
Or
Beaker Number of bubbles released in 20 minutes
Rate of photosynthesis (number / minute)
A
B
C
D

31
CHAPTER 7
Question 1
1(a)
Number of burning cigarettes
Final temperature (°C)
1 30
3 32
5 36
7 41
1 (b)(i) Able to state two different observations correctly following these criteria: MV- Number of burning cigarettes RV- final temperature / increase in temperature/ percentage increase in temperature inside the U-tube with unit Sample answers
1. When 1 cigarette was burned, the final temperature inside the U-tube is 30°C 2. When 7 cigarettes were burned, the final temperature inside the U-tube is 41°C
1(b)(ii) Able to make two inferences correctly based on the following aspects: (Any two criteria’s) CRV: Final temperature ARV/Compare: Increase in temperature / percentage increase in temperature of U-tube Reason 1: Less/more heat was released Reason 2: Temperature in the lung/alveolus increase least/most Sample answers
1. (When 1 cigarette was burned,) the final temperature/increase in temperature /percentage increase in temperature is the lowest because less heat was released (from the burning cigarettes), therefore lung temperature increases least.
2. (When 7 cigarettes were burned,) the final temperature/increase in temperature/percentage increase in temperature is the highest because more heat was released (from the burning cigarettes), therefore lung temperature increase the most
1(c) Able to state all 3 variables and the 3 methods to handle the variable correctly. Sample Answer:
Variables Method to handle the variable correctly
Manipulated variable
Use different number cigarettes which are 1,3,5 and 7

32
Number of burning cigarettes
Responding variable Final temperature inside the U-tube OR Increase /different in temperature OR Percentage increased/different in temperature
Measure and record the final temperature of U-tube by using a thermometer Calculate and record the increase / different in temperature by using formula: Increase/different in temperature = Final temperature – initial temperature Calculate and record the percentage increase / different in temperature by using formula:
𝐹𝑖𝑛𝑎𝑙 𝑡𝑒𝑚𝑝𝑒𝑟𝑎𝑡𝑢𝑟𝑒 − 𝐼𝑛𝑖𝑡𝑖𝑎𝑙 𝑡𝑒𝑚𝑝𝑒𝑟𝑎𝑡𝑢𝑟𝑒
𝐼𝑛𝑖𝑡𝑖𝑎𝑙 𝑡𝑒𝑚𝑝𝑒𝑟𝑎𝑡𝑢𝑟𝑒 𝑋 100%
Constant variable Type of cigarettes Initial temperature
Fix/use the same type of the cigarettes Use the same initial temperature at 27°C
1(d) Able to make hypothesis based on the following aspects: MV: Number of burning cigarettes RV: Final temperature/increase in temperature/percentage increase in temperature inside the U-tube R: relationship between variables Sample answer
1. As the number of burning cigarettes increases, the final temperature / increase in temperature / percentage increase in temperature inside the U-tube increases.
2. The higher the number of burning cigarettes, the higher the final temperature inside the U-tube
1(e)(i) Able to construct a table which contain the following aspects: (T): Titles with correct units (3 titles) (D): Record all data correctly (C): Calculate the percentage increase in temperature correctly

33
Sample answer:
Number of burning
cigarettes
Temperature (°C) Percentage increase in temperature (%) Initial Final Increase
1 27 30 3 11.11
3 27 32 5 18.52
5 27 36 9 33.33
7 27 41 14 51.85
1(e)(ii) Able to plot the graph correctly: Criteria: Axes (P) – both axes are labelled with correct units and uniform scales Points(T)- Able to draw 3 bars correctly Shape(B)- Three bars are labelled (must same width)
1(f) Able to explain the relationship between the number of burning cigarettes and
percentage increase in temperature

34
R:number of burning cigarettes (MV)+ percentage increase in temperature (RV) + relationship E1- because more heat is released E2- therefore lung temperature / damage the tissue lining of alveoli/ respiratory tract increase Sample answer As the number of burning cigarettes increases, the percentage increase in temperature also increases because more heat is released therefore lung temperature/damage the tissue lining of alveoli/respiratory tract increase
1(g) Able to predict the final temperature correctly: P1 – correct prediction (more than 32°C) E1-Reason (contain more heat flows into the U-tube) E2-Effect (therefore more heat is release / contains more fuel/contains more smoke/longer time to stop burning) Sample answer The final temperature will more than 32°C because contain more heat flow to the U-tube compared to filtered cigarettes therefore more heat is release
1(h) Able to define operationally on what is unhealthy respiratory system based on the following aspects D1: (Classification and facts) Conditions of the alveolus wall/lining /respiratory tract become damage/dryness/irritates/inflame due to burning cigarettes release smoke containing heat when the cigarettes stop burning D2/CRV: Shown by final temperature /increase in temperature/percentage increase in temperature inside the U-tube D3/MV: affected by number of burning cigarettes Sample answer Unhealthy respiratory tract system is the conditions of the alveolus wall/lining/respiratory tract become damage/dryness/irritates/inflame due to burning cigarettes release smoke containing heat when the cigarettes stop burning which can be shown by final temperature/increase in temperature/percentage increase in temperature inside the U-tube affected by number of burning cigarettes.
1(i) Able to classify rate gases exchange of four men with different lifestyle

35

36
Question 2
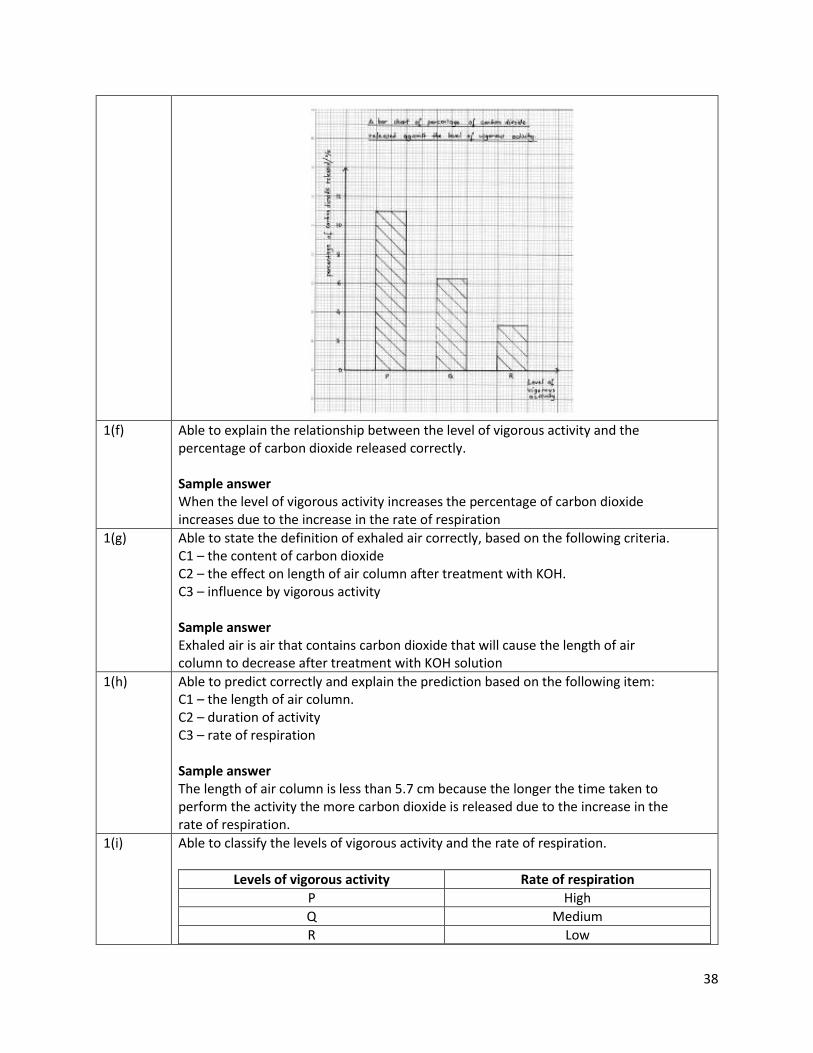
1(a) Able to record all readings of lengths of air column correctly. Initial = 6.4cm
Levels of vigorous activity Length of air column (cm)
P 5.7
Q 6.0
R 6.2
1 (b)(i) Able to state two correct observations based on following criteria. C1 – levels of vigorous activity C2 – The lengths of air column. Sample answers
1. For activity level P the length of air column after treatment with KOH is 5.7 cm 2. For activity level R the length of air column after treatment with KOH is 6.2 cm
1(b)(ii) Able to state two reasonable inferences for the observation. Sample answers
1. More carbon dioxide is absorbed by KOH because activity P is more vigorous. 2. Less carbon dioxide is absorbed by KOH because activity R is less vigorous.
1(c) Able to state all the variables and the method to handle variable correctly (√) for each variable and method Sample Answer:
Variables Method to handle the variable correctly
Manipulated variable Levels of vigorous activity
The athlete is asked to perform different levels of vigorous activity
Responding variable The length of air column after treatment with KOH/ the percentage of carbon dioxide released.
Measure and record the lengths of air column using Ruler calculate the percentage of carbon dioxide released using formulae: percentage of carbon dioxide =
𝑐ℎ𝑎𝑛𝑔𝑒 𝑖𝑛 𝑙𝑒𝑛𝑔𝑡ℎ 𝑜𝑓 𝑎𝑖𝑟 𝑐𝑜𝑙𝑢𝑚𝑛
𝐼𝑛𝑖𝑡𝑖𝑎𝑙 𝑙𝑒𝑛𝑔𝑡ℎ 𝑜𝑓 𝑎𝑖𝑟 𝑐𝑜𝑙𝑢𝑚𝑛 𝑋 100%
Constant variable fix the duration for each activity/ ask the same athlete perform

37
duration for athlete to perform the activities/ the same athlete.
all activities.
1(d) Able to state the hypothesis correctly based on the following criteria: V1 – State the level of vigorous activity. V2 – State the length of air column / percentage of carbon dioxide. R - State the relationship between V1 and V2. Sample answer
1. As the level of vigorous activity increases, the length of air column decreases. 2. As the level of vigorous activity increases the percentage of carbon dioxide
increases.
1(e)(i) Able to construct a table which contain the following aspects: (T): Titles with correct units (3 titles) (D): Record all data correctly (C): Calculate the percentage of carbon dioxide released Sample answer:
Levels of vigorous activity
Length of air column/cm
Change in the length of air column / cm
Percentage of carbon dioxide released/ %
Initial Final
P 6.4 5.7 0.7 10.94/11.0
Q 6.4 6.0 0.4 6.25/6.3
R 6.4 6.2 0.2 3.13/3.1
1(e)(ii) Able to plot the graph correctly: Criteria: Axes (P) – both axes are labelled with correct units and uniform scales Points(T)- Able to draw 3 bars correctly Shape(B)- Three bars are labelled (must same width)
38
1(f) Able to explain the relationship between the level of vigorous activity and the
percentage of carbon dioxide released correctly. Sample answer When the level of vigorous activity increases the percentage of carbon dioxide increases due to the increase in the rate of respiration
1(g) Able to state the definition of exhaled air correctly, based on the following criteria. C1 – the content of carbon dioxide C2 – the effect on length of air column after treatment with KOH. C3 – influence by vigorous activity Sample answer Exhaled air is air that contains carbon dioxide that will cause the length of air column to decrease after treatment with KOH solution
1(h) Able to predict correctly and explain the prediction based on the following item: C1 – the length of air column. C2 – duration of activity C3 – rate of respiration Sample answer The length of air column is less than 5.7 cm because the longer the time taken to perform the activity the more carbon dioxide is released due to the increase in the rate of respiration.
1(i) Able to classify the levels of vigorous activity and the rate of respiration.
Levels of vigorous activity Rate of respiration
P High
Q Medium
R Low

39

40
Question 3
Problem statement
Able to state a problem statement relating the manipulated variable with the responding variable correctly. P1 – MV : The concentration of glucose P2 – RV : The rate of anaerobic respiration of yeast P3 - Question form and have question mark (what / how does.....?) Sample Answer 1. How does the concentration of glucose (P1) affects the rate of anaerobic respiration in yeast (P2) ? (P3) 2. What is the effect of the concentration of glucose (P1) on the rate of anaerobic respiration in yeast in yeast (P2) ? (P3)
Hypothesis Able to state a hypothesis relating the MV to the RV correctly P1 : (MV)- the concentration of glucose P2 : (RV)- the rate of anaerobic respiration in yeast// time taken for limewater turn cloudy//height of the coloured liquid in the monometer//time taken for diameter of dough to increase/balloon to double H : - relationship Sample Answer 1. The higher/lower the concentration of glucose (P1), the higher/lower (H) the rate of anaerobic respiration (P2) in yeast// time taken for limewater turn cloudy//height of the coloured liquid in the monometer//time taken for diameter of dough to increase/balloon to double. 2. As the concentration of glucose(P1) increases (H), the rate of anaerobic respiration(P2) in yeast increases// time taken for limewater turn cloudy//height of the coloured liquid in the monometer//time taken for diameter of dough to increase/balloon to double
Variables Able to state three variables correctly: Sample Answer: 1. Manipulated variable The concentration of glucose 2. Responding variable The rate of anaerobic respiration in yeast//time taken for limewater turn cloudy//height of the coloured liquid in the monometer//time taken for diameter of dough to increase/balloon to double 3. Constant variable The temperature // the volume of yeast suspension//duration/time (of activity)

41
Apparatus and materials
Able to list all the important apparatus and material correctly Sample answer:
Using manometer Materials: *Yeast // Yeast solution /suspension (5%), * glucose solution (5,10,20%) *Distilled water, Coloured water and vaselin Apparatus: *Test tube/boiling tube, *manometer tubes/capillary tube, beaker, measuring cylinder, retort stand, stopwatch , marker/thread rubber tubing, rubber stopper
Using lime water Materials: *Yeast // Yeast solution /suspension (5%), * glucose solution (5,10,20%) *paraffin oil Distilled water, Lime water Apparatus: *Test tube,boiling tube, *delivery tube, beaker, measuring cylinder, stopwatch and stoppers
Using Dough Materials: *Yeast // Yeast solution /suspension (5%), * glucose solution (5,10,20%) *Distilled water, *Flour Apparatus: *beaker/basin, * measuring cylinder // ruler,mixer/finger/spoon/ladlestopwatch , marker,wet towel,water bath (beaker water and Bunsen burner) and electronic balance
Using Balloon Materials: *Yeast // Yeast solution (5%) /suspension , *(5,10,20%) glucose solution *Distilled water, Apparatus: *(rubber) balloon, *ruler,conical flask, measuring cylinder, stopwatch and water bath(beaker water and Bunsen burner)
Procedure Notes : K1 : Preparation of materials and apparatus (all 3) K2 : Operating the constant variable (any 1) K3 : Operating the responding variable (any 1) K4 : Operating the manipulated variable (any 1) K5 : Steps to increase reliability of results accurately / precaution (any 1) Using Lime Water
➢ K1 1. Label 3 test tubes/boiling tubes (as A, B and C) 2. Pour yeast suspension n into a test tube 3. Mix with glucose solution

42
4. Connect delivery tube 5. Pour lime water into another test tube start stop watch 6. Tabulate data
➢ K2 1. 5ml //5% yeast solution 2. 10 ml //5% boiled glucose solution 3. 5 ml lime water 4. Water bath temperature 35°C
➢ K3 1. Record the time taken for the lime water turns cloudy using stopwatch 2. Calculate the rate of respiration using formula: 1/ time
➢ K4 1. Repeated by replacing 5% glucose solution with distilled water, 10% glucose
solution and 20% glucose solution
➢ K5 1. 5% Glucose solution is boiled to remove any dissolved oxygen and is cooled 2. A thin layer of paraffin oil then is put on the top of the mixture on the boiling
tube 3. The test tubes containing yeast and glucose are closed tightly with rubber
stopper (with delivery tube) 4. The experiment is repeated 3 times to get average result
Using Manometer
➢ K1 1. Label 3 test tubes/boiling tubes 2. Pour yeast suspension into a test tube 3. Mix with glucose solution 4. Connect stopper with rubber tubing 5. Connect to manometer 6. Fill manometer with coloured solution 7. Start stop watch 8. Mark initial/final coloured solution level 9. Tabulate Data
➢ K2 1. 5 ml//5% yeast suspension 2. 10 ml 5% boiled glucose solution 3. Time 10 minutes 4. Water bath temperature 35°C
➢ K3 1. Record the final height of coloured solution level using ruler 2. Calculate the rate of respiration using formula: change in height/time

43
➢ K4 1. Repeated by replacing 5% glucose solution with distilled water, 10% glucose
solution and 20% glucose solution
➢ K5 1. 5% Glucose solution is boiled to remove any dissolved oxygen and is cooled 2. A thin layer of paraffin oil then is put on the top of the mixture on the boiling
tube 3. The test tubes containing yeast and glucose are closed tightly with rubber
stopper (with delivery tube) 4. Vaseline is used to make sure all the joints of the apparatus are airtight water 5. The experiment is repeated twice to get average result
Using Dough
➢ K1 1. Label 3 basin 2. Pour yeast suspension into the basin 3. Mix with glucose solution 4. Mix with flour 5. Knead into a dough 6. Leave the dough aside 7. Start stop watch 8. Tabulate Data
➢ K2 1. 5 ml//5% yeast suspension 2. 10 ml 5% boiled glucose solution 3. Time 10 minutes 4. Water bath temperature 35°C 5. 100 g flour
➢ K3 1. Record the time taken for the diameter of the dough to double using
stopwatch 2. Calculate the rate of respiration using formula: change in height/time
➢ K4 1. Repeated by replacing 5% glucose solution with distilled water, 10%glucose
solution and 20% glucose solution
➢ K5 1. Cover the dough using wet towel 2. The experiment is repeated 3 times to get average result
Using Balloon
➢ K1 1. Label 3 conical flask

44
2. Pour yeast suspension into the basin 3. Mix with glucose solution 4. Cover the mouth of conical flask with a rubber balloon 5. Leave the set-up aside 6. Start stop watch 7. Tabulate data
➢ K2 1. 5 ml//5% yeast suspension 2. 10 ml 5% boiled glucose solution 3. Time 10 minutes 4. Water bath temperature 350C 5. Type of balloon
➢ K3 1. Record the time taken for the diameter of the balloon to double using
stopwatch 2. Calculate the rate of respiration using formula: change in height/time
➢ K4 1. Repeated by replacing 5% glucose solution with distilled water, 10% glucose
solution and 20% glucose solution
➢ K5 1. The mouth of the conical flask is covered tightly with the rubber balloon 2. The experiment is repeated 3 times to get average result
Presentation of data
Able to construct a table to record data with units - All titles with unit - Manipulated data - Data is not required [using manometer]
Concentration of glucose solution
(%)
The height of coloured liquid in the manometer
(mm)
The rate of anaerobic respiration in yeast (mm
min-1)
5
10
20
[using dough]/[using balloon]
Concentration of glucose solution
(%)
The height of diameter (mm)
The rate of anaerobic respiration in yeast (mm
min-1)
5

45
10
20
[using lime water]
Concentration of glucose solution
(%)
Time taken for the lime water to turn cloudy
(minutes)
The rate of anaerobic respiration in yeast (mm
min-1)
5
10
20

46
Question 4
Problem statement
Able to state the problem statement of the experiment correctly that include criteria: C1 Manipulate variables: pH (value/medium) // Acidic, alkali and neutral medium C2 Responding variables: Rate of respiration in yeast C3 Relation in question form and question symbol [?] Sample answers: 1. What is the effect of (different) pH on the (rate of) respiration in yeast? 2. Does pH affect the respiration in yeast? 3. How acidic, alkali and neutral medium affecting the respiration in yeast?
Hypothesis Able to state the hypothesis correctly according to the criteria. C1 Manipulate variables C2 Responding variables C3 Relationship of the variables Sample answers:
1. In (medium of) pH 7 the rate of respiration in yeast is highest compared to other pH (mediums) / pH 2 and pH 9. [Accept pH value neutral, acidic and alkali]
2. In neutral medium the rate of respiration in yeast is highest compared to other pH mediums / acidic and alkali mediums.
Variables Manipulate variables: pH (value/medium) // Acidic, alkali and neutral medium// Type of solution Responding variables: Rate of respiration in yeast// Time taken for lime water turn cloudy// Change in height of water level// Time taken for diameter of dough /balloon to double Controlled variable: Temperature // Concentration of yeast suspension / glucose solution // Duration / time (of activity)
Apparatus and materials
Able to list all the important apparatus and material correctly Sample answer:
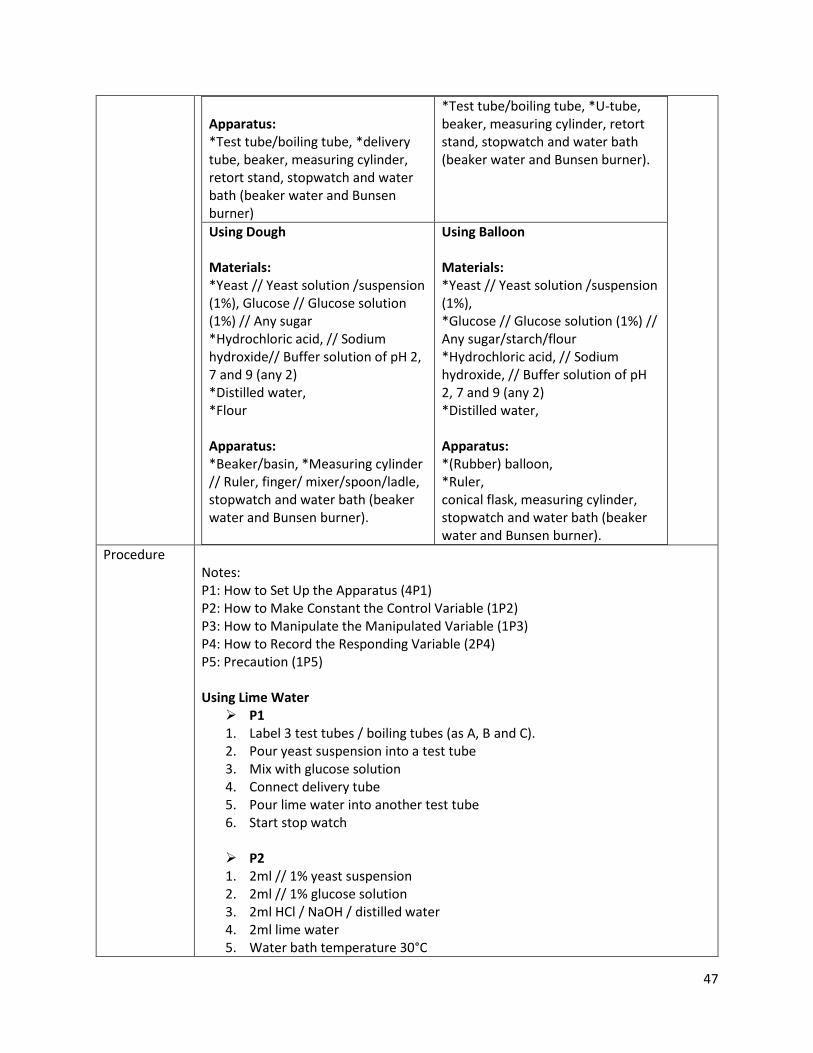
Using lime water Materials: *Yeast // Yeast solution /suspension (1%), *Glucose // Glucose solution (1%) // Any sugar/starch/flour *Hydrochloric acid, // Sodium hydroxide // Buffer solution of pH 2, 7 and 9 (any 2) *Distilled water, Lime water
Using U-tube Materials: *Yeast // Yeast solution /suspension (1%), *Glucose // Glucose solution (1%) // Any sugar/starch/flour *Hydrochloric acid, // Sodium hydroxide // Buffer solution of pH 2, 7 and 9 (any 2) *Distilled water, Coloured water Apparatus:
47
Apparatus: *Test tube/boiling tube, *delivery tube, beaker, measuring cylinder, retort stand, stopwatch and water bath (beaker water and Bunsen burner)
*Test tube/boiling tube, *U-tube, beaker, measuring cylinder, retort stand, stopwatch and water bath (beaker water and Bunsen burner).
Using Dough Materials: *Yeast // Yeast solution /suspension (1%), Glucose // Glucose solution (1%) // Any sugar *Hydrochloric acid, // Sodium hydroxide// Buffer solution of pH 2, 7 and 9 (any 2) *Distilled water, *Flour Apparatus: *Beaker/basin, *Measuring cylinder // Ruler, finger/ mixer/spoon/ladle, stopwatch and water bath (beaker water and Bunsen burner).
Using Balloon Materials: *Yeast // Yeast solution /suspension (1%), *Glucose // Glucose solution (1%) // Any sugar/starch/flour *Hydrochloric acid, // Sodium hydroxide, // Buffer solution of pH 2, 7 and 9 (any 2) *Distilled water, Apparatus: *(Rubber) balloon, *Ruler, conical flask, measuring cylinder, stopwatch and water bath (beaker water and Bunsen burner).
Procedure Notes: P1: How to Set Up the Apparatus (4P1) P2: How to Make Constant the Control Variable (1P2) P3: How to Manipulate the Manipulated Variable (1P3) P4: How to Record the Responding Variable (2P4) P5: Precaution (1P5) Using Lime Water
➢ P1 1. Label 3 test tubes / boiling tubes (as A, B and C). 2. Pour yeast suspension into a test tube 3. Mix with glucose solution 4. Connect delivery tube 5. Pour lime water into another test tube 6. Start stop watch
➢ P2 1. 2ml // 1% yeast suspension 2. 2ml // 1% glucose solution 3. 2ml HCl / NaOH / distilled water 4. 2ml lime water 5. Water bath temperature 30°C

48
➢ P3 1. Pour/mix with HCl, NaOH, distilled water (all three)// acidic, alkali and
neutral solutions 2. // Buffer solution of pH 2, 7 and 9
➢ P4 1. Record the time taken for the lime water turns cloudy 2. In a table // Tabulate the data 3. Calculate the rate of respiration using formula; 1/time.
➢ P5 1. The test tubes containing yeast and glucose are closed tightly with rubber
stopper (with delivery tube). 2. The end of delivery tube is immersed in the lime water. 3. The experiment is repeated twice to get average result.
Using U-tube
➢ P1 1. Label 3 test tubes / boiling tubes. 2. Pour yeast suspension into a test tube 3. Mix with glucose solution 4. Connect delivery tube 5. Connect to U-tube 6. Fill the U-tube with coloured water 7. Start stop watch 8. Mark initial/final coloured water level
➢ P2 1. 2ml // 1% yeast suspension 2. 2ml // 1% glucose solution 3. 2ml HCl / NaOH / distilled water 4. Time 10 minutes 5. Water bath temperature 30°C
➢ P3 1. Pour/mix with HCl, NaOH, distilled water (all three)// acidic, alkali and
neutral solutions// Buffer solution of pH 2, 7 and 9
➢ P4 1. Record the change in the height of water level 2. In a table // Tabulate the data 3. Calculate the rate of respiration using formula; change in height/time.
➢ P5 1. The test tubes containing yeast and glucose are closed tightly with rubber
stopper (with delivery tube). 2. The experiment is repeated twice to get average result.

49
Using Dough ➢ P1 1. Label 3 basin / trough 2. Pour yeast suspension into the basin 3. Mix with glucose solution 4. Mix with flour 5. Knead into a dough 6. Leave the dough aside 7. Start stop watch
➢ P2 1. 2ml // 1% yeast suspension 2. 2ml // 1% glucose solution 3. 2ml HCl / NaOH / distilled water 4. 100g flour 5. Water bath temperature 30°C
➢ P3 1. Pour/mix with HCl, NaOH, distilled water (all three)// acidic, alkali and
neutral solutions// Buffer solution of pH 2, 7 and 9
➢ P4 1. Record the time taken for the diameter of the dough to double 2. In a table // Tabulate the data 3. Calculate the rate of respiration using formula; 1/time.
➢ P5 1. Do not use your palm during kneading the dough 2. The experiment is repeated twice to get average result.
Using Balloon
➢ P1 1. Label 3 conical flask 2. Pour yeast suspension into the basin 3. Mix with glucose solution 4. Cover the mouth of conical flask with a rubber baloon 5. Leave the set-up aside 6. Start stop watch
➢ P2 1. 2ml // 1% yeast suspension 2. 2ml // 1% glucose solution 3. 2ml HCl / NaOH / distilled water 4. Water bath temperature 30°C 5. Type of balloon
➢ P3

50
1. Pour/mix with HCl, NaOH, distilled water (all three)// acidic, alkali and neutral solutions// Buffer solution of pH 2, 7 and 9
➢ P4 1. Record the time taken for the diameter of the baloon to double 2. In a table // Tabulate the data 3. Calculate the rate of respiration using formula; 1/time.
➢ P5 1. The mouth of the conical flask is covered tightly with the rubber baloon. 2. The experiment is repeated twice to get average result.
Presentation of data
Able to construct a correct table for the data tabulation. C1 Titles with correct units C2 Manipulated variables (at least 3 pH values/medium) [using lime water]
pH Time taken (for lime water turns cloudy)(minute)
Rate of respiration (minute-1)
2
7
9
[using U-tube]
Medium Change in (coloured) water level (cm)
Rate of respiration (cm min-1)
Acidic
Neutral
Alkali
[using dough]/[using balloon]
solution
Change in diameter(cm) Rate of respiration (cm min-1)
HCl
Distilled water
NaOH

51
CHAPTER 8
Question 1
1(a) Able to count and record the number of Lemna sp in Table 1.1 correctly: Sample answers
pH Number of Lemna sp.
2 4
4 5
6 8
8 11
10 5
12 1
1 (b)(i) Able to state any two observations correctly according to 2 criteria: ➢ pH (Manipulated Variable) ➢ Number of Lemna sp (Responding Variable)
Sample answers:
1. At pH 2 (Knop solution), the number of Lemna sp is 4 2. At pH 8 (Knop solution), the number of Lemna sp is 11 3. At pH 12 (Knop solution), the number of Lemna sp is 1 4. At pH 12 (Knop solution), the number of Lemna sp grow is less than at pH
2/4/6/8/10 5. At pH 8 (Knop solution), the number of Lemna sp is more than at pH2/4/6/10/12
1(b)(ii) Able to make one logical inference for each observation based on the criteria ➢ suitable abiotic factor ➢ Favourable for Lemna sp growth
Sample answers:
1. Strong acidic condition is not favorable for Lemna growth. 2. Weak/slight alkaline // neutral condition is most favorable for Lemna growth. 3. Strong alkaline is not favorable for Lemna growth. 4. Strong alkaline condition is the least favorable for Lemna growth compare with 5. other conditions. 6. Neutral/Slight alkaline condition is the best/moss favorable condition for Lemna
growth.
1(c) Able to state all 3 variables and the 3 methods to handle the variable correctly. Sample Answer:
Variables Method to handle the variable correctly
Manipulated variable pH
Add/Use acid or alkali to the Knop solution to get different pH condition// Use pH solution: pH2, pH4, pH6, pH8, pH10, pH12 // change/alter the medium condition
Responding variable Number of Lemna sp
Count and record the number of Lemna sp. plants after 7 days.
52
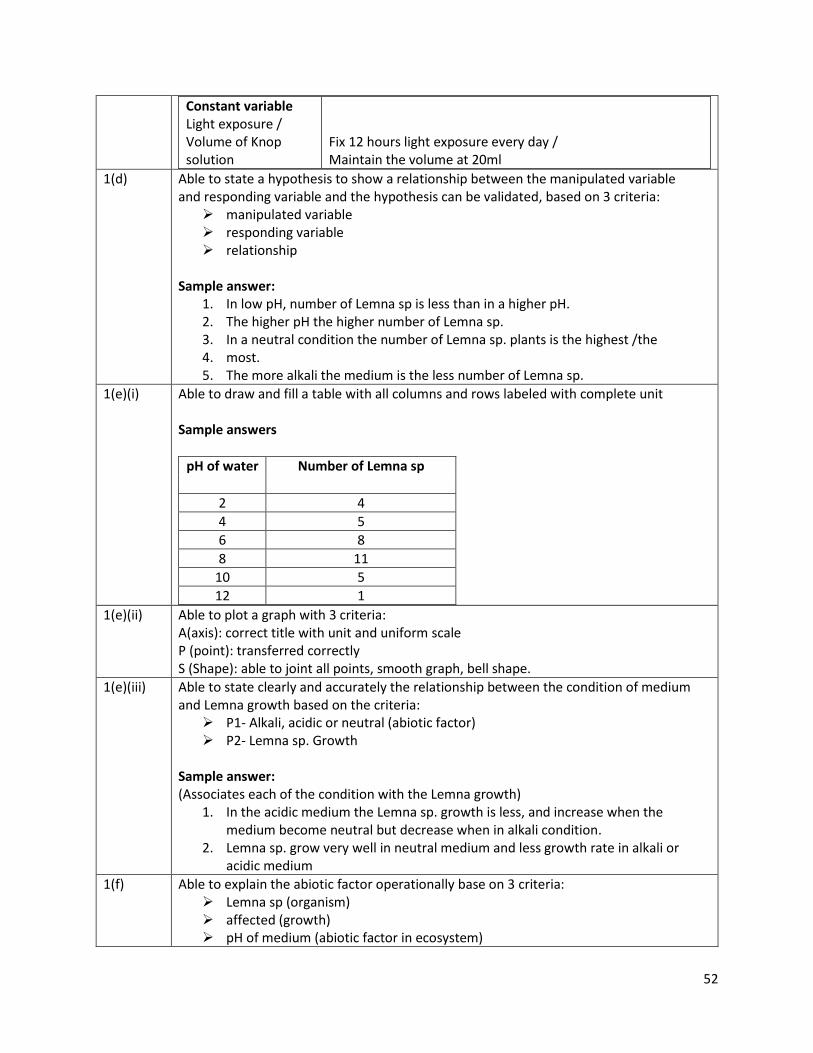
Constant variable Light exposure / Volume of Knop solution
Fix 12 hours light exposure every day / Maintain the volume at 20ml
1(d) Able to state a hypothesis to show a relationship between the manipulated variable and responding variable and the hypothesis can be validated, based on 3 criteria:
➢ manipulated variable ➢ responding variable ➢ relationship
Sample answer:
1. In low pH, number of Lemna sp is less than in a higher pH. 2. The higher pH the higher number of Lemna sp. 3. In a neutral condition the number of Lemna sp. plants is the highest /the 4. most. 5. The more alkali the medium is the less number of Lemna sp.
1(e)(i) Able to draw and fill a table with all columns and rows labeled with complete unit Sample answers
pH of water Number of Lemna sp
2 4
4 5
6 8
8 11
10 5
12 1
1(e)(ii) Able to plot a graph with 3 criteria: A(axis): correct title with unit and uniform scale P (point): transferred correctly S (Shape): able to joint all points, smooth graph, bell shape.
1(e)(iii) Able to state clearly and accurately the relationship between the condition of medium and Lemna growth based on the criteria:
➢ P1- Alkali, acidic or neutral (abiotic factor) ➢ P2- Lemna sp. Growth
Sample answer: (Associates each of the condition with the Lemna growth)
1. In the acidic medium the Lemna sp. growth is less, and increase when the medium become neutral but decrease when in alkali condition.
2. Lemna sp. grow very well in neutral medium and less growth rate in alkali or acidic medium
1(f) Able to explain the abiotic factor operationally base on 3 criteria: ➢ Lemna sp (organism) ➢ affected (growth) ➢ pH of medium (abiotic factor in ecosystem)

53
Sample answer: Abiotic factor is pH of the medium that affect the Lemna sp growth in an ecosystem.
1(g) Able to predict the result accurately base on 2 criteria. ➢ Expected population of Lemna sp ➢ The reason of the answer ➢ Not suitable for growth
Sample answer: P1- No Lemna sp found/ very small population of Lemna sp, P2- Because water is contaminated with soap/detergent contain alkali, P3- Which is not suitable/favourable for Lemna to grow
1(i) Able to classify all 4 pairs of the abiotic and biotic factors in ecosystem Sample answer:
Abiotic factors Biotic factors
Humidity Decomposer
Light intensity Parasite
Soil texture Symbiotic organism
Topography Invertebrates

54
Question 2
1(a) Sample answers
Distance between paddy seedlings / (cm)
Dry weight of 10 paddy seedlings/(g)
10 41
5 22
2 8
1 (b)(i) Able to state any two observations correctly according to 2 criteria: ➢ P1: Distance between paddy seedlings ➢ P2: Dry weight of 10 paddy seedlings
Sample answers: [horizontal observation]
1. At distance 10cm, the dry weight of (10) paddy seedlings is 40 g 2. At distance 5 cm, the dry weight of (10) paddy seedlings is 22g 3. At distance 2 cm, the dry weight of (10) paddy seedlings is 8 g
[vertical observation]
4. At distance 10cm, the dry weight of (10) paddy seedlings is the highest
5. At distance 5 cm, the dry weight of (10) paddy seedlings is low
6. At distance 2 cm, the dry weight of (10) paddy seedlings is the lowest
1(b)(ii) Able to make one logical inference for each observation based on the criteria ➢ P1: growth rate ➢ P2: intraspecific competition/ competition for water/ minerals/ nutrients/ light
//more/less water Sample answers: [horizontal inference]
1. At distance 10 cm, there is low intraspecific competition so the growth rate of paddy plant is high
2. At distance 5 cm, there is low/high intraspecific competition so the growth rate of paddy plant is high/low
3. At distance 2 cm, there is high intraspecific competition so the growth rate of paddy plant is low
[vertical inference]
4. At distance 10 cm, there is low intraspecific competition so the growth rate of
paddy plant is higher than at distance 5cm/2cm//vice versa
1(c) Able to state all 3 variables and the 3 methods to handle the variable correctly. Sample Answer:

55
Variables Method to handle the variable correctly
Manipulated variable Distance between paddy seedlings
Use different distance between paddy seedling / use the distances at 10cm, 5 cm, 2cm
Responding variable Dry weight of paddy seedlings Growth rate
Measure and record dry weight of paddy seedlings using the balance OR Calculate the growth rate using formula:
Growth rate = 𝑑𝑟𝑦 𝑤𝑒𝑖𝑔ℎ𝑡 𝑜𝑓 10 𝑝𝑎𝑑𝑑𝑦 𝑝𝑙𝑎𝑛𝑡
30 𝑑𝑎𝑦𝑠
Constant variable Volume garden soil// Type of paddy plant// Size of tray
Fix the volume of garden soil at 4 kg Fix the same type of paddy plant Fix the same size of tray
1(d) Able to state a hypothesis to show a relationship between the manipulated variable and responding variable and the hypothesis can be validated, based on 3 criteria:
➢ manipulated variable (distance between paddy seedlings) ➢ responding variable (dry weight / growth rate of paddy plant) ➢ relationship
Sample answer:
1. the further the distance between paddy seedlings, the higher the growth rate of / dry weigh of paddy plant
2. When the distance decrease, the growth rate / dry weight of paddy plant will be decrease
1(e)(i) Able to draw and fill a table with all columns and rows labeled with complete unit Sample answers
Distance between paddy seedlings / (cm)
Dry weight of 10 paddy seedlings /(g)
Growth rate / (g/days)
10 41 1.4//1.36
5 22 0.7//0.73
2 8 0.3//0.27
12 1
1(e)(ii) Able to plot a graph with 3 criteria:
56
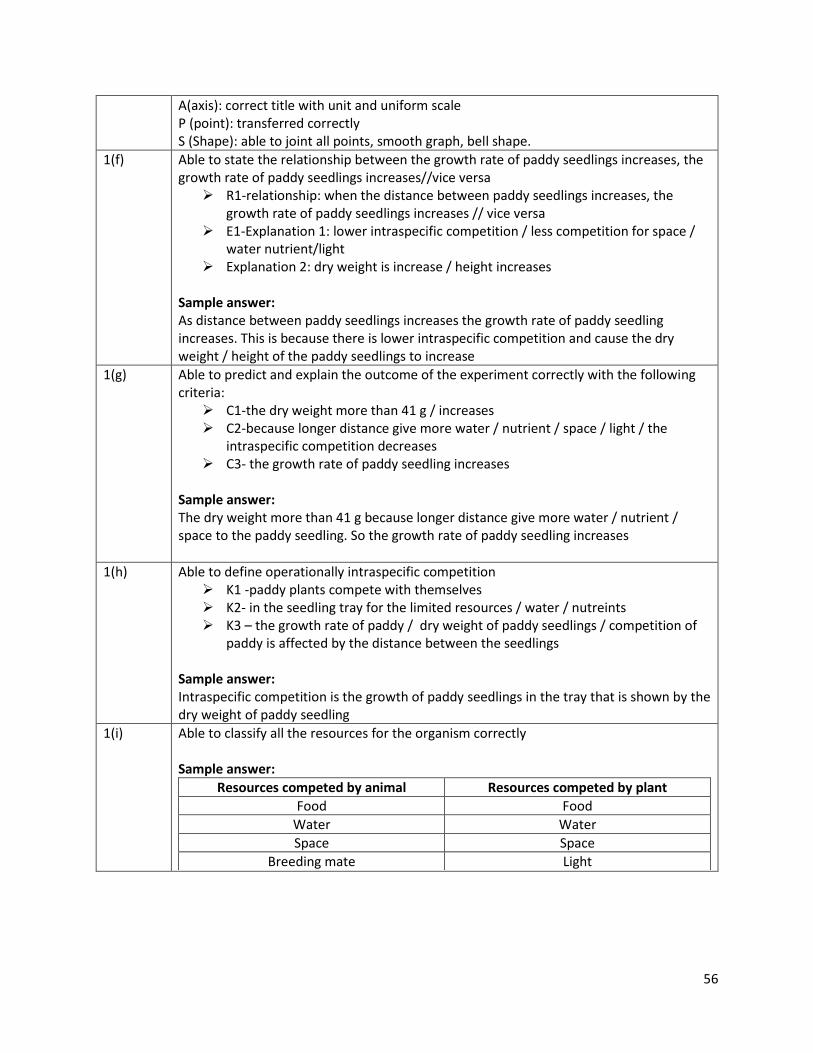
A(axis): correct title with unit and uniform scale P (point): transferred correctly S (Shape): able to joint all points, smooth graph, bell shape.
1(f) Able to state the relationship between the growth rate of paddy seedlings increases, the growth rate of paddy seedlings increases//vice versa
➢ R1-relationship: when the distance between paddy seedlings increases, the growth rate of paddy seedlings increases // vice versa
➢ E1-Explanation 1: lower intraspecific competition / less competition for space / water nutrient/light
➢ Explanation 2: dry weight is increase / height increases
Sample answer: As distance between paddy seedlings increases the growth rate of paddy seedling increases. This is because there is lower intraspecific competition and cause the dry weight / height of the paddy seedlings to increase
1(g) Able to predict and explain the outcome of the experiment correctly with the following criteria:
➢ C1-the dry weight more than 41 g / increases ➢ C2-because longer distance give more water / nutrient / space / light / the
intraspecific competition decreases ➢ C3- the growth rate of paddy seedling increases
Sample answer: The dry weight more than 41 g because longer distance give more water / nutrient / space to the paddy seedling. So the growth rate of paddy seedling increases
1(h) Able to define operationally intraspecific competition ➢ K1 -paddy plants compete with themselves ➢ K2- in the seedling tray for the limited resources / water / nutreints ➢ K3 – the growth rate of paddy / dry weight of paddy seedlings / competition of
paddy is affected by the distance between the seedlings Sample answer: Intraspecific competition is the growth of paddy seedlings in the tray that is shown by the dry weight of paddy seedling
1(i) Able to classify all the resources for the organism correctly Sample answer:
Resources competed by animal Resources competed by plant
Food Food
Water Water
Space Space
Breeding mate Light

57
Question 3 1(a) Able to record all 6 readings for the number of moth captured correctly.
Sample answers
Site Number of moth captured
A X = 16 Y=14
B X = 24 Y = 22
C X = 35 Y = 32
1 (b)(i) Able to state any two observations correctly according to 2 criteria:
Sample answers: 1. At site A, the number of moth in the first captured is 16, and the number of moth
captured in the second captured is 14 2. At site C, the number of moth captured is the highest compared to the number
of moth captured at site A and site B
1(b)(ii) Able to make one logical inference for each observation based on the criteria ➢ P1: infer on the degree of air pollution (Longer distance from the industrial area,
the tree trunks are less covered by smoke and soot) ➢ P2- Infer on the importance of camouflage ➢ P3- Infer on the result of predation
Sample answers:
1. At site A, the tree trunks are covered by more smoke and soot, light winged moths are more easily spotted / not being camouflaged / be seen by the predators. More light winged moths have been eaten / killed by the predators
2. At site C, the tree trunks are covered by less smoke and soot, less light winged moths can be seen by predators / light winged moths are camouflaged by the tree trunks. Less light winged moths eaten / killed by the predators / more light winged moths manage to survive
1(c) Able to state all 3 variables and the 3 methods to handle the variable correctly. Sample Answer:
Variables Method to handle the variable correctly
Manipulated variable Distance from the industrial area // Degree of pollution // Degree of camouflage
Capture the moths at different fixed distance from the industrial area / different degree of pollution/ different degree of camouflage
Responding variable The number of moths captured (in
Count and record the number of moths captured (in the first and second capture)

58
the first and second capture) Growth rate
Constant variable The place/area of the first and second capture// The type of moth in the first and second capture
Fix the place / area for the first and second capture // Fix the type of moth captured in the first and second capture
1(d) Able to state a hypothesis to show a relationship between the manipulated variable and responding variable and the hypothesis can be validated, based on 3 criteria:
➢ manipulated variable ➢ responding variable ➢ relationship
Sample answer:
1. As the distance nearer to the industrial area, the number the moths captured decrease
2. When the environment is not able to camouflage the moths, the number of moths captured decrease
3. As the environment is more polluted by the smoke, the number of moths captured decrease
1(e)(i) Able to draw and fill a table with all columns and rows labeled with complete unit Sample answers
Site Distance from the industrial
area
Number of moths in the first capture
Number of moths in
the second capture
Number of marked
moths in the second
capture
Estimated population of the light
winged moth
A 5km 16 14 4 56
B 10km 24 22 6 88
C 15km 35 32 7 160
1(e)(ii) Able to plot a graph with 3 criteria: (P): Able to draw both axes with uniform scale (T): Able to plot all 3 points (B): Able to draw a line through all 3 points only
1(f) Able to state the and explain the relationship between estimated population of the light winged moth and the distance from the industrial area
➢ R1-relationship ➢ E1-Tree trunk less polluted / covered by smoke / soot ➢ Light winged moths are well camouflaged // less light winged moths eaten /
killed by the predators

59
Sample answer: The further the distance from the industrial area, the higher the estimated population of the light winged moth. This is because the tree trunks are less polluted / covered by smoke / soot, the moths are well camouflaged
1(g) Able to predict and explain the outcome of the experiment correctly ➢ P1: estimated population of light winged moths is calculated from the number of
moth in the first capture and second capture ➢ P2: the first capture and second capture are carried out at the same place / site ➢ P3: the number of moth captured is influenced by the distance from the
industrial area / degree of pollution / the effect of camouflage // correct hypothesis
1(h) Able to predict the estimated population of dark winged moth at site A ➢ E1: the tree trunks are more polluted / covered by smoke / soot ➢ E2: provide better camouflage for the dark winged moth ➢ E3: dark winged moths are not easily seen by predators
1(i) Able to classify the biotic and abiotic factors Sample answer:
Biotic factor Abiotic factor
Bird Temperature
Tree Smoke
Ant Light intensity

60
Question 4 Problem statement Able to state the problem statement correctly based on:
P1 : light intensity/ distance of light bulb to the Lemna sp. P2 : the population size of Lemna sp H : Question form Sample answer: 1. What is the effect of light intensity on the population size of Lemna sp.? 2. Does light intensity affect the population size of Lemna sp.? 3. How does the distance of light bulb to the
Hypothesis Able to state the hypothesis based on the following aspects: P1 = Manipulated variable P2 = Responding variable R = Relationship / Link Sample answer :
1 The higher/increase the light intensity, the higher/increase the population size of Lemna sp.
2 The less/ smaller the distance of light bulb to the Lemna sp, the bigger/ larger population size of Lemna sp.
Variables Able to state all the three variables correctly Sample answers: 1. Manipulated variable: Light intensity // the distance of light bulb to the Lemna sp. 2 Responding variable: Population size of Lemna sp. 3 Constant variable (pH, temperature, number of Lemna sp.)
Apparatus and materials
Able to list out all the important apparatus and materials correctly or any 2 Materials (M) and 4 Apparatus (A) Sample answers: Apparatus: Thermometer, light bulb/table lamp, ruler/ metre rule, beaker (500ml), Marker pen Materials: (100) Lemna sp, pond water
Procedure 1. Filled up five beakers with 300ml of pond water and labelled as P, Q, R, S and T.
2. Placed ten lemna sp. in each of the beakers 3. Placed the beaker P at distance 10cm from the light bulb/source of
light/table lamp 4. Swicth on the light and leave it for two weeks. 5. Count the number of Lemna sp. in the beaker after two weeks 6. Calculate the population size of Lemna sp and record into a table.

61
7. Repeat steps 1to 6 by using different distances of light bulb/light source/table lamp such as 20cm, 30cm, 40cm and 50Cm
8. All results are recorded in a Table 9. Repeat the experiment twice to get the accurate average readings
Presentation of data
Beaker Distance of light bulb to Lemna sp.
(cm)
Number of Lemna (unit)
Population size of
Lemna sp. (unit)
Initial Final
P
Q
R
S
T

62
Question 4 Problem statement
1. What is the percentage coverage / population size / density of plant from species A and B in the school field?
2. Does the type of plant species affects the percentage coverage / population size / density of the plants?
3. Which type of the plant species / species A or B has the highest percentage coverage / population size?
Hypothesis 1 The percentage coverage //population size of species A plant is
higher than species B in the school field 2 Different plant species have different percentage coverage //
population size 3 Plant species A is more dominant than species B in this habitat
Variables 1 Manipulated variable: Type of plant species//species A and B // two example of plant species
2 Responding variable: Population size //percentage coverage of plants// density of species
3 Constant variable: Quadrat size, school field
Apparatus and materials
Materials: Plastic species A and B // any 2 plant species Apparatus: Plastic quadrat, marker pen, a4 paper, graph paper
Procedure 1. School field was chosen as the field study 2. Quadrats of size 1mx 1m is used 3. Identify two plant species A and B 4. The quadrats were thrown randomly in the school field 5. Count the area of coverage for each plant / species A and species B //
Count the number of individual of plant species in each quadrat 6. If more than half of the squares in the quadrat is covered, the area of
plant species will be counted. The area is not counted if only less than half is covered
7. Steps 5 to 7 was repeated for nine quadrats 8. The area covered by plants species/species A and species B/ number
of individual plant species studied in each quadrat were recorded and tabulated in a table
9. The percentage coverage / density/ frequency of plant species / species A and species B were calculated by using the following formula:
Percentage coverage of plant species =

63
𝑇𝑜𝑡𝑎𝑙 𝑎𝑟𝑒𝑎 𝑐𝑜𝑣𝑒𝑟𝑒𝑑 𝑝𝑙𝑎𝑛𝑡 𝑠𝑝𝑒𝑐𝑖𝑒𝑠 𝑖𝑛 𝑎𝑙𝑙 𝑞𝑢𝑎𝑑𝑟𝑎𝑡𝑠
𝑇𝑜𝑡𝑎𝑙 𝑛𝑢𝑚𝑏𝑒𝑟 𝑜𝑓 𝑞𝑢𝑎𝑑𝑟𝑎𝑡𝑠 𝑋 𝑎𝑟𝑒𝑎 𝑜𝑓 𝑞𝑢𝑎𝑑𝑟𝑎𝑡 𝑋 100%
Frequency of species =
𝑁𝑢𝑚𝑏𝑒𝑟 𝑜𝑓 𝑞𝑢𝑎𝑑𝑟𝑎𝑡 𝑐𝑜𝑛𝑡𝑎𝑖𝑛𝑖𝑛𝑔 𝑝𝑙𝑎𝑛𝑡 𝑠𝑝𝑒𝑐𝑖𝑒𝑠
𝑇𝑜𝑡𝑎𝑙 𝑛𝑢𝑚𝑏𝑒𝑟 𝑜𝑓 𝑞𝑢𝑎𝑑𝑟𝑎𝑡𝑠 𝑋 100%
Density of plant species =
𝑇𝑜𝑡𝑎𝑙 𝑛𝑢𝑚𝑏𝑒𝑟 𝑜𝑓 𝑖𝑛𝑑𝑖𝑣𝑖𝑑𝑢𝑎𝑙 𝑠𝑝𝑒𝑐𝑖𝑒𝑠 𝑖𝑛 𝑎𝑙𝑙 𝑞𝑢𝑎𝑑𝑟𝑎𝑡𝑠
𝑇𝑜𝑡𝑎𝑙 𝑛𝑢𝑚𝑏𝑒𝑟 𝑜𝑓 𝑞𝑢𝑎𝑑𝑟𝑎𝑡𝑠 𝑋 𝑎𝑟𝑒𝑎 𝑜𝑓 𝑎 𝑞𝑢𝑎𝑑𝑟𝑎𝑡
Presentation of data
Plant species
Number / area of plant species in the quadrat
Total number/area
of plant species (m2)
Density /percentage
coverage area (%)
1 2 3 4 5 6 7 8 9 10
A
B

64
CHAPTER 9
Question 1
1(a) Able to record the number of solid particles as seen under microscope (10x10) Sample answers
Places where slide is located
Number of solid particles as seen under microscope (10x10)
Set A 5
Set B 8
Set C 12
Set D 20
1 (b)(i) Able to state any two observations correctly according to 2 criteria: ➢ Places where slide is located (MV) ➢ Number of solid particles as seen under microscope (10x10)
Sample answers:
1. In set A/ air-condition room, the number of solid particles as seen under microscope (10x10) is 5
2. In set D/ school car park, the number of solid particles as seen under microscope (10x10) is 20
3. Is set C/ school canteen, the number of solid particles as seen under microscope (10x10) is 12
1(b)(ii) Able to make one logical inference for each observation based on the criteria ➢ Number of solid particles as seen under microscope (10x10) is less/more ➢ Level of air pollution is lower/higher ➢ Cleanest/dirtiest environment
Sample answers:
1. In set A, the number of solid particles as seen under the microscope (10x10) is less because the level of air pollution is lower indicating that it was the cleanest environment
2. In set D, the number of solid particles as seen under microscope (10x10) is more than the number of solid particles as seen under microscope (10x10) in set A/set B/ set c because the level of air pollution is higher indicating that it was the dirtiest environment
1(c) Able to state all 3 variables and the 3 methods to handle the variable correctly. Sample Answer:
Variables Method to handle the variable correctly
Manipulated variable Location where glass slide is placed
Glass slides are put at different location

65
Responding variable Number of solid particles as seen under microscope (10x10)
Count and record the number of solid particles as seen under by using a microscope (10x10)
Constant variable Time exposure//size of cellophane tape on the glass slide
Fix two days for exposure for each set// use the same size of cellophane tape on each of glass slide
1(d) Able to state a hypothesis to show a relationship between the manipulated variable and responding variable and the hypothesis can be validated, based on 3 criteria:
➢ manipulated variable (places where glass slide is located) ➢ responding variable (number of solid particles as seen under a microscope
(10x10)/level of air pollution ➢ relationship
Sample answer:
1. Air sample in school park is more//less polluted than air sample in an air-conditioned room/class room/school canteen.
2. The number of solid particles in school park air sample is higher/lower than air sample in an air-conditioned room/class room/school canteen
1(e)(i) Able to draw and fill a table with all columns and rows labeled with complete unit Sample answers
Place where glass slide is located Number of solid particles as seen under a microscope
(10x10)
Air conditioned room 5
Class room 8
School canteen 12
School car park 20
1(e)(ii) Able to plot a graph with 3 criteria: A(axis): correct title with unit and uniform scale [x axis = places where the glass slide is located, y axis= number of solid particles as seen under a microscope (10x10)] P (point): transferred correctly S (Shape): able to joint all points, bar graph
1(f) Able to state clearly and accurately the relationship between the places where glass slide is located and the number of solid particles as seen under a microscope:
➢ P1- places where the glass slide is located ➢ P2- number of solid particles as seen under a microscope (10x10) ➢ P3-reasoning / air pollutants (dust, smoke, soot)
Sample answer:
1. In set A/air-conditioned room, the number of solid particles seen under microscope (10x10) is lowest thus the existence of air pollutants (dust,soot,smoke) also less and not polluted

66
2. In set D/school car park the number of solid particles as seen under microscope (10x10) is highest this because of exhaust fumes emit large amounts of soot and particles as a result of combustion of fossil fuels
3. In set B/class room contain few numbers of solid particles as seen under microscope (10x10) because the doors and windows are closed thus less dust and particles in the environment
4. In set C/ school canteen the number of solid particles is higher compared to in set B/A because it was an open air area which contains more particulate matter
1(g) Able to state the definition of air pollution operationally, complete and correctly based on the following criteria
➢ D1: Number of solid particles as seen under microscope (10x10) ➢ D2: Places where the glass slide is located ➢ D3: level of air pollution
Sample answer: Air pollution is an air sample with the presence of solid particles and the level of air pollution is affected by the location where the glass slides are placed; the higher the number of the solid particles, the higher the level of air pollution
1(h) Able to predict the result accurately based on the following criteria: ➢ C1:prediction on the number of solid particles as seen under the microscope
(10x10) relative to set D ➢ C2: condition at the construction site ➢ C3: level of pollution
Sample answer: The number of solid particles as seen under microscope is 50 (more compared to set D). In the construction area there will be more particulate matter (soot,dirt, dust) compared to set D indicates that area has highest level of air pollution compare to other places
1(i) Able to classify all the materials and apparatus correctly Sample answer:
Materials (M) Apparatus (A)
Distilled water Reagent bottles
0.1 % methylene blue solution Syringe
Pond water
River water
Drain water
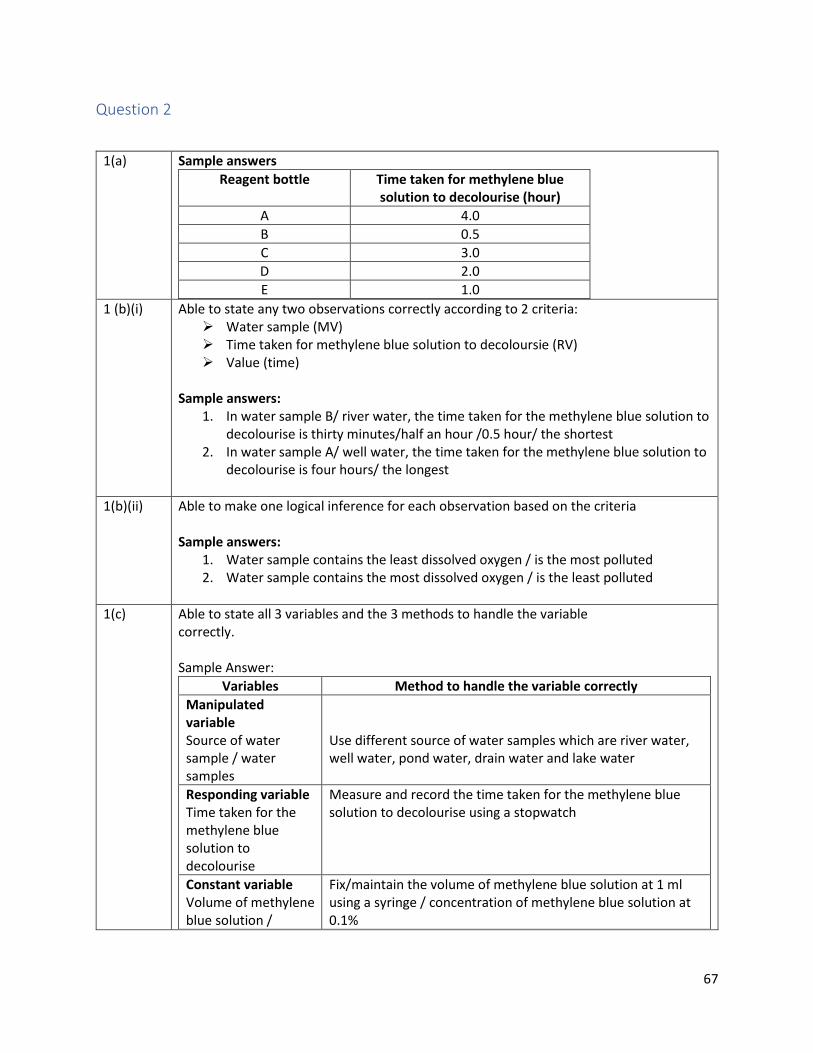
67
Question 2
1(a) Sample answers
Reagent bottle Time taken for methylene blue solution to decolourise (hour)
A 4.0
B 0.5
C 3.0
D 2.0
E 1.0
1 (b)(i) Able to state any two observations correctly according to 2 criteria: ➢ Water sample (MV) ➢ Time taken for methylene blue solution to decoloursie (RV) ➢ Value (time)
Sample answers:
1. In water sample B/ river water, the time taken for the methylene blue solution to decolourise is thirty minutes/half an hour /0.5 hour/ the shortest
2. In water sample A/ well water, the time taken for the methylene blue solution to decolourise is four hours/ the longest
1(b)(ii) Able to make one logical inference for each observation based on the criteria Sample answers:
1. Water sample contains the least dissolved oxygen / is the most polluted 2. Water sample contains the most dissolved oxygen / is the least polluted
1(c) Able to state all 3 variables and the 3 methods to handle the variable correctly. Sample Answer:
Variables Method to handle the variable correctly
Manipulated variable Source of water sample / water samples
Use different source of water samples which are river water, well water, pond water, drain water and lake water
Responding variable Time taken for the methylene blue solution to decolourise
Measure and record the time taken for the methylene blue solution to decolourise using a stopwatch
Constant variable Volume of methylene blue solution /
Fix/maintain the volume of methylene blue solution at 1 ml using a syringe / concentration of methylene blue solution at 0.1%

68
concentration of methylene solution
1(d) Sample answer:
1. Time taken for the methylene blue solution to decolourise is the shortest for river water
2. River water is the most polluted of the samples of water collected 3. River water is most polluted followed by lake water, drain water, pond water and
well water
1(e)(i) Able to draw and fill a table with all columns and rows labeled with complete unit Sample answers
Water sample Time taken for methylene blue solution
to decolourise (hour)
Level of water pollution
Well water 4.0 1
River water 0.5 5
Pond water 3.0 2
Drain water 2.0 3
Lake water 1.0 4
1(e)(ii)

69
1(f) Sample answer:
1. Time taken for methylene blue solution to decolourise in well water is the longest thus the level of water pollution in well water is the lowest. Well water has the highest dissolved oxygen concentration / There is very little aerobic microorganisms in well water. BOD value in well water is the lowest
1(g) Sample answer: Water pollution is the change in the quality of water/ the amount of dissolved oxygen / biological oxygen demand (BOD) of the water, this is shown (in this experiment) by the time taken for the methylene blue solution to decolourise when it is added to different water samples/river water, well water, pond water, lake water and drain water
1(h) Sample answer: The time taken for the methylene blue solution to decolorise is less than in 30 minutes. Water samples contain (high organic matter causing growth of) a lot of aerobic decomposers. This reduces the dissolved oxygen / causes high BOD value
1(i) Able to classify all the materials and apparatus correctly Sample answer:
Materials (M) Apparatus (A)
Water samples Syringe
0.1 % methylene blue solution Stopper
Reagent bottle
Stopwatch

70
FORM 5
CHAPTER 1
Question 1
1(a)
Duration of activity (min)
Time taken for 35 heartbeat (second)
Jogging on the spot for 5 minutes 22
Jogging on the spot for 10 minutes 12
Jogging on the spot for 15 minutes 5
1 (b)(i) Able to state two observations correctly according to 2 criteria:
• Duration of activity ( Manipulated variable)
• Time taken to obtain 35 heartbeats (Responding variable)
• Reading with unit //comparison
Sample answers: 1 When jogging on the spot for 5 minutes, the time taken to obtain 35 heartbeats
is 22 seconds. 2 When jogging on the spot for 15 minutes, the time taken to obtain 35 heartbeats
is 5 seconds. 3 The time taken to obtain 35 heartbeats when jogging on the spot for 5 minutes is
longer than jogging for 15 minutes.
1(b)(ii) Able to make two inferences correctly based on the criteria:
• Less/More energy is used
• Less/ more blood pump out of the heart Sample answers:
1. Jogging for 5 minutes use less energy, so less blood is pump out of the heart/pumping of the heart is slower.
2. Jogging for 15 minutes use more energy, so more blood is pump out of the heart/pumping of the heart is faster.
1(c) Able to state all 3 variables and the 3 methods to handle the variable correctly. Sample Answer:
Variables Method to handle the variable correctly
Manipulated variable Duration of activity
Carry out activities at different duration of 5 minutes, 10 minutes and 15 minutes.
Responding variable Time taken to obtain 35 heartbeats
Measure and record the time taken to obtain 35 heartbeats by using a stopwatch.

71
Constant variable Student Type of activity
Use the same student. Jogging on the spot
1(d) Able to state a hypothesis to show a relationship between the manipulated variable and responding variable and the hypothesis can be validated, based on 3 criteria:
• Manipulated variable (duration of activity)
• Responding variable (rate of heartbeat)
• Relationship Sample answers:
1. The longer the duration of activity, the faster the rate of heartbeat.
1(e)(i) Able to construct a table which contain the following aspects: (T): Titles with correct units (3 titles) (D): Record all data correctly Sample answer:
Duration of activity
(min)
Time taken to obtain 35 heartbeats (s)
Rate of heartbeats
(s-1)
5 22 1.59
10 12 2.92
15 5 7.00
1(e)(ii) Able to draw a graph to show the heartbeat rate against duration of activity with 3 criteria correctly.
• Both axes with regular values
• All points are correctly plotted
• Correct shape
1(e)(iii) Able to explain the relationship between the duration of activity and rate of heartbeat accurately based on 3 criteria:
• Duration of activity
• Rate of heartbeat
• Explanation - more oxygen/energy is needed - more blood is pump out of the heart Sample answer The longer the duration of activity the faster the rate of heartbeat because more oxygen/energy is needed so more blood is pump out of the heart.
1(f) Able to state the meaning of heartbeat operationally based on 3 criteria:
• Pumping of the heart
• Duration of activity
• Time taken to obtain 35 heartbeat Sample answer: Heartbeat is the pumping/contraction of the heart of a student affected by duration of activity and shown by the time taken to obtain 35 heartbeats.

72
1(g) Able to predict the time taken for the methylene blue to be decolourised accurately based on 3 criteria:
• Expected time taken (more)
• Comparing with recent condition (less blood pump out of the heart)
• Reason (less energy used) Sample answer: The time taken is 30 seconds / more than 22 seconds because less energy is used when resting, so less blood is pump out of the heart to supply oxygen.
1(i) Able to list down all three water samples according to the BOD level.
Heartbeat rate Situation
Normal • Sleeping
• Praying
• Reading magazine
Increases • Swimming
• Gardening
• Cross country running

73
Question 2
1(a) Able to Record all the mass of water absorbs by Hibiscus leafy shoot in Table 1 correctly. Sample answers:
Condition Mass of water absorps by Hibiscus leafy shoot
Present of anhydrous calcium chloride
18.0 g /grams
Absent of anhydrous calcium chloride
3.6 g/ grams
1 (b)(i) Able to state any two observations correctly based on the aspects :
• P1: Manipulated variable: Present or absent of anhydrous calcium chloride / condition in transparent polythene bag
• P2: Responding variable: Mass of water absorps by Hibiscus leafy shoot
• H: correct relationship.
Sample answer: 1 In the present of anhydrous calcium chloride, the mass of leafy shoot of potted
plant after experiment is 2229.3g/grams / the mass of water absorps by Hibiscus leafy shoot is 18.0 g/grams.
2 In the absent of anhydrous calcium chloride, the mass of leafy shoot of potted plant after experiment is 244.3g/grams / the mass of water absorps by Hibuscus leafy shoot is 3.6 g/grams.
1(b)(ii) Able to make correct inferences based any 2 aspects as follows:
• P1: More or less humidity
• P2: More/less water is absorps by roots// evaporation of water vapour is high/low // rate of transpiration is high / low
Sample answer:
1. In the present of anhydrous calcium chloride, The humidity is low, so more water is absorps by roots // evaporation of water vapour is high. hence the rate transpiration is
2. High 3. In the absent of anhydrous calcium chloride, The humidity is high, so less water is
absorps by roots // evaporation of water vapour is low , hence the rate transpiration is low.
1(c) Able to state all 3 variables and the 3 methods to handle the variable correctly. Sample Answer:
Variables Method to handle the variable correctly
Manipulated variable

74
Present /absent of anhydrous calcium chloride
Change the polythene bag with the present or absence of anhydrous calcium chloride
Responding variable responding variable Low/high humidity // high /low rate of transpiration // high/low evaporation of water by leafy shoot // high /low water absorps by roots.
Calculate the mass of water absorps by plant by the following formula: Mass of the potted leafy shoot before the experiment – mass of the potted leafy shoot after 9 hours Calculate the rate of transpiration by the following formula:
𝑚𝑎𝑠𝑠 𝑜𝑓 𝑤𝑎𝑡𝑒𝑟 𝑎𝑏𝑠𝑜𝑟𝑝𝑠 𝑏𝑦 𝑝𝑙𝑎𝑛𝑡𝑠 (𝑔)
9 ℎ𝑜𝑢𝑟𝑠
Constant variable Type of leafy shoot Temperature Light intensity
Use Hibiscus plant Fix the temperature / light intensity
1(d) Able to write a complete hypothesis statement correctly based on the following aspects :
• P1 = manipulated variable [Present /absent of anhydrous calcium chloride]
• P2 = responding variable [Low/high humidity // high /low rate of transpiration // high/low evaporation of water by leafy shoot // high /low water absorps by roots.]
• H = Relationship / Link (comparing)
Sample answer: In the present of anhydrous calcium chloride / low humidity, the rate of transpiration / water loss / evaporation of water by leafy shoot / water absorps by roots is higher compare to condition without anhydrous calcium chloride / high humidity.
1(e)(i) Able to draw a table and show all the 3 aspects as Follows correctly : T – Heading in the table are labeled with correct units D – All data are correct C – The correct calculation of transpiration rate Sample answer:
Condition Mass of the potted leafy shoot after the
experiment
Mass of water absorps by Hibiscus
leafy shoot
Transpiration rate/hour
Present of anhydrous
calcium chloride
229.9 18.0 2.0

75
Absent of anhydrous
calcium chloride
244.3 3.6 0.4
1(e)(ii) Able to plot a bar chart graph correctly with the following aspects: P – all axis with uniform scale and correct units T – all point is transferred correctly B – Bar chart graph was plotted / separate /combine bar Sample answer:
1(e)(iii) Able to explain the relationship between the condition of the experiment and the rate of
transpiration of leafy shoot correctly based on the following aspects:
• P1: Hypothesis statement
• P2: Humidity high / low
• P3: More / less water evaporates through stomatal pores of leaves / more water absorps by roots
Sample answer In the transparent polythene bag with the present of anhydrous calcium chloride gives higher rate of transpiration (in Hibiscus leafy shoot) compare to the polythene bag without anhydrous calcium chloride. This is because the humidity is low / surrounding air at the leaf is dry. Hence more water vapour evaporates from the stomatal pore of leaves / more water is absorps by roots.
1(f) Able to predict the mass of water absorps by roots of plant correctly based on the following aspects:
• P1: Mass of water absorps by roots increase / more /higher than 3.6 g /grams
• P2: High Rate of transpiration
• P3: More water evaporates through stomatal pores of leaves
Sample answer:

76
The mass of water absorps by roots increases / more / higher than 3.6 grams because the rate of transpiration is higher / increases (surrounding air is dried) causing more water evaporates from the leaf stomatal pores.
1(g) Able to describe the concept of transpiration based on the following aspects:
• P1: Process water absorps by roots of Hibiscus leafy shoot / reduce in mass of water absorps by plant
• P2: Shown by (final) the mass of potted leafy shoot after experiment.
• P3: Affected by humidity / condition of plant. Sample answer: Transpiration is a process whereby water is absorps by roots of Hibiscus leafy shoot / reduction in the mass of water absorps by plant. It is shown by the (final) mass of water absorps by plant after experiment. The rate of transpiration is affected by humidity / condition of plant.
1(h) Able to classify all / 6 correct ticks for high and low transpiration as follows:
High transpiration Low transpiration
Dry wind Sunny day
More leaves
High humidity Cool temperature Low speed of fan

77
CHAPTER 3
Question 1
1(a) Able to classify Diagram 1 correctly under the apparatus and materials using suitable materials // 7 correct ticks. Sample answers:
Variables Apparatus Material
Manipulated Glass cup Bottle
Drinking water
Responding Measuring cylinder Urine
Constant Stopwatch Students
1 (b) Able to record all the correct volumes of urine // 7 - 8 volumes of urine released by student 1 and student 2 correctly Sample answers:
Student’s group of the same age
Volume of drinking water drank (ml)
Volume of urine released by two different students after 1 hour (ml)
Student 1 Student 2
A 200 33 43
400 96 93
B 600 93 123
800 113 136
1(c)(i) Able to state two different observations correctly based on the following aspects:
• P1: Manipulated variable: Volume of water drank by each group of student
• P2: Responding variable: Volume of urine released by two different students (student 1 and student 2) after 1 hour.
Sample answers: 1. When student A drank 200ml / 400ml volume of drinking water, the volume of
urine released/ produced after 1 hour by student 1 is 33 ml/96ml and student 2 is 43 ml/ 93 ml.
2. When student B drank 600ml/800 ml volume of drinking water, the volume of urine released/ produced after 1 hour by student 1 is 93ml/113ml and student 2 is /123ml/136 ml.
1(c)(ii) Able to make two inferences correctly based on any two aspects:
• P1: Low / High blood osmotic pressure // solute in blood is more / less.
• P2: Less / More ADH by Pituitary gland // Less /More absorption of water at Kidney tubule // Kidney less / more permeable to water
Sample answer: 1. (Student A drank 200/400 ml of water) Blood osmotic pressure is high / more
solute in blood, causing kidney tubule more permeable to water // more ADH
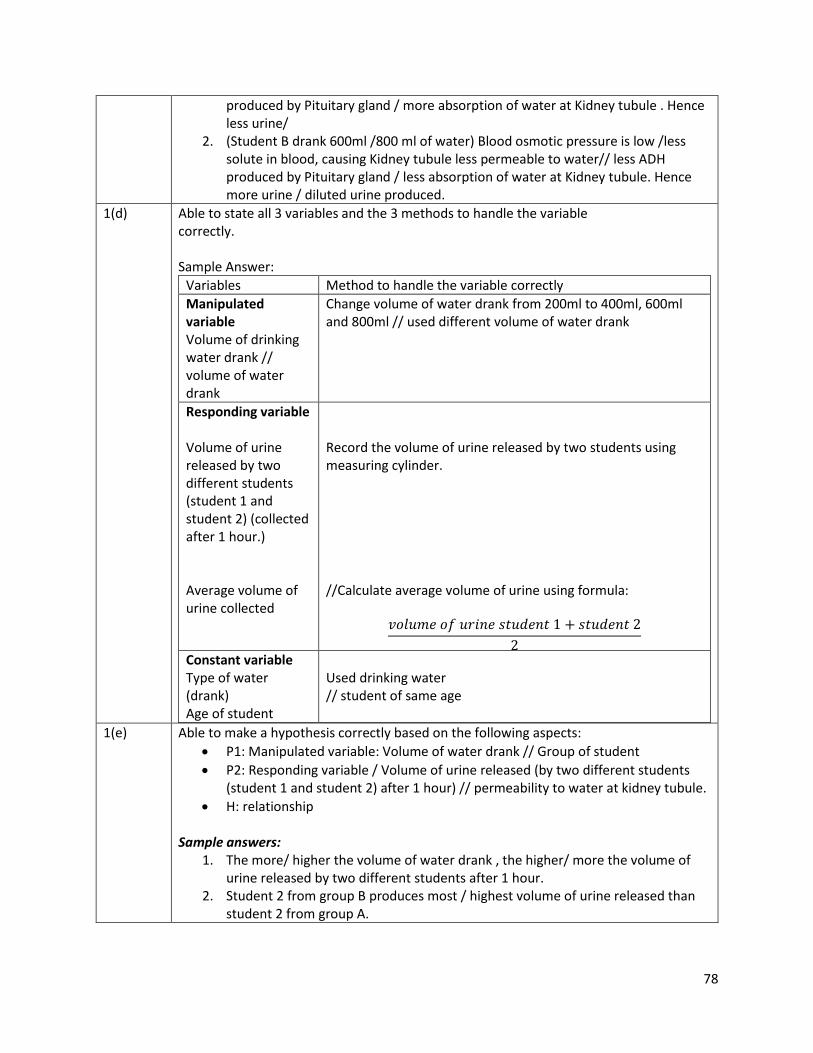
78
produced by Pituitary gland / more absorption of water at Kidney tubule . Hence less urine/
2. (Student B drank 600ml /800 ml of water) Blood osmotic pressure is low /less solute in blood, causing Kidney tubule less permeable to water// less ADH produced by Pituitary gland / less absorption of water at Kidney tubule. Hence more urine / diluted urine produced.
1(d) Able to state all 3 variables and the 3 methods to handle the variable correctly. Sample Answer:
Variables Method to handle the variable correctly
Manipulated variable Volume of drinking water drank // volume of water drank
Change volume of water drank from 200ml to 400ml, 600ml and 800ml // used different volume of water drank
Responding variable Volume of urine released by two different students (student 1 and student 2) (collected after 1 hour.) Average volume of urine collected
Record the volume of urine released by two students using measuring cylinder. //Calculate average volume of urine using formula:
𝑣𝑜𝑙𝑢𝑚𝑒 𝑜𝑓 𝑢𝑟𝑖𝑛𝑒 𝑠𝑡𝑢𝑑𝑒𝑛𝑡 1 + 𝑠𝑡𝑢𝑑𝑒𝑛𝑡 2
2
Constant variable Type of water (drank) Age of student
Used drinking water // student of same age
1(e) Able to make a hypothesis correctly based on the following aspects:
• P1: Manipulated variable: Volume of water drank // Group of student
• P2: Responding variable / Volume of urine released (by two different students (student 1 and student 2) after 1 hour) // permeability to water at kidney tubule.
• H: relationship Sample answers:
1. The more/ higher the volume of water drank , the higher/ more the volume of urine released by two different students after 1 hour.
2. Student 2 from group B produces most / highest volume of urine released than student 2 from group A.

79
3. As blood osmotic pressure decreases, the more volume of urine produced by kidney/ less permeable to water at kidney tubule.
1(f)(i) Able to construct a table which contain the following aspects: (T): Titles with correct units (3 titles) (D): Record all data correctly (C): Calculate average volume of urine and scale of blood osmotic pressure correctly. Sample answer:
Student’s group of the same
age
Volume of
drinking water drank (ml)
Volume of urine released by two different students after 1 hour (ml)
Blood osmotic pressure
Student 1 Student 2 Average volume of
urine
A 200 33 43 38.0 4
400 96 93 94.5 3
B 600 93 123 108.0 2
800 113 136 124.5 1
1(f)(ii) Able to draw a line graph to show the relationship between the average volume of urine collected against the volume of water intake correctly based on the following aspects:
• Axes: Both axis with uniform scales ….. 1 mark
• Points(T): All point plotted correctly …...1 mark
• Shape(B): Correct bar chart shape …....1 mark
1(g) [Interprate the graph] Able to state the relationship between the volume of water intake and the average volume of urine collected based on aspects:

80
• R: correct relationship :The higher the volume of water drank / intake, the higher the volume of urine collected / produced.
• P1: because the blood osmotic pressure decreases
• P2: More water is absorps by kidney tubule// Kidney becomes less
• permeable to water // less ADH produced by Pituitary gland Sample answer The higher the volume of water drank / intake, the higher the volume of urine collected / produced because the blood osmotic pressure decreases. This is due to less water is absorps by kidney tubule// Kidney becomes less permeable to water // less ADH produced by Pituitary gland.
1(h) Able to define operationally on high blood osmotic pressure based on the following aspects:
• P1: more solute in blood or content of drinking water in blood is less/ low at student A and B // condition of less frequent urination/ less volume of urine by student A and student B
• P2: shown by the volume of urine released by two students after 1 hour.
• P3: which are affected by the volume of water drank
Sample answers: High blood osmotic pressure is refer to more solute in blood or content of drinking water in blood is less/ low at student A and B // condition of less frequent urination/ less volume of urine by student A and student B that is shown by the volume of urine released by two students after 1 hour. Blood osmotic pressure is affected by the volume of water intake/ drank.
1(i) Able to predict the volume of urine produced by this student correctly based on:
• P1: (Volume of urine) increases / more than 33ml / any value above 33ml/ logic.
• P2: Caffein is diuretic / causes more urine.
• P3: Blood osmotic pressure is low // Kidney less permeable to water //Less water is reabsorbs at kidney tubule.
Sample answer: (Volume of urine) increases / more than 33ml / any value above 33ml because caffein in coffee is diuretic or causes more urine. Hence blood osmotic pressure is low // Kidney less permeable to water //Less water is reabsorbs at kidney tubule.

81
Question 2
1(a) Sample answers:
Set Days
A 3
B 2
C 1
1(b)(i) Able to state two different observations correctly:
Sample answers: Vertical:
1. Bananas in set C took 1 day to ripen / turn yellow 2. Bananas in Set A took 3 days to ripen / turn yellow
Horizontal
1. In day 1/16 Nov, bananas in set A have turn yellow, bananas in set B and set C still green and yellowish green colour
2. In day 2/ 17 Nov, bananas in set A still in yellowish green,bananas in set B and set C have turn yellow
1(b)(ii) Able to make two inferences correctly:
Sample answer: 1. In set C, the concentration of ethylene produced by the mangoes is the highest.
Ethylene induced the bananas to ripen faster 2. In set A, no ethylene induces the ripening process of the bananas, The ripening
process is the slowest 3. In day 1, bananas in set C turn yellow/ ripen the fastest because the
concentration of ethylene in set C is the highest, ethylene induce the ripening of bananas.
4. In day 2, bananas in set A is still unripe because no ethylene induce the ripening process
1(d) Able to state all 3 variables and the 3 methods to handle the variable correctly. Sample Answer:
Variables Method to handle the variable correctly
Manipulated variable The number of ripe mango
Use different number of mangoes in different set of experiment
Responding variable

82
Time/ day taken by the unripe bananas to ripe / turn yellow
Count the day for the unripe bananas to turn yellow by referring to the calender
Constant variable The size of the plastic container The unripe bananas
Use the same size plastic containers Use the bananas from the same stalk of bananas
1(d) Able to make a hypothesis correctly based on the following aspects:
• P1: manipulated variable (the number of ripe mango/ concentration of ethylene)
• P2: responding variable (time/ day taken by the bananas to ripe / turn yellow)
• H : relationship (higher/increase or inversely) Sample answers: The more the number of ripe mangoes / the higher the concentration of ethylene, the faster the bananas to ripen / become ripe/ turn yellow
1(e)(i) Sample answer:
Set of experiment Number of mangoes used
Time taken for the unripe bananas to turn
yellow
Set A 0 3
Set B 1 2
Set C 2 1
1(f)(ii) Able to draw a line graph correctly based on the following aspects:
• Axes: Both axis with uniform scales
• Points(T): All point plotted correctly
• Shape(B): Able to join all the points to form the graph
1(g) Able to interpret data correctly and explain with the following aspects: Relationship
• P1- able to state the relationship between the manipulated variable and responding variable
Explanation
• P2-able to state mangoes produce / release ethylene
• P3-ethylene induce the ripening of bananas
Sample answer As the number of ripe mangoes increase, the bananas ripen faster. This is because more ethylene is produced by the mangoes. Bananas induced by ethylene to ripen / turn yellow faster

83
1(h) Able to deduce about ripening process of bananas based on the results of the experiment with the following aspects
• P1: the condition of ripening process
• P2: induced by ethylene / ripe mangoes
• P3: the higher the concentration of the ethylene, the faster the ripening process occur
Sample answers: Ripening process of bananas occur when the bananas turn yellow. The process induced by ethylene / number of mangoes present. The higher the concentration of the ethylene, the faster the ripening process occur
1(h) Able to predict the and explain the outcome of the experiment correctly with the following aspects: Prediction: P1: able to predict the time taken for the unripe bananas to turn yellow / ripen Explanation: P2- able to state that without the cover, ethylene diffuse into the surrounding P3-able to state that less ethylene to induce the unripe bananas to ripen Sample answer: The time/ day taken for the unripe bananas in set C to ripen will become more than one day. This is because without the plastic cover, ethylene diffuse to the surrounding, less ethylene induces the unripe bananas to ripen
Plant hormone Function
Auxin Used to produce seedless fruits
Gibberelins Used to promote the growth of main stem
Cytokinin Used in storage of green vegetables

84
CHAPTER 4
Question 1
1(a)
Soil Length / cm
Sandy 1.4
Clay 7.0
Silty 8.8
Loamy 11.0
1 (b)(i) Able to state two observations correctly
Sample answers: 1 The length of the root in sandy soil is 1.4cm 2 The length of the root in clay soil is 7.0 cm 3 The length of the root in silty soil is 8.8 cm 4 The length of the root in loamy soil is 11.0cm
1(b)(ii) Able to make two inferences correctly Sample answers:
1. Because the growth rate of the root is low /slow/ reduce/ decrease 2. Because the growth rate of the root is high/ fast/ increase 3. Because the growth rate of the root is higher in loamy soil than in sandy soil
1(c) Able to state all 3 variables and the 3 methods to handle the variable correctly. Sample Answer:
Variables Method to handle the variable correctly
Manipulated variable Type of soil
Use different type of soil in the experiment such as loamy soil, clay soil, silty soli, and sandy soil Use soil with different colours such as black, dark grey, brownish and yellowish
Responding variable The length of the root // growth rate
Measure and record the length of the root by using a ruler// Calculate and record the growth rate using the formula: Growth rate = Length of root / time
Constant variable Type of bean / seed// Volume of water //
Use the same type of bean / red bean // Use the same volume of water that is 5ml

85
Mass of soil// Time
Use the same mass of soil that is 300g Fix the time within 3 days
1(d) Able to state a hypothesis to show a relationship between the manipulated variable and responding variable and the hypothesis can be validated, based on 3 criteria:
• Manipulated variable (duration of activity)
• Responding variable (rate of heartbeat)
• Relationship Sample answers:
1. The darker the colour of the soil, the longer the length of the root 2. The higher the level of soil fertility, the higher the growth rate of the root
1(e)(i) Able to construct a table which contain the following aspects: (T): Titles with correct units (3 titles) (D): Record all data correctly Sample answer:
Type of soil Length of the root/cm Growth rate of the root / cm day-1
Sandy 1.4 0.47
Clay 7.0 2.33
Silty 8.8 2.93
Loamy 11.0 3.67
1(e)(ii) Able to draw a bar chart correctly with the following aspects.
• Correct titles with unit on both horizontal and vertical axis (and uniform scale)
• All points plotted correctly as in the table
• Able to draw all bars
1(f) Able to interpret data correctly and explain with the following aspects:
• P1-Able to state the relationship between the manipulated variable and responding variable correctly
• P2- able to state “because the cells divide actively by mitosis”
• P3- able to state ‘the growth rate increases’ Sample answer The darker the colour of the soil, the longer the length of the root because the cells divide actively mitosis and the growth rate increases
1(g) Able to define operationally based on the result of the experiment with the following aspects:
• P1- the length of the root
• P2-using red bean
• In different type of soil
Sample answer: Growth is the length of the root of the red bean in different types of soil

86
1(h) Able to predict and explain the outcome of the experiment correctly with the following aspects:
• Prediction: the length of the root will increase more than 11.0cm
• Explanation: because the soil is more fertile
1(i) Able to classify the growth pattern of all organisms and parameters correctly.
Sigmoid curve Series of steps curve
Tilapia Grasshopper
Maize plant Cockroach
Paddy plant

87
Question 2 Problem statement Sample answer
How does the height of the maize plant changes with the number of planting days?
Hypothesis Sample answer The longer the number of planting days, the higher the height of the maize plant (until a limit)
Variables 1 Manipulated variable: Duration of planting (number of days) 2 Responding variable: The height of the maize plant / shape of the
growth curve 3 Constant variable: The size and variety of the maize seeds / the type
of soil / measuring method
Apparatus and materials
Materials: Loam/garden soil, maize seeds Apparatus: Meter rule or measuring tape
Procedure 1. A nursery with garden or loam soil is prepared 2. Several maize seeds of the same variety and same average size are
chosen 3. The chosen seeds are planted in the soil at regular intervals of at least
15cm 4. The seeds are watered every day 5. The height of at least 3 maize plants are measured with metre rule or
measuring tape 6. Repeat step 4 every 10 days for a duration of 120 planting days 7. The data is recorded in the table 8. A graph of average height against planting days is plotted
Presentation of data
Number of days after planting
(day)
Height of maize plant (cm) Average
Plant 1 Plant 2 Plant 3
0
10
30
↓ ↓
120

88
CHAPTER 5
Question 1 1(a)
1 (b)(i) Able to state any two different observations correctly according to the criteria:
• C1 Offspring
• C2 Genotype / Phenotype Sample answers: Horizontal
1. Offspring 1/3/5/8/10/12/14/17/19/20/23/24 has genotype Bb / heterozygous black.
2. Offspring 1/3/5/8/10/12/14/17/19/20/23/24 has one black allele and one white allele.
3. Offspring 2/6/11/15/18/21 has genotype BB / homozygous black. 4. Offspring 2/6/11/15/18/21 has two black alleles /alleles for black. 5. Offspring 4/7/9/13/16/22 has genotype bb / homozygous white. 6. Offspring 4/7/9/13/16/22 has two white alleles. 7. Offspring 6/.. is black / has black fur / the phenotype is black. 8. Offspring 7/.. is white / has white fur / the phenotype is white.
Vertical
1. The number of offsprings with genotype Bb is double/twice/more than the number of offsprings with genotype BB / bb.
2. The number of offsprings with genotype BB / bb is 6. 3. The number of offsprings with genotype Bb is the most.
1(b)(ii) Able to make one logical inference for each observation based on the criteria: Horizontal
• C1 Allele inherited (from mother / father)
• C2 Dominant / recessive trait Vertical
• C3 Chance / Probability

89
Sample answers: Horizontal (C1+C2)
1. Offspring (1/3/5/8/10/12/14/17/19/20/23/24) has (one) dominant allele and show dominant trait // ..inherit (one) dominant allele and black (fur) is dominant (trait).
2. Offspring (2/6/11/15/18/21) has (two) dominant alleles and black (fur) is dominant.
3. Offspring (4/7/9/13/16/22) has (two) recessive alleles and white (fur) is recessive.
Vertical (C3)
1. The probability to get offsprings with Bb is double/twice/more than the offsprings with genotype BB / bb.
2. The probability to get offsprings with genotype BB / bb is less/least. 3. The probability to get offsprings with genotype Bb is the most.
1(c) Able to state all 3 variables and the 3 methods to handle the variable correctly. Sample Answer:
Variables Method to handle the variable correctly
Manipulated variable Phenotype/fur colour of parents // Genotype of parents
Two black rabbits are crossed/used // Two rabbits (black parents), both with genotype Bb are crossed / used // Two (black) heterozygous/hybrid rabbits are crossed/ used // Parents genotype involved are Bb and Bb // Use both Bb
Responding variable Phenotype of offsprings
(Count and) record the number of black and white rabbits Calculate the percentage of black and white rabbits:
𝑛𝑢𝑚𝑏𝑒𝑟 𝑜𝑓 𝑜𝑓𝑓𝑠𝑝𝑟𝑖𝑛𝑔
𝐴𝑙𝑙 𝑜𝑓𝑓𝑠𝑝𝑟𝑖𝑛𝑔 𝑥 100%
Calculate the ratio of black and white rabbits as: X black : Y white
Constant variable Type / species of organism // Characteristic // Traits // Size of buttons // Random fertilisation
Use/involve rabbits // Use/involve fur colour // Use/involve black and white fur // Use same size (of button) // Pick button randomly

90
1(d) Able to state a hypothesis to show a relationship between the manipulated variable and responding variable and the hypothesis can be validated, base on 3 criteria:
• C1 Manipulated variable
• C2 Responding variable
• C3 Relationship (Accept if wrong number, percentage or ratio)
Sample answers: 1. When two black rabbits are crossed, the offsprings are 18 black and 6 white. 2. When black parents are crossed, the offsprings are 18 black and 6 white. 3. When two heterozygous/hybrid (black) rabbits are crossed, the ratio of
offsprings is 3black : 1 white. 4. When two black rabbits are crossed, the offsprings are 75% black and 25% white. 5. When two rabbits with genotype Bb are crossed, the offsprings are 18 black and
6 white.
1(e)(i) Able to tabulate a table and fill in data accurately base on three criteria:
• C1: Titles - Parents: Genotype, Phenotype Offsprings: Genotype, BB, Bb, bb. Phenotype, Black, White.
• C2: Recording data - Parents: BB, Bb, bb, Black, White Offspring: Number of offspring
• C3: Calculation: Percentage of offspring Sample answer: Parents:
Genotype BB Bb bb
Phenotype Black Black white
Offspring:
Genotype Phenotype
Number BB Bb Bb Black White
Percentage 25 50 25 75 25
Or
Genotype Phenotype
BB Bb Bb Black White
6 12 6 18 6
25% 50% 25% 75% 25%
1(e)(ii) Able to draw a bar chart based on three criteria:
• C1: The x-axis and the y-axis are marked with appropriate values and constant scale.
• C2: All points are transferred correctly
• C3: Two bars with same width (Bar for black fur is taller than the bar for white fur)

91
1(e)(iii) Able to state the phenotypic ratio of fur colour among the rabbit offsprings and explain the inheritance of fur colour. C1: Relationship
• (The phenotypic ratio of the offspring is) 3 Black : 1 White (If 3:1, idea level only) C2: Any two Explanations:
• E1 – Black (fur) is determine by a dominant allele/gene Black (fur) is dominant trait // Black (fur) is dominant and white (fur) is recessive // Black (fur) is dominant to white (fur)
• E2 – (Both) parents have dominant allele / B (Both) parents produced 50% gametes with B (/ 50% gametes with b)
• E3 – The chance/probability of black offspring is 75% (/ white offspring is 25%)
Sample answer: 1 (The phenotypic ratio of the offspring is) 3 Black : 1 White. Black (fur) is
determine by a dominant allele. The parents have dominant allele. 2 Black : 1 White. Black (fur) is a dominant trait. The parents produced 50%
gametes with dominant allele/B. 3 3 Black : 1 White. Black (fur) is dominant and white (fur) is recessive. The
probability of black offspring is 75%.
1(f) Able to describe the term phenotype operationally, based on the experiment. Criteria:
• C1 Phenotype is (the trait inherited by rabbits, that are the) black fur and white fur in rabbits.
• C2 Determined by the (random) pairing of black buttons and white button as the genotype.
• C3 The (phenotypic ratio /) phenotype of offsprings depends on the genotype of parents.
Sample answer: Phenotype is black fur and white fur in rabbits. It is determined by the pairing of black buttons and white button as the genotype. The phenotype of offsprings depends on the genotype of parents.
1(g) Able to predict the number and the phenotypic ratio of the offsprings when the experiment is repeated by crossing the same parents in a surounding with more food supply, and explain the prediction based on three criteria.
• C1 Prediction: Any number more than 24 // More than 24. (More, idea level only)3 black : 1 white (If 3:1, idea level only)(Either number or ratio, idea level only)
• C2 Explanation 1: Higher growth rate // Grow faster // higher breeding rate.The parents are very reproductive.
• C3 Explanation 2: Black is dominant trait/allele/gene // White is recessive trait/allele/gene// The chance / probability of black fur is higher.

92
Sample answer: 1 30 offsprings. Ratio 3 black : 1 white. The rabbits grow faster. Black is dominant
trait. 2 More than 24 offsprings, 3 black : 1 white. The parents are very reproductive.
The chance of black fur is higher.
1(i) Able to classify the characteristics and traits into three categories correctly, and in the correct rows. C1: Characteristic C2: Dominant trait C3: Recessive trait Sample answer:
Characteristics Dominant trait Recessive trait
Blood group Blood group A Blood group O
Height Tall Short
Eye iris color Brown iris Blue iris
Type of hair Curly hair Straight hair

93
CHAPTER 6
Question 1
1(a) Able to record all 4 readings for the number of students with different patterns of thumbprint
Pattern of thumbprint No. of students
Whorl 6
Loop 8
Composite 16
Arch 5
1 (b)(i) Able to state two correct observations based on the following aspect :
• P1 : Types of pattern of thumbprint
• P2 : No of students
Sample answer 1 For the patterns of thumbprint composite, the no of students is 16. 2 For the patterns of thumbprint arch, the no of students is 5. 3 The no of students for the pattern of thumbprint composite is more than pattern
of thumbprint whorl, loop and arch// vice versa
1(b)(ii) Able to state two inferences correctly based on the following aspect:
• P1 : dominant/recessive
• P2 : percentage of students high//more/low//less
Sample answers: 1. The pattern of thumbprint composite is dominant. The percentage of students is
high//more 2. The pattern of thumbprint arch is recessive. The percentage of students is
low//less
1(c) Able to state all 3 variables and the 3 methods to handle the variable correctly. Sample Answer:
Variables Method to handle the variable correctly
Manipulated variable Pattern of thumbprint
Use different pattern of thumbprint (which is whorl,loop, composite,arch)
Responding variable No of students Percentage of students
Record the no of students (for each pattern of thumbprint) Calculate the percentage of students by using the formula:

94
𝑃𝑎𝑡𝑡𝑒𝑟𝑛𝑠 𝑜𝑓 𝑡ℎ𝑢𝑚𝑏𝑝𝑟𝑖𝑛𝑡
𝑇𝑜𝑡𝑎𝑙 𝑛𝑜 𝑜𝑓 𝑠𝑡𝑢𝑑𝑒𝑛𝑡𝑠 𝑋100%
Constant variable Total no of students Types of variation Types of finger
Fix the same total no of students which is 35. Fix the same types of variation which is thumbprint. Fix the same types of finger which is thumb finger
1(d) Able to make a hypothesis based on the following aspect :
• P1 : Manipulated variable ; Pattern of thumbprint
• P2 : Responding variable ; No of students//Percentage of students
• R : Relationship Sample answers: The no of students//the percentage of students for patterns of thumbprint composite is more than whorl, loop and arch. And vice versa.
1(e)(i) Able to construct a table which contain the following aspects: P1: Able to state the 6 titles with units correctly. P2 : Able to record all data correctly. P3 : Able to calculate the TSA/V and the rate of diffusion Sample answer:
Patterns of thumbprint
No of students Percentage of students (%)
Whorl 6 17.14
Loop 8 22.86
Composite 16 45.71
Arch 5 14.29
1(e)(ii) Able to plot the graph correctly : Criteria:
• P : Correct Axis with label, uniform scale and unit (Y axis, Percentage of students;X axis, Pattern of thumbprint)
• T : All 4 bars drawn
• B : Bar graph
1(f) Able to state the types of variation and explain. Sample answer:
• R : Types of variation : Discontinous variation
• E1: Discrete distribution // no range values between the pattern of thumbprint.
• E2: Effected by genetic factors/ does not influenced//effected by environmental factor
1(g) Able to state the operational definition of discontinous variation based on the following aspects:
• P1 : distinct/clear different in characteristic
• P2 : determined by the no of students with different patterns of thumbprint

95
• P3 : discontinous variation affected by genetic factor
Sample answer Discontinuous variation is distinct/clear different in characteristic which determined by the no of students with different patterns of thumbprint. Discontinuous variation affected by genetic factor.
1(h) Able to predict using all the following criteria/aspects :
• P : Correct prediction – Normal distribution // Bell shape graph
• E1 : Reason - Continuous variation // no distinct/clear different
• E2 : Factors affecting – genetic and environment
Sample answer Normal distribution // bell shape graph because height is continuous variation // height have no distinct /clear different and it is affected by genetic and environmental factors.
1(i) Able to classify all the factors in table correctly:
Continuous variation Discontinuous variation
Nutrition Benzene
Experience X-ray
Standard of living Radioactive ray

96
Question 2 1(a) Able to record all 4 readings for the number of students with different patterns of
thumbprint
Glass house Duration tomato plant exposed to the light intensity
daily (hour)
Mass of 10 tomatoes (kg)
Average mass of each tomato (kg)
A 12 3 0.3
B 6 2 0.2
1 (b)(i) Able to state the correct observations based on the following criteria:
• P1: Glass house/Duration tomato plant exposed to the light intensity daily
• P2: Mass of 10 tomatoes/ Average mass of each tomato
Sample answer: 1 When the duration of tomato plant exposed to the light intensity Daily is12 hours
, the mass of 10 tomatoes is 3 kilograms. 2 When the duration of tomato plant exposed to the light intensity daily is 6 hours
, the mass of 10 tomatoes is 2 kilograms. 3 In Glass house A, average mass of each tomato is 0.3kg. 4 In Glass house B, average mass of each tomato is 0.2kg.
1(b)(ii) Able to state correct inference for each observation based on any two criterias:
• P1: time exposed to the light/light intensity
• P2: growth rate of tomato
• P3: causes variation on tomatoes
Sample answer: Inference 1: When time exposed to the light is long/light intensity is high, the growth rate of tomato is high//Light intensity is high, it causes variation on tomatoes. Inference 2: When time exposed to the light is short/light intensity is low, the growth rate of tomato is low//Light intensity is low, it causes variation on tomatoes
1(c) Able to state all 3 variables and the 3 methods to handle the variable correctly. Sample Answer:
Variables Method to handle the variable correctly
Manipulated variable Duration of tomato plant exposed to the light intensity daily//Glass
Used different duration of tomato plant exposed to the light intensity daily// Planted the tomato plants in different glass house.

97
house
Responding variable Mass of 10 tomatoes// Average mass of each tomato//growth rate of tomato
Record the mass of 10 tomatoes using compression balance//Calculate the average mass of each tomato using formula:
𝑚𝑎𝑠𝑠 𝑜𝑓 10 𝑡𝑜𝑚𝑎𝑡𝑜𝑒𝑠
10
or Calculate the growth rate of tomato using formula:
𝑚𝑎𝑠𝑠 𝑜𝑓 10 𝑡𝑜𝑚𝑎𝑡𝑜𝑒𝑠
𝑡𝑖𝑚𝑒 𝑡𝑎𝑘𝑒𝑛 𝑓𝑜𝑟 𝑝𝑙𝑎𝑛𝑡𝑖𝑛𝑔
Constant variable Duration of planted//amount of water/minerals
Used same duration of planted tomato such as 4 months//fixed same amount of water/minerals.
1(d) Able to state all three criterias correctly based on :
• P1 : state the manipulated variable.
• P2 : state the responding variable
• R : relationship between P1 and P2 Sample answer:
1. The longer the duration tomato plant exposed to the light intensity (daily), the increase the mass of 10 tomatoes / the higher the growth rate of tomato.
2. Glass house A has the highest growth rate of tomato compare to glass house B.
1(e)(i) Able to construct a table and record all the data correctly based on : T: Title with correct units D: Correct data S: Correct growth rate of tomato Sample answer:
Glass house
Duration tomato plant exposed to the light intensity daily (hour)
Mass of 10 tomatoes (kg)
Growth rate of tomato (kg/months)
A 12 3 0.75
B 6 2 0.50
1(e)(ii) Able to plot the graph correctly : Criteria:
• P : Correct Axis with label, uniform scale and unit (Y axis, Percentage of students;X axis, Pattern of thumbprint)
• T : All 4 bars drawn
• B : Bar graph
1(e)(iii) Able to explain the relationship between the growth rate of tomato against duration of tomato plant exposed to the light intensity daily based on:

98
• P1: correct conclusion: The longer the duration of tomato plant exposed to the light intensity daily, the higher the growth rate of tomato.
• P2: more photosynthesis/more organic substances/glucose produced
• P3:causes mass of tomato increases/variation
Sample answer: The longer the duration of tomato plant exposed to the light intensity daily, the higher the growth rate of tomato because more organic substance is produced causes variation between the tomatoes.
1(g) Able to predict the mass of 10 tomatoes that will be provided when exposed the tomato plant to the light intensity for 4 hours daily correctly based on :
• P1: Mass of 10 tomatoes less than 2kg
• P2: less photosynthesis/less organic substance/glucose produced
• P3: causes growth rate of tomato decrease
Sample answer: Mass of 10 tomatoes less than 2 kg because less photosynthesis causes growth rate of tomato decrease
1(h) Able to define continuous variation operationally based on :
• P1: Differences between the tomato plants that have same genetic
• P2: Shown by the mass of 10 tomatoes
• P3: Growth rate of tomato is affected by the duration of tomato plant exposed to the light intensity daily/glass house
Sample answer: Continues variation is the differences between the tomato plants that have same genetic and can be shown by the mass of 10 tomatoes. Growth rate of tomato is affected by the duration of tomato plant exposed to the light intensity daily/glass house
1(i) Able to classify all the factors in table correctly:
Variables Apparatus Material
Manipulated Light bulb Tomato plant
Responding Compression balance Tomato
Controlled Calendar Tomato fertiliser