Embed Size (px)
Citation preview
Chapter 2 - Reviewing Financial Statements
2-1
CHAPTER 2 – REVIEWING FINANCIAL STATEMENTS
questions
LG2-1 1. List and describe the four major financial statements.
The four basic financial statements are: 1. The balance sheet reports a firm’s assets, liabilities, and equity at a particular point in time. 2. The income statement shows the total revenues that a firm earns and the total expenses the firm incurs to generate those revenues over a specific period of time—generally one year. 3. The statement of cash flows shows the firm’s cash flows over a given period of time. This statement reports the amounts of cash the firm generated and distributed during a particular time period. The bottom line on the statement of cash flows―the difference between cash sources and uses―equals the change in cash and marketable securities on the firm’s balance sheet from the previous year’s balance. 4. The statement of retained earnings provides additional details about changes in retained earnings during a reporting period. This financial statement reconciles net income earned during a given period minus any cash dividends paid within that period to the change in retained earnings between the beginning and ending of the period.
LG2-1 2. On which of the four major financial statements (balance sheet, income statement, statement of cash flows, or statement of retained earnings) would you find the following items?
a. earnings before taxes - income statement b. net plant and equipment - balance sheet c. increase in fixed assets - statement of cash flows d. gross profits - income statement e. balance of retained earnings, December 31, 20xx - statement of retained earnings and balance sheet f. common stock and paid-in surplus - balance sheet g. net cash flow from investing activities - statement of cash flows h. accrued wages and taxes – balance sheet i. increase in inventory - statement of cash flows
LG2-1 3. What is the difference between current liabilities and long-term debt?
Current liabilities constitute the firm’s obligations due within one year, including accrued wages and taxes, accounts payable, and notes payable. Long-term debt includes long-term loans and bonds with maturities of more than one year.
LG2-1 4. How does the choice of accounting method used to record fixed asset depreciation affect management of the balance sheet?
Firm managers can choose the accounting method they use to record depreciation against their fixed assets. Two choices include the straight-line method and the modified accelerated cost recovery system (MACRS). Companies often calculate depreciation using MACRS when they figure the firm’s taxes and the straight-line method when reporting income to the firm’s
Finance Applications and Theory 4th Edition Cornett Solutions ManualFull Download: http://testbanklive.com/download/finance-applications-and-theory-4th-edition-cornett-solutions-manual/
Full download all chapters instantly please go to Solutions Manual, Test Bank site: testbanklive.com

Chapter 2 - Reviewing Financial Statements
2-2
stockholders. The MACRS method accelerates deprecation, which results in higher deprecation expenses, lower taxable income, and lower taxes in the early years of a project’s life. The straight-line method results in lower depreciation expenses, but also results in higher taxes in the early years of a project’s life. Firms seeking to lower their cash outflows from tax payments will favor the MACRS depreciation method.
LG2-1 5. What are the costs and benefits of holding liquid securities on a firm’s balance sheet?
The more liquid assets a firm holds, the less likely the firm will be to experience financial distress. However, liquid assets generate little or no profits for a firm. For example, cash is the most liquid of all assets, but it earns little, if any, return for the firm. In contrast, fixed assets are illiquid, but provide the means to generate revenue. Thus, managers must consider the trade-off between the advantages of liquidity on the balance sheet and the disadvantages of having money sit idle rather than generating profits.
LG2-2 6. Why can the book value and market value of a firm differ?
A firm’s balance sheet shows its book (or historical cost) value based on Generally Accepted Accounting Principles (GAAP). Under GAAP, assets appear on the balance sheet at what the firm paid for them, regardless of what assets might be worth today if the firm were to sell them. Inflation and market forces make many assets worth more now than they were when the firm bought them. So in most cases, book values differ widely from the market values for the same assets—the amount that the assets would fetch if the firm actually sold them. For the firm’s current assets—those that mature within a year―the book value and market value of any particular asset will remain very close. For example, the balance sheet lists cash and marketable securities at their market value. Similarly, firms acquire accounts receivable and inventory and then convert these short-term assets into cash fairly quickly, so the book value of these assets is generally close to their market value.
LG2-2 7. From a firm manager’s or investor’s point of view, which is more important―the book value of a firm or the market value of the firm?
Balance sheet assets are listed at historical cost. Managers would thus see little relation between the total asset value listed on the balance sheet and the current market value of the firm’s assets. Similarly, the stockowners’ equity listed on the balance sheet generally differs from the true market value of the equity—in this case, the market value may be higher or lower than the value listed on the firm’s accounting books. So financial managers and investors often find that balance sheet values are not always the most relevant numbers.
LG2-3 8. What do we mean by a progressive tax structure?
The U.S. tax structure is progressive, meaning that the larger the income, the higher the taxes assessed. However, corporate tax rates do not increase in any kind of linear way based on this progressive nature: They rise from a low of 15 percent to a high of 39 percent, then drop to 34 percent, rise to 38 percent, and finally drop to 35 percent.

Chapter 2 - Reviewing Financial Statements
2-3
LG2-3 9. What is the difference between an average tax rate and a marginal tax rate?
You can figure the average tax rate as the percentage of each dollar of taxable income that the firm pays in taxes. From your economics classes, you can probably guess that the firm’s marginal tax rate is the amount of additional taxes a firm must pay out for every additional dollar of taxable income it earns.
LG2-3 10. How does the payment of interest on debt affect the amount of taxes the firm must pay?
Corporate interest payments appear on the balance sheet as an expense item, so we deduct interest payments from operating income when the firm calculates taxable income. But, any dividends paid by corporations to their shareholders are not tax deductible. This is one factor that encourages managers to finance projects with debt financing rather than to sell more stock. Suppose one firm uses mainly debt financing and another firm, with identical operations, uses mainly equity financing. The equity-financed firm will have very little interest expense to deduct for tax purposes. Thus, it will have higher taxable income and pay more taxes than the debt-financed firm. The debt-financed firm will pay fewer taxes and be able to pay more of its operating income to asset funders, i.e., its bondholders and stockholders. So even stockholders prefer that firms finance assets primarily with debt rather than with stock.
LG2-4 11. The income statement is prepared using GAAP. How does this affect the reported revenue and expense measures listed on the balance sheet?
Company accountants must prepare firm income statements following GAAP principles. GAAP procedures require that the firm recognize revenue at the time of sale, but sometimes the company receives the cash before or after the time of sale. Likewise, GAAP counsels the firm to show production and other expenses on the balance sheet as the sales of those goods take place. So production and other expenses associated with a particular product’s sale only appear on the income statement (for example, cost of goods sold and depreciation) when that product sells. Of course, just as with the revenue recognition, actual cash outflows incurred with production may occur at a very different point in time—usually much earlier than GAAP principles allow the firm to formally recognize the expenses. Further, income statements contain several non-cash entries, the largest of which is depreciation. Depreciation attempts to capture the non-cash expense incurred as fixed assets deteriorate from the time of purchase to the point when those assets must be replaced. Let’s illustrate the effect of depreciation: Suppose a firm purchases a machine for $100,000. The machine has an expected life of five years and at the end of those five years, the machine will have no expected salvage value. The firm lays out a $100,000 cash outflow at the time of purchase. But the entire $100,000 does not appear on the income statement in the year that the firm purchases the machine—in accounting terms, the machine is not expensed in the year of purchase. Rather, if the firm’s accounting department uses the straight-line depreciation method, it deducts only $100,000/5, or $20,000, each year as an expense. This $20,000 equipment expense is not a cash outflow for the firm. The person in charge of buying the machine knows that the cash flow occurred at the time of purchase—and it totaled $100,000 rather than $20,000. So, figures shown on an income statement may not represent the actual cash inflows and outflows for a firm during a particular period.

Chapter 2 - Reviewing Financial Statements
2-4
LG2-4 12. Why do financial managers and investors find cash flows to be more important than accounting profit?
Financial managers and investors are far more interested in actual cash flows than they are in the somewhat artificial, backward-looking accounting profit listed on the income statement. This is a very important distinction between the accounting point of view and the finance point of view. Finance professionals know that the firm needs cash, not accounting profit, to pay the firm’s obligations as they come due, to fund the firm’s operations and growth, and to compensate the firm’s ultimate owners: its shareholders. Thus, the statement of cash flows is a financial statement that shows the firm’s cash flows over a given period of time. This statement reports the amounts of cash that the firm generated and distributed during a particular time period.
LG2-5 13. Which of the following activities result in an increase (decrease) in a firm’s cash?
a. Decrease fixed assets – increase in cash b. Decrease accounts payable - decrease in cash c. Pay dividends - decrease in cash d. Sell common stock – increase in cash e. Decrease accounts receivable - increase in cash f. Increase notes payable – increase in cash
LG2-5 14. What is the difference between cash flows from operating activities, cash flows from investing activities, and cash flows from financing activities?
Cash flows from operations are those cash inflows and outflows that result directly from producing and selling the firm’s products. These cash flows include: net income, depreciation, and working capital accounts other than cash and operations-related short-term debt. Cash flows from investing activities are cash flows associated with buying or selling of fixed or other long-term assets. This section of the statement of cash flows shows cash inflows and outflows from long-term investing activities—most significantly the firm’s investment in fixed assets. Cash flows from financing activities are cash flows that result from debt and equity financing transactions. These include raising cash by: issuing short-term debt, issuing long-tern debt, issuing stock, using cash to pay dividends, using cash to pay off debt, and using cash to buy back stock.
LG2-5 15. What are free cash flows for a firm? What does it mean when a firm’s free cash flow is negative?
Free cash flows are the cash flows available to pay the firm’s stockholders and debtholders after the firm has made the necessary working capital investments, fixed asset investments, and developed the necessary new products to sustain the firm’s ongoing operations. If free cash flow is negative, the firm's operations produce no cash flows available for investors.

Chapter 2 - Reviewing Financial Statements
2-5
LG2-6 16. What is earnings management?
Managers and financial analysts have recognized for years that firms use considerable latitude in using accounting rules to manage their reported earnings in a wide variety of contexts. Indeed, within the GAAP framework, firms can “smooth” earnings. That is, firms often take steps to over- or understate earnings at various times. Managers may choose to smooth earnings to show investors that firm assets are growing steadily. Similarly, one firm may be using straight-line depreciation for its fixed assets, while another is using a modified accelerated cost recovery method (MACRS), which causes depreciation to accrue quickly. If the firm uses MACRS accounting methods, its managers write fixed asset values down quickly; assets will thus have lower book value than if the firm used straight line depreciation methods. This process of controlling a firm’s earnings is called earnings management.
LG2-6 17. What does the Sarbanes-Oxley Act require of firm managers?
The Sarbanes-Oxley Act, passed in June 2002, requires public companies to ensure that their corporate boards’ audit committees have considerable experience applying generally accepted accounting principles (GAAP) for financial statements. The Act also requires that any firm’s senior management must sign off on the financial statements of the firm, certifying the statements as accurate and representative of the firm’s financial condition during the period covered. If a firm’s board of directors or senior managers fails to comply with Sarbanes-Oxley (SOX), the firm may be delisted from stock exchanges.
problems
basic 2-1 Balance Sheet You are evaluating the balance sheet for Goodman’s Bees Corporation. problems From the balance sheet you find the following balances: cash and marketable securities = LG2-1 $400,000, accounts receivable = $1,200,000, inventory = $2,100,000, accrued wages and taxes =
$500,000, accounts payable = $800,000, and notes payable = $600,000. Calculate Goodman Bees’ net working capital.
Net working capital = Current assets - Current liabilities. Goodman’s Bees’ current assets =
Cash and marketable securities = $400,000 Accounts receivable = 1,200,000 Inventory = 2,100,000 Total current assets $3,700,000
and current liabilities =
Accrued wages and taxes = $500,000 Accounts payable = 800,000 Notes payable = 600,000 Total current liabilities $1,900,000
So the firm’s net working capital was $1,800,000 ($3,700,000 - $1,900,000).
Chapter 2 - Reviewing Financial Statements
2-6
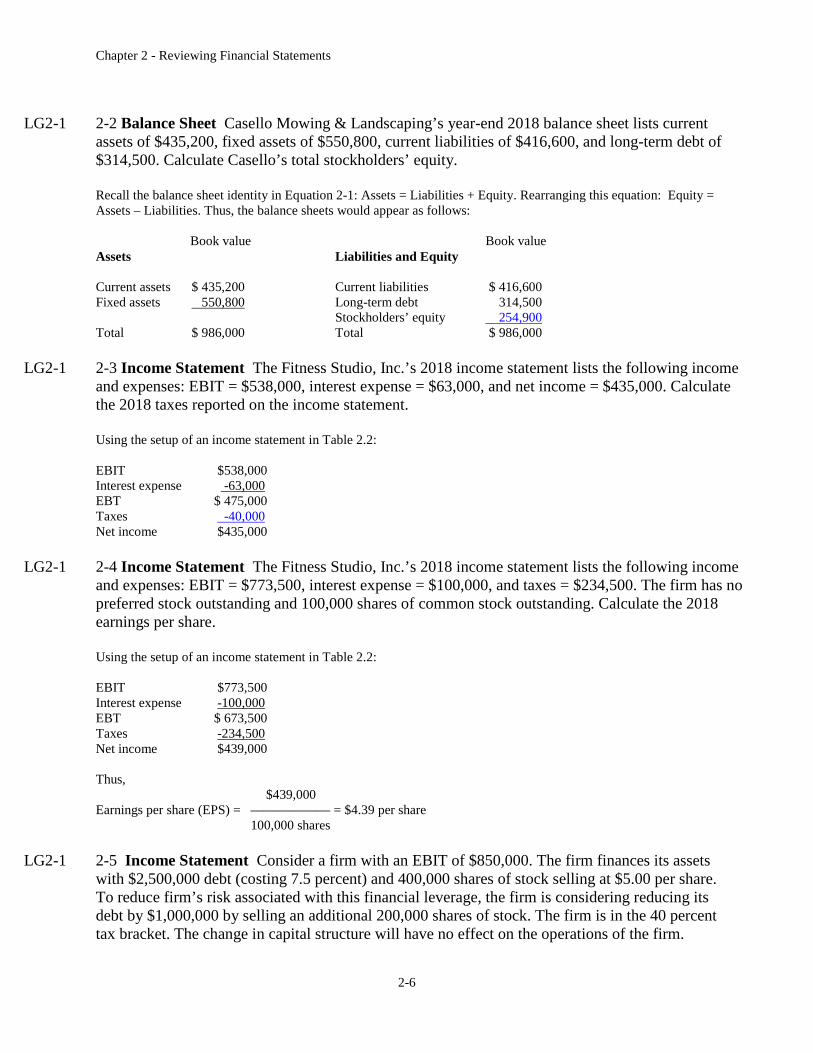
LG2-1 2-2 Balance Sheet Casello Mowing & Landscaping’s year-end 2018 balance sheet lists current assets of $435,200, fixed assets of $550,800, current liabilities of $416,600, and long-term debt of $314,500. Calculate Casello’s total stockholders’ equity.
Recall the balance sheet identity in Equation 2-1: Assets = Liabilities + Equity. Rearranging this equation: Equity = Assets – Liabilities. Thus, the balance sheets would appear as follows:
Book value Book value Assets Liabilities and Equity
Current assets $ 435,200 Current liabilities $ 416,600 Fixed assets 550,800 Long-term debt 314,500
Stockholders’ equity 254,900 Total $ 986,000 Total $ 986,000
LG2-1 2-3 Income Statement The Fitness Studio, Inc.’s 2018 income statement lists the following income and expenses: EBIT = $538,000, interest expense = $63,000, and net income = $435,000. Calculate the 2018 taxes reported on the income statement.
Using the setup of an income statement in Table 2.2:
EBIT $538,000 Interest expense -63,000 EBT $ 475,000 Taxes -40,000 Net income $435,000
LG2-1 2-4 Income Statement The Fitness Studio, Inc.’s 2018 income statement lists the following income and expenses: EBIT = $773,500, interest expense = $100,000, and taxes = $234,500. The firm has no preferred stock outstanding and 100,000 shares of common stock outstanding. Calculate the 2018 earnings per share.
Using the setup of an income statement in Table 2.2:
EBIT $773,500 Interest expense -100,000 EBT $ 673,500 Taxes -234,500Net income $439,000
Thus, $439,000
Earnings per share (EPS) = —————— = $4.39 per share 100,000 shares
LG2-1 2-5 Income Statement Consider a firm with an EBIT of $850,000. The firm finances its assets with $2,500,000 debt (costing 7.5 percent) and 400,000 shares of stock selling at $5.00 per share. To reduce firm’s risk associated with this financial leverage, the firm is considering reducing its debt by $1,000,000 by selling an additional 200,000 shares of stock. The firm is in the 40 percent tax bracket. The change in capital structure will have no effect on the operations of the firm.

Chapter 2 - Reviewing Financial Statements
2-7
Thus, EBIT will remain at $850,000. Calculate the change in the firm’s EPS from this change in capital structure.
The EPS before and after this change in capital structure is illustrated below:
Before capital structure change After capital structure change EBIT $850,000 $850,000 Less: Interest ($2,500,000 x 0.075) 187,500 ($1,500,000 x 0.075) 112,500 EBT 662,500 737,500 Less: Taxes (40%) 265,000 295,000 Net income $397,500 $442,500 Divide by # of shares 400,000 600,000 EPS $0.99375 $0.7375
The change in capital structure would decrease the stockholders EPS by $0.25625.
LG2-1 2-6 Income Statement Consider a firm with an EBIT of $550,000. The firm finances its assets with $1,000,000 debt (costing 5.5 percent) and 200,000 shares of stock selling at $12.00 per share. The firm is considering increasing its debt by $900,000, using the proceeds to buy back 75,000 shares of stock. The firm is in the 40 percent tax bracket. The change in capital structure will have no effect on the operations of the firm. Thus, EBIT will remain at $550,000. Calculate the change in the firm’s EPS from this change in capital structure.
The EPS before and after this change in capital structure is illustrated below:
Before capital structure change After capital structure change EBIT $550,000 $550,000 Less: Interest ($1,000,000 x 0.055) 55,000 ($1,900,000 x 0.055) 104,500 EBT 495,000 445,500 Less: Taxes (40%) 198,000 178,200 Net income $297,000 $267,300 Divide by # of shares 200,000 125,000 EPS $1.485 $2.1384
The change in capital structure increases the stockholders EPS by $0.6534.
LG2-3 2-7 Corporate Taxes Oakdale Fashions, Inc., had $245,000 in 2018 taxable income. Using the tax schedule in Table 2.3, calculate the company’s 2018 income taxes. What is the average tax rate? What is the marginal tax rate?
From Table 2.3, the $245,000 of taxable income puts Oakdale Fashion, Inc. in the 39 percent tax bracket. Thus,
Tax liability = Tax on base amount + Tax rate (amount over base): = $22,250 + 0.39 ($245,000 - $100,000) = $78,800
Note that the base amount is the maximum dollar value listed in the previous tax bracket. The average tax rate for Oakdale Fashions Inc. comes to:
$78,800 Average tax rate = ———— = $78,800/$245,000 = 32.16%
$245,000
If Oakdale Fashions, Inc. earned $1 more of taxable income, it would pay 39 cents (its tax rate of 39 percent) more in taxes. Thus, the firm’s marginal tax rate is 39 percent.
Chapter 2 - Reviewing Financial Statements
2-8
LG2-3 2-8 Corporate Taxes Hunt Taxidermy, Inc., is concerned about the taxes paid by the company in 2018. In addition to $42.4 million of taxable income, the firm received $2,975,000 of interest on state-issued bonds and $1,000,000 of dividends on common stock it owns in Oakdale Fashions, Inc. Calculate Hunt Taxidermy’s tax liability, average tax rate, and marginal tax rate.
In this case, interest on the state-issued bonds is not taxable and should not be included in taxable income. Further, the first 70 percent of the dividends received from Hunt Taxidermy is not taxable. Thus, only 30 percent of the dividends received are taxed, so:
Taxable income = $42,400,000 + (0.3)$1,000,000 = $42,700,000
Now Hunt Taxidermy’s tax liability will be:
Tax liability = $6,416,667 + 0.35 ($42,700,000 - $18,333,333) = $14,945,000
The $1,000,000 of dividend income increased Hunt Taxidermy’s tax liability by $105,000 (.3 x $1,000,000 x .35). Hunt Taxidermy’s resulting average tax rate is:
Average tax rage = $14,945,000/$42,700,000 = 35.00%
Finally, if Hunt Taxidermy earned $1 more of taxable income, it would pay 35 cents (based upon its tax rate of 35 percent) more in taxes. Thus, the firm’s marginal tax rate is 35 percent.
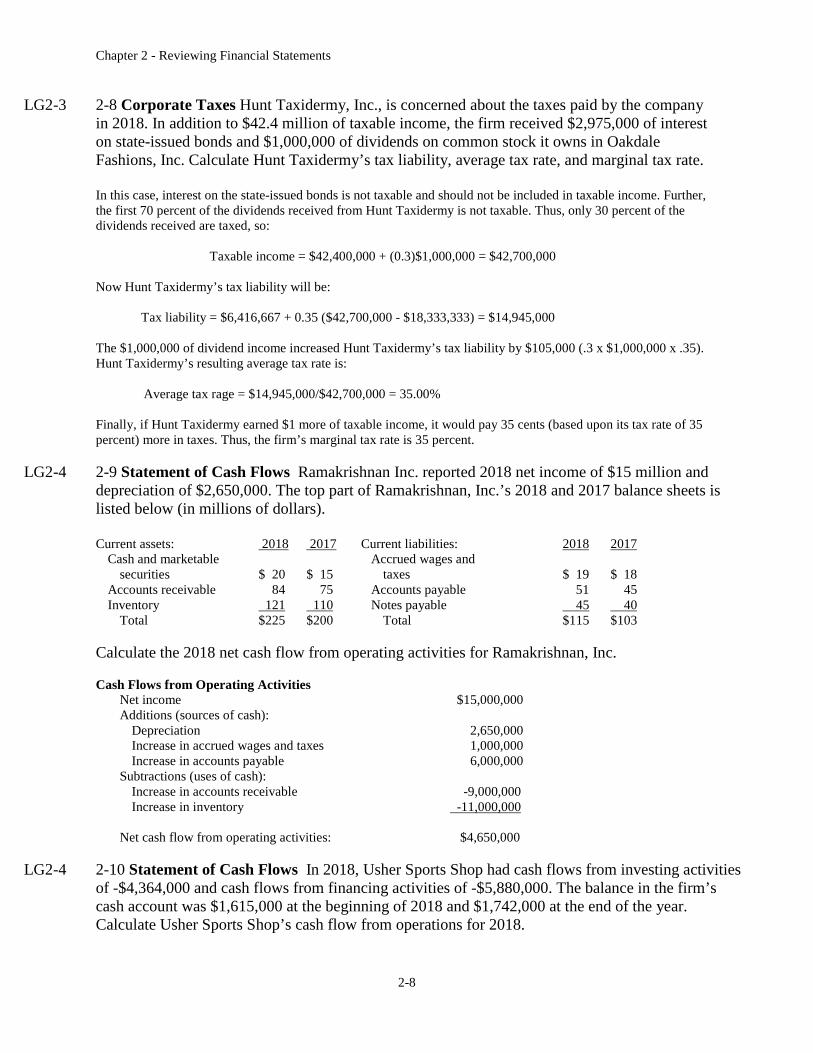
LG2-4 2-9 Statement of Cash Flows Ramakrishnan Inc. reported 2018 net income of $15 million and depreciation of $2,650,000. The top part of Ramakrishnan, Inc.’s 2018 and 2017 balance sheets is listed below (in millions of dollars).
Current assets: 2018 2017 Current liabilities: 2018 2017 Cash and marketable Accrued wages and
securities $ 20 $ 15 taxes $ 19 $ 18 Accounts receivable 84 75 Accounts payable 51 45 Inventory 121 110 Notes payable 45 40
Total $225 $200 Total $115 $103
Calculate the 2018 net cash flow from operating activities for Ramakrishnan, Inc.
Cash Flows from Operating Activities Net income $15,000,000 Additions (sources of cash): Depreciation 2,650,000 Increase in accrued wages and taxes 1,000,000 Increase in accounts payable 6,000,000 Subtractions (uses of cash): Increase in accounts receivable -9,000,000 Increase in inventory -11,000,000
Net cash flow from operating activities: $4,650,000
LG2-4 2-10 Statement of Cash Flows In 2018, Usher Sports Shop had cash flows from investing activities of -$4,364,000 and cash flows from financing activities of -$5,880,000. The balance in the firm’s cash account was $1,615,000 at the beginning of 2018 and $1,742,000 at the end of the year. Calculate Usher Sports Shop’s cash flow from operations for 2018.

Chapter 2 - Reviewing Financial Statements
2-9
Net change in cash and marketable securities = $1,742,000 - $1,615,000 = $127,000
Cash flows from operating activities = $10,371,000 Cash flows from investing activities = - 4,364,000 Cash flows from financing activities = - 5,880,000 Net change in cash and marketable securities = $127,000
LG2-5 2-11 Free Cash Flow You are considering an investment in Fields and Struthers, Inc., and want to evaluate the firm’s free cash flow. From the income statement, you see that Fields and Struthers earned an EBIT of $62 million, had a tax rate of 30 percent, and its depreciation expense was $5 million. Fields and Struthers’ gross fixed assets increased by $32 million from 2017 to 2018. The firm’s current assets increased by $20 million and spontaneous current liabilities increased by $12 million. Calculate Fields and Struthers’ NOPAT, operating cash flow, investment in operating capital, and free cash flow for 2018.
Fields and Struthers’ NOPAT was: NOPAT = EBIT(1 – Tax rate) = $62m.(1 – 0.30) = $43.4m.
Operating cash flow for 2018 was: OCF = NOPAT + Depreciation = $43.4m. + $5m. = $48.4m.
Investment in operating capital for 2018 was: IOC = ΔGross fixed assets + ΔNet operating working capital = $32m. + ($20m. - $12m.) = $40 m.
Accordingly, Fields and Struthers’ free cash flow for 2018 was: FCF = Operating cash flow – Investment in operating capital
= $48.4m. - $40m. = $8.4m.
In other words, in 2018, Fields and Struthers had cash flows of $8.4 million available to pay its stockholders and debtholders.
LG2-5 2-12 Free Cash Flow Tater and Pepper Corp. reported free cash flows for 2018 of $39.1 million and investment in operating capital of $22.1 million. Tater and Pepper incurred $13.6 million in depreciation expense and paid $28.9 million in taxes on EBIT in 2018. Calculate Tater and Pepper’s 2018 EBIT.
Tater and Pepper’s free cash flow for 2018 was: FCF = Operating cash flow – Investment in operating capital $39.1m. = Operating cash flow - $22.1m.
So, operating cash flow = $39.1m. + $22.1m. = $61.2m.
Tater and Pepper’s operating cash flow was: OCF = EBIT(1 – Tax rate) + Depreciation = EBIT – Taxes on EBIT + Depreciation $61.2m. = EBIT – $28.9m. + $13.6m.
So, EBIT = $61.2m. + $28.9m. - $13.6m. = $76.5m.
LG2-1 2-13 Statement of Retained Earnings Mr. Husker’s Tuxedos, Corp. began the year 2018 with $256 million in retained earnings. The firm earned net income of $33 million in 2018 and paid dividends of $5 million to its preferred stockholders and $10 million to its common stockholders. What is the year-end 2018 balance in retained earnings for Mr. Husker’s Tuxedos?

Chapter 2 - Reviewing Financial Statements
2-10
The statement of retained earnings for 2018 is as follows:
Balance of retained earnings, December 31, 2017 $256m. Plus: Net income for 2018 33m. Less: Cash dividends paid
Preferred stock $5m. Common stock 10m. Total cash dividends paid 15m.
Balance of retained earnings, December 31, 2018 $274m.
LG2-1 2-14 Statement of Retained Earnings Use the following information to find dividends paid to common stockholders during 2018.
Balance of retained earnings, December 31, 2017 $462m. Plus: Net income for 2018 15m. Less: Cash dividends paid
Preferred stock $1m. Common stock _6m.Total cash dividends paid 7m.
Balance of retained earnings, December 31, 2018 $470m.
Total cash dividends paid = $470m. - $15m. - $462m. = -$7m. Thus, common stock dividends paid = $7m. - $1m = $6m.
intermediate 2-15 Balance Sheet Brenda’s Bar and Grill has total assets of $15 million of which $5 million problems are current assets. Cash makes up 10 percent of the current assets and accounts receivable makes up
another 40 percent of current assets. Brenda’s gross plant and equipment has a book value of $11.5 million and other long-term assets have a book value of $500,000. Using this information, what is the
LG2-1 balance of inventory and the balance of depreciation on Brenda Bar and Grill’s balance sheet?
Current assets: (in millions) Cash and marketable securities $ 0.5 (0.1 x $5) Accounts receivable 2.0 (0.4 x $5) Inventory step 1. 2.5 ($5 - $0.5 - $2.0) Total $5.0
Fixed assets: Gross plant and equipment $11.5 Less: Depreciation step 4. 2.0 ($11.5 - $9.5)Net plant and equipment step 3. $9.5 ($10.0 - $0.5)Other long-term assets 0.5 Total step 2. $10.0 ($15.0 - $5.0)
Total assets $15.0
LG2-1 2-16 Balance Sheet Glen’s Tobacco Shop has total assets of $91.8 million. Fifty percent of these assets are financed with debt of which $28.9 million is current liabilities. The firm has no preferred

Chapter 2 - Reviewing Financial Statements
2-11
stock but the balance in common stock and paid-in surplus is $20.4 million. Using this information what is the balance for long-term debt and retained earnings on Glen’s Tobacco Shop’s balance sheet?
(in millions) Total current liabilities $28.9
Long-term debt: step 3. 17.0 (= $45.9 - $28.9) Total debt: step 2. $45.9 (= 0.5 x $91.8)
Stockholders’ equity: Preferred stock $ 0.0 Common stock and paid-in surplus 20.4 (20 million shares) Retained earnings step 5. 25.5 (= $45.9 - $20.4) Total step 4 $45.9 (= $91.8 - $45.9)
Total liabilities and equity step 1. $91.8 (= Total Assets)
LG2-2 2-17 Market Value versus Book Value Muffin’s Masonry, Inc’s balance sheet lists net fixed asset as $14 million. The fixed assets could currently be sold for $19 million. Muffin’s current balance sheet shows current liabilities of $5.5 million and net working capital of $4.5 million. If all the current accounts were liquidated today, the company would receive $7.25 million cash after paying the $5.5 million in current liabilities. What is the book value of Muffin’s Masonry’s assets today? What is the market value of these assets?
BOOK MARKET VALUE VALUE
AssetsCurrent assets Step 1. $10m. Step 3. $12.75m.Fixed assets 14m. 19.00m.
Total Step 2. $24m. Step 4. $31.75m.
Step 1. Net working capital (book value) = Current assets (book value) – Current liabilities (book value) = $4.5m. = Current assets (book value) - $5.5m. => Current assets (book value) = $4.5m. + $5.5m. = $10m. Step 2. Total assets (book value) = $10m. + $14m. = $24m.Step 3. Net working capital (market value) = Current assets (market value) – Current liabilities (market value) = $7.25m. = Current assets (market value) - $5.5m. => Current assets (market value) = $7.25m. + $5.5m. = $12.75m.Step 4. Total assets (market value) = $12.75m. + $19m. = $31.75m.
LG2-2 2-18 Market Value versus Book Value Ava’s SpinBall Corp. lists fixed assets of $12 million on its balance sheet. The firm’s fixed assets have recently been appraised at $16 million. Ava’s SpinBall Corp.’s balance sheet also lists current assets at $5 million. Current assets were appraised at $6 million. Current liabilities’ book and market values stand at $3 million and the firm’s book and market values of long-term debt are $7 million. Calculate the book and market values of the firm’s stockholders’ equity. Construct the book value and market value balance sheets for Ava’s SpinBall Corp. (LG2)
Recall the balance sheet identity in Equation 2-1: Assets = Liabilities + Equity. Rearranging this equation: Equity = Assets – Liabilities. Thus, the balance sheets would appear as follows:

Chapter 2 - Reviewing Financial Statements
2-12
BOOK MARKET BOOK MARKET VALUE VALUE VALUE VALUE
Assets Liabilities and Equity Current assets $ 5m. $ 6m. Current liabilities $ 3m. $ 3m. Fixed assets 12m. 16m. Long-term debt 7m. 7m.
Stockholders’ equity 7m. 12m. Total $17m. $22m. Total $17m. $22m.
LG2-1 2-19 Debt versus Equity Financing You are considering a stock investment in one of two firms (NoEquity, Inc., and NoDebt, Inc.), both of which operate in the same industry and have identical operating income of $32.5 million. NoEquity, Inc., finances its $65 million in assets with $64 million in debt (on which it pays 10 percent interest annually) and $1 million in equity. NoDebt, Inc., finances its $65 million in assets with no debt and $65 million in equity. Both firms pay a tax rate of 30 percent on their taxable income. Calculate the net income and return on assets for the two firms.
NoEquity NoDebt
Operating income $32.50m. $32.50m. Less: Interest ($64m. x 0.1) 6.40m. 0.00m. Taxable income $26.10m. $32.50m. Less: Taxes (30%) 7.83m. 9.75m. Net income $18.27m. $22.75m.
Return on assets $18.27m/$65m = 28.11% $22.75m/$65m = 35.00%
LG2-1 2-20 Debt versus Equity Financing You are considering a stock investment in one of two firms (AllDebt, Inc., and AllEquity, Inc.), both of which operate in the same industry and have identical operating income of $12.5 million. AllDebt, Inc., finances its $25 million in assets with $24 million in debt (on which it pays 10 percent interest annually) and $1 million in equity. AllEquity, Inc., finances its $25 million in assets with no debt and $25 million in equity. Both firms pay a tax rate of 30 percent on their taxable income. Calculate the income available to pay the asset funders (the debt holders and stockholders) and resulting return on assets for the two firms.
AllDebt AllEquity
Operating income $12.50m. $12.50m. Less: Interest ($24m. x 0.1) 2.40m. 0.00m. Taxable income $10.10m. $12.50m. Less: Taxes (30%) 3.03m. 3.75m. Net income $7.07m. $8.75m. Income available for asset funders $9.47m. $8.75m. (= Operating income - Taxes)
Return on assets $9.47m./$25m. = 37.88% $8.75m./$25m. = 35.00%
LG2-1 2-21 Income Statement You have been given the following information for Corky’s Bedding Corp.: a. Net sales = $11,250,000. b. Cost of goods sold = $7,500,000. c. Other operating expenses = $250,000. d. Addition to retained earnings = $1,000,000.

Chapter 2 - Reviewing Financial Statements
2-13
e. Dividends paid to preferred and common stockholders = $495,000. f. Interest expense = $850,000.
The firm’s tax rate is 35 percent. Calculate the depreciation expense for Corky’s Bedding Corp.
Net sales $11,250,000 Less: Cost of goods sold 7,500,000 Gross profits Step 4. $3,750,000
Less: Other operating expenses 250,000 Earnings before interest, taxes, depreciation, and amortization (EBITDA) Step 5. $3,500,000
Less: Depreciation Step 6. 350,000Earnings before interest and taxes (EBIT) Step 3. $3,150,000Less: Interest 850,000 Earnings before taxes (EBT) Step 2. $2,300,000Less: Taxes (35%) Net income Step 1. $1,495,000
Less: Common and preferred stock dividends $ 495,000 Addition to retained earnings $1,000,000
Step 1. Net income = Common and preferred stock dividends + Addition to retained earnings = $495,000 + $1,000,000 = $1,495,000Step 2. EBT (1 – Tax rate) = Net income => EBT = Net income/(1 – Tax rate) = $1,495,000/(1 - 0.35) = $2,300,000 Step 3. EBIT – Interest = EBT => EBIT = EBT + Interest = $2,300,000 + $850,000 = $3,150,000Step 4. Gross profits = Net sales – Cost of goods sold = $11,250,000 – 7,500,000 = $3,750,000Step 5. EBITDA = Gross profits – Other operating expenses = $3,750,000 – 250,000 = $3,500,000Step 6. EBITDA – Depreciation = EBIT => Depreciation = EBITDA – EBIT = $3,500,000 - $3,150,000 = $350,000
LG2-1 2-22 Income Statement You have been given the following information for Moore’s HoneyBee Corp.: a. Net sales = $32,000,000. b. Gross profits = $18,700,000. c. Other operating expenses = $2,500,000. d. Addition to retained earnings = $4,700,000. e. Dividends paid to preferred and common stockholders = $2,900,000. f. Depreciation expense = $2,800,000.
The firm’s tax rate is 35 percent. Calculate the cost of goods sold and the interest expense for Moore’s HoneyBee Corp.
Net sales $32,000,000 Less: Cost of goods sold Step 1. 13,300,000Gross profits $18,700,000
Less: Other operating expenses 2,500,000 Earnings before interest, taxes, depreciation, and amortization (EBITDA) Step 4. $16,200,000
Less: Depreciation 2,800,000 Earnings before interest and taxes (EBIT) Step 5. $13,400,000Less: Interest Step 6. 1,707,692Earnings before taxes (EBT) Step 3. $11,692,308Less: Taxes (35%) Net income Step 2. $ 7,600,000

Chapter 2 - Reviewing Financial Statements
2-14
Less: Common and preferred stock dividends $2,900,000 Addition to retained earnings $4,700,000
Step 1. Net sales - Cost of goods sold = Gross profits => Cost of goods sold = Net sales – Gross Profits = $32,000,000 – $18,700,000 = $13,300,000Step 2. Net income = Common and preferred stock dividends + Addition to retained earnings = $2,900,000 + $4,700,000 = $7,600,000Step 3. EBT (1 – Tax rate) = Net income => EBT = Net income/(1 – Tax rate) = $7,600,000/(1 - 0.35) = $11,692,308 Step 4. EBITDA = Gross profits – Other operating expenses = $18,700,000 – 2,500,000 = $16,200,000Step 5. EBITDA – Depreciation = EBIT = $16,200,000 - $2,800,000 = $13,400,000Step 6. EBIT – Interest = EBT => Interest = EBIT - EBT = $13,400,000 - $11,692,308 = $1,707,692
LG2-1 2-23 Income Statement Consider a firm with an EBIT of $1,000,000. The firm finances its assets with $4,500,000 debt (costing 8 percent) and 200,000 shares of stock selling at $16.00 per share. To reduce risk associated with this financial leverage, the firm is considering reducing its debt by $2,500,000 by selling additional shares of stock. The firm is in the 40 percent tax bracket. The change in capital structure will have no effect on the operations of the firm. Thus, EBIT will remain at $1,000,000. Calculate the change in the firm’s EPS from this change in capital structure.
Number of shares of stock that must be sold to raise $2,500,000: $2,500,000/$16 = 156,250
=> number of shares of stock outstanding after refinancing = 200,000 + 156,250 = 356,250
The EPS before and after this change in capital structure is illustrated below:
Before capital structure change After capital structure change EBIT $1,000,000 $1,000,000 Less: Interest ($4,500,000 x 0.08) 360,000 ($2,000,000 x 0.08) 160,000 EBT 640,000 840,000 Less: Taxes (40%) 256,000 336,000 Net income $384,000 $504,000 Divide by # of shares 200,000 356,250 EPS $1.92 $1.41
The change in capital structure will result in a decrease in the stockholders EPS by $0.50.
LG2-1 2-24 Income Statement Consider a firm with an EBIT of $10,500,000. The firm finances its assets with $50,000,000 debt (costing 6.5 percent) and 10,000,000 shares of stock selling at $10.00 per share. The firm is considering increasing its debt by $25,000,000, using the proceeds to buy back shares of stock. The firm is in the 40 percent tax bracket. The change in capital structure will have no effect on the operations of the firm. Thus, EBIT will remain at $10,500,000. Calculate the change in the firm’s EPS from this change in capital structure.
Number of shares of stock that can be repurchased with $25,000,000: $25,000,000/$10 = 2,500,000
=> number of shares of stock outstanding after refinancing = 10,000,000 – 2,500,000 = 7,500,000
The EPS before and after this change in capital structure is illustrated below:
Before capital structure change After capital structure change

Chapter 2 - Reviewing Financial Statements
2-15
EBIT $10,500,000 $10,500,000 Less: Interest ($50,000,000 x 0.065) 3,250,000 ($75,000,000 x 0.065) 4,875,000 EBT 7,250,000 5,625,000 Less: Taxes (40%) 2,900,000 2,250,000 Net income $4,350,000 $3,375,000 Divide by # of shares 10,000,000 7,500,000 EPS $0.435 $0.45
The change in capital structure increases the stockholders EPS by $0.015.
LG2-3 2-25 Corporate Taxes The Dakota Corporation had a 2018 taxable income of $33,365,000 from operations after all operating costs but before (1) interest charges of $8,500,000; (2) dividends received of $750,000; (3) dividends paid of $5,250,000; and (4) income taxes.
a. Use the tax schedule in Table 2.3 to calculate Dakota’s income tax liability.
The first 70 percent of the dividends received is not taxable. Thus, only 30 percent of the dividends received are taxed, so:
Taxable income = $33,365,000 - $8,500,000 + (0.3)$750,000 = $25,090,000 Now Dakota Corp.’s tax liability will be:
Tax liability = $6,416,667 + 0.35 ($25,090,000 - $18,333,333) = $8,781,500
b. What are Dakota’s average and marginal tax rates on taxable income?
Dakota Corp.’s average tax rate is: Average tax rate = $8,781,500/$25,090,000 = 35.00%
Finally, if Dakota Corp earned $1 more of taxable income, it would pay 35 cents (based on its tax rate of 35 percent) more in taxes. Thus, the marginal tax rate is 35 percent.
LG2-3 2-26 Corporate Taxes Suppose that in addition to $17.85 million of taxable income, Texas Taco, Inc., received $1,105,000 of interest on state-issued bonds and $760,000 of dividends on common stock it owns in ArizonaTaco, Inc.
a. Use the tax schedule in Table 2.3 to calculate Texas Taco’s income tax liability.
Interest on the state-issued bonds is not taxable and should not be included in taxable income. Further, the first 70 percent of the dividends received from ArizonaTaco is not taxable. Thus, only 30 percent of the dividends received are taxed, so:
Taxable income = $17,850,000 + (0.3)$760,000 = $18,078,000 Texas Taco’s tax liability will be:
Tax liability = $5,150,000 + 0.38 ($18,078,000 - $15,000,000) = $6,319,640
b. What are Texas Taco’s average and marginal tax rates on taxable income?
Texas Taco’s resulting average tax rate is: Average tax rate = $6,319,640/$18,078,000= 34.96%
Finally, if Texas Taco earned $1 more of taxable income, it would pay 38 cents (based upon its tax rate of 38 percent) more in taxes. Thus, the marginal tax rate is 38 percent.

Chapter 2 - Reviewing Financial Statements
2-16
LG2-5 2-27 Statement of Cash Flows Use the balance sheet and income statement below to construct a statement of cash flows for Clancy’s Dog Biscuit Corporation.
Clancy’s Dog Biscuit Corporation Balance Sheet as of December 31, 2018 and 2017
(in millions of dollars) 2018 2017 2018 2017
Assets Liabilities and Equity Current assets: Current liabilities : Cash and marketable Accrued wages and securities $ 5 $ 5 taxes $ 10 $ 6 Accounts receivable 20 19 Accounts payable 16 15 Inventory 36 29 Notes payable 14 13 Total $ 61 $ 53 Total $ 40 $ 34
Fixed assets: Long-term debt: $ 57 $ 53 Gross plant and equipment $106 $ 88 Less: Accumulated Stockholders’ equity: depreciation 15 11 Preferred stock (2 million shares) $ 2 $ 2 Net plant and Common stock and equipment $ 91 $ 77 paid-in surplus 11 11 Other long-term (5 million shares) assets 15 15 Retained earnings 57 45 Total $106 $ 92 Total $ 70 $ 58
Total assets $167 $145 Total liabilities and equity $167 $145
Clancy’s Dog Biscuit Corporation Income Statement for Years Ending December 31, 2018 and 2017
(in millions of dollars) 2018 2017
Net sales $ 76 $ 80 Less: Cost of goods sold 38 34 Gross profits $ 38 $ 46 Less: Other operating expenses 6 5 Earnings before interest, taxes, depreciation, and amortization (EBITDA) $ 32 $ 41 Less: Depreciation 4 4 Earnings before interest and taxes (EBIT) $ 28 $ 37 Less: Interest 5 5 Earnings before taxes (EBT) $ 23 $ 32 Less: Taxes 7 10 Net income $16 $22
Less: Preferred stock dividends $ 1 $ 1 Net income available to common stockholders $15 $21 Less: Common stock dividends 3 3 Addition to retained earnings $12 $18
Per (common) share data: Earnings per share (EPS) $3.00 $4.20

Chapter 2 - Reviewing Financial Statements
2-17
Dividends per share (DPS) $0.60 $0.60 Book value per share (BVPS) $13.60 $11.20 Market value (price) per share (MVPS) $14.25 $14.60
SOLUTION: Statement of Cash Flows for Year Ending December 31, 2018 (in millions of dollars)
2018 A. Cash flows from operating activities Net income $16 Additions (sources of cash): Depreciation 4 Increase accrued wages and taxes 4 Increase in accounts payable 1 Subtractions (uses of cash): Increase in accounts receivable -1 Increase in inventory -7
Net cash flow from operating activities: $17
B. Cash flows from investing activities Subtractions: Increase fixed assets -$18 Increase in other long-term assets 0
Net cash flow from investing activities: -$18
C. Cash flows from financing activities Additions: Increase in notes payable $ 1 Increase in long-term debt 4 Increase in common and preferred stock 0 Subtractions: Preferred stock dividends -1 Common stock dividends -3
Net cash flow from financing activities: $1
D. Net change in cash and marketable securities -$ 0
LG2-5 2-28 Statement of Cash Flows Use the balance sheet and income statement below to construct a statement of cash flows for Valium’s Medical Supply Corporation.
Valium’s Medical Supply Corporation Balance Sheet as of December 31, 2018 and 2017
(in thousands of dollars) 2018 2017 2018 2017
Assets Liabilities and Equity Current assets: Current liabilities : Cash and marketable Accrued wages and securities $ 74 $ 73 taxes $ 58 $ 45 Accounts receivable 199 189 Accounts payable 159 145 Inventory 322 291 Notes payable 131 131 Total $ 595 $ 553 Total $ 348 $ 321

Chapter 2 - Reviewing Financial Statements
2-18
Fixed assets: Long-term debt: $ 565 $549 Gross plant and equipment $1,084 $ 886 Less: Accumulated Stockholders’ equity: depreciation 153 116 Preferred stock (6 thousand shares) $ 6 $ 6 Net plant and Common stock and equipment $ 931 $ 770 paid-in surplus 120 120 Other long-term (100 thousand shares) assets 130 130 Retained earnings 617 457 Total $1,061 $ 900 Total $ 743 $ 583
Total assets $1,656 $1,453 Total liabilities and equity $1,656 $1,453
Valium’s Medical Supply Corporation Income Statement for Years Ending December 31, 2018 and 2017
(in thousands of dollars) 2018 2017
Net sales $ 888 $ 798 Less: Cost of goods sold 387 350 Gross profits $ 501 $ 448 Less: Other operating expenses 48 42 Earnings before interest, taxes, depreciation, and amortization (EBITDA) $ 453 $ 406 Less: Depreciation and amortization 37 35 Earnings before interest and taxes (EBIT) $ 416 $ 371 Less: Interest 46 40 Earnings before taxes (EBT) $ 370 $ 331 Less: Taxes 129 112 Net income $ 241 $ 219
Less: Preferred stock dividends $ 6 $ 6 Net income available to common stockholders $ 235 $ 213 Less: Common stock dividends 75 75 Addition to retained earnings $ 160 $ 138
Per (common) share data: Earnings per share (EPS) $2.35 $2.13 Dividends per share (DPS) $0.75 $0.75 Book value per share (BVPS) $7.37 $5.77 Market value (price) per share (MVPS) $8.40 $6.25
SOLUTION: Statement of Cash Flows for Year Ending December 31, 2018 (in thousands of dollars)
A. Cash flows from operating activities Net income $241 Additions (sources of cash): Depreciation and amortization 37 Increase in accrued wages and taxes 13 Increase in accounts payable 14 Subtractions (uses of cash): Increase in accounts receivable -10

Chapter 2 - Reviewing Financial Statements
2-19
Increase in inventory -31
Net cash flow from operating activities: $264
B. Cash flows from investing activities Subtractions: Increase in fixed assets -$198 Increase in other long-term assets 0
Net cash flow from investing activities: -$198
C. Cash flows from financing activities Additions: Increase in notes payable $ 0 Increase in long-term debt 16 Increase in common and preferred stock 0 Subtractions: Preferred stock dividends - 6 Common stock dividends -75
Net cash flow from financing activities: -$65
D. Net change in cash and marketable securities $ 1
LG2-5 2-29 Statement of Cash Flows Chris’ Outdoor Furniture, Inc., has net cash flows from operating activities for the last year of $340 million. The income statement shows that net income is $315 million and depreciation expense is $46 million. During the year, the change in inventory on the balance sheet was $38 million, change in accrued wages and taxes was $15 million and change in accounts payable was $20 million. At the beginning of the year the balance of accounts receivable was $50 million. Calculate the end-of-year balance for accounts receivable.
A. Cash flows from operating activities (in millions) Net income $315 Additions (sources of cash): Depreciation 46 Increase accrued wages and taxes 15 Increase in accounts payable 20 Subtractions (uses of cash): Increase in accounts receivable -18 (=$340 - $315 - $46 - $15 - $20 + $38) Increase in inventory -38
Net cash flow from operating activities: $340
End-of-year balance for accounts receivable = $50m. + $18m. = $68m.
LG2-5 2-30 Statement of Cash Flows Dogs 4 U Corporation has net cash flow from financing activities for the last year of $34 million. The company paid $178 million in dividends last year. During the year, the change in notes payable on the balance sheet was $39 million, and change in
common and preferred stock was $0. The end-of-year balance for long-term debt was $315 million. Calculate the beginning-of-year balance for long-term debt.

Chapter 2 - Reviewing Financial Statements
2-20
C. Cash flows from financing activities (in millions) Additions: Increase in notes payable $ 39 Increase in long-term debt 173 (=$34 + $178 - $39) Increase in common and preferred stock 0 Subtractions: Stock dividends -178
Net cash flow from financing activities: $34
Beginning-of-year balance for long-term debt = $315m. - $173m = $142m.
LG2-5 2-31 Free Cash Flow The 2018 income statement for Duffy’s Pest Control shows that depreciation expense was $197 million, EBIT was $494 million, and the tax rate was 30 percent. At the beginning of the year, the balance of gross fixed assets was $1,562 million and net operating working capital was $417 million. At the end of the year, gross fixed assets was $1,803 million. Duffy’s free cash flow for the year was $424 million. Calculate the end-of-year balance for net operating working capital.
Duffy’s Pest Control’s operating cash flow was: OCF = EBIT(1 – Tax rate) + Depreciation = ($494m.(1 - 0.30) + $197m.) = $542.8m.
Duffy’s Pest Control’s free cash flow for 2018 was: FCF = Operating cash flow – Investment in operating capital $424m. = $542.8m. - Investment in operating capital => Investment in operating capital = $542.8m. - $424m. = $118.8m.
Accordingly, investment in operating capital for 2018 was: IOC = ΔGross fixed assets + ΔNet operating working capital
$118.8m. = ($1,803m. - $1,562m.) + (Ending net operating working capital - $417m.) => Ending net operating working capital = $118.8m. - ($1,803m. - $1,562m.) + $417m. = $294.8m.
LG2-5 2-32 Free Cash Flow The 2018 income statement for Egyptian Noise Blasters shows that depreciation expense is $85 million, NOPAT is $246 million. At the end of the year, the balance of gross fixed assets was $655 million. The change in net operating working capital during the year was $73 million. Egyptian’s free cash flow for the year was $190 million. Calculate the beginning-of-year balance for gross fixed assets.
Egyptian Noise Blasters’ operating cash flow was: OCF = NOPAT + Depreciation = = ($246m. + $85m.) = $331m.
Egyptian Noise Blasters’ free cash flow for 2018 was: FCF = Operating cash flow – Investment in operating capital $190m. = $331m. - Investment in operating capital = > Investment in operating capital = $331m. - $190m. = $141m.
Accordingly, investment in operating capital for 2018 was:
IOC = ΔGross fixed assets + ΔNet operating working capital $141m. = ($655m. – Beginning of year gross fixed assets) + $73m.
=> Beginning of year gross fixed assets = $655m. - $141m. + $73m. = $587m.

Chapter 2 - Reviewing Financial Statements
2-21
LG2-1 2-33 Statement of Retained Earnings Thelma and Louie, Inc., started the year with a balance of retained earnings of $543 million and ended the year with retained earnings of $589 million. The company paid dividends of $35 million to the preferred stockholders and $88 million to common stockholders. Calculate Thelma and Louie’s net income for the year.
Statement of Retained Earnings as of December 31, 2018 (in millions of dollars)
Balance of retained earnings, December 31, 2017 $543 Plus: Net income for 2018 169 (= $589 + $123 - $543) Less: Cash dividends paid
Preferred stock $35 Common stock 88 Total cash dividends paid 123
Balance of retained earnings, December 31, 2018 $589
LG2-1 2-34 Statement of Retained Earnings Jamaica Tours, Inc., started the year with a balance of retained earnings of $1,780 million. The company reported net income for the year of $284 million and paid dividends of $17 million to the preferred stockholders and $59 million to common stockholders. Calculate Jamaica Tour’s end-of-year balance in retained earnings.
Statement of Retained Earnings as of December 31, 2018 (in millions of dollars)
Balance of retained earnings, December 31, 2017 $1,780 Plus: Net income for 2018 284 Less: Cash dividends paid
Preferred stock $17 Common stock 59 Total cash dividends paid 76
Balance of retained earnings, December 31, 2018 $1,988
advanced 2-35 Income Statement Listed below is the 2018 income statement for Tom and Sue Travels, Inc. problems
LG2-1
Tom and Sue Travels, Inc. Income Statement for Year Ending December 31, 2018
(in millions of dollars)
Net sales $16.500 Less: Cost of goods sold 7.100 Gross profits 9.400 Less: Other operating expenses 3.200 Earnings before interest, taxes, depreciation, and amortization (EBITDA) 6.200 Less: Depreciation 2.900 Earnings before interest and taxes (EBIT) 3.300 Less: Interest 0.950 Earnings before taxes (EBT) 2.350

Chapter 2 - Reviewing Financial Statements
2-22
Less: Taxes 0.705 Net income $ 1.645
The CEO of Tom and Sue’s wants the company to earn a net income of $2.250 million in 2019. Cost of goods sold is expected to be 60 percent of net sales, depreciation and other operating expenses are not expected to change, interest expense is expected to increase to $1.050 million, and the firm’s tax rate will be 30 percent. Calculate the net sales needed to produce net income of $2.250 million.
Tom and Sue Travels, Inc. Income Statement for Year Ending December 31, 2019
(in millions of dollars)
Net sales Step 5. $25.910Less: Cost of goods sold Step 6. 15.546Gross profits Step 4. 10.364Less: Other operating expenses 3.200 Earnings before interest, taxes, depreciation, and amortization (EBITDA) Step 3. 7.164 Less: Depreciation 2.900 Earnings before interest and taxes (EBIT) Step 2. 4.264Less: Interest 1.050 Earnings before taxes (EBT) Step 1. 3.214Less: Taxes Net income $ 2.250
Step 1. EBT (1-t) = Net income = $2.250m = EBT (1 - 0.3) => EBT = $2.250m./(1 - 0.3) = $3.214m. Step 2. EBIT = EBT + Interest = $3.214m. + $1.050m. = $4.264m. Step 3. EBITDA = EBIT + Depreciation = $4.264m. + $2.900m. = $7.164m Step 4. Gross profits = EBITDA + Other operating expenses = $7.164m. + $3.200m. = $10.364m Step 4. Net sales = Gross profits/(1-Cost of goods sold percent) = $10.364m./(1 - 0.6) = $25.910m. Step 5. Cost of goods sold = Net sales – Gross profits = $25.910m. - $10.364 = $15.546m.
LG2-1 2-36 Income Statement You have been given the following information for PattyCake’s Athletic Wear Corp. for the year 2018:
a. Net sales = $38,250,000. b. Cost of goods sold = $22,070,000. c. Other operating expenses = $5,300,000. d. Addition to retained earnings = $1,195,500. e. Dividends paid to preferred and common stockholders = $1,912,000. f. Interest expense = $1,785,000. g. The firm’s tax rate is 30 percent.
In 2019:
h. net sales are expected to increase by $9.75 million. i. Cost of goods sold is expected to be 60 percent of net sales. j. Depreciation and other operating expenses are expected to be the same as in 2018.

Chapter 2 - Reviewing Financial Statements
2-23
k. Interest expense is expected to be $2,004,286. l. The tax rate is expected to be 30 percent of EBT. m. Dividends paid to preferred and common stockholders will not change.
Calculate the addition to retained earnings expected in 2019.
Income Statement for Year Ending December 31, 2018 (in millions of dollars)
Net sales $38,250,000 Less: Cost of goods sold 22,070,000 Gross profits 16,180,000
Less: Other operating expenses 5,300,000 Earnings before interest, taxes, depreciation, and amortization (EBITDA) 10,880,000
Less: Depreciation $10,880,000 - $6,224,286 4,655,714Earnings before interest and taxes (EBIT) $4,439,286 + $1,785,000 6,224,286 Less: Interest 1,785,000 Earnings before taxes (EBT) $3,107,500 / (1 - 0.3) 4,439,286 Less: Taxes Net income $3,107,500
Less: Preferred and common stock dividends $1,912,000 Addition to retained earnings $1,195,500
Income Statement for Year Ending December 31, 2019 (in millions of dollars)
Net sales (all credit) $38,250,000 + $9,750,000 $48,000,000 Less: Cost of goods sold 0.6 x $48,000,000 28,800,000 Gross profits 19,200,000 Less: Other operating expenses 5,300,000 Earnings before interest, taxes, depreciation, and amortization (EBITDA) 13,900,000 Less: Depreciation 4,655,714 Earnings before interest and taxes (EBIT) 9,244,286 Less: Interest 2,004,286 Earnings before taxes (EBT) 7,240,000 Less: Taxes (30%) 2,172,000 Net income $5,068,000
Less: Preferred and common stock dividends $1,912,000 Addition to retained earnings $3,156,000
LG2-5 2-37 Free Cash Flow Rebecky’s Flowers 4U, Inc., had free cash flows during 2018 of $43 million, NOPAT of $85 million, and depreciation of $14 million. Using this information, fill in the blanks on Rebecky’s balance sheet below.
Rebecky’s operating cash flow for 2018 was: OCF = NOPAT + Depreciation = ($85m. + $14m.) = $99m.
Rebecky’s free cash flow was:

Chapter 2 - Reviewing Financial Statements
2-24
FCF = Operating cash flow – Investment in operating capital $43m. = $99m. - Investment in operating capital
So, Investment in operating capital = $99m. - $43m. = $56m.
IOC = ΔGross fixed assets + ΔNet operating working capital $56m. = ($333m. - $300m.) + ΔNet operating working capital => ΔNet operating working capital = $56m. - ($333m. - $300m.) = $23m.
ΔNet operating working capital = $23m. = ∆Current assets - ∆Current liabilities $23m. = ($221m. - $190m.) - ∆Current liabilities
=> ∆Current liabilities = ($221m. - $190m.) - $23m. = $8m. => 2018 Current liabilities = $110m. + $8m. = $118m.and 2018 Current liabilities = Accrued wages and taxes + Accounts payable + Notes payable
$118m. = $17m. + Accounts payable + $45m. => Accounts payable = $118m. - $17m. - $45m. = $56m. => Long-term debt = $550m. - $118m. - $237m. = $195m.
Rebecky’s Flowers 4U, Inc. Balance Sheet as of December 31, 2018 and 2017
(in millions of dollars)2018 2017 2018 2017
Assets Liabilities and Equity
Current assets: Current liabilities : Cash and marketable Accrued wages and securities $ 28 $ 25 taxes $ 17 $ 15 Accounts receivable 75 65 Accounts payable 56 50 Inventory 118 100 Notes payable 45 45 Total $221 $190 Total $118 $110
Fixed assets: Long-term debt: $195 $190 Gross plant and equipment $333 $300 Less: Accumulated Stockholders’ equity: depreciation 54 40 Preferred stock (5 million shares) $ 5 $ 5 Net plant and Common stock and equipment $279 $260 paid-in surplus 40 40 Other long-term (20 million shares) assets 50 50 Retained earnings 192 155 Total $329 $310 Total $237 $200
Total assets $550 $500 Total liabilities and equity $550 $500
LG2-5 2-38 Free Cash Flow Vinny’s Overhead Construction had free cash flow during 2018 of $25.4 million. The change in gross fixed assets on Vinny’s balance sheet during 2018 was $7.0 million and the change in net operating working capital was $8.4 million. Using this information, fill in the blanks on Vinny’s income statement below.
IOC = ΔGross fixed assets + ΔNet operating working capital => IOC = $7.0m. + $8.4m. = $15.4m.
FCF = Operating cash flow – Investment in operating capital => $25.4m. = OCF – $15.4m. => OCF = $25.4m. + $15.4m. = $40.8m.

Chapter 2 - Reviewing Financial Statements
2-25
OCF = EBIT(1 – Tax rate) + Depreciation Using the numbers below: $40.8m. = $43.4m. – ($43.4m x Tax rate) + $10.2m. => $43.4m. + $10.2m. - $40.8m. = $43.4m. x Tax rate => Tax rate = ($43.4m. + $10.2m. - $40.8m.)/$43.4m = 29.49%
Vinny’s Overhead Construction, Corp. Income Statement for Year Ending December 31, 2018
(in millions of dollars)
Net sales $ 182.10 Step 1. (= $66.00 + $116.10) Less: Cost of goods sold 116.10 Gross profits $ 66.00 Less: Other operating expenses 12.40 Earnings before interest, taxes, depreciation, and amortization (EBITDA) 53.60 Less: Depreciation 10.20 Earnings before interest and taxes (EBIT) $ 43.40 Step 2. (= $66.00 - $10.20 - $12.40) Less: Interest 4.20 Step 5. (= $43.40 - $39.20) Earnings before taxes (EBT) $ 39.20 Step 3. (= $27.64 / (1 – 0.2949) Less: Taxes (29.49% from above) 11.56 Step 4. (= $39.20 - $27.64) Net income $27.64
research it! Reviewing Financial Statements Go the web site of Wal-Mart Stores, Inc. at www.walmartstores.com and get the latest financial statements from the annual report using the following steps.
Go to Wal-Mart Stores, Inc.’s Web site at www.walmartstores.com. Click on Investors, then select Financial Information; next choose Annual Reports & Proxies; finally, click on the most recent date. This will bring the file onto your computer that contains the relevant data. Locate the total assets, total equity, net sales, net income, dividends paid, cash flows from operating activities, and cash flows from investing activities for the last two years. How have these items changed over the last two years?
SOLUTION: The solution will vary with the year annual report is accessed. However, the annual report for each year summarizes the financial information necessary to evaluate key information used by firm managers, who make financial decisions, and by investors, who decide whether or not to invest in the firm.

Chapter 2 - Reviewing Financial Statements
2-26
integrated mini-case: Working with Financial Statements
Shown below are partial financial statements for Garners’ Platoon Mental Health Care, Inc. Fill in the blanks on the four financial statements.
Garners’ Platoon Mental Health Care, Inc. Balance Sheet as of December 31, 2018 and 2017
(in millions of dollars)2018 2017 2018 2017
Assets Liabilities and Equity Current assets: Current liabilities : Cash and marketable Accrued wages and
securities $ 421 $____ taxes $ 316 $ 242
Accounts receivable ____ 1,020 Accounts payable 867 791
Inventory 1,760 1,581 Notes payable ____ 714
Total $3,290 $____ Total $2,055 $1,747
Fixed assets: Long-term debt: $3,090 $____ Gross plant and equipment $____ $4,743 Less: Accumulated Stockholders’ equity: depreciation 840 640 Preferred stock (30 million shares) $ 60 $ 60 Net plant and Common stock and equipment $4,972 $____ paid-in surplus 637 ___
Other long-term assets ____ 790 (200 million shares) Total $5,864 $4,893 Retained earnings 3,312 2,440
Total $4,009 $3,137 Total assets $____ $7,889
Total liabilities and equity $9,154 $7,889
Garners’ Platoon Mental Health Care, Inc. Income Statement for Years Ending December 31, 2018 and 2017
(in millions of dollars) 2 018 2017
Net sales $4,980 $ Less: Cost of goods sold 2,035 Gross profits $2,734 $2,313 Less: Other operating expenses 125 100 Earnings before interest, taxes, depreciation, and amortization (EBITDA) 2,609 2,213 Less: Depreciation 200 191 Earnings before interest and taxes (EBIT) $2,409 $ Less: Interest 285 Earnings before taxes (EBT) $2,094 $1,737 Less: Taxes _____ Net income $1,327 $1,105

Chapter 2 - Reviewing Financial Statements
2-27
Less: Preferred stock dividends $ 60 $ Net income available to common stockholders $1,267 $1,045 Less: Common stock dividends 395 395 Addition to retained earnings $ 872 $____
Per (common) share data: Earnings per share (EPS) $____ $____
Dividends per share (DPS) $____ $____
Book value per share (BVPS) $____ $____ Market value (price) per share (MVPS) $26.850 $22.500
Garners’ Platoon Mental Health Care, Inc. Statement of Cash Flows for Year Ending December 31, 2018
(in millions of dollars)
A. Cash flows from operating activities Net income $___ Additions (sources of cash): Depreciation ___ Increase in accrued wages and taxes ___ Increase in accounts payable ___ Subtractions (uses of cash): Increase in accounts receivable ___ Increase in inventory ___
Net cash flow from operating activities: $___
B. Cash flows from investing activities Subtractions: Increase in fixed assets $ ___ Increase in other long-term assets ___
Net cash flow from investing activities: $ ___
C. Cash flows from financing activities Additions: Increase in notes payable $___ Increase in long-term debt ___ Increase in common and preferred stock ___ Subtractions: Dividends ___
Net cash flow from financing activities: $___

Chapter 2 - Reviewing Financial Statements
2-28
D. Net change in cash and marketable securities $ 26
Garners’ Platoon Mental Health Care, Inc. Statement of Retained Earnings as of December 31, 2018
(in millions of dollars)
Balance of retained earnings, December 31, 2017 $2,440 Plus: Net income for 2018 _____ Less: Cash dividends paid
Preferred stock $____
Common stock _____
Total cash dividends paid _____
Balance of retained earnings, December 31, 2018 $____
SOLUTION:
Garners’ Platoon Mental Health Care, Inc. Balance Sheet as of December 31, 2018 and 2017
(in millions of dollars)2018 2017 2018 2017
Assets Liabilities and Equity
Current assets: Current liabilities : Cash and marketable Accrued wages and
securities $ 421 $_395 taxes $ 316 $ 242
Accounts receivable 1,109 1,020 Accounts payable 867 791
Inventory 1,760 1,581 Notes payable _872 714
Total $3,290 $2,996 Total $2,055 $1,747
Fixed assets: Long-term debt: $3,090 $3,005 Gross plant and equipment $5,812 $4,743 Less: Accumulated Stockholders’ equity: depreciation 840 640 Preferred stock (25 million shares) $ 60 $ 60 Net plant and Common stock and equipment $4,972 $4,103 paid-in surplus 637 637
Other long-term assets 892 790 (200 million shares) Total $5,864 $4,893 Retained earnings 3,312 2,440
Total $4,009 $3,137 Total assets $9,154 $7,889
Total liabilities and equity $9,154 $7,889
Garners’ Platoon Mental Health Care, Inc. Income Statement for Years Ending December 31, 2018 and 2017
(in millions of dollars)2018 2017
Net sales $4,980 $4,348
Less: Cost of goods sold 2,246 2,035 Gross profits $2,734 $2,313

Chapter 2 - Reviewing Financial Statements
2-29
Less: Other operating expenses 125 100 Earnings before interest, taxes, depreciation, and amortization (EBITDA) 2,609 2,213 Less: Depreciation 200 191 Earnings before interest and taxes (EBIT) $2,409 $ 2,022 Less: Interest 315 285 Earnings before taxes (EBT) $2,094 $1,737 Less: Taxes 767 632 Net income $1,327 $1,105
Less: Preferred stock dividends $ 60 $ 60 Net income available to common stockholders $1,267 $1,045 Less: Common stock dividends 395 395 Addition to retained earnings $ 872 $ 650
Per (common) share data: Earnings per share (EPS) $ 6.335 $ 5.225
Dividends per share (DPS) $ 1.975 $ 1.975
Book value per share (BVPS) $19.745 $15.385 Market value (price) per share (MVPS) $26.850 $22.500
Garners’ Platoon Mental Health Care, Inc. Statement of Cash Flows for Year Ending December 31, 2017
(in millions of dollars)
A. Cash flows from operating activities Net income $1,327 Additions (sources of cash): Depreciation 200
Increase in accrued wages and taxes 74
Increase in accounts payable 76 Subtractions (uses of cash): Increase in accounts receivable -89
Increase in inventory -179
Net cash flow from operating activities: $1,409
B. Cash flows from investing activities Subtractions: Increase in net fixed assets $-1,069
Increase in other long-term assets -102
Net cash flow from investing activities: $-1,171
C. Cash flows from financing activities Additions: Increase in notes payable $ 158
Increase in long-term debt 85
Increase in common and preferred stock 0 Subtractions: Dividends -455

Chapter 2 - Reviewing Financial Statements
2-30
Net cash flow from financing activities: $ -212
D. Net change in cash and marketable securities $ 26
Garners’ Platoon Mental Health Care, Inc. Statement of Retained Earnings as of December 31, 2018
(in millions of dollars)
Balance of retained earnings, December 31, 2017 $2,440 Plus: Net income for 2018 1,327 Less: Cash dividends paid
Preferred stock $ 60Common stock 395Total cash dividends paid $ 455
Balance of retained earnings, December 31, 2018 $3,312

Finance 4th Edition
Cornett, Adair, and Nofsinger
Copyright © 2018 McGraw-Hill Education. All rights reserved. No reproduction or distribution without the prior written consent of McGraw-Hill Education.
Reviewing Financial
Statements
2-2
Introduction
• Financial statement – accounting based picture of financial position
• Annual report = four basic financial statements
• balance sheet
• income statement
• statement of cash flows
• statement of retained earnings

2-3
Introduction (continued)
• Reports are used by accountants as a picture of past financial performance
• Finance professionals use financial statements to draw inferences about the future
2-4
Balance Sheet
• Reports firm’s assets, liabilities and equity at a point in time
Assets = Liabilities + Equity
• Assets of firm, in order of liquidity – left side
• Liquidity – how quickly assets convert to cash
• Liabilities, in order of maturity – right side
• Equity listed last – never matures

2-5
Table 2.1 Balance Sheet for DPH
2-6
Current Assets
• Current Assets
• Normally convert into cash within a year
• Cash (and marketable securities)
• Accounts receivable
• Inventory

2-7
Fixed Assets
• Fixed Assets
• Useful life exceeding one year
• Physical (tangible) assets (e.g. net plant and equipment)
• Less tangible, long-term assets (e.g. patents and trademarks)

2-8
Liabilities
• Liabilities are debts of the firm
• Current liabilities
• Obligations due within a year
• Accruals (accrued wages and accrued taxes)
• Accounts payable
• Notes payable
• Long-term debt
• Long-term loans and bonds have maturities greater than one year

2-9
Equity
• Difference between a firm’s total assets and total liabilities
• Types of Equity
• Preferred Stock
• Hybrid security – characteristics of both long-term debt and common stock
• Common Stock and Paid-in-Surplus
• Fundamental ownership claim in public or private company
• Retained Earnings
• Cumulative earnings that have been reinvested – not paid as dividends

2-10
Managing the Balance Sheet
• Fixed asset depreciation accounting method
• Level of net working capital
• Firm’s liquidity position
• Method for financing firm’s assets
• Equity or debt
• Difference between firm’s book value and true market value

2-11
Fixed Asset Depreciation Accounting Method
• Reporting purposes
• Firms often use straight-line method of depreciation
• Tax purposes
• MACRS accelerates depreciation
• Higher depreciation expenses, lower taxable income results in lower taxes in early years of project’s life
2-12
Net Working Capital
Net Working Capital =
Current assets - Current liabilities
• Net working capital is measure of firm’s ability to pay obligations
• Healthy firms have positive net working capital

2-13
Liquidity
• Ability to convert assets into cash at Fair Market Value (FMV)
• Current assets – most liquid
• Cash, marketable securities and accounts receivable
• Inventory is least liquid of current assets
• Fixed assets – less liquid

2-14
Liquidity (continued)
• Liquidity is double-edged sword
• Risk-return trade-off
• More liquidity
• Firm can more easily pay obligations – less risky
• Liquid assets offer low returns
• Cash = zero return
• Fixed assets illiquid
• Help generate revenue and profits

2-15
Debt vs. Equity Financing
• Financial leverage – financing ventures or assets by issuing debt securities
• Magnifies gains and losses
• Debt holders – fixed claim on firm’s cash flows (interest paid on securities)
• Stockholders – claim on remaining cash flow
• Choice of firm’s capital structure represents management’s risk and return preference

2-16
Book Value vs. Market Value
• Book Value (historical cost)
• Assets listed on balance sheet at purchase price
• Market value
• Assets listed at value if sold in today’s market

2-17
Income Statement
• Firm’s total earned revenues and total incurred
expenses – over specific period of time
• Income Statement top line = revenues
• Expenses listed below revenues
• Bottom line/Net Income = difference between
revenues and expenses
• Firm’s operating income reported in top portion
• Summary of financial and tax structure in bottom
portion

2-18
Income Statement Structure

2-19
DPH Tree Farm Income Statement

2-20
Income/Firm Value Summary Below the Bottom Line
2-21
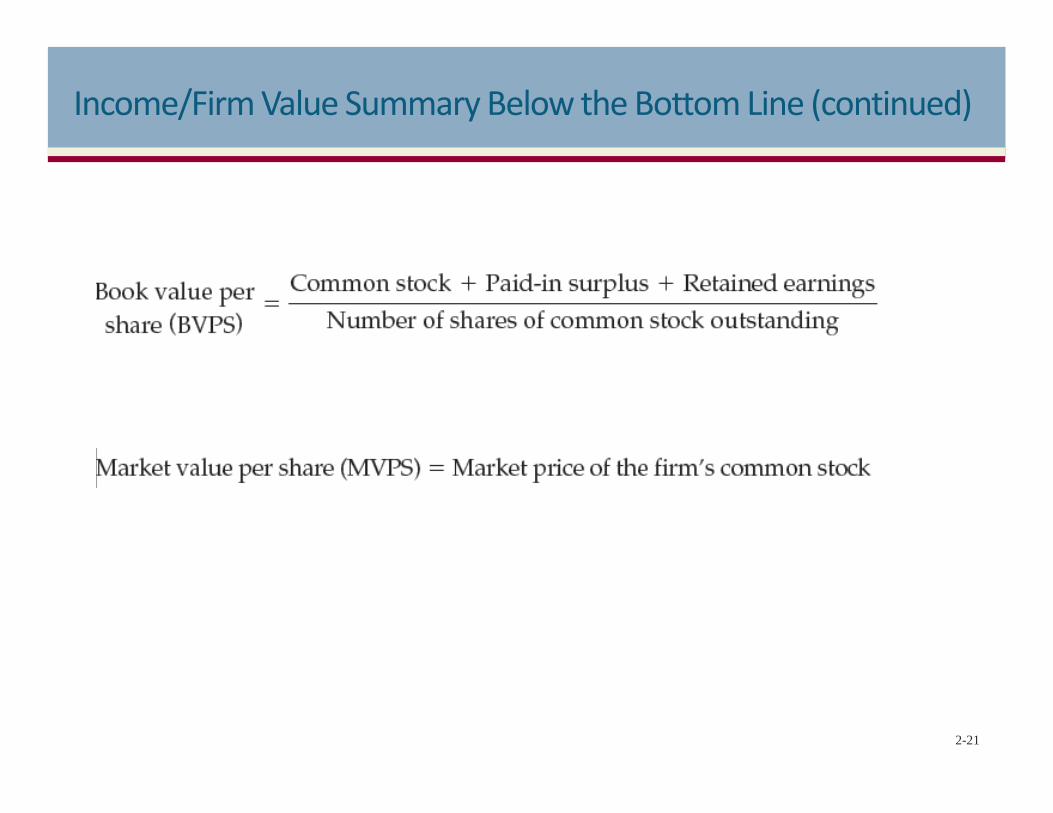
Income/Firm Value Summary Below the Bottom Line (continued)

2-22
Corporate Income Taxes
• Firms taxed on earnings
• U.S. tax code determines corporate tax obligations – overseen by Congress
• Tax rate changes driven by changes in government, business or public environment
• U.S. has progressive tax structure
• The larger the income, the higher the taxes assessed

2-23
Corporate Tax Rates as of 2018

2-24
Corporate Income Taxes (continued)
• Average tax rate
• Percentage of each dollar of taxable income that the firm pays in taxes
• Marginal tax rate
• Taxes paid for each dollar of firm’s additional taxable income

2-25
Interest and Dividends Received
• Interest taxable with two exceptions
• State and local government bonds are federally tax-exempt
• One corporation owning stock in another corporation
• 70% of dividends from other corporation considered tax exempt
• Only taxed on remaining 30% at receiving corporation’s tax rate
2-26
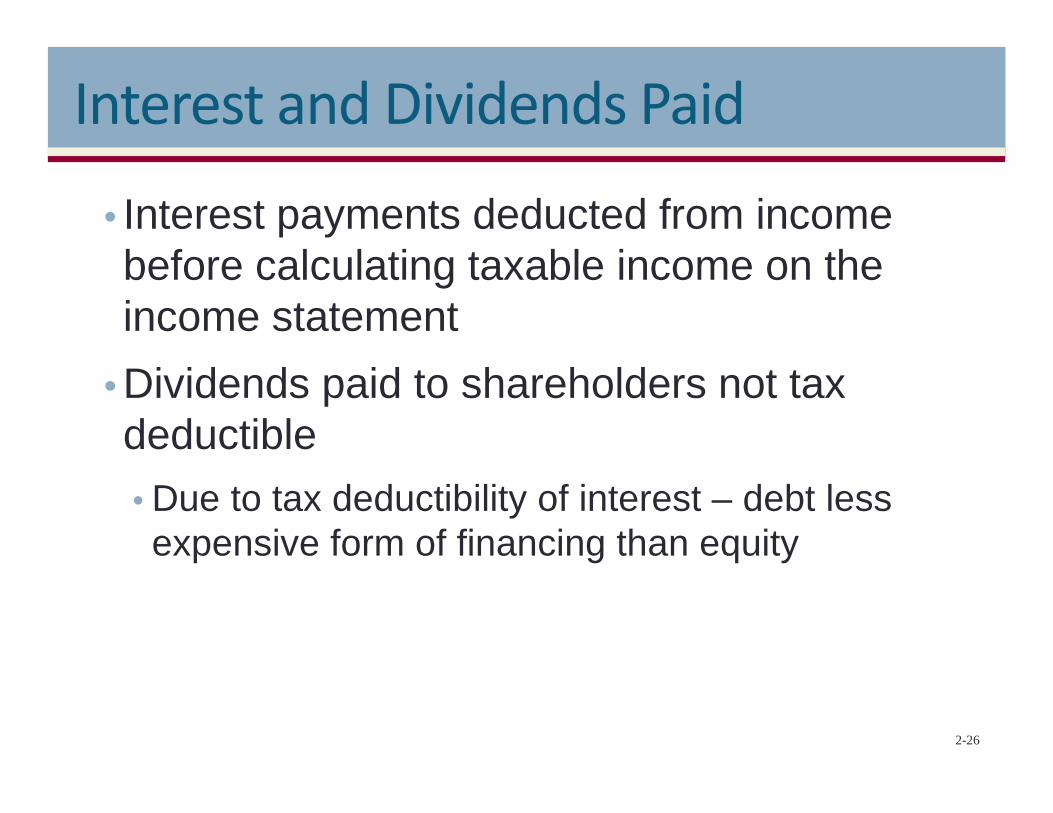
Interest and Dividends Paid
• Interest payments deducted from income before calculating taxable income on the income statement
• Dividends paid to shareholders not tax deductible
• Due to tax deductibility of interest – debt less expensive form of financing than equity

2-27
Statement of Cash Flows
• Financial statement that shows firm’s cash flows over given period of time
• Includes only inflows and outflows of cash and marketable securities
• Excludes transactions with no direct effect on cash receipts and payments
• Statement of Cash Flow bottom line
• Reflects difference between cash sources and uses
• Equals the change in cash on the firm’s balance sheet

2-28
Sources and Uses of Cash
• Cash sources involve
• Increasing liabilities (or equity)
• Decreasing noncash assets
• Cash uses involve
• Decreasing liabilities (or equity)
• Increasing non cash assets

2-29
Sources and Uses of Cash (continued)
• Cash flow statement reports reflect
• Operating activities
• Investing activities
• Financing activities
• Net change in cash and marketable securities
2-30
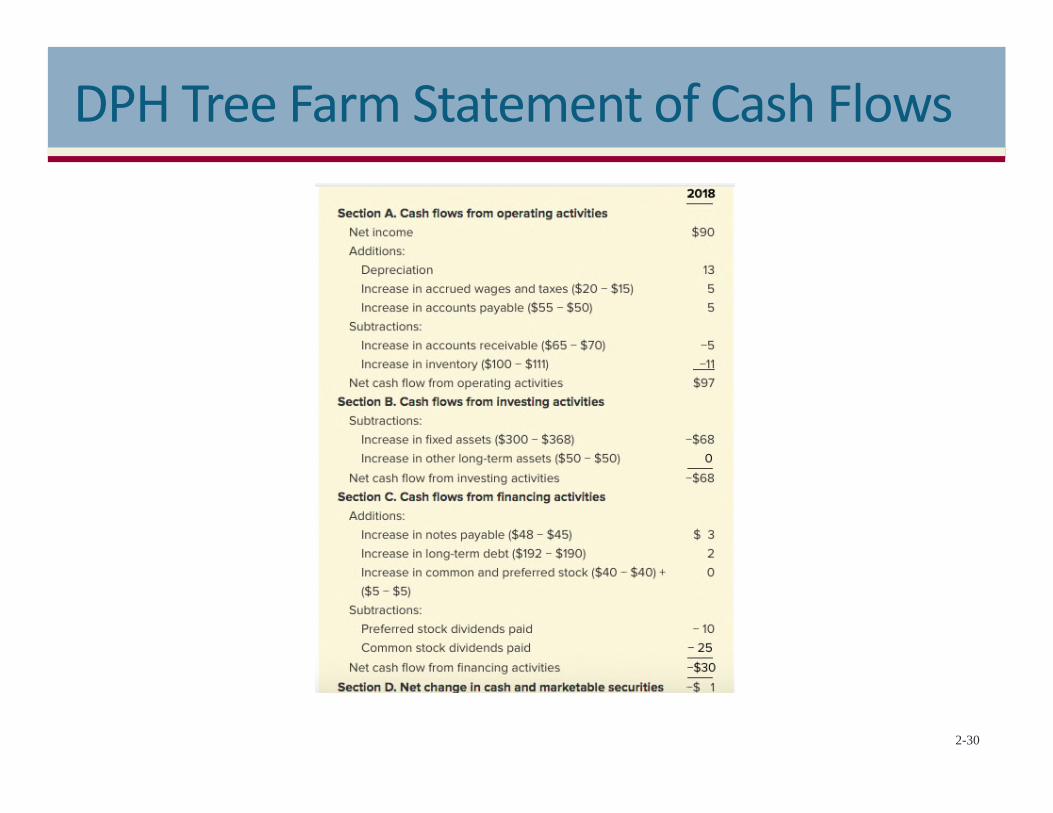
DPH Tree Farm Statement of Cash Flows
2-31
Cash Flows from Operating Activities
• Represents items directly associated with producing and selling the firm’s products
• Net income (adding back depreciation)
• Working capital accounts other than cash and short-term debt

2-32
Cash Flows from Investing Activities
• Represents cash flows associated with buying or selling fixed or other long-term assets
• Reflects the firm’s investment in fixed assets
2-33
Cash Flows from Financing Activities
• Cash flows from debt and equity financing transactions
• Issuing short- or long-term debt
• Issuing stock
• Using cash to pay dividends
• Using cash to pay off debt
• Using cash to buy back stock

2-34
Net Change in Cash and Marketable Securities
• Statement of cash flows bottom line
• Total of cash flows from operating, investing, and financing activities
• Reconciles to the net change in cash and marketable securities on the balance sheet over the period

2-35
Free Cash Flow Equation
2-36
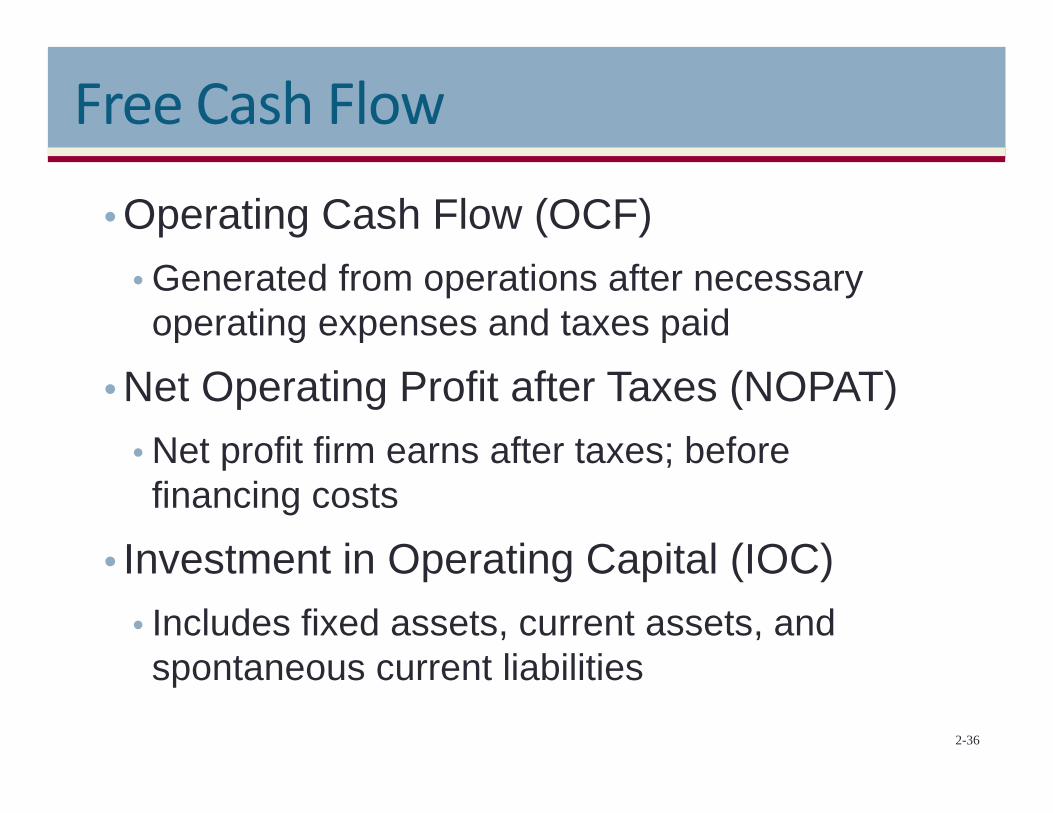
Free Cash Flow
• Operating Cash Flow (OCF)
• Generated from operations after necessary operating expenses and taxes paid
• Net Operating Profit after Taxes (NOPAT)
• Net profit firm earns after taxes; before financing costs
• Investment in Operating Capital (IOC)
• Includes fixed assets, current assets, and spontaneous current liabilities

2-37
Free Cash Flow (continued)
• Firms with positive Free Cash Flow (FCF) have funds available for distribution to investors
• Potential negative FCF implications for firms:
• May be experiencing operating or managerial problems
• May be investing heavily in operating capital to support growth
• Note: FCF might be negative while OCF is positive

2-38
Statement of Retained Earnings
• Details changes in retained earnings during reporting period
• Reconciles net income and dividends paid with changes in retained earnings from one period to the next

2-39
Cautions in Interpreting Financial Statements
• GAAP standards required for financial statements
• Firms can use “earnings management” with GAAP accounting rules
• “Smooth” earnings
• Use different depreciation methods
• Sarbanes-Oxley Act passed in 2002
• Prevents deceptive accounting and management practices
Finance Applications and Theory 4th Edition Cornett Solutions ManualFull Download: http://testbanklive.com/download/finance-applications-and-theory-4th-edition-cornett-solutions-manual/
Full download all chapters instantly please go to Solutions Manual, Test Bank site: testbanklive.com


![Strategic Planning for Secure Digital …ceur-ws.org/Vol-2398/Paper5.pdfThe SWOT Analysis is ”[…] a useful tool for reviewing a firm’s competitive position.” (Sammut-Bonnici](https://img.pdfslide.net/doc/110x75/5f93db1ed37faa7d2a76a7cd/strategic-planning-for-secure-digital-ceur-wsorgvol-2398-the-swot-analysis-is.jpg)