Embed Size (px)
Citation preview

38
Chapter-2
A Theoretical Overview:
Indian Economy, Globalization and Foreign Exchange Reserves
2.1. Introduction
India achieved its independence from the British Raj in 1947. From then on, the
country was faced with several challenges – social, economic, socio-political and many
others. We opted for a mixed economy along with the state-led industrialization
strategy. Specifically, there was an emphasis laid on import substitution. While this
policy failed to foster much economic growth, it did set the ground for industrialization
in India.
The early part of the 90‘s decade was particularly a difficult one. Because of the crisis
of balance of payments, India was pushed to a situation of default repayment of its
debts. The policy makers reacted by carrying out wide-ranging outward-looking
economic reforms. Distrusting market forces and restrictive trade policies started being
perceived as hurdles to good growth. There was a clear move from the regime of the
state to one that was a little more market-friendly, though this move was gradual.
Abolition of the license system for establishing businesses and creating capacities
deregulated industry. Furthermore, the abolition of quantitative restrictions and tariffs
liberalized the trade regime. There was also a conscious promotion of foreign
investment with initiatives such as permitting current account convertibility and
allowing foreign exchange rates to be determined by market forces. The numerous
reform policies have largely been moving towards making maximum use of the
potential advantages of the globalization. There have been quite a few achievements
along with some adverse consequences as well. The economic growth of India has
moved to about 7.3 per cent during the period between 2000 and 2008.65
Much
improvement has also been recorded by way of indicators like balance of payments and
foreign exchange reserves. There has also been a lot of progress with regard to balance
of payments as well as the foreign exchange reserves. In fact, the last two decades have
65
http://www.rbi.org.in/scripts/wssviewdetail.aspx?type=section¶m1=2

39
been particularly good in terms of the spread of telecommunication and information
technology. There were some serious concerns during the post reform period.
Basically, there has been quite an increased in the regional inequalities. Additionally,
some of the western and southern states registered a healthy growth rate, higher than
others. Secondly, some inter-personal inequalities coupled with rural-urban disparities
are also increasingly growing. Thirdly, poverty is reducing at a certain pace too.
Ultimately, the positive changes in different measures of the non-income welfare
measures education and health in the span of the post reform period that would dip
much below the improvement that has been achieved in the economic context.
It is a fact that economic reforms that were started in the 90‘s signified a huge growth
potential in India. With regard to this, it seems sensible to integrate India with the
overall globe since it offers opportunities and challenges. Despite this, the policy
initiatives would not be sustainable if there is a disproportionate burden on even a few
sections of people in some parts of the country. Therefore, monitoring not just the
macro indicators such as growth, balance of payments and foreign exchange reserves,
etc., but also the indicators reflecting rising distributional issues is important.
2.2. Indian Economy: Trend and Pattern of Growth
The optimal sustainable degree at which an economy can develop without leading to an
increase in the rate of inflation is the probable degree of development of an economy.
The probable growth rate is ascertained by the development in the economy‘s
industrious ability which consecutively relies on the progress in inputs (labour, capital,
land, etc.) and technology. An economy may also develop more than the probable rate
for a limited period but that would initiate inflationary forces. If the progress is less
than the probable rate it is likely that the unemployment rate in the economy is
increasing. (Ambani, 2005)66
India has been noted as a large and comparatively slow and poor as a developing
country. After the attainment of independence in the year 1947, the economic policies
of India offered the government with the basic role in terms of promoting development
66
Ambani, M. (2005), ‗‗The New Convergence Paradigm‘‘, Business Today, Vol. 14, p. 42-6.

40
in the economic field. The size of India dictates its federal structure that are the
provisions led by the Constitution (which are ratified in the year 1950), and attained
subsequent evolution offering central government with the dominant position added by
the India‘s constituent units (that are States and Union Territories). The leaders of India
aspire indigenous version related to Fabian socialism, added by government being the
benevolent guardian that leavened smattering aspects of Gandhian influences for
smallness, rural traditions and self-sufficiency.
Economic growth of India got reasonable in 1970s and averaged within 3 and 4per
cent/year. However, it is not considered as rapid way to diminish count of poor people,
nor towards comfortable deal with strains related to the process of governing country
with notable substantial linguistic, religious and ethnic diversity added by economic
inequalities. Still, India is capable enough to preserve unity and its political system
made of parliamentary democracy still prevails. However, the noted political stability
gets accompanied by evolution of economic system that gets riddled by the increase in
the rigidities as well as inefficiencies or so-called ‗license-quota-permit raj’.
In the year 1980s, influences of fresh ideology and observation attained from faster
growth in various East Asian economies made India policymakers attempt changes in
the governmental role of Indian economic development. This was added by the modes
of liberalization in the regime of trade, there was the loosening of controls over
domestic industrial aspects added by the investment promotion attained in the modern
technologies from telecommunications. Growth of Indian economy got accelerated by
5per cent and the same was at the cost of imbalances in the macro economy (fiscal as
well as current deficits‘ account) that worsened the starting phase of 1990s due to the
collapse of Soviet Union that turns up as the major trading partner and relevant turmoil
in Middle East.
In the year 1991, India faced diversified balance in the crisis of payments and this
turned up as the occasion meant for the substantial advance for the structure of the
economic reforms, which are attempted. There are some major steps attained for trade
liberalization to reduce tariffs as well as conversion of the quantitative restrictions
towards tariffs, added by the sweeping away of huge restrictions of segment over
domestic investment of the industry. Two notable changes of early 1990s

41
symbolize/encapsulate ‗economic reform‘ within India. The Soviet Union collapse in
the year 1991 and stellar of the growth performance is related to China that is after
world economy added by market initiation with reforms during 1980s. This got two
notable developments as per reform in India during 1990s, and the same got
distinguished from the temporary aspects as per earlier payment balance crisis in the
year 1966.
The way to reduce governmental role is directly controlling functionalities of the
market work with added implications. It has been noted that sectors like
telecommunications and finance demand for newer regulatory format as per the
environment where the bureaucrats no longer creating discretionary judgments as per
case-by-case format. This must get strengthened by indirect and direct impacts related
to technological change in these kinds of sectors. Moreover, removal of control over
industrial investment cannot solve India‘s slow growth problem, yet gets
complemented by the mode of restructuring functionalities of labour market, added by
the improvement of institutional and physical infrastructure. Attainments of these aims
were hampered in understandable pressures of interest group and there are constrained
aspects led by higher level of fiscal deficit by the government. High fiscal deficit
remains traceable towards the subsidies of interest group and interaction nature
between the state and central governments.
Aggregate mode of performance statistics got an incomplete mode of economic reform
that has got sectors like agriculture that still gets shackled by inefficient mode of public
procurement. This is added by system of distribution added by severe input related to
market distortions, where the industry gets hampered by small scale reservations as
well as inefficient finance with the financial sector dominating indirect and direct
public. This is towards the control of investible resources, added by the rigidities of
labor market hampering whole organization (as against informal) economic segment.
Trade liberalization and foreign investment – aspect of ‗globalization‘ as per reforms of
India gets assistance in some areas. However, this is not sufficient towards the
promotion of widespread competitiveness or the way to rectify/overcome poor Indian
infrastructure. Therefore, agenda for economic reform in India is lengthy and
complicated.

42
There is also the complication noted during 1990s and is the substantial increase
attained in regional inequality. As inequalities gets widened within respective states (as
coast as well as urban areas from Gujarat and Maharashtra as against the interior rural
regions); the basic emphasis is over widening disparities among the states. This gets
noted as natural action and offers political size and importance of government with
states that are indirect and direct channels towards numerous transfers related to central
government. This paper thus aims in examining interaction over the agenda of key
reformation pieces and federal structures of India in terms of reducing and managing
inter-state inequalities. This is in reference to situation that has some aspects related to
economic reform added by larger forces of global economy with increased regional
inequalities in India.
The potential rate of growth of an economy is the maximum sustainable rate at which
an economy can grow without causing a rise in the rate of inflation. The potential
growth rate is determined by the growth in the economy‘s productive capacity which,
in turn, depends on the growth in inputs (labour, capital, land, etc.) and technology. An
economy can grow above the potential rate for some time but that will trigger rising
inflationary pressures. Growing below the potential rate will imply a rise in the rate of
unemployment. (Farrell et al., 2004)67
On account of the international predicament, the development rate of the Indian
economy dropped down to 6.8 per cent p.a. from the earlier rate of nearly 9 per cent
p.a. during 2003-2008. The development rate increased to 6.8 per cent during 2008-09,
which further improved to 8.9 per cent during the initial half of 2010-11 (Yergin and
Stanislaw, 2002)68
. The question which arises here is that does the strong rate denote
that the economy is further going back to its earlier path of growing at nearly 9 per cent
p.a.? This further depends on what would be the extant probable development rate.
(Shukla, 2001)69
67
Farrell, D., Khanna, Sinha T. and Woetzel, J. (2004), ‗‗China and India: the race to growth‘‘, The
McKinsey Quarterly, Special issue on China Today, p. 110-11. 68
Yergin, D. and Stanislaw, J. (2002), ―The Commanding Heights: The Battle for the World Economy‖,
Simon & Schuster, New York. 69
Shukla, P. (2004), ‗‗WTO and survival of small-scale industry: the 5 myth entrepreneurial framework
with case study of Rajkot diesel engine industry‘‘, Journal of Entrepreneurship, Vol. 13 No. 1, p. 69-92.

43
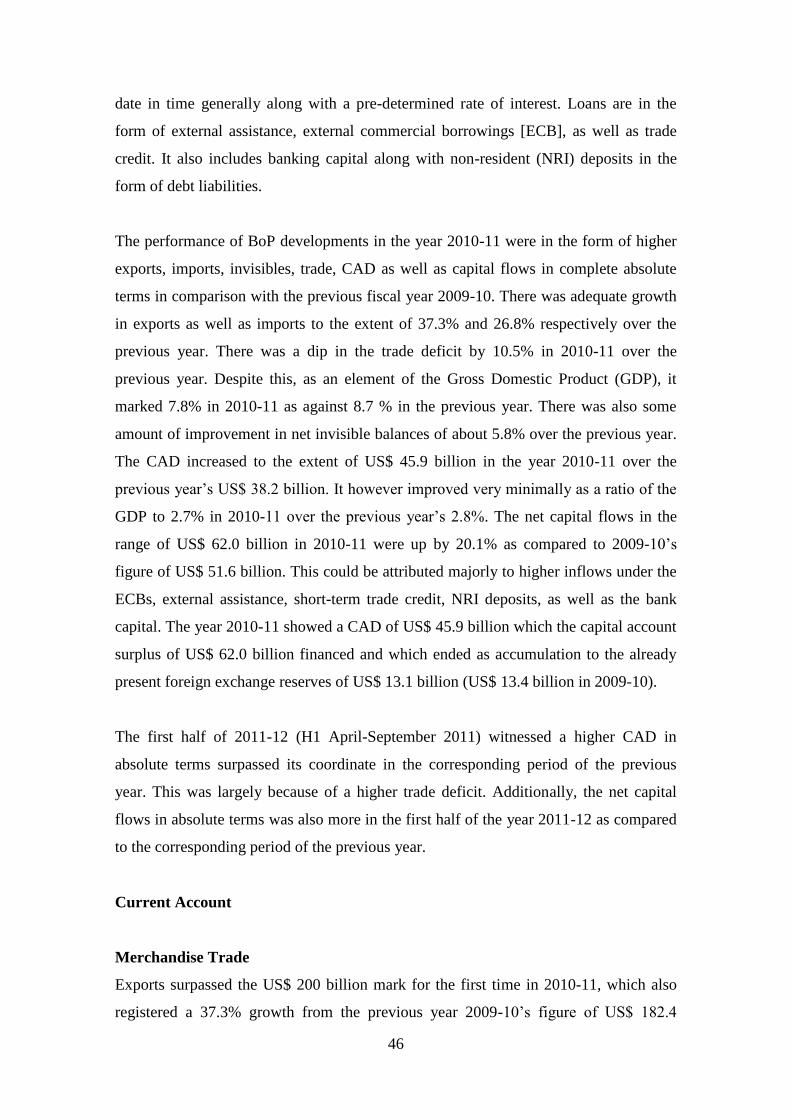
The most preferred technique to estimate the probable rate of growth of an economy is
the HP filter technique, as put forth by Hodrick and Prescott (1980)70
. The figure 1
below displays the probable growth rates for the Indian economy by employing the
quarterly figures from Q1 1996-97 to Q2 2010-11. As can be seen in the figure, the
probable growth rate of the Indian economy has reached a little more than 8.5 per cent
in the mid-2000s from approximately 5.5 per cent during the later 1990s (Spilimbergo
et al., 2008)71
. After the mid-2000s, the probable rate has reduced and due to the
international predicament, the rate has become 7.5 per cent and less. 72
There was a rude drop in the savings and investment rates in the economy after the
international predicament: the savings rate actually reduced to approximately 33 per
cent during 2008-09 and 2009-10 from around 37 per cent of GDP during 2007-08. The
same period saw the investment rate lower to 35.5 per cent from around 38 per cent of
GDP. Thus the reduction in the probable growth rate in the Indian economy is
somewhat mirrored by the decline in the savings and investment rates. (Hoque and
Yusop, 2010)73
The economy developed by 8.9 per cent during the initial half of the present fiscal year
and this figure is more than the probable rate. This is also the fallout of the
perseverance of inflationary strain on the Indian economy. (Choong et al., 2005) 74
70
Hodrick, R.J. and Prescott, E.C, (1997) ―Postwar U.S. Business Cycles: An Empirical Investigation,‖
Journal of Money, Credit & Banking, Vol. 29 (1), p. 1-16. 71
Spilimbergo, A., Steve, S., Olivier, B. and Carlo C. (2008), ―Fiscal Policy for the Crisis,‖ Staff
Position Note 08/01, International Monetary Fund, Washington D. C. 72
http://articles.economictimes.indiatimes.com/2012-07-30/news/32924166_1_export-growth-services-
exports-wto-report 73
Hoque, M. M. and Yusop, Z. (2010), ―Impacts of trade liberalisation on aggregate import in
Bangladesh: An ARDL Bounds test approach,‖ Journal of Asian Economics, Vol. 21(1), p. 37-52. 74
Choong, C. K., Law, S.H., Yusop, Z. B. and Choo, S. S. (2005), ―Export-led Growth Hypothesis in
Malaysia: A Revisit,‖ The IUP Journal of Monetary Economics, Vol. 3(4), p. 26-42.

44
Figure 1: Growth Rate of Indian Economy: Actual Vs. Potential
Q1 1997-98 to Q2 2010-11
Source: Constructed based on data from CSO.
2.2.1. Balance of Payments in Indian Economy
The numerical account which methodically sums up the monetary transactions of an
economy in contrast to the remainder of the world for a particular time frame is referred
to be the Balance of Payments. (Dipendra, 2001)75
Thus the balance of payments in India is a methodical account of the global monetary
transactions of Indian residents with the remaining world in view of goods, services,
unreciprocated transfers and transfers of capital. The term residents include both
nationals and non-nationals who live in India (Kandil & Morsy, 2010)76
. Generally
75
Dipendra, S. (2001), ―A Note on Trade Elasticities in Asian Countries,‖ The International Trade
Journal, Vol. 15 (2), p. 221-237. 76
Kandil, M. and Morsy, H. (2010), ―Fiscal Stimulus and Credibility in Emerging Countries,‖ WP No.
WP/10/123, International Monetary Fund, Washington, D.C.

45
foreign students, tourists, foreign diplomatic officers and global organisations are not
regarded to be residents but embassy officials and the armed forces of the nation,
working overseas are considered to be residents despite their actual location.
The balance of payments of India displayed in this segment have been obtained majorly
from the Exchange Control Records and the primary data on majority of the official
transactions, not directed through the banking mediums are got from the Government
agencies and the Reserve Bank of India. The Reserve Bank of India from time to time
makes available the corrected/latest data via its Press Bulletin depending on this data
obtained. The RBI monthly Bulletin and RBI‘s website (www.rbi.org.in) are
correct/modify the data available. With reference from July 1996, R.B.I. has altered the
design of the Balance of Payments. The modified series in the novel form has been
provided for the year 2000-01 to 2009-10.
The Fifth Edition of the Balance of Payment Manual identifies BoP as comprising of
the current account, capital account, mistakes and certain omissions, as well as
alterations in forex reserves. As part of the current account of the BoP, it has also
classified transactions into merchandise (comprising of exports and imports) and
invisibles. Further on, invisibles are classified as: Services that include travel, transport
facilities, insurance, government which is not a part in any other document (GNIE), as
well as miscellaneous. Components of miscellaneous services include communications,
construction, financial, software, news agency, royalties, and management along with
other business services. Income is another aspect of invisibles while the third aspect of
invisibles includes transfers (grants, gifts, remittances, and so on). These do not have
any quid pro quo ("this for that" in Latin) to most often means a more-or-less equal
exchange or substitution of goods or services.
As part of capital account, it is possible to classify capital inflow by way of the
instrument – which may be debt or equity and maturity - which may short-term or long-
term. Capital account comprises of mainly foreign investment, loans, as well as
banking capital. Further on, foreign investment comprises of foreign direct investment
(FDI) along with portfolio investment which consists of foreign institutional investors
(FIIs) while American depository receipts or global depository receipts (ADRs/GDRs)
signifying non-debt liabilities. Loans are forms of borrowings to be repaid at a later
46
date in time generally along with a pre-determined rate of interest. Loans are in the
form of external assistance, external commercial borrowings [ECB], as well as trade
credit. It also includes banking capital along with non-resident (NRI) deposits in the
form of debt liabilities.
The performance of BoP developments in the year 2010-11 were in the form of higher
exports, imports, invisibles, trade, CAD as well as capital flows in complete absolute
terms in comparison with the previous fiscal year 2009-10. There was adequate growth
in exports as well as imports to the extent of 37.3% and 26.8% respectively over the
previous year. There was a dip in the trade deficit by 10.5% in 2010-11 over the
previous year. Despite this, as an element of the Gross Domestic Product (GDP), it
marked 7.8% in 2010-11 as against 8.7 % in the previous year. There was also some
amount of improvement in net invisible balances of about 5.8% over the previous year.
The CAD increased to the extent of US$ 45.9 billion in the year 2010-11 over the
previous year‘s US$ 38.2 billion. It however improved very minimally as a ratio of the
GDP to 2.7% in 2010-11 over the previous year‘s 2.8%. The net capital flows in the
range of US$ 62.0 billion in 2010-11 were up by 20.1% as compared to 2009-10‘s
figure of US$ 51.6 billion. This could be attributed majorly to higher inflows under the
ECBs, external assistance, short-term trade credit, NRI deposits, as well as the bank
capital. The year 2010-11 showed a CAD of US$ 45.9 billion which the capital account
surplus of US$ 62.0 billion financed and which ended as accumulation to the already
present foreign exchange reserves of US$ 13.1 billion (US$ 13.4 billion in 2009-10).
The first half of 2011-12 (H1 April-September 2011) witnessed a higher CAD in
absolute terms surpassed its coordinate in the corresponding period of the previous
year. This was largely because of a higher trade deficit. Additionally, the net capital
flows in absolute terms was also more in the first half of the year 2011-12 as compared
to the corresponding period of the previous year.
Current Account
Merchandise Trade
Exports surpassed the US$ 200 billion mark for the first time in 2010-11, which also
registered a 37.3% growth from the previous year 2009-10‘s figure of US$ 182.4

47
billion when it exported US$ 250.5 billion. Exports of goods were mostly engineering
goods, petroleum products, gems and jewellery, as well as chemical and such other
products. Along with better exports, there was also a change in the nature of exports in
the sense that there was more export quantum of higher value-added engineering and
petroleum products that the previously labour-intensive manufacturing kinds.
Additionally, the fact that developing countries are turning into our favourite and
largest export market in recent times has also been a relatively new development.
As in exports, there was also a good growth in imports of about 26.8% that brought in
US$ 381.1 billion in 2010-11 over the previous year‘s US$ 300.6 billion. Imports of oil
upped by 19.3 % in 2010-11 (against a dip of 7% the previous year) thereby accounting
to about 28.1% of the entire imports (30.2% in the year 2009-10). The rise in imports
was topped by petroleum and such products as well as pearls and semi-precious stones.
The chapter on International Trade contains a detailed analysis.
There was an increase of about 10.5% in the trade deficit to US$ 130.6 billion as
against the previous year‘s US$ 118.2 billion. This was due to more increase in the
imports as compared to exports after a commendable domestic performance in 2010-
11. The trade deficit however worked its way from 8.7% in 2009-10 to a better 7.8% in
2010-11 on account of a greater increase in the GDP at market prices vis-à-vis the trade
deficit.
India‘s CAD widened during the H1 period of 2011-12 indicating the effect of the
growth asymmetry between India and rest of the globe. The growth of exports and
imports picked up in 2010-11 and went on into the first half of 2011-12.
In the H1 of 2011-12, US exports improved from US$ 107.3 billion in the H1 period of
2010-11 to about US$ 150.9 billion, touching a growth pattern of about 40.6% as
against the 30% in the H1 of 2010-11 over the corresponding period in the previous
year. There was much buoyancy in exports of goods like engineering and petroleum
items. An encouraging and supportive government policy with much focus on the
diversification of higher value-added products in sectors like engineering and
petroleum sectors brought about resilience in the performance of exports. Exports are
also effectively supported by trade policy with the help of schemes like the Focus

48
Market Scheme (FMS), Focus Product Scheme (FPS), and Duty Entitlement Passbook
Scheme (DEPB).
Furthermore imports to the tune of US$ 236.7 showed an improvement of about 34.3%
in the H1 of 2011-12 as compared to the 27.3% that was registered in the H1 of the
previous year. Consistently rising prices of crude oil accompanied by increasing prices
of gold and silver have also resulted in creating import bill in the H1 phase of 2011-12.
Trade deficit also expanded by about 24.5% to the amount of US$ 85.8 billion (9.4% of
the GDP) in the H1 period of 2011-12, as against US$ 68.9 (8.9 % of the GDP) in the
H1 phase of the year 2010-11. This occurred despite the higher exports as against that
of imports in the H1 phase of 2011-12.
Invisibles
The invisibles account of the BoP shows the total effect of transactions that are relevant
to international trade in the services along with the income of non-resident assets and
liabilities, labour and property as well as cross-border transfers, largely remittances of
workers.
The year 2010-11 showed a major increase in exports as well as imports of services.
Exports of services moved up by 38.4% and touched US$ 132.9 billion from the US$
96.0 in the previous year. There was also an increase of 113.3% in business services
which touched US$ 24.8 billion from the US$ 11.3 billion in 2009-10 while financial
services moved up by 75.7% from US$ 3.7 billion in 2009-10. There was also a rise
seen in receipts of software services, largely by way of better efficiency and movement
into diversified export destinations. There was also an increase in software receipts of
about 11.7% in 2010-11 (that pegged at 7.3 % the previous year) which translated into
US$ 55.5 billion, accounting for 41.8 per cent of total service receipts. These were 12.4
per cent of total current receipts. The Net service exports moved up from 36.0 billion in
2009-10, registering 35.5 per cent increase over the previous year to US$ 48.8 billion in
2010-11.

49
An increase on private transfer receipts took place as well. These comprised mainly of
remittances from Indians working overseas. The increase was by about 3.7% touching
US$ 55.6 billion in 2010-11 from US$ 53.6 billion 2009-10. About 12.4% of the
current receipts (that was 15.5% the previous year) were taken by private transfer
receipts. There was also a reasonable increase in other categories of receipts
(transportation, insurance, communication, and GNIE).
Invisible payments saw an increase of 36.2 per cent from US$ 83.4 billion in 2009-10
to US$ 113.6 billion in 2010-11. There was a 36.2% growth in invisible payments
which overtook the 21.3% growth mark the previous year. It further increased which
was largely attributed to business services, financial services, travel, and investment
income. Despite the surplus because of service-sector exports being higher in 2010-11,
growth in net receipts on account of transfers was still moderate while the net outflow
of investment income increased during the same period. Therefore, the net invisible
balance (receipts minus payments) registered 5.5% increase to US$ 84.6 billion in
2010-11 compared to the previous year‘s US$ 80.0 billion. As a proportion of GDP, net
invisible balance declined from 5.9 per cent in 2009-10 to 5.0 per cent in 2010-11. At
this level, the invisible surplus financed 64.8 per cent of trade deficit as against 67.7 per
cent during 2009-10.
As part of the H1 in 2011-12, there was an increase of about 17.4% in the invisible
receipts which moved to US$ 106.0 billion as against the US$ 90.3 billion in the
corresponding period of the previous year. Services, transfers, and income which are
the broad categories of invisibles registered good increase. There was also adequate
growth in services exports which were around 17.1% in the period H1 of 2011-12 as
compared to the 32.7% in the corresponding H1 of the previous year. As for the growth
in imports, it was abnormally lower at 1.0% in the H1 of 2011-12 as opposed to 48.3%
in the H1 of the previous year. With regard to the net basis, there was an increase in
services surplus to the tune of US$ 31.1 billion in H1 of 2011-12 from US$ 21.5 billion
in the corresponding period of the previous year. A decline in investment income
receipts by 3.8 per cent was also seen when it touched US$ 4.2 billion during H1 of
2011- 12, while payments amounted to US$ 13.6 billion (US$ 12.2 billion a year
earlier). Transfer receipts comprise largely of personal transfers moved up to US$ 32.3
billion in the H1 of 2011-12 that was about US$ 27.2 billion the previous year.

50
An increase of 3.9% was seen in terms of invisible payments in the H1 phase of 2011-
12 which touched US$ 53.0 billion over the previous year‘s US$ 51.0 billion in the
same period. There was also a 34.6% shoot-up in the net invisibles balance (receipts
minus payments) which helped it touch US$ 52.9 billion (5.8 per cent of GDP) in H1 of
2011-12 from the previous year‘s US$ 39.3 billion (5.1 per cent of GDP). At this point,
the invisibles surplus financed about 62.0% of the trade deficit during the phase H1 of
2011, as against 57.0% in the previous year‘s corresponding period.
There was a marginal decrease in the goods and services deficit (i.e. trade balance plus
services) when it slipped from US$ 82.2 (6.0% of the GDP) in 2009-10 to US$ 81.8
billion (4.9 per cent of GDP) during 2010-11. The fiscal 2011-12 witnessed its
widening to US$ 54.7 billion around the H1 as against US$ 47.4 billion during the
previous year‘s corresponding period by way of an increase in the trade deficit. Yet, as
a ratio of GDP, it dipped marginally to 6.0% in 2011-12 (up to H1 period) from 6.1%
in the previous year (up to H1 period)
Current Account Balance
There was an increase in the CAD from the previous year‘s US$ 38.2 billion to US$
45.9 billion in 2010-11. This occurred in spite of the improvement in net invisibles,
largely because of higher trade deficit. Yet, as an element of the GDP, the CAD worked
upward marginally to 2.7% in 2010-11 as compared to 2.8 per cent in the previous
year.
There was also an increase in the CAD to US$ 32.8 billion in H1 of 2011-12, as against
US$ 29.6 billion during the corresponding period of the previous year. This occurred
largely because of a higher trade deficit. In its role as a proportion of the GDP, it was
marginally lower at 3.6% in the H1 of 2011-12 as compared to 3.8% in the
corresponding H1 of the previous year.
The latest data from the Ministry of Commerce states that, exports achieved a 23.5%
growth in terms of US$ 242.8 billion during April 2011-January 2012, as against the
US$ 196.6 billion that was achieved in the same period during the previous year.
Imports also clocked a 29.4% growth and marked US$ 391.5 billion during April 2011-

51
January 2012 over the figure of US$ 302.6 billion made in the corresponding period of
the previous year. As such, trade deficit upped by 40.3% to US$ 148.7 billion in the
period April 2011-January 2012 as against the US$ 106 billion made in the period from
April 2010-January 2011.
Capital Account
It is possible to classify capital inflows by way of: instrument (debt or equity) and
maturity (short-term or long term). The major elements of capital account are foreign
investment, loans, and banking capital. Foreign investment includes foreign direct
investment (FDI) while portfolio investment signifies non-debt liabilities. Loans
(external assistance, ECBs, and trade credit) and banking capital such as NRI deposits
are debt liabilities. FDI is preferred over portfolio flows, in India, since FDI flows tend
to be more stable than portfolio and other kinds of capital flows. Also, rupee-
denominated debt is more preferable than foreign currency debt while medium-term
and long-term debt is preferred over short-term debts.
International capital flow can be explained by push and pull factors. Push factors are
factors that operate from the outside of an economy and inter alia include parameters
like low interest rates, sufficient liquidity, slow rate of growth, or lack of investment
opportunities in advanced economies. As for pull factors, these include robust
economic performance and improved investment climate that take place because of
economic reforms in emerging economies and are internal to an economy.
In 2010-11, both gross inflows of US$ 499.4 billion and outflows of US$ 437.4 billion
under the capital account were higher than gross inflows of US$ 345.8 billion and
outflows of US$ 294.1 billion in the preceding year. Capital inflows in net terms had
increased by 20.2% to US$ 62.0 billion (3.7 per cent of GDP) in 2010-11 as compared
to US$ 51.6 billion (3.8 per cent of GDP) in 2009-10 largely because of trade credit
and loans (ECBs and banking capital).
The Non-debt flow or foreign investment- FDI and portfolio investment (ADRs/GDRs
& FIIs) on a net basis declined by 21.4% from US$ 50.4 billion in 2009-10 to US$ 39.7
billion in the following year. This dip in foreign investment was further offset by the

52
debt flows components of loans and banking capital which shot up by 130.3% touching
US$ 33.4 billion in 2010-11 from the previous year‘s US$ 14.5 billion.
There was also a decline trend seen in the inward FDI flow whereas there was an
upward trend seen in the outward FDI in 2010-11 as compared to the previous year‘s
figures. Inward FDI dipped from US$ 33.1 billion in 2009-10 to US$ 25.9 billion in
2010-11. The decline according to sector occurred largely due to lower FDI inflows
that took place under manufacturing, financial services, electricity, and construction.
The largest element of FDI inflows to India on the basis of countries, that investment
that came through Mauritius was the biggest element of the FDI inflows to India in
2010-11 then followed by Singapore and the Netherlands. There was also an increase in
the outward FDI which moved from US$ 15.1 billion in 2009-10 to US$ 16.5 billion in
the subsequent year - 2010-11. A lower inward FDI and increase in the outward FDI,
net FDI (inward less outward) to India stood substantially lower at US$ 9.4 billion
during 2010-11 from the previous year‘s US$ 18.0 billion.
Furthermore, the Net portfolio investment flow went through a slight decline US$ 32.4
billion in 2009-10 to US$ 30.3 billion in the next year. The reason for this was because
of a dip in ADRs/GDRs to US$ 2.0 billion in 2010-11 from US$ 3.3 billion in the
previous year. This development occurred despite the FII inflows indicated a marginal
increase to US$ 29.4 billion in 2010-11 from US$ 29.0 billion in 2009-10.
There were also other categories of capital flows, such as the debt flows of ECBs,
banking capital, and short-term credit which increased significantly in 2010-11. The
Net ECB inflow also stepped up majorly to the extent of US$ 12.5 billion in 2010-11 as
compared to the previous year‘s US$ 2.0 billion. Likewise, there was also a spurt in the
short-term trade credit. This moved from US$ 7.6 billion in 2009-10 to US$ 11 billion
in 2010-11, pointing towards substantial domestic economic performance. Furthermore,
there was also an increase in the external assistance increased from US$ 2.9 billion in
2009-10 to US$ 4.9 billion in the next year.
There was improvement in the capital account surplus which moved up by 20.1%
touching US$ 62.0 billion during 2010-11 from US$ 51.6 billion in the previous year.
Yet, as a part of the GDP, it slipped a little bit to 3.7% in 2010-11 from 3.8% in the

53
previous year. The Net accretion to reserves (on BoP basis) in 2010-11 registered US$
13.1 billion, which stayed static at roughly the same score as in the previous year (US$
13.4 billion). The fiscal year 2011-12 (up to H1), indicated that under the capital
account both, there were gross inflows of US$ 244.2 billion and outflows of US$ 203.1
billion were higher than the gross inflows of US$ 207.5 billion and outflows of US$
168.5 billion during the same period a year ago. With regard to net terms, there was a
moderate increase in capital inflows which moved to US$ 41.1 billion in H1 of 2011-12
as compared to the figures of US$ 39.0 billion recorded in the H1 of the previous year.
Despite the net FDI being higher at US$ 12.3 billion in the H1 of 2011-12 as against
US$ 7 billion in H1 in the previous year, there was still a decline in the net portfolio
investment from US$ 23.8 billion to US$ 1.3 billion in the same period. The reason for
this decline was a huge beating that FII flows took and dipped to US$ 0.9 billion in
2011-12 (up to H1) as against US$ 22.3 billion in H1 of the previous year. There were
also other capital flows, including ECBs and banking capital, also substantially
increased. Net capital inflow as an element of GDP showed reasonable moderation
from 5.0% in H1 of 2010-11 to 4.5 per cent in H1 of 2011-12.
The Net accretion to reserves (on BoP basis) during H1 of 2011-12 was lesser at US$
5.7 billion as against the US$ 7 billion in the H1 of the previous year which happened
largely because of the widening of the CAD.
According to the latest information on capital inflows, it was seen that FDI inflows
were US$ 35.3 billion in the period of April-December 2011 (as against US$ 16.0
billion in the corresponding period of the previous year). There was also major and
sharp decline in the portfolio inflows to US$ 3.3 billion in the period of April-
December 2011 from US$ 31.3 billion in the previous year. This reflected uncertainty
and risks involved in the global economy because of the euro zone crisis.
India’s Foreign Exchange Reserves
India‘s foreign exchange reserves are made up of foreign currency assets (FCA), gold,
special drawing rights (SDRs), and reserve tranche position (RTP) in the International
Monetary Fund (IMF). When the Reserve Bank of India (RBI) intervenes in the foreign
exchange market in order to straighten out the volatile exchange rate behaviour, foreign

54
exchange reserves are levelled. Another reason for this is also the activity of the US$
with world currencies. It is possible to accumulate foreign exchange at a time when one
notices an absorption of too much of forex flows on the part of the RBI via an
interaction in foreign exchange market, aid receipts, and interest receipts and funding
from the International Bank for Reconstruction and Development (IBRD), Asian
Development Bank (ADB), International Development Association (IDA), etc.
FCAs are maintained in major currencies like the US dollar, euro, pound sterling,
Australian dollar, and Japanese yen. The US$ as well as the euro are intervention
currencies; but these reserves are denominated and are also expressed in the US dollar
only, which is the international numeraire. The level of reserves dips when the US$
appreciates against major international currencies and vice versa. Safety and liquidity
can be seen as the guiding principles of foreign exchange reserves management in India
with return optimization being embedded strategy within this framework.
India‘s foreign exchange reserves began from a level of US$ 5.8 billion around the
March 1991, and has slowly and steadily risen to a level of US$ 25.2 billion by the end
March 1995, US$ 38.0 billion by end March 2000, US$ 113.0 billion by end March
2004, and US$ 199.2 billion by end March 2007. Foreign exchange reserves were
around US$ 314.6 billion around the end of May 2008, before decreasing to US$ 252.0
billion at the end of March 2009. This decrease in reserves in the year 2008-09 was an
outcome of the fallout of the global crisis and strengthening of the US dollar with
regard to other international currencies. In the period of 2009-10 witnessed an upward
trend in the foreign exchange reserves which rose to US$ 279.1 billion by the end of
March 2010. This was due to the evaluation gain on account of the depreciation of the
US$ with regard to important international currencies too. In the fiscal year 2010-11,
foreign exchange reserves showed an increasing trend and touched US$ 304.8 billion
around the end of March 2011, increased by about US$ 25.7 billion from the US$
279.1 billion level at the same time in the previous year. From the sum increase in
reserves, US$ 12.6 billion was because of the evaluation gains that happened out of
depreciation of the US dollar against major currencies and the balance US$ 13.1 billion
was on BoP basis.

55
The current fiscal year, when seen on a monthly basis, reflect certain trends in the
foreign exchange reserves. These have touched a record high level of US$ 322.0 billion
around the end August 2011. But, there was a dip seen to about US$ 311.5 billion
around the end September 2011 before peaking to US$ 316.2 billion at end October
2011. Further on, there was also a decline seen in November and December 2011. By
December 2011, they stood at US$ 296.7 billion, showing a dip of US$ 8.1 billion from
US$ 304.8 billion at end March 2011. This dip in reserves has been caused to an extent
because of the interference of the RBI in order to control the slide of the rupee against
the US dollar. This level of reserves provides about eight months of import cover as
well.
2.2.2. Foreign Exchange Markets in India – a brief background
The forex market in the country began properly about 30 years when in the year 1978;
the state permitted banks to swap forex among them. These days more than 70 per cent
of the swapping in forex usually happens among the banks. The market has over 90
permitted people who exchange money and usually emerge protected and secure once
trading finishes. Trade is managed by the Foreign Exchange Dealers Association of
India (FEDAI), a self managed group of traders. From 2001 onwards, clearance and
settling jobs in the forex area are mainly done by the Clearing Corporation of India
Limited (CCIL) which handles dealings of close to 3.5 billion US dollars per day about
80 per cent of the complete dealings.
The liberalizing event has greatly increased the forex area in the nation by permitting
banks as well as corporations more room to hold and swap forex. The Sodhani
Committee of 1994 had suggested more freedom for banking establishments which
were involved, permitting them to establish their own trade boundaries, interest extent
on FCNR accumulations and the application of derived aspects.
The expansion of the forex area during the recent past has been particularly striking.
During the past five years from 2000-01 to 2005-06, the trading volume in the forex
area (such as exchanges, futures and future negations) has become the thrice, expanding

56
at a compound annual rate of more than 25 per cent77
.Among the banks, foreign
exchange trading has gone to make up a large share (more than 77 per cent) of the gross
trading during this time, even if there is a pattern for that amount. (A reason for this
domination is a consequence of counting twice because buying and selling are
individually joined and one dealing between banks causes buying and also a selling
entry) This keeps in trend with international trends.
During the March of 2006, roughly half or 48 per cent of the dealings were spot
trading, while exchange dealings, (mainly repeat buying deals based on a single deal-
stable or future- clubbed with a lengthier gestation future deal in the opposite way)
made up 34 per cent and future and future negations constituted 11 per cent and 7 per
cent each. Roughly a two-third fraction of all dealings put to rupee at one end.
In 2004, as per the third survey of the year of forex and derivation markets performed
by the Bank for International Settlements (BIS (2005a)), the Indian Rupee was at the
20th
spot amongst all sorts of money values in the sense of appearing by one side of all
forex dealings across the world and its stake had increased thrice compared with 1998.
Being a hub for forex swapping steps, India has the 23rd
rank amongst all nations which
were done by the BIS studies in 2004 and made up 0.3 per cent of the global revenue.
Trade occupies a relative and moderate proportion in the country and 11 banking
establishments make up more than 75 per cent of the trade that was examined
according to the BIS study, 2004.78
2.2.3. Level of Forex Reserves in India
The India method to establish the sufficiency of foreign exchange is in the process of
development, in recent times, particularly with the release of the important Report of
the High Level Committee on Balance of Payments and also Governor Jalan‘s
explanation of the clubbing of international volatility, local conditions and country
safety requirements in establishing the liquidation which could be hazardous and hence
77
http://timesofindia.indiatimes.com/business/india-business/Indian-economy-to-grow-69-in-2012/13-
World-Bank/articleshow/14069014.cms 78
ibid

57
testing the reserve sufficiency. There is a need to give certain evidence with regard to a
few of the markers of reserve sufficiency outlined here and there are no comments
made about sufficiency as such.
The forex reserves have three components-gold, special drawing rights, forex
possessions. On the third of May, 2002, out of the US $ 55.6 billion of gross holdings,
forex possessions made up the largest stake with US $ 52.5 billion. Gold could make up
only US $ 3 billion. During July 1991, the Reserve Bank of India decided as a short
term measure and through the reserve handling mechanism, to give gold to get loans.
The holding of gold is very important in holdings handling when there are financial
troubles. From then onwards, gold has had an inactive part is reserve handling.
The degree of forex reserve has gradually gone up from US$ 5.8 billion in the end of
March, 1991 to US$ 54.1 billion in the end of March 2002 and increased even more to
US$ 55.6 billion on May 3, 2002. The conventional weighing of trade based markers of
reserve sufficiency or the import coverage (described as 12 times the division of
holdings and import revenues) reduced to 21 days of imports by the conclusion of
December 1990 and then went up to 11.5 months during the concluding part of March,
2002.
With regard to financial markers, the per centage of net forex possessions of the
Reserve Bank of India to money that the public had greatly went up from 15 per cent
during 1991 to 109 per cent during the end part of March, 2002. The ration of NFA to
wide money had gone up more than 6 times and stood at 18 per cent from 3 per cent.79
The debt linked markers of reserve sufficiency revealed a great deal of betterment
during the 1990s. The ratio of limited duration borrowings ( or payment commitments
to last at least a year) to forex holdings had greatly reduced from 147 per cent during
the end part of March, 1991 to 8 per cent during the end part of March, 2001. The share
of uncertain money movement described to also factor in total portfolio movements and
limited duration borrowing has reduced from 147 per cent in the year 1991 to 58.5 per
cent during the end part of March, 2001.Making up a component of the maintainable
79
http://articles.economictimes.indiatimes.com/2012-05-27/news/31860961_1_rupee-current-account-
deficit-india-s-gdp

58
outside borrowing status, the limited duration borrowing constituent has reduced from
10 per cent during the end part of March, 1991 to 3 per cent during the end part of
March, 2001. Also the extent of borrowing service payouts comparative to present
receiving has reduced from 35 per cent in 1991 to 16 per cent in 2001.
2.2.4. Foreign Exchange Reserve: Trends in India
India‘s business money hazard has gone up a great deal during the last few years, with
FDI inside the nation greatly surpassing investments by Indian origin firms outside.
A study of the country‘s overall global investment status(IIP) shows that the total
commitments of the nation are gradually increasing and tends to be far more than the
cover afforded by the nation‘s forex possessions.
The IIP is a brief of the condition of outside economic advantages and commitments of
a nation. IIP information encompasses dealing by the Reserve Bank of India, the
government, banking institutions and businesses.
The Net IIP is the brief of the outside economic advantages excluding the brief of the
outside economic commitments. It is a statement of the distinction between what the
economy possesses and what it needs to pay off. As per most recent information by the
Reserve Bank of India, corporate houses have net commitments worth $437 billion in
terms of IIP post adjustments during the end of December during 2010 as opposed to a
forex protection f $279 billion in the same time. This implies that the country‘s
economic commitments greatly surpass the security of the foreign exchange holdings.
On the other hand, China achieved a net asset status of$1.8 trillion with regard to its IIP
in the year 2009. Our country‘s net liability status in terms of IIP has been gradually
increasing as time passes and surpassing the increase of forex holdings. A host of
issues, for instance the greater investments by outsiders in the country and burgeoning
dependence on outside commercial debt by Indian firms have resulted in economic
disadvantages increasing quicker than advantages.

59
This is a cause for the Reserve Bank of India being uneasy with more rise in the outside
commercial debt threshold of $ 30 billion which80
is allowed to Indian firms. Corporate
houses have been trying to increase this threshold considering outside borrowings tend
to be less expensive compared with local borrowings. However, foreign commitments
increased during 2010 because firms took more loans to take advantage of the easier
availing of cheap finances from outside.
The less official field or business field interaction with the risks linked with money has
gone up during the past few years with a burgeoning net liability status as opposed to
non those who do not stay.
Outside entitlement to Indian possessions in terms of Indian rupees are a lot more
compare to Indian resident entitlement entities abroad in terms of foreign exchange, the
RBI commented in its report.
The net commitments of the business industry increased from an amount of $160
billion to $437 billion from March 31, 2004 and March 31, 2010. Thus, the nation‘s net
outside commitments, (gross outside commitments which included dealings by the
Reserve Bank of India, banking and business institutions excluding foreign exchange
holdings) have gone up from $47 billion to $158 billion during the said time. The
country‘s forex holdings were $ 297.3 billion during December, 2010 an increase from
$ 279.1 billion in March. It had to be recognised that the forex holdings had assisted
and protected the country from an adverse effect of the global financial troubles. In
comparison with several Western countries, our country has been comparatively less
impacted by the international economic crisis that took place in 2008-09 and that
caused several highly developed nations to experience a turndown. India had the fourth
biggest forex possessions at $ 297.3 billion during December end 2010.
Simultaneously, the forex possessions of Japan and Russia were $ 1.12 trillion and $
479.4 billion each. Our neighbour China's forex holdings were $ 2.45 trillion during
June, 2010.
As per the study, the nation‘s holdings basically consisted of portfolio investments
which were relatively susceptible to abrupt halts and turnarounds and loan from
outside. The country‘s forex holdings have gone up through the years from just about $
80
http://rbidocs.rbi.org.in/rdocs/Bulletin/PDFs/29869.pdf

60
5.8 billion during March, 1991. The holdings touched a pinnacle of $ 314.6 billion
during the end of May, 2008 before reducing to $ 252 billion during the end of March,
2009.
The reduction in holdings during 2008-09 was product of the result of the international
financial problems and the boosting of the US dollar in comparison to the foreign
currency, the survey said.
Regarding the aspect of possessing multiple choices of a previously organized credit
line, the study observed that this kind of a choice was needed but not enough since
international investors often looked at the size of forex balances as an important input
in implementing investing choices, it said.81
2.3. Impact of Foreign Exchange Reserves on Balance of Payments
Foreign exchange reserves of India is inclusive of various external assets that are very
much available and eventually are controlled by RBI in terms of meeting payment
balance in financing needs, intervening exchange markets in order to stem volatility in
reference to the exchange rate led by Rupee along with various related purposes. In
current scenario, the foreign exchange reserves of India are actually comprise of assets
of foreign currency initiated by RBI, SDRs, gold and RTP in IMF. In reference to
India, SDRs are considered under government books and thus are not integral to assets
of foreign currency under RBI, yet remains as a component to foreign exchange
reserves. There is the inclusion of RTP in foreign exchange reserves from the 2nd
of
April, 2004 in accordance to most relevant international practices. Change marked in
reserves is subject to serve financing item within Indian BoP. Entire balance (that is the
summation of current account balance, errors & omissions and capital account balance)
are interrelated to the change marked in reserves under opposite sign. In a way, the net
credit or debit status in entire balance gets matched through opposite entry under
reserves for denoting an increase under reserves (or the debit) added by the possibility
of declination in reserves (or the credit).
81
ibid

61
Movement in reserves has been well extracted from reserves‘ stock. This particular
stock is comprised of both ‗real‘ kinds of changes under reserves added by valuation
effects. Assets of foreign currency related to RBI, has been expressed through US
dollars, and it is comprised of other kinds of hard currencies like Euro, Yen, Sterling,
etc. Thus, the rates of cross-currency exchange for these currencies can affect stock
related to foreign currency assets under RBI, that are eventually expressed through the
valuation assessed under US dollars. For gold, aspect of valuation is rising
continuously due to changes in international prices related to gold. As gold reserves are
subject to get valued at the rate of 90 per cent of average market price of London
during the month, yet developments in SDR/ exchange rate of US$ are affecting SDR
holdings valuation and RTP. The way BoP records under actual changes in reserves,
respective valuation lays effect in stock that got removed. Effect of valuation works out
through the derivative differences among reserves‘ stock by the end of reference period
that gets expressed through current exchange rate added by same stock which is
expressed under exchange rate, which is subject to prevail in beginning of reference
period.
Gold (here, the monetary gold) has been marked as an asset that is owned by RBI and
has been further interpreted to remain 9995/9999 pure. All kinds of transactions related
to gold happen between RBI and relevant counterparts, like central banks of some other
countries, or among RBI and IMF or the international monetary organisations. The
value of gold is considered as reserve asset without any outstanding financial mode of
liability. As noted by extant practice, for purchase/sale of gold by RBI from places
different from central bank/international organisation; the terms of acquisition or sale
gets recorded as export (or credit)/import (or debit) in terms of goods in current account
added by contra debit/credit entries in reserve account or monetary gold. BPM, still
insist on the fact that transactions of gold with non-resident kinds of entities need to get
captured by BoP (here should not be any recorded transaction under BoP, in case
counterparty gets identified as resident). Thus, as gold gets acquired through RBI from
government, it never gets recorded and so in case of India's BoP; whilst they were
recorded primitively under the process of ―non-monetary gold‖ (or credit) in terms of
the merchandise with contra entry (or debit) under respective monetary gold (or
reserves).
62
In case of RTP from subscription for quota increase in IMF, 25 per cent gets quota paid
in terms of hard currency being integral to RTP as in India's BoP turns up as debit entry
in contrast to ―IMF Quota‖ along with credit entry or (decrease in assets) in terms of
foreign currency reserves (which is either under foreign currency assets, RBI/SDR
holdings, as per relevant instance. It is an approach that never change level related to
foreign exchange reserves since the loss of reserves, in terms of under assets of foreign
currency or SDR holdings, turns up as a fully offset through relevant increase in reserve
position under IMF as latter turns up to be a part of foreign exchange reserves. Rest 75
per cent of Indian quota gets paid through the non-negotiable as well as non-interest
modes of bearing government related securities through the way of depositing the same
in IMF Account No. 1 meant for RBI that was hereby declared as debit entry in contrast
to ―IMF quota‖ added by the contra entry in terms of ―miscellaneous or other capital
receipts‖. Thus the entry made in contrast to IMF quota (or debit) depicted the whole
amount of the quota increase paid to the IMF (both the foreign currency component and
the rupee securities issued in favour of the IMF for the domestic currency component
related to quota subscription) added by contra entry (or credit) in (i) ―reserves‖ (foreign
currency component), (ii) ―Miscellaneous or other capital receipts‖ (rupee securities as
issued by IMF) in order to declare the liabilities to IMF have added by securities which
are owned by IMF yet are held in India.
Rupee securities as has been led by IMF are considered in terms of both liabilities and
assets. This kind of approach has been pursued in conformity of earlier guidelines
declared in IMF. Still, as declared under latest edition in Manual (BPM6), component
of domestic currency of IMF quota payment that has been paid either under domestic
currency or for securities is never entailed in reference to the impact led by BoP/IIP as
per net basis, as these securities are declared as liabilities and assets. Thus component
of domestic currency under IMF quota payment is never made visible in BoP statistics
of India.
SDRs‘ allocation led by IMF for India has been included in terms of credit entry under
―other capital‖ related to Indian capital account where BoP is considered to show
increase liabilities of India towards IMF, along with counter debit entry under SDR
holdings led in reserve assets offering increase in foreign exchange reserves of India.

63
In the initial stage of current decade, India has been designated by IMF as ‗creditor
country‘ under the regulation of Financial Transaction Plan (or FTP). This is because,
India attained surplus BoP status. By this scheme, domestic currency or (securities)
initiated by IMF in terms of quota subscription converted in foreign currency, offering
share of foreign currency component (or RTP) that increased the corresponding
declination under the share related to component of domestic currency quota, without
attaining any kind of alteration for total quota subscription by interrogated country.
Participation in FTP enabled IMF for holdings of rupee under the contribution of Indian
quota with hard currency. Contribution has been forwarded by India towards FTP by
payment offered to IMF by hard currency and through debiting Government account
related to amount equivalent to rupee that gets realised through in-cashing rupee
securities offered to IMF previously for quota payment. Consequently, increase of
reserve tranche status is marked with IMF under equivalent declination of assets of
foreign currency related to RBI, in reference to unaltered level of foreign exchange.
Still, the component of rupee to IMF quota subscription decreases in correspondence to
the increased share of relevant hard currency in total quota subscription. All these
entries are relevantly reversed in the instance where India received contributions IMF
under the completion its participation under scheme that has been borrowed from
countries and repaid loans to IMF.
2.4. Indian Economy and Globalisation
Globalisation is clearly the phenomenon that has slowly shrunk the globe in more ways
than one. It opened up the doors of countries and welcomed a new era of business by
doing away with hurdles by way of rules or regulations that would restrict trade and
investment between nations. The underlying idea in globalization is to improve
economic strength by way of competitiveness, in order to develop the economy and
society simultaneously. We must also understand that there are some misconceptions
about this phenomenon and learn to identify these.
As a phenomenon, globalization has been going on for centuries now. The benefits of
tea were known throughout China and people regularly sipped tea. When this custom
spread to different parts of the world, the entire world wanted tea from China. This is
how tea started being exported from China to hundreds of places across the globe.

64
Globalisation as a concept needs to be explored in terms of time and its impact. And,
therefore it is not a very easy thing to define globalization in so many words or describe
it as being good or bad. It is, however, important that the globalization process be
perceived from a point of view that is not restricted to simply liberalization and
privatisation, something which most people tend to.
Despite both the terms being part of business vocabulary, they are distinctly different
concepts. While globalization is not restricted by time, liberalization and privatization
can be, subject to rules and regulations of the respective country or countries involved.
All these processes are inter-related since globalization as a concept exists in the space
between the two ends – liberalization and privatization.
This extract intends to study the reality and the lack of it in order to clarify certain
misconceptions and thereby improve peoples‘ knowledge of the strong potential
globalization has. Yet, it has been far from an easy task with regard to India.
India‘s relationship with globalization started with its economic reforms in 1991, after
having gone through an import substitution strategy for almost four decades. During
this period, the public sector worked its way to pump up growth in the economy,
gearing it to register better economic growth. Sadly, it did not deliver results as
expected. The idea is not to criticize the policies since it seemed to be the need of the
hour at that point in time.
From 1991, India has shown reasonable and consistent economic growth with other
macroeconomic sectors showing positive progress as well. However, the essential
sentiment of India‘s economic progress could be described as ‗uneasy‘ or ‗a
comparative failure‘.
Several nations have been on the part of export-led growth, mostly the East and South-
East Asian countries. South Korea is an excellent example in a country rising from
zilch to a healthy level of economic prosperity. Both the countries, India and South
Korea achieved their independence in 1947 and started off with relatively similar
economic conditions, having even similar per capita income. Though both the countries
commenced their independent journey with an import substitution growth strategy,

65
South Korea got on to the export-centric route to foster better growth in its weak
economy.
This country‘s performance speaks for itself. About thirty years ago, South Korea was
in line with several poorer countries of the African and Asian sub-continent in terms of
its gross domestic product (GDP). This is in stark contrast to its present figure of a
phenomenal ($13,478) which is seven times of that of India, seven times of that of
India ($2,077), 13 times of North Korea‘s GDP, and comparable to the lesser
economies of the Europe. Moreover, South Korea has assumed its responsibility as a
member of Organisation for Economic Co-operation and Development (OECD), also
regarded as the rich nations‘ club.
China is also a case in point. People of China opted for the globalization process
around the end of the 70‘s decade by practising liberalization in their own economy.
China is today regarded as an important and developed nation and is soon poised to be
a part of the World Trade Organization.
Sanjay Baru, Editor of the The Financial Express and himself a well-regarded
journalist says, ―What‘s the bottom line? There has certainly been much competition
and better fuelled growth over the past twenty years or so. But, the economy still needs
a stronger nudge to ascend on to a path of better growth for it to be able to match the
performance of its East and South-East Asian neighbours. Investment is an important
requirement at this point in time.
Though investment changes quite a few equations, it has to be effective in generating
employment and also using it to create wealth. It is futile to linger on the argument of
whether the 90s were a better decade than its predecessor or not. It would be more
worthwhile to achieve an average growth rate of 8per cent in the initial period of the
new century.
This segment also seeks to create more knowledge in the layperson about what
globalization really is and how it impacts the people of India. It also works towards
building a kind of constituency for economic reforms rather than taking a negative
thought process and looking for drawbacks in the globalization process, India would do

66
better in working out hard core solutions for its progress. As Indians, we will have to
opt for a path in a particular direction, the one that will lead us to make globalization
bring a better tomorrow especially for the poor.
Indian economy faced severe crisis during July 1991, due to the instance when foreign
currency reserves plummeted for nearly $1 billion; fiscal deficit turned high and
become unsustainable; there was the up roaring of inflation with the annual rate
assessed as 17 per cent82
; NRIs and had foreign investors lost relevant confidence over
Indian Economy. The Indian capital flew out and closed towards defaulting loans.
Added by bottlenecks inside home, there are many unforeseeable changes that were
swept away in terms of economies in Western as well as Eastern Europe, Latin
America, South East Asia and elsewhere, during the same time span. All these
economic compulsions considered within the country and abroad and declared for
complete overhauling of Indian economic policies.
2.4.1. Impact led by Globalization
Globalization in terms of national economy has been noted as many. Aspects of
globalization have intensified modes of interdependence added by competition among
economies in global market. All these economic kinds of reforms are yielded with
following benefits: (Rachman, 2008)83
Impact of globalization over India had got favourable benefits in reference to overall
economic growth rate. It has been marked as an improvement in Indian growth rate
since 1970‘s being just 3 per cent as against twice the GDP in countries such as
Indonesia, Brazil, Korea and Mexico. India‘s estimated average annual growth rate got
doubled during 80s till 5.9 per cent, yet remained lower than Korea, China and
Indonesia. Growth of Indian GDP improved its global position. Eventually the position
82
http://articles.economictimes.indiatimes.com/2012-06-23/news/32382208_1_reserves-kitty-value-of-
gold-reserves-foreign-currency-assets 83
Rachman, G. (2008), ―The political threats to globalization‖, The Financial Times, April 7, p. 11.

67
of India in global economy improved from 8th
position (1991) to 4th position (2001);
when GDP got estimated over purchasing power as per parity. (Fischer, 2006)84
From 1991 to 92; reforms program of Rao listed the growth of Indian economy by 0.9
per cent. Still, the GDP growth consequently accelerated to the level of 5.3 per cent
during 1992-93, and further to 6.2 per cent during 1993-94. Growth rate above 8 per
cent was attained during 2003-04. GDP of India grew with the rate declared in
following graph from independence. (Henry and Sasson, 2008)85
Figure 2: India GDP Annual Growth Rate
India - Growing Economy
84
Fischer, S. (2006), ―The new global economic geography‖, speech presented at The Federal Reserve
Bank of Kansas City conference on The New Economic Geography: Effects and Policy Implementations,
Jackson Hole, WY, August 25-26. 85
Henry, P.B. and Sasson, D.L. (2008), ―Capital account liberalization, real wages, and productivity‖,
National Bureau of Economic Research Working Paper No. 13880, National Bureau of Economic
Research, Cambridge, MA.

68
(1) Increased Foreign Trade: India‘s share in world trade has increased because
of the many foreign trade policies that have been opted for, by way of
globalization. While the country had only about 0.53per cent of the world trade
in 1990-91, it shifted to 0.60per cent around 1995-96 and then to 1.0per cent
around 2005-06.
(2) Increase in Foreign Investment: Because of the globalization process, not just
foreign investment but also foreign portfolio has increased considerably.
a) Foreign Direct Investment: Foreign Direct Investment is the investment
that foreign companies make so as to create fully-owned companies in a
foreign country that they will be able to manage or buy shares of, to be able
to manage such companies. One of the major characteristics of FDI or
Foreign direct Investment is that the management of the native companies is
in the hands of foreign companies or new companies are established in India
by foreign companies. The foreign investor, being the one to take the risks is
the one who is solely responsible for the profit or loss of such a company.
b) Portfolio Investment – In regard to portfolio investment, foreign
companies or foreign institutional investor (FIIs) purchase shares or
debentures of native companies though the management and control stays
with the native company itself. Foreign investment in India has shown
significant improvement. The beginning of the 90‘s saw total foreign
investment (FDI and Portfolio Investment) of about US$ 103 million. By
2005-06, this amount had increased to US$ 20,155 million. India
experienced a huge balance of payments and saw a major improvement in
its foreign exchange reserves because of the substantial increase in the
foreign investment.
(3) Increase in Foreign Collaboration: Collaboration of foreign companies with
several Indian companies is a very good outcome of the globalization process.
Collaboration agreements could be technical collaboration, financial
collaboration or even a combination of the two. Foreign technology is provided
by the foreign companies in financial collaborations. One sees several foreign

69
companies establishing several enterprises in India as collaborations with Indian
companies.
(4) Increase in Foreign Exchange Reserves- Because of the Indian economy‘s
globalization, there has also been a substantial increase in the foreign exchange
reserves. The foreign exchange reserves of India were in the range of about Rs
4,388 cr. in 1991which shot up to Rs 7, 96,000 cr. (US$ 185.1 billion). This
goes to show how foreign exchange reserves of India have increased 181 times.
(5) Expansion of Market: Globalization has not just widened the market size but
has also helped Indian business units expand their reach across the globe.
MNCs today are not at the mercy of national boundaries and work well with
companies such as Infosys, Tata Consultancy, Wipro, Tata Steel have a strong
presence in many countries all over the world.
(6) Technological Development: One of the other advantages of globalisation is
that it has facilitated the inflow of foreign technology, which is not just much
superior to that of Indian companies but is more advanced as well. Indian
business units are sure to use this modern technology and benefit greatly from it
as well.
(7) Brand Development: Globalisation has helped branded goods to reach places
far and wide. Today, people are able to exercise their choice of using branded
goods in not just durable goods but also with regard to daily use products such
as soaps, cold-drinks, tooth-paste, garments, food grains, and so on. Indian
consumers typically like to use foreign and branded items. This has further
helped in developing brands as well as their quality.
(8) Development of Service Sector: The service sector has also benefited greatly
from globalization. The entry of foreign companies has pushed indigenous
companies to step up their levels of service and quality too. One notices this
trend in several sectors like telecommunications, insurance, banking. Mobile
phones that were practically non-existent a couple of decades back are today
very cheap and popular in India.

70
(9) Increase in Employment: Globalization has fuelled employment opportunities
greatly. Foreign companies have established their production facilities and
trading network in India. This activity has improved employment chances for
Indians, e.g. many Indians are presently employed in foreign insurance
companies, mobile companies, etc.
(10) Reduction in Brain Drain: Because of the globalization phenomenon, many
multinational corporations have set up their business units in India. These
corporations offer attractive salary packages and excellent working conditions
in addition to lucrative perks to efficient, skilled Indian engineers, managers,
professionals, etc. When Indians are being offered such employment
opportunities and packages in their own country, why would they want to leave
the country? Naturally, the brain drain has reduced
(11) Improvement in Standard of Living: The advantages of globalization having
percolated down the layers of society are showing results with the standard of
living of Indian population improving.
Globalisation has thus resulted in reduced prices of different products especially
like electronic items like television, A.C., mobile phones, refrigerator, etc. now
middle-income group also uses these luxury products. Joint ventures are therefore
formed between two or more parties to undertake economic activity together. The
parties mutually decide to come together and form a new and combined entity by
both contributing equity. Naturally, they share the revenues, expenses, and control
of the enterprise in terms of their individual hold. The venture can be for one
specific project only, or a continuing business relationship such as the Fuji Xerox
joint venture. As against this, a strategic alliance does not involve any kind of
equity stake by the participants and is a much lighter arrangement.
2.4.2. Structure of Indian Economy
Globalization increased GDP added by the growth in various sectors with lots of
changed aspects. Earlier maximum portion of GDP in economy generated from primary

71
sector, yet the current service industry got devoted with maximum portion of GDP.
Service sectors turned up as growth driver in the economy added by the contribution
offered more than 57 per cent of GDP. (Winters et al., 2004)86
India has been ranked as 18th
position among international exporters of services added
by a share of 1.3 per cent in international exports. Service sectors have been expected
to offer benefit from on-going liberalization related to foreign investment regime within
the sector. ITES-BPO and Software sectors recorded exponential growth in the current
years. GDP growth rate included major sectors in economy as follows -
Table 2: Structure of the Economy (GDP in Percentage)
Country 1999 2000 2002 2003 2004 2005 2006 2007 2008 2009 2010 2011
India 5.5 6 4.3 8.3 6.2 8.4 9.2 9 7.4 7.4 10.4 7.2
Source: Reserve Bank of India Annual Report (1999-2011)
Inflows of Foreign Direct Investment
There is an increase in FDI from US$100 million during 1990-91 to US$ 5536 million
during 2004-5. Detailed foreign investment inflow is noted as below: (Frankel,, 2006)87
Current account deficit is subject to get hovered at the rate less than 1 per cent of GDP
in current years. Strength of external sector got reflected under sizeable accumulation
related to foreign exchange reserves of India by including foreign currency assets,
SDRs, gold and reserve position along with IMF reaching US$ 141.5 billion by 31st
March, 2005. The total assessment has been declared as US$1 billion within 1990–91
with payments crises under balance. Composition of debt got favourable.
86
Winters, L.A., McCulloch, N. and McKay, A. (2004), ―Trade liberalization and poverty: the evidence
so far‖, Journal of Economic Literature, Vol. 42 No. 1, p. 72-115. 87
Frankel, J. (2006), ―What do economists mean by globalization?‖, paper presented at the Academic
Consultants Meeting Organized by the Board of Governors of the Federal Reserve System, Washington,
DC, September 28.

72
Figure 3: Foreign Direct investment inflows (in US$ Million)
Source: http://www.tradingeconomics.com/india/foreign-direct-investment-net-
inflows-per cent-of-gdp-wb-data.html
There was short-term debt that got amounted for 3.5 per cent from total external debt
added by concessional debt amounting till 36.5 per cent of total debt. Burden of
external debt turned up sustainable as per the range of indebtedness measures. Both the
determined debt service payments in terms of being proportionate to current receipts
and external ratio of debt-to-GDP fell steadily in 1990s, and in the current position, it is
about 17 per cent and 22 per cent, respectively. ((Das, 2008a)88
88
Das, D.K. (2008a), ―Repositioning the Chinese economy on the global economic stage‖, International
Review of Economics, Vol. 55 No. 4, p. 401-17.