Embed Size (px)
Citation preview
Chapter 2 — Area Description and Resources
This chapter describes the biological, cultural, and so-cioeconomic resources of the Rainwater Basin.
Biological EnvironmentThis section discusses climate; climate change; adapta-tion, mitigation, and engagement; geological resources; habitat; and wildlife species of the Rainwater Basin.
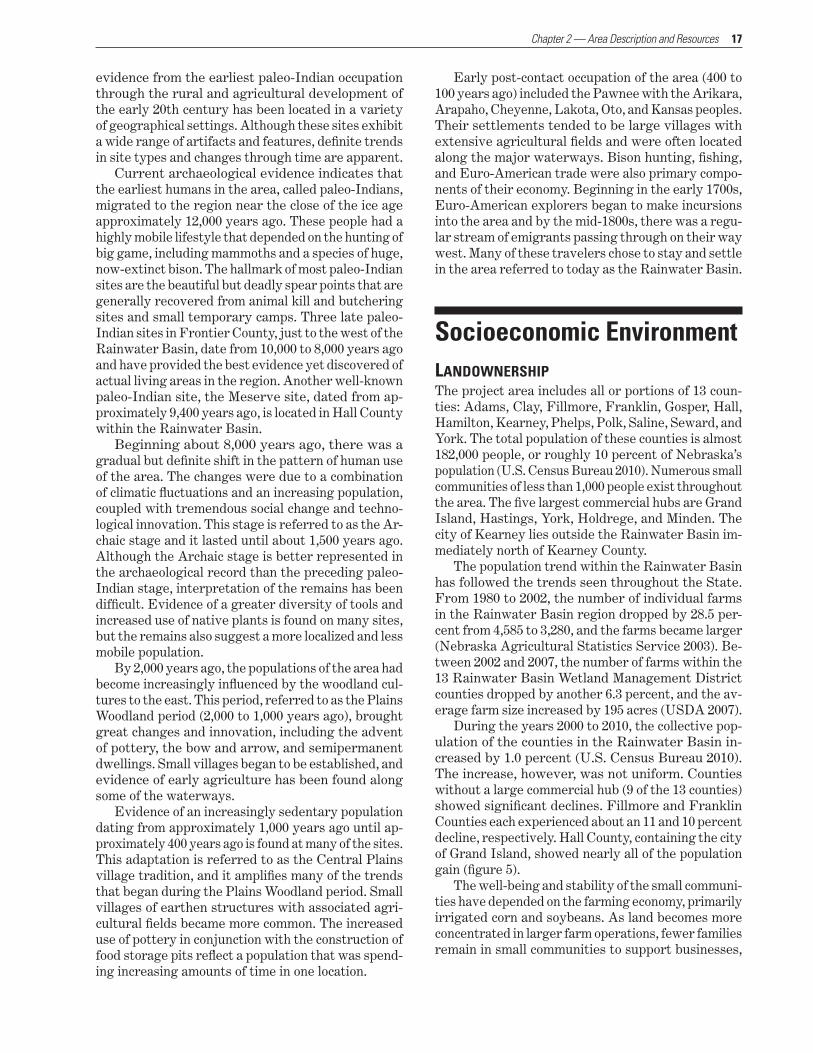
CLIMATEThe region’s climate is semiarid, with annual precipi-tation ranging from 21 to 28 inches from the west to the east. Annual evaporation for small bodies of wa-ter averages 46 inches, and about 77 percent of that amount is lost from May through October. Most of the precipitation occurs in the springtime and during sum-mer thunderstorms. Heavy rains fill the wetlands, but quickly dry in a matter of a few weeks. Wind scouring of wetland bottoms has removed the finer silts and loam soils, while the heavier silt clays remain in the wetland bottoms. In some wetlands, the impervious clay layer that has formed extends as deep as 72 inches.
CLIMATE CHANGE Current climate change projections for the Great Plains are for warmer temperatures and increased precipitation. The increase in precipitation is expected to be quite variable across the Great Plains, although it is expected to be less than what is needed to offset the anticipated increase in temperatures. The result will likely be warmer, drought-like conditions. Intense precipitation events are projected to increase, caus-ing more flooding, runoff, pollution, and soil erosion problems; however, droughts are also expected to oc-cur more frequently. The problems caused by climate change will be further compounded by invasive spe-cies that will be able to adapt quickly to fluctuating extreme water conditions.
ADAPTATION, MITIGATION, AND ENGAGEMENTThe Service’s strategic response to climate change involves three core strategies: adaptation, mitigation, and engagement (USFWS 2009). Through adaptation, the impacts of climate change on wildlife may be re-duced by conserving resilient habitats. The Rainwater Basin Expansion Project will provide an anticipatory,
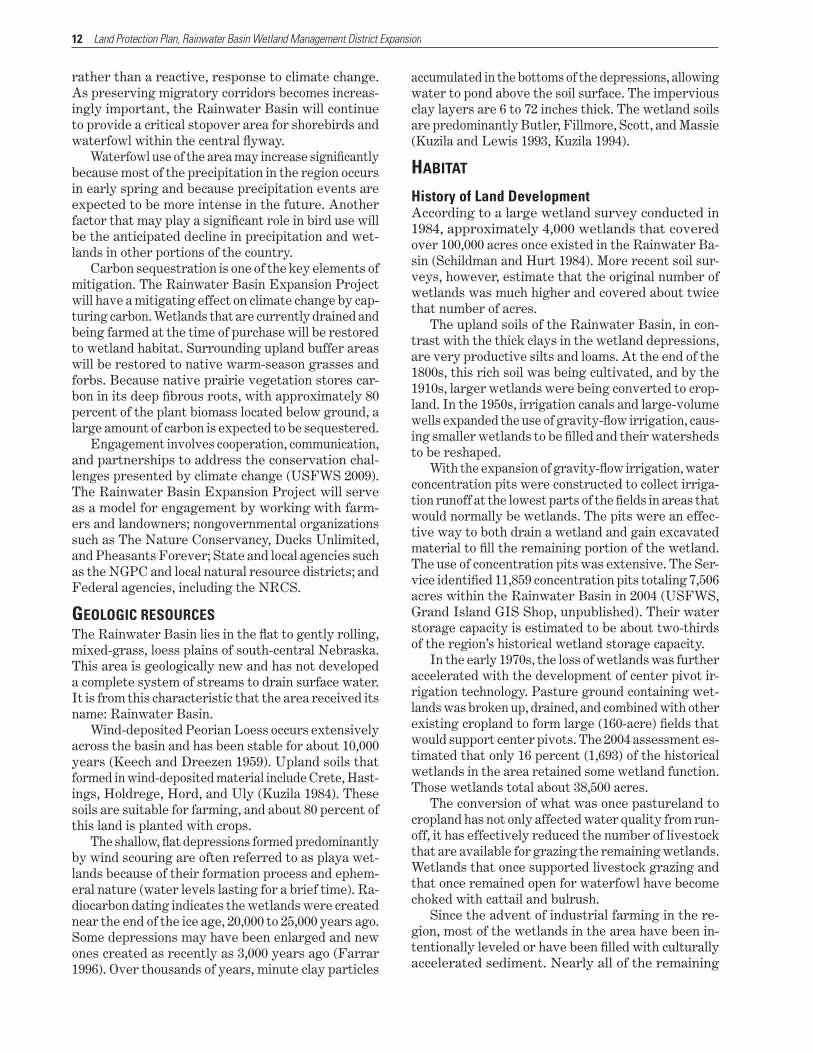
Mallards using a partially thawed wetland during their annual spring migration.
US
FW
S
12 Land Protection Plan, Rainwater Basin Wetland Management District Expansion
rather than a reactive, response to climate change. As preserving migratory corridors becomes increas-ingly important, the Rainwater Basin will continue to provide a critical stopover area for shorebirds and waterfowl within the central flyway.
Waterfowl use of the area may increase significantly because most of the precipitation in the region occurs in early spring and because precipitation events are expected to be more intense in the future. Another factor that may play a significant role in bird use will be the anticipated decline in precipitation and wet-lands in other portions of the country.
Carbon sequestration is one of the key elements of mitigation. The Rainwater Basin Expansion Project will have a mitigating effect on climate change by cap-turing carbon. Wetlands that are currently drained and being farmed at the time of purchase will be restored to wetland habitat. Surrounding upland buffer areas will be restored to native warm-season grasses and forbs. Because native prairie vegetation stores car-bon in its deep fibrous roots, with approximately 80 percent of the plant biomass located below ground, a large amount of carbon is expected to be sequestered.
Engagement involves cooperation, communication, and partnerships to address the conservation chal-lenges presented by climate change (USFWS 2009). The Rainwater Basin Expansion Project will serve as a model for engagement by working with farm-ers and landowners; nongovernmental organizations such as The Nature Conservancy, Ducks Unlimited, and Pheasants Forever; State and local agencies such as the NGPC and local natural resource districts; and Federal agencies, including the NRCS.
GEOLOGIC RESOURCESThe Rainwater Basin lies in the flat to gently rolling, mixed-grass, loess plains of south-central Nebraska. This area is geologically new and has not developed a complete system of streams to drain surface water. It is from this characteristic that the area received its name: Rainwater Basin.
Wind-deposited Peorian Loess occurs extensively across the basin and has been stable for about 10,000 years (Keech and Dreezen 1959). Upland soils that formed in wind-deposited material include Crete, Hast-ings, Holdrege, Hord, and Uly (Kuzila 1984). These soils are suitable for farming, and about 80 percent of this land is planted with crops.
The shallow, flat depressions formed predominantly by wind scouring are often referred to as playa wet-lands because of their formation process and ephem-eral nature (water levels lasting for a brief time). Ra-diocarbon dating indicates the wetlands were created near the end of the ice age, 20,000 to 25,000 years ago. Some depressions may have been enlarged and new ones created as recently as 3,000 years ago (Farrar 1996). Over thousands of years, minute clay particles
accumulated in the bottoms of the depressions, allowing water to pond above the soil surface. The impervious clay layers are 6 to 72 inches thick. The wetland soils are predominantly Butler, Fillmore, Scott, and Massie (Kuzila and Lewis 1993, Kuzila 1994).
HABITAT
History of Land Development According to a large wetland survey conducted in 1984, approximately 4,000 wetlands that covered over 100,000 acres once existed in the Rainwater Ba-sin (Schildman and Hurt 1984). More recent soil sur-veys, however, estimate that the original number of wetlands was much higher and covered about twice that number of acres.
The upland soils of the Rainwater Basin, in con-trast with the thick clays in the wetland depressions, are very productive silts and loams. At the end of the 1800s, this rich soil was being cultivated, and by the 1910s, larger wetlands were being converted to crop-land. In the 1950s, irrigation canals and large-volume wells expanded the use of gravity-flow irrigation, caus-ing smaller wetlands to be filled and their watersheds to be reshaped.
With the expansion of gravity-flow irrigation, water concentration pits were constructed to collect irriga-tion runoff at the lowest parts of the fields in areas that would normally be wetlands. The pits were an effec-tive way to both drain a wetland and gain excavated material to fill the remaining portion of the wetland. The use of concentration pits was extensive. The Ser-vice identified 11,859 concentration pits totaling 7,506 acres within the Rainwater Basin in 2004 (USFWS, Grand Island GIS Shop, unpublished). Their water storage capacity is estimated to be about two-thirds of the region’s historical wetland storage capacity.
In the early 1970s, the loss of wetlands was further accelerated with the development of center pivot ir-rigation technology. Pasture ground containing wet-lands was broken up, drained, and combined with other existing cropland to form large (160-acre) fields that would support center pivots. The 2004 assessment es-timated that only 16 percent (1,693) of the historical wetlands in the area retained some wetland function. Those wetlands total about 38,500 acres.
The conversion of what was once pastureland to cropland has not only affected water quality from run-off, it has effectively reduced the number of livestock that are available for grazing the remaining wetlands. Wetlands that once supported livestock grazing and that once remained open for waterfowl have become choked with cattail and bulrush.
Since the advent of industrial farming in the re-gion, most of the wetlands in the area have been in-tentionally leveled or have been filled with culturally accelerated sediment. Nearly all of the remaining

13 Chapter 2 — Area Description and Resources
wetlands have been affected by surrounding land use. One of the more serious problems is the reduction of the ability of the watersheds to provide enough water to allow the wetlands to function naturally. As more upland has been converted to cropland, sedimentation caused by runoff has increased. In the last 40 years, the use of chemicals and fertilizers in crop production has brought pesticides and high levels of nutrients into the wetlands.
Wetlands in larger watersheds used to retain wa-ter on a semipermanent basis. Now with reshaping of the landscape, creation of roads and ditches, sedi-mentation, and cultivation practices, even unaltered wetlands cannot function properly and most of them are retaining water for shorter and shorter periods.
Past Wetland Protection and Land Use within WatershedsWetland drainage and conversion is the main threat to the Rainwater Basin wetlands. Over the past de-cade, wetland loss from drainage and filling has been extensive. Wetland drainage was widespread even before efforts were made to determine the number of wetlands that existed in the region.
Estimates of the number of historical wetlands are based primarily on soils maps, which show the extent of hydric soils on the landscape. Using this method, the estimate is that there were 11,000 historical wetlands totaling 204,000 acres (USFWS, Grand Island GIS Shop, unpublished). GIS analysis and high-resolution aerial photography now allow for an accurate measure of wetland acres. Current estimates are that 38,500 acres of wetlands remain. The number of functional wetlands has declined to 1,693 (2004 data, USFWS, Grand Island GIS Shop, unpublished). This is about 16 percent of the historical number.
Each year, the slow degradation of wetlands con-tinues. Shallow depressions that are being farmed are slowly filling with sediment from the adjacent uplands. In addition, years of farming and pesticide application have adversely affected native vegetation and inver-tebrates. Farming practices such as no-till farming reduce the amount of soil erosion, but may also reduce the amount of water runoff reaching the depression.
Most of the larger wetlands have been fully or partially drained. Those that have retained some functionality are slowly being subjected to the same forces as the smaller depressions: sedimentation, agricultural chemical runoff, and decreased surface water running into the wetland. Years of no farming or grazing encourage invasion by reed canarygrass, cattail, bulrush, and trees. In general, lack of grazing, burning, and disturbance greatly reduces the value of the wetland for migratory birds. Wetlands that retain a higher level of functionality still capture enough of the watershed’s runoff to provide aquatic vegetation, invertebrates, and water for migrating birds, but
these remaining wetlands are being subjected to the same adverse effects as the more disturbed wetlands.
Many of the problems affecting the wetlands go beyond what is happening directly within a wetland to the surrounding land uses. These problems include intense cultivation, land leveling, large livestock con-finement areas, and lack of grazing livestock.
Cultivation of upland areas increases soil erosion and sedimentation of wetlands, a process that has been going on in some areas for more than 150 years. Runoff and erosion also transport pesticides and ex-cessive levels of nutrients to the wetlands. In some larger watersheds, seasonally heavy rains occur with enough intensity that residual cornstalks are trans-ported to ditches and waterways. Restoration work on these wetlands often includes sediment removal, especially near the fluvial area of waterways.
As discussed earlier, land leveling began with the conversion from dryland farming to gravity-flow ir-rigation. Effective gravity-flow irrigation requires a uniform, gentle slope across the field to allow water released on the upper end of the field to flow gently to-ward the lower end. With this method, any wetland or depression in the middle of the field that pooled water is filled. The common practice was to dig large water concentration pits to collect any water that reached the lower end of the field. Soil material removed from the pit was used to fill the remaining portion of the wetland to allow more area for farming. The result of this practice was that only the larger wetlands that could not be economically filled or drained remained as wetlands.
An additional threat to some of the wetlands is nutri-ent and waste runoff from large livestock confinement areas. Both economic conditions and the availability of cheap corn for feed encouraged the development of these facilities. Many were built on poorer, steeper land, often in close proximity to a wetland. Animal waste from these operations is hauled to surround-ing fields. Although State regulations control most of the contaminant concerns, runoff from heavy rain events as well as operator violations sometimes carry waste and chemicals to wetlands. Since the wetlands are within a closed drainage, the nutrients and pol-lutants are not flushed out but instead accumulate within the wetlands.
The functioning of many of the remaining wetlands has deteriorated. Sedimentation has resulted in reduced water depth, loss of portions of the watershed’s run-off has shifted wetlands toward more seasonal water retention, aquatic vegetation has increased, and, with the absence of grazing livestock, the wetlands have become choked with monotypic stands of cattail, bul-rush, and reed canarygrass.
The conversion of wetlands and grassland has also caused birds to concentrate into fewer areas, increas-ing the risk of disease outbreaks and competition for

14 Land Protection Plan, Rainwater Basin Wetland Management District Expansion
natural foods. Waste grain has replaced much of the natural foods in waterfowl diets. Although corn meets the caloric requirements, it is deficient in many of the nutrients found in natural foods (Baldassare and Bolen 1994, Krapu et al. 2004).
There are many factors driving the continued conversion of wetlands within the Rainwater Basin. The assumption is that the wetlands that were easy and economically feasible to drain have already been drained and converted. Each year, however, additional wetlands are lost. Some of the common causes for the continuing loss of wetlands are changes in Farm Bill regulations, commodity prices, increased crop insur-ance subsidies, and new irrigation and farming tech-nologies. Commodity prices and crop insurance serve as a safety net for farming the more risky lands. New irrigation technologies allow for chemigation, control of water delivery, and easier access across wet areas and steeper slopes. No-till farming allows for more eco-nomical farming in more arid areas than was possible in years past. In recent years, impending moratoriums on groundwater development have stimulated devel-opers and producers to convert more land to cropland.
Property taxes, low livestock prices, and low pro-duction rates from dryland farming cause landown-ers to continually look for ways to make every acre financially productive, reducing the incentive to keep a privately owned wetland.
Current Protection Status Service acquisition has focused on purchase and protec-tion of the larger wetlands. Over the decades, as the smaller surrounding wetlands have been lost, the wet-lands purchased by the Service have become isolated. In some portions of the Rainwater Basin, acquisition needs to focus on protecting the smaller wetlands that make up a complex, while in other portions a larger core wetland needs to be restored in order to create a complex. Figure 4 shows the change in spatial distri-bution of wetlands throughout the region (USFWS, Grand Island GIS Shop, unpublished).
Aerial surveys were conducted every spring from 2000 to 2008 by the Rainwater Basin station biologist to document the amount of migratory bird habitat available. A total of 17,984 acres of public wetlands was surveyed. The average amount of habitat contain-ing water during this 8-year period was 5,582 acres. This means that an average of 32 percent of the pub-lic wetland acres were suitable migration habitat. Some of those wetlands that provided suitable habi-tat were supplemented with groundwater pumped by the Rainwater Basin Wetland Management District and the NGPC.
Groundwater In most areas of the Rainwater Basin, groundwater has little or no influence on wetland water levels. The majority of the groundwater in the region is located more than 50 feet underground and in some
areas the groundwater is more than 400 feet deep. One area east of the Tri-County canal has groundwater levels that are less than 50 feet deep due to artificial groundwater mounds that have developed near the surface (Ekstein and Hygnstrom 1996).
The use of center pivot irrigation in the region since the early 1970s has placed a lot of demand on the groundwater underlying Rainwater Basin. Irriga-tion, compounded by extensive drought, has caused the State legislature to pass legislation to help control groundwater declines. Only the extreme western edge of the Rainwater Basin Wetland Management District lies within an over-appropriated natural resource dis-trict. Some of the natural resource districts located within the Rainwater Basin, however, have placed a moratorium on new wells and are requiring stricter monitoring of pumping.
The Rainwater Basin wetlands contribute to groundwater recharge. Percolation occurs as macro-pore flow through desiccation cracks that form during dry conditions (Wilson 2010). However, soil percola-tion decreases as the clays expand and the desiccation cracks close (Wood 2000, Wilson 2010). Research from playa lakes in Texas and New Mexico has shown simi-lar recharge characteristics (Wood 2000).
Artificially pumping groundwater into the wet-lands has made a dramatic difference in the amount of available habitat on WPAs. The average amount of suitable habitat for WPA wetlands that were not pumped was 22 percent of the total wetland acres. For WPA wetlands that were pumped, the average amount of suitable habitat was 39 percent of the total wetland acres.
WILDLIFERainwater Basin serves as a critical resting and feed-ing area for millions of waterfowl during spring mi-gration. It is estimated that 7.5 million ducks and 2.1 million geese use the area each spring. Gersib et al. (1989) documented that 50 percent of the mid-continent mallards and 30 percent of the continental northern pintails migrate through the area during the spring. Nearly 90 percent of the mid-continent population of greater white-fronted geese has been documented to use this region during their spring migration.
A total of 329 species of birds has been observed within the Rainwater Basin, including 41 species of shorebirds and 35 species of waterfowl. Between 200,000 and 300,000 shorebirds migrate through the area in the spring. Common grassland species include north-ern harrier, northern bobwhite, ring-necked pheasant, greater prairie-chicken, dickcissel, western meadow-lark, bobolink, field sparrow, and grasshopper sparrow.
Spring migration in the area usually starts with a buildup of Canada geese on the Platte River until the Rainwater Basin wetlands begin to thaw. Snow geese, greater white-fronted geese, and mallards begin to

15 Chapter 2 — Area Description and Resources
Figure 4. Historical (top) and current (bottom) wetland distribution and abundance (blue area) within the Rainwater Basin.

16 Land Protection Plan, Rainwater Basin Wetland Management District Expansion
peak by mid- to late February. In early March, north-ern pintail numbers peak, followed by Ross’s geese and green-winged teal. The remaining divers and puddle ducks usually peak during mid- to late March.
Most shorebirds pass through between April 15 and May 15. According to Jorgensen (2004), the most common spring shorebird migrants are black-bellied plover, American golden-plover, semipalmated plover, greater yellowlegs, lesser yellowlegs, willet, upland sandpiper, Hudsonian godwit, dunlin, white-rumped sandpiper, Baird’s sandpiper, semipalmated sandpiper, least sandpiper, stilt sandpiper, short-billed dowitcher, long-billed dowitcher, buff-breasted sandpiper, Wil-son’s snipe, and Wilson’s phalarope. Rainwater Basin hosts the largest known concentration of buff-breasted sandpipers during spring migration (Jorgensen 2007). In the late summer, common migrant shorebirds are greater and lesser yellowlegs, solitary sandpiper, upland sandpiper, pectoral sandpiper, semipalmated sandpiper, least sandpiper, stilt sandpiper, long-billed dowitcher, and Wilson’s snipe.
Rainwater Basin has been recognized as a landscape of hemispheric importance by the Western Hemisphere Shorebird Reserve Network. Rainwater Basin has also been identified as a key area for habitat conservation in Bird Conservation Region #19.
Peregrine falcons frequent the wetlands during peak shorebird migration periods. Prairie falcons, on the other hand, are most numerous in late winter when horned larks and meadowlarks are most com-mon. Merlins are primarily winter visitors and spring migrants (Johnsgard 1997). Bald eagles are most com-mon during peak waterfowl migration. Burrowing owls nest on isolated prairie dog towns.
Threatened and Endangered SpeciesThree species that are listed under the Nebraska Non-game and Endangered Species Conservation Act and the Federal Endangered Species Act use the Rainwa-ter Basin wetlands during migration: the State and Federally endangered whooping crane and least tern, and the State and Federally threatened piping plover.
Forty-two percent of confirmed whooping crane observations in Nebraska have been at Rainwater Basin wetlands (Richert 1999). Most of these sight-ings have occurred during the first 2 weeks of April or from late October through mid-November. Piping plovers are rarely seen on Rainwater Basin wetlands due to their size and the number of other shorebirds that would be using mudflat habitats in late April through mid-May (Johnsgard 1997). Least terns have even been documented at some basins, although their occurrence in the Rainwater Basin is rare.
Other species that are proposed or are candidates for listing under the State and Federal Endangered Species Acts or are species of concern that use the Rainwater Basin are northern harrier, Swainson’s
hawk, ferruginous hawk, long-billed curlew, black tern, short-eared owl, and Sprague’s pipit.
Mammals Large mammals that are common to the region are those usually associated with grasslands of the Great Plains. They include white-tailed deer, coyote, raccoon, striped skunk, eastern cottontail, American badger, and Virginia opossum. Mule deer have occasionally been seen in the western portion of the Rainwater Basin. Muskrat and mink may occur during wetter years but their populations have dropped dramatically with changes in land use and wetlands. Isolated prairie dog towns are scattered throughout the region; most of them are smaller than 40 acres and located on public lands. Common small mammals include thirteen-lined ground squirrel, northern and plains pocket gophers, Ord’s kangaroo rat, meadow jumping mouse, meadow vole, northern grasshopper mouse, and white-footed mouse. Less common mammals are red fox, black-tailed jackrabbit, woodchuck, Franklin’s ground squirrel, and eastern fox squirrel.
Reptiles and AmphibiansSemipermanent wetlands provide habitat for painted and snapping turtles. Ornate box turtles may be found in grassland areas. Western garter snakes, bull snakes, and eastern yellowbelly racers are fairly common. Western hog-nosed snakes are less common and prefer dry sandy prairies. Smooth green snake and redbelly snake are rare in the region. The lesser earless lizard may occur in open sandy soil with sparse vegetation, while the six-lined racerunner can be found in both lowland and upland sites.
Amphibians that occur in the Rainwater Basin in-clude plains spadefoot toad, Woodhouse’s toad, Great Plains toad, Blanchard’s cricket frog, boreal chorus frog, bullfrog, gray treefrog, plains leopard frog, and tiger salamander.
Fisheries Due to the hydrology of the wetlands within the Rain-water Basin, there are currently no viable fisheries. Two native Missouri River basin cyprinids, the shoal chub and plains minnow, are of concern but have no legal protected status in Nebraska. Other species in the area that are of concern and interest to the Na-tional Fish Habitat Action Plan partnerships are cat-fish, sunfish, darters, catastomids, and other minnows.
Cultural ResourcesArchaeological features and Native dwelling remains representing 12,000 years of human occupation have been found in the Rainwater Basin. Although there have been few formal investigations done in the area,
17
evidence from the earliest paleo-Indian occupation through the rural and agricultural development of the early 20th century has been located in a variety of geographical settings. Although these sites exhibit a wide range of artifacts and features, definite trends in site types and changes through time are apparent.
Current archaeological evidence indicates that the earliest humans in the area, called paleo-Indians, migrated to the region near the close of the ice age approximately 12,000 years ago. These people had a highly mobile lifestyle that depended on the hunting of big game, including mammoths and a species of huge, now-extinct bison. The hallmark of most paleo-Indian sites are the beautiful but deadly spear points that are generally recovered from animal kill and butchering sites and small temporary camps. Three late paleo-Indian sites in Frontier County, just to the west of the Rainwater Basin, date from 10,000 to 8,000 years ago and have provided the best evidence yet discovered of actual living areas in the region. Another well-known paleo-Indian site, the Meserve site, dated from ap-proximately 9,400 years ago, is located in Hall County within the Rainwater Basin.
Beginning about 8,000 years ago, there was a gradual but definite shift in the pattern of human use of the area. The changes were due to a combination of climatic fluctuations and an increasing population, coupled with tremendous social change and techno-logical innovation. This stage is referred to as the Ar-chaic stage and it lasted until about 1,500 years ago. Although the Archaic stage is better represented in the archaeological record than the preceding paleo-Indian stage, interpretation of the remains has been difficult. Evidence of a greater diversity of tools and increased use of native plants is found on many sites, but the remains also suggest a more localized and less mobile population.
By 2,000 years ago, the populations of the area had become increasingly influenced by the woodland cul-tures to the east. This period, referred to as the Plains Woodland period (2,000 to 1,000 years ago), brought great changes and innovation, including the advent of pottery, the bow and arrow, and semipermanent dwellings. Small villages began to be established, and evidence of early agriculture has been found along some of the waterways.
Evidence of an increasingly sedentary population dating from approximately 1,000 years ago until ap-proximately 400 years ago is found at many of the sites. This adaptation is referred to as the Central Plains village tradition, and it amplifies many of the trends that began during the Plains Woodland period. Small villages of earthen structures with associated agri-cultural fields became more common. The increased use of pottery in conjunction with the construction of food storage pits reflect a population that was spend-ing increasing amounts of time in one location.
Early post-contact occupation of the area (400 to 100 years ago) included the Pawnee with the Arikara, Arapaho, Cheyenne, Lakota, Oto, and Kansas peoples. Their settlements tended to be large villages with extensive agricultural fields and were often located along the major waterways. Bison hunting, fishing, and Euro-American trade were also primary compo-nents of their economy. Beginning in the early 1700s, Euro-American explorers began to make incursions into the area and by the mid-1800s, there was a regu-lar stream of emigrants passing through on their way west. Many of these travelers chose to stay and settle in the area referred to today as the Rainwater Basin.
Socioeconomic EnvironmentLANDOWNERSHIPThe project area includes all or portions of 13 coun-ties: Adams, Clay, Fillmore, Franklin, Gosper, Hall, Hamilton, Kearney, Phelps, Polk, Saline, Seward, and York. The total population of these counties is almost 182,000 people, or roughly 10 percent of Nebraska’s population (U.S. Census Bureau 2010). Numerous small communities of less than 1,000 people exist throughout the area. The five largest commercial hubs are Grand Island, Hastings, York, Holdrege, and Minden. The city of Kearney lies outside the Rainwater Basin im-mediately north of Kearney County.
The population trend within the Rainwater Basin has followed the trends seen throughout the State. From 1980 to 2002, the number of individual farms in the Rainwater Basin region dropped by 28.5 per-cent from 4,585 to 3,280, and the farms became larger (Nebraska Agricultural Statistics Service 2003). Be-tween 2002 and 2007, the number of farms within the 13 Rainwater Basin Wetland Management District counties dropped by another 6.3 percent, and the av-erage farm size increased by 195 acres (USDA 2007).
During the years 2000 to 2010, the collective pop-ulation of the counties in the Rainwater Basin in-creased by 1.0 percent (U.S. Census Bureau 2010). The increase, however, was not uniform. Counties without a large commercial hub (9 of the 13 counties) showed significant declines. Fillmore and Franklin Counties each experienced about an 11 and 10 percent decline, respectively. Hall County, containing the city of Grand Island, showed nearly all of the population gain (figure 5).
The well-being and stability of the small communi-ties have depended on the farming economy, primarily irrigated corn and soybeans. As land becomes more concentrated in larger farm operations, fewer families remain in small communities to support businesses,
Chapter 2 — Area Description and Resources

18 Land Protection Plan, Rainwater Basin Wetland Management District Expansion
schools, and churches. The trend is for people to move to larger nearby commercial hubs.
Approximately 1.6 percent of land area in Nebraska is in either State or Federal ownership (U.S. Census Bureau 1991). Only Iowa and Kansas have less gov-ernment land ownership by percentage. Within the Rainwater Basin, 79.9 percent of the land is cropland and 10.5 percent is pasture or CRP lands, making agriculture the dominant land use (USFWS, Grand Island GIS Shop, unpublished). Roads or communi-ties make up 5.4 percent of the land area. Nonfarmed wetlands represent 1 percent of the land use. Fish and Wildlife Service lands within the region total 23,855 acres, representing about 0.6 percent of the region.
Clay County, with the U.S. Department of Agri-culture’s 35,000-acre Roman L. Hruska Meat Animal Research Center, has a higher percentage of Federal ownership than the other Rainwater Basin counties. Located west of Clay Center, Nebraska, the research center is the largest Federally owned property in the project area. See the Habitat section in chapter 3 for additional information about agricultural development.
Figure 5. Change in county population size in the Rainwater Basin from the 2000 to 2010 census.
PROPERTY TAXProperty tax is assessed on each property owner within each county. The amount is derived from the value of each parcel of land, based on the reasonable highest and most probable use. The assessed value of agricultural land is no more than 75 percent of market value (NEDOR 2011).
The inflation in land value in recent years has caused the taxes on agricultural land to go up disproportion-ately compared with nonagricultural property, such as homes within communities. For counties with low populations and few commercial properties, agricultural lands may represent well over half of the county’s to-tal assessed value. As costs in low-population counties continue to go up, populations go down, and because no new industries are being created, agricultural land claims a higher percentage of the county’s total as-sessed value, placing more of the burden of financing the county on the shoulders of farmers.
The Refuge Revenue Sharing Act provides for payments to counties by the Service in lieu of taxes. Revenues for these payments are derived from the sale of products from refuges, including animals, timber, and minerals, or from leases and other privi-leges. If there is not enough money in the National Wildlife Refuge Fund to cover payments, Congress is authorized to appropriate money to make up the dif-ference. If the amount that Congress appropriates is not enough, the units of local government receive a pro-rata share. Payment is calculated three different ways, with the amount due being the highest of the three methods. The three methods are: 0.75 percent of the appraised property value, 25 percent of the net receipts produced on the property, or $0.75 per acre. If the funds in the special Treasury account fall short of 100 percent payment, each county receives payment at a lower percentage. In 2009, refuge revenue sharing

19 Chapter 2 — Area Description and Resources
payment to Rainwater Basin counties averaged only 32.3 percent ($90,983) of full payment.
PUBLIC USE AND WILDLIFE-DEPENDENT RECREATIONAL ACTIVITIESFor much of the past century, access to private prop-erty was relatively easy to obtain. Most of Nebraska’s population was somehow connected to the land, either by family or by acquaintances. Hunting was seen as recreation that provided little opportunity for reve-nue to the landowner, and access was freely granted as a neighborly gesture. In the past few decades, this trend has changed. Urban populations are no longer closely connected to the land, and access to private land is more commonly being denied or allowed only on a fee basis.
The result is that the public is relying more on pub-lic lands for wildlife-dependent recreation. Within the Rainwater Basin, 32 wildlife management areas are managed by the NGPC, and 59 WPAs are managed by the Service. A total of 31,823 acres is available for public use (USFWS, Grand Island GIS Shop). Pheas-ant hunting is the most common recreational activity, followed by waterfowl hunting and birdwatching. It is estimated that 81,880 use-days are spent annually on waterfowl and upland bird hunting on State and Federal properties in the Rainwater Basin (Mark Vrtiska, biologist, NGPC; personal communication; May 12, 2010).