Embed Size (px)
Citation preview

Chapter 2Chapter 2
Basic Concepts of
Structural Reliability Theory
Chapter 2: Basic Concepts of Structural Reliability Theory Chapter 2: Basic Concepts of Structural Reliability Theory
2.2 Failure Probability of Structures
2.3 Reliability Index of Structures
2.1 Definitions of Structural Reliability
2.5 Relationship between Reliability Index and Safety Factor
Contents
2.4 Geometric Meaning of Reliability Index

2.1 Definitions of Structural Reliability
Chapter 2Chapter 2 Basic Concepts of Basic Concepts of Structural Reliability TheoryStructural Reliability Theory
2.1 Definitions of Structural Reliability 2.1 Definitions of Structural Reliability ……11
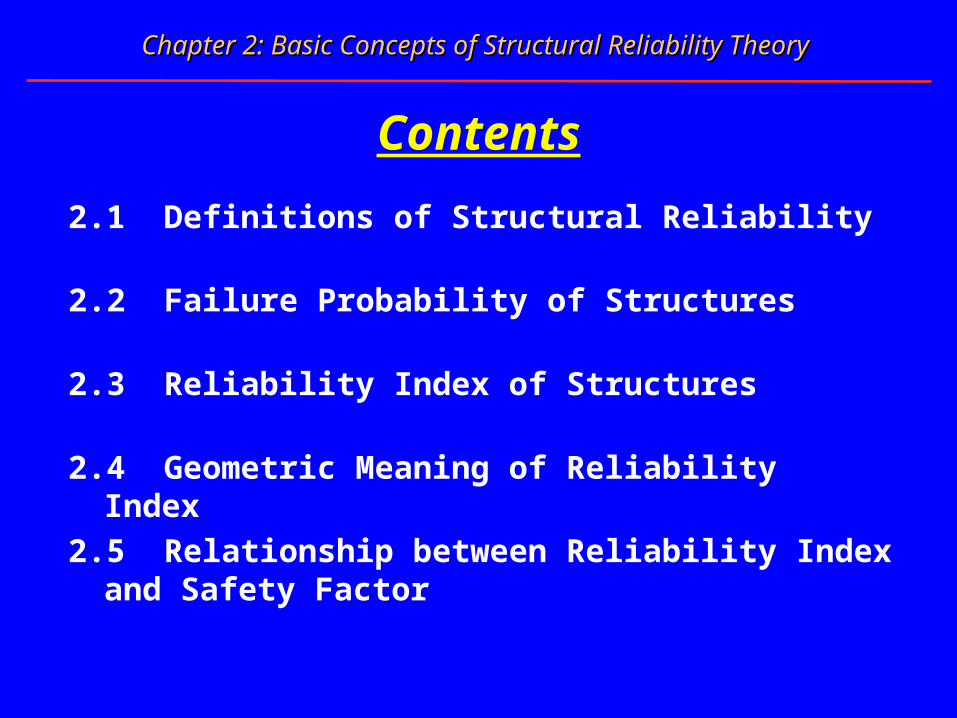
Structural Reliability is the ability of a structure or structural element to fulfill the specified performance requirements under the prescribed conditions during the prescribed time.
2.1.1 Reliability of Structures
1. The Prescribed Time– the prescribed time = the design working life– the design working life the design reference period
• Design working life is assumed period for which a structure or a structural element is to be be used for its intended purpose without major repair being necessary.
• Design reference period is a chosen period of time which is used as a basis for assessing values of variable actions, time-dependent material properties, etc.
2.1 Definitions of Structural Reliability 2.1 Definitions of Structural Reliability ……22
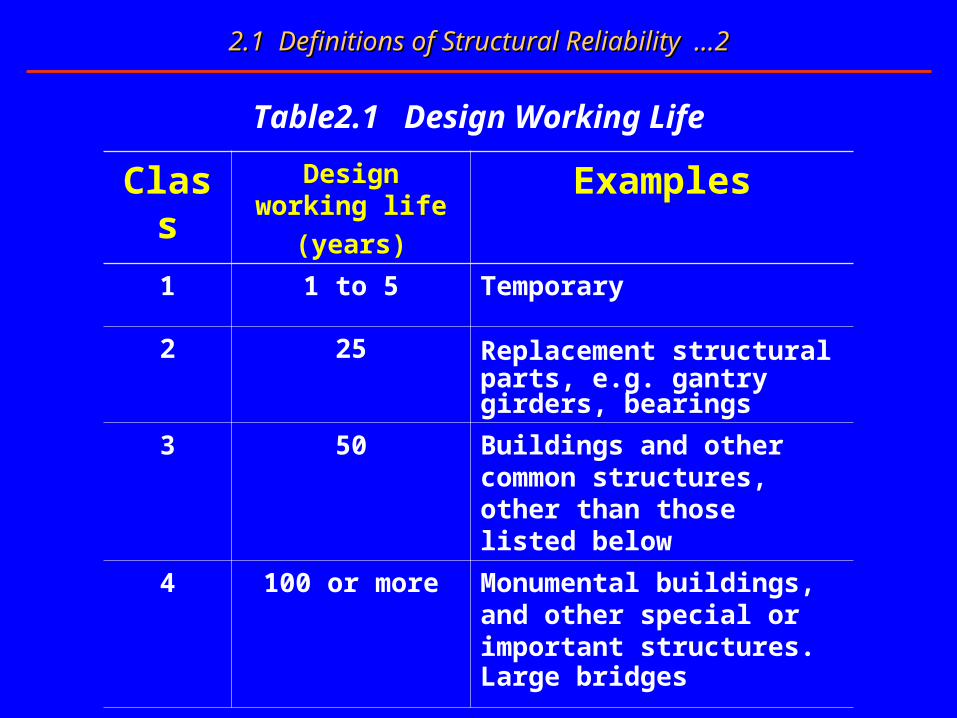
Table2.1 Design Working Life
Class Design working life
(years)
Examples
1 1 to 5 Temporary
2 25 Replacement structural parts, e.g. gantry girders, bearings
3 50 Buildings and other common structures, other than those listed below
4 100 or more Monumental buildings, and other special or important structures.Large bridges
2.1 Definitions of Structural Reliability 2.1 Definitions of Structural Reliability ……33
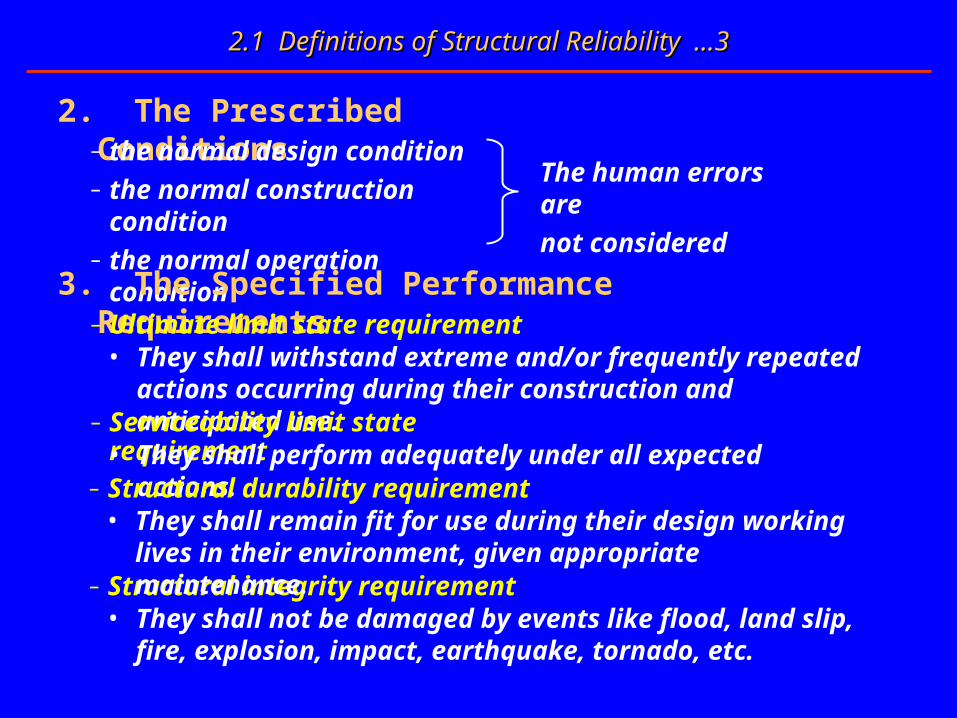
2. The Prescribed Conditions– the normal design condition– the normal construction condition– the normal operation condition
The human errors are
not considered
3. The Specified Performance Requirements– Ultimate limit state requirement
• They shall withstand extreme and/or frequently repeated actions occurring during their construction and anticipated use.
– Serviceability limit state requirement• They shall perform adequately under all expected actions.
– Structural integrity requirement• They shall not be damaged by events like flood, land slip, fire,
explosion, impact, earthquake, tornado, etc.
– Structural durability requirement• They shall remain fit for use during their design working lives in
their environment, given appropriate maintenance.
2.1 Definitions of Structural Reliability 2.1 Definitions of Structural Reliability ……44
A limit state is a state beyond which a structure or part of it no longer satisfies the design performance requirements.
2.1.2 Limit States of Structures
1. Definition of Limit State
– The concept of a limit state is used to help define failure in the context of structural reliability theory.
– We could say that a structure fails if it cannot perform its intended function, or violation of a limit state.
– A limit state is a boundary between desired and undesired performance of a structure.
– The boundary between desired and undesired performance of a structure is often represented mathematically by a limit state function or performance function.
2.1 Definitions of Structural Reliability 2.1 Definitions of Structural Reliability ……55
2. Types of Limit State — Classification 1
Ultimate limit states are mostly related to the loss of load-carrying capacity. Examples of modes of failure in this category include:
(1) Ultimate Limit State (ULS)
– Exceeding the moment carrying capacity
– Formation of a plastic hinge
– Crushing of concrete in compression
– Shear failure of the web in a steel beam
– Loss of the overall stability
– Buckling of flange
– Buckling of web
– Weld rupture
– Loss of foundation load-carrying
2.1 Definitions of Structural Reliability 2.1 Definitions of Structural Reliability ……66
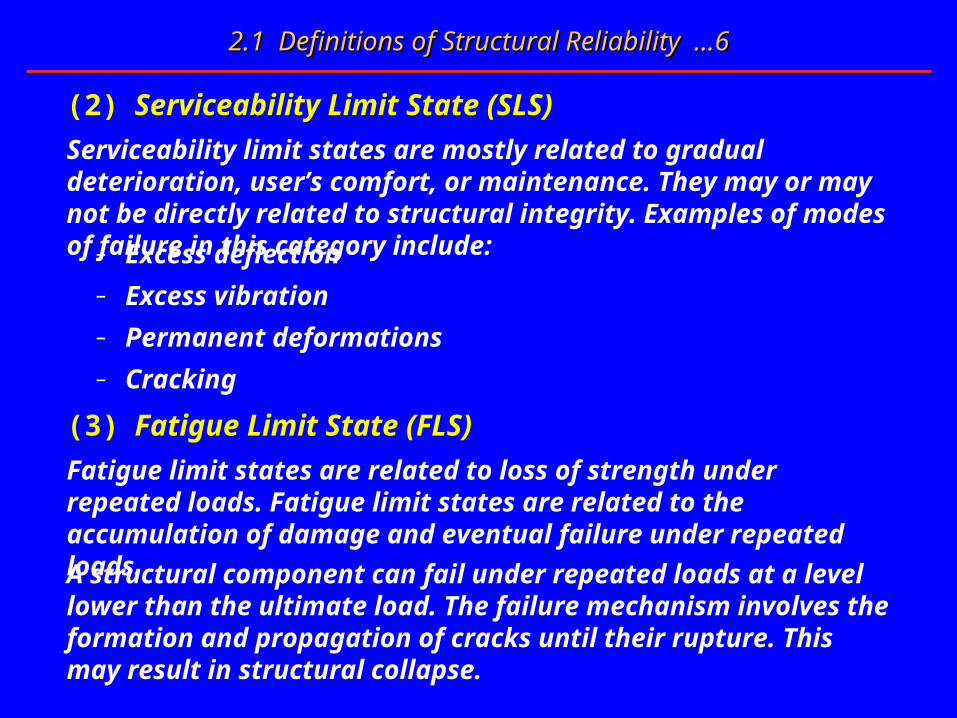
Serviceability limit states are mostly related to gradual deterioration, user’s comfort, or maintenance. They may or may not be directly related to structural integrity. Examples of modes of failure in this category include:
(2) Serviceability Limit State (SLS)
– Excess deflection
– Excess vibration
– Permanent deformations
– Cracking
Fatigue limit states are related to loss of strength under repeated loads. Fatigue limit states are related to the accumulation of damage and eventual failure under repeated loads.
(3) Fatigue Limit State (FLS)
A structural component can fail under repeated loads at a level lower than the ultimate load. The failure mechanism involves the formation and propagation of cracks until their rupture. This may result in structural collapse.
2.1 Definitions of Structural Reliability 2.1 Definitions of Structural Reliability ……77
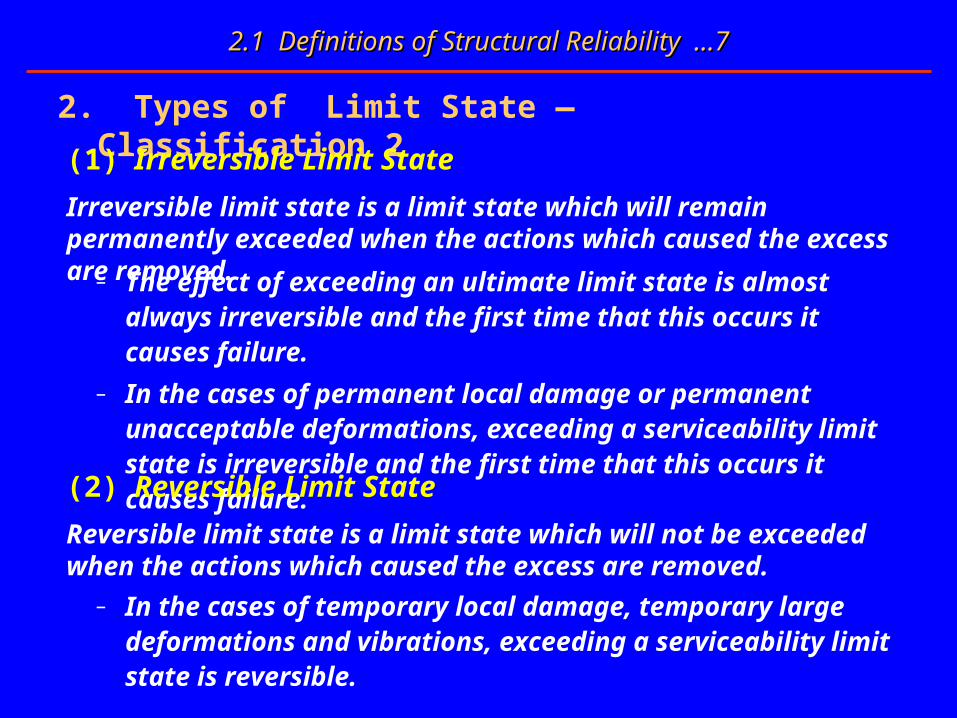
2. Types of Limit State — Classification 2
Irreversible limit state is a limit state which will remain permanently exceeded when the actions which caused the excess are removed.
(1) Irreversible Limit State
– The effect of exceeding an ultimate limit state is almost always irreversible and the first time that this occurs it causes failure.
– In the cases of permanent local damage or permanent unacceptable deformations, exceeding a serviceability limit state is irreversible and the first time that this occurs it causes failure.
Reversible limit state is a limit state which will not be exceeded when the actions which caused the excess are removed.
(2) Reversible Limit State
– In the cases of temporary local damage, temporary large deformations and vibrations, exceeding a serviceability limit state is reversible.
2.1 Definitions of Structural Reliability 2.1 Definitions of Structural Reliability ……88
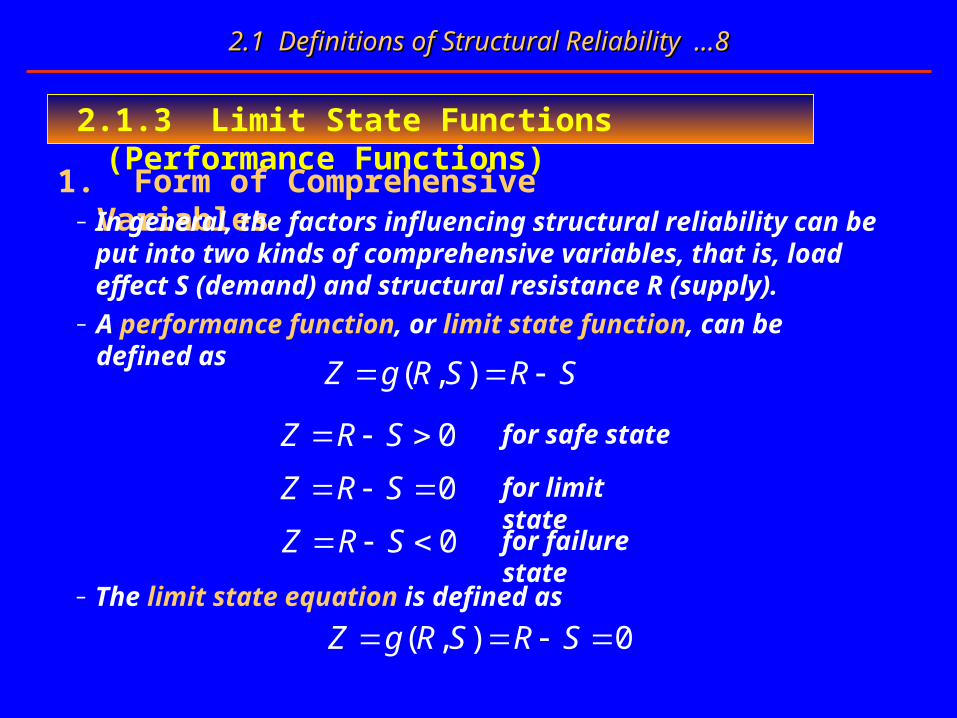
2.1.3 Limit State Functions (Performance Functions)
1. Form of Comprehensive Variables– In general, the factors influencing structural reliability can be put into
two kinds of comprehensive variables, that is, load effect S (demand) and structural resistance R (supply).
– A performance function, or limit state function, can be defined as
( , )Z g R S R S
0Z R S for safe state
0Z R S for limit state
0Z R S for failure state
– The limit state equation is defined as
( , ) 0Z g R S R S

2.1 Definitions of Structural Reliability 2.1 Definitions of Structural Reliability ……99
– Each limit state function is associated with a particular limit state.
Z R S
1R
ZS
ln lnZ R S
– Even for a particular limit state, its limit state functions may be different.
– Different limit states may have different limit state functions.
– Z is also named safety margin or margin of safety.
Properties of Limit State Functions
2.1 Definitions of Structural Reliability 2.1 Definitions of Structural Reliability ……1010
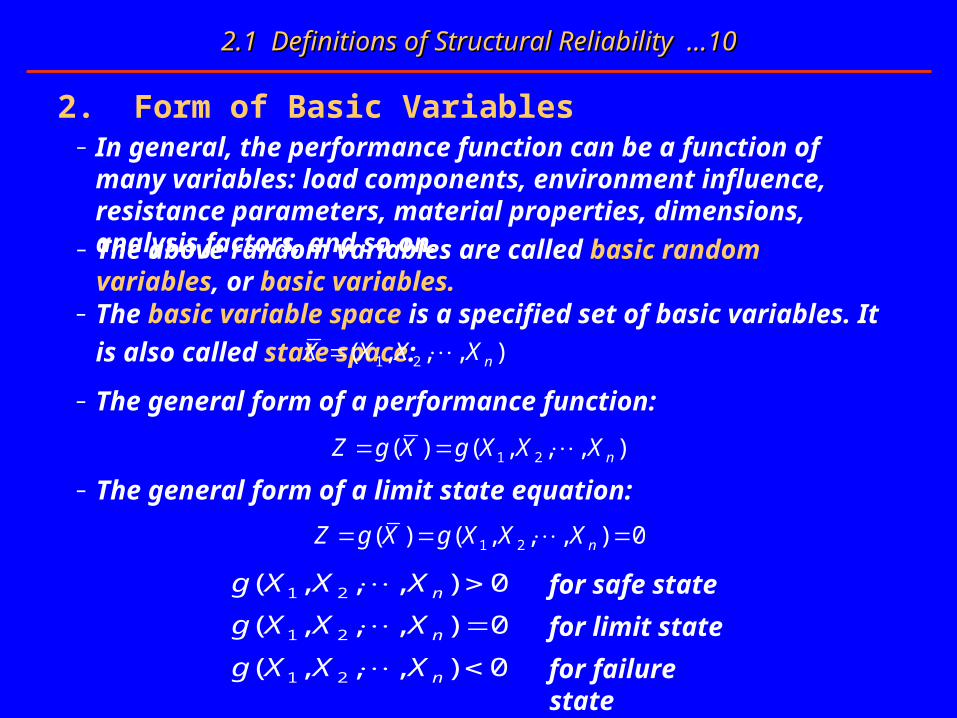
1 2( ) ( , , , )nZ g X g X X X
2. Form of Basic Variables– In general, the performance function can be a function of many
variables: load components, environment influence, resistance parameters, material properties, dimensions, analysis factors, and so on.– The above random variables are called basic random variables, or basic variables.
– The general form of a performance function:
– The basic variable space is a specified set of basic variables. It is also
called state space: 1 2( , , , )nX X X X
1 2( ) ( , , , ) 0nZ g X g X X X
– The general form of a limit state equation:
1 2( , , , ) 0ng X X X for safe state
1 2( , , , ) 0ng X X X for limit state
1 2( , , , ) 0ng X X X for failure state

2.1 Definitions of Structural Reliability 2.1 Definitions of Structural Reliability ……1111
2.1.4 Measures of Structural Reliability
1. Safety (Survival) Probability of Structures
– The probability of the event that the structure is to be safe is defined as safety probability, or survival probability. Mathematically,
– Let the performance function of a structure be ,
be the basic random variables influencing structural functions.
Obviously, Z is a random variable. Assume that the PDF of Z is
1 2( , , , )nZ g X X X
iX
( )Zf z
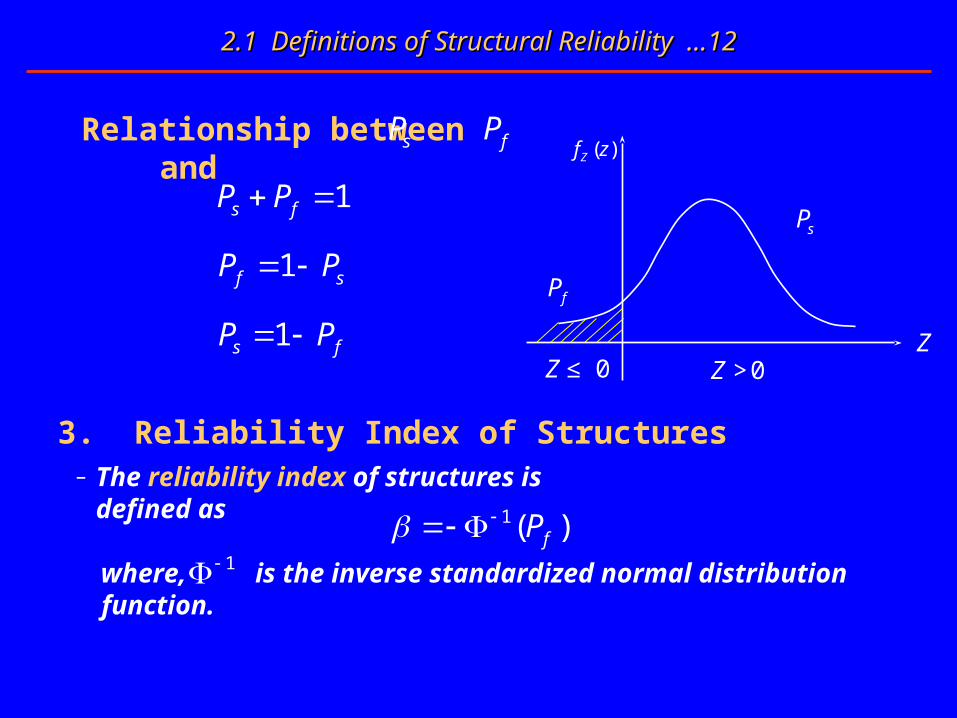
0( 0) ( )s ZP P Z f z dz
– The probability of the event that the structure is to be unsafe is defined as failure probability. Mathematically,
0( 0) ( )f ZP P Z f z dz
≤
2. Failure Probability of Structures
2.1 Definitions of Structural Reliability 2.1 Definitions of Structural Reliability ……1212
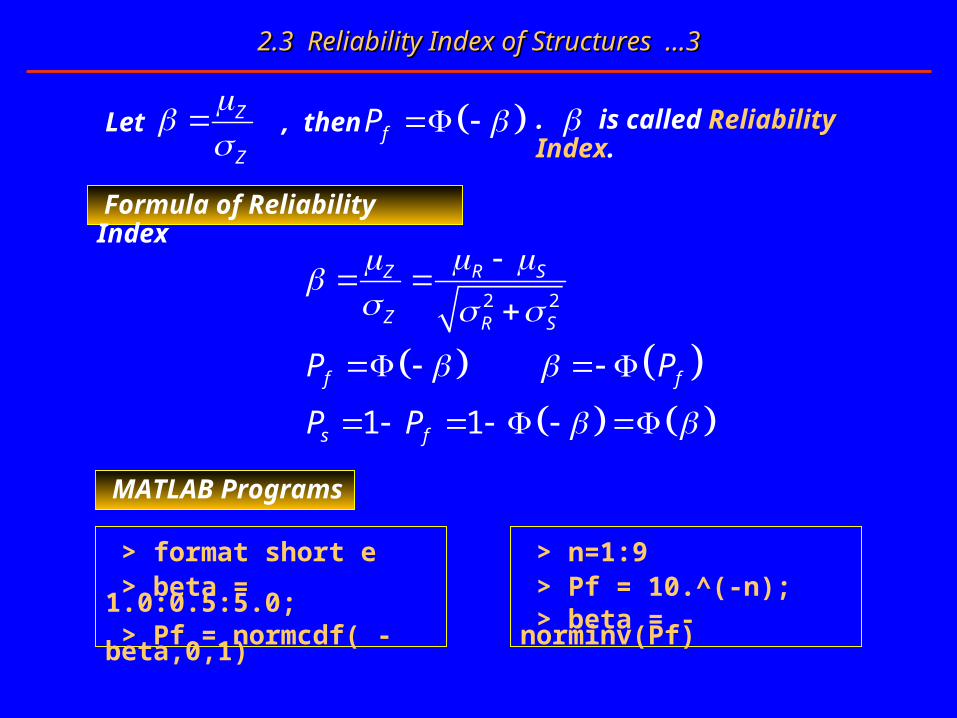
– The reliability index of structures is defined as1( )fP
3. Reliability Index of Structures
fP
( )Zf z
Z0Z≤ 0Z >
sP1s fP P
1f sP P
1s fP P
Relationship between and sP fP
where, is the inverse standardized normal distribution function.1

2.2 Failure Probability of Structures
Chapter 2Chapter 2 Basic Concepts of Basic Concepts of Structural Reliability TheoryStructural Reliability Theory
2.2 Failure Probability of Structures 2.2 Failure Probability of Structures ……11
2.2.1 General Basic Variables
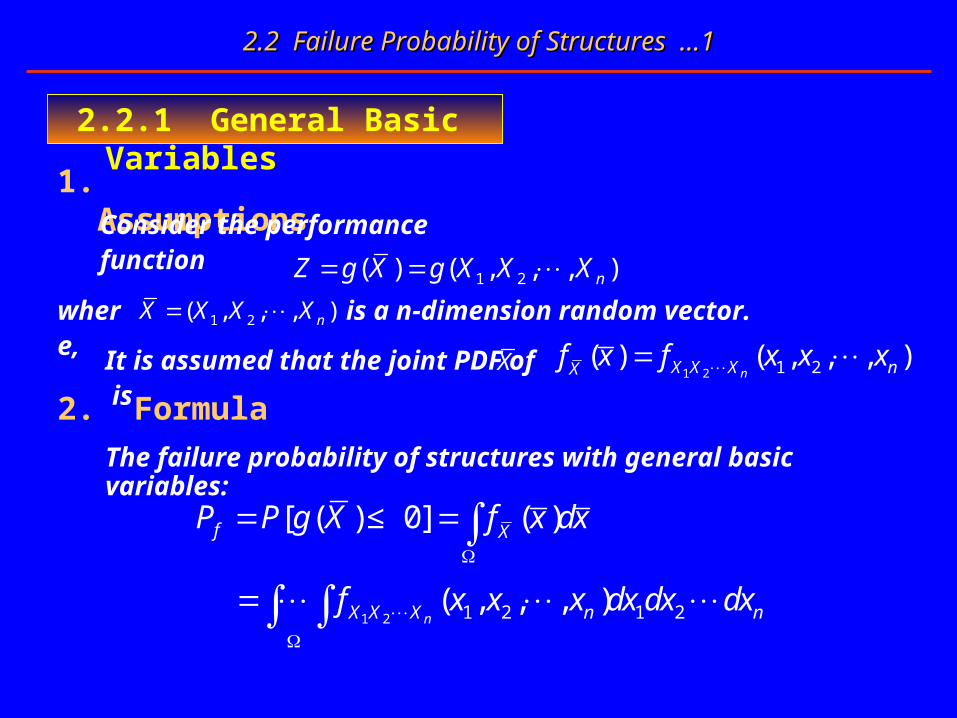
1. AssumptionsConsider the performance function
1 2 1 2 1 2
[ ( ) 0] ( )
( , , , )n
f X
X X X n n
P P g X f x dx
f x x x dx dx dx
≤
where, 1 2( , , , )nX X X X is a n-dimension random vector.
It is assumed that the joint PDF of isX1 2 1 2( ) ( , , , )
nX X X nXf x f x x x
2. Formula
The failure probability of structures with general basic variables:
1 2( ) ( , , , )nZ g X g X X X
2.2 Failure Probability of Structures 2.2 Failure Probability of Structures ……22
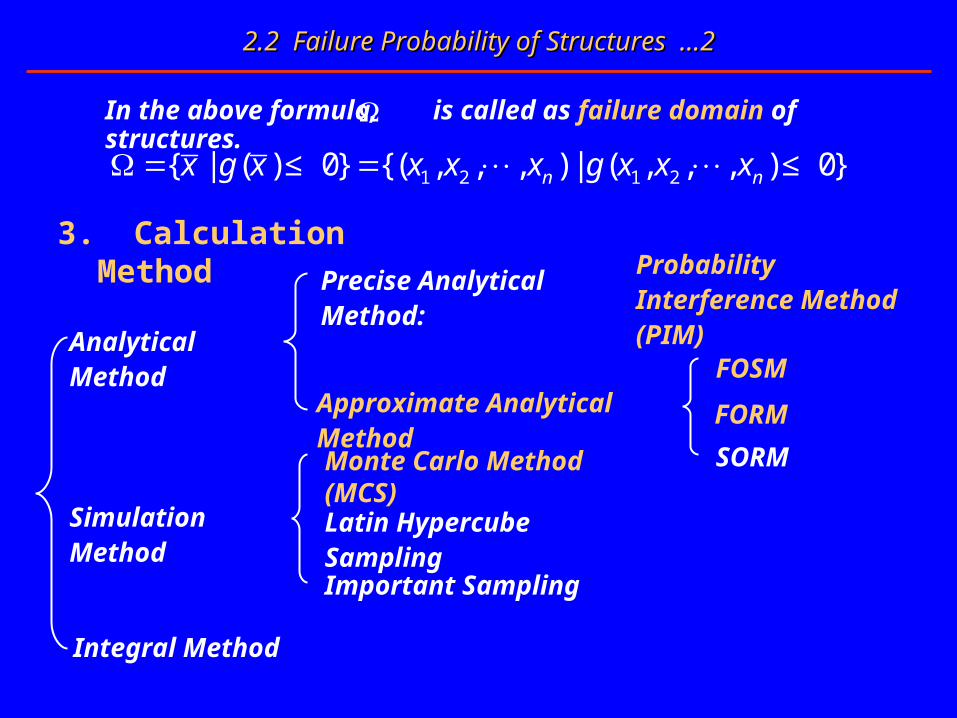
1 2 1 2{ | ( ) 0} {( , , , ) | ( , , , ) 0}n nx g x x x x g x x x ≤ ≤
In the above formula, is called as failure domain of structures.
3. Calculation Method
Analytical Method
Simulation Method
Integral Method
Precise Analytical Method:
FOSM
SORM
Probability Interference Method (PIM)
Approximate Analytical Method
Monte Carlo Method (MCS)
Latin Hypercube Sampling
Important Sampling
FORM
2.2 Failure Probability of Structures 2.2 Failure Probability of Structures ……33
2.2.2 Two Comprehensive Variables
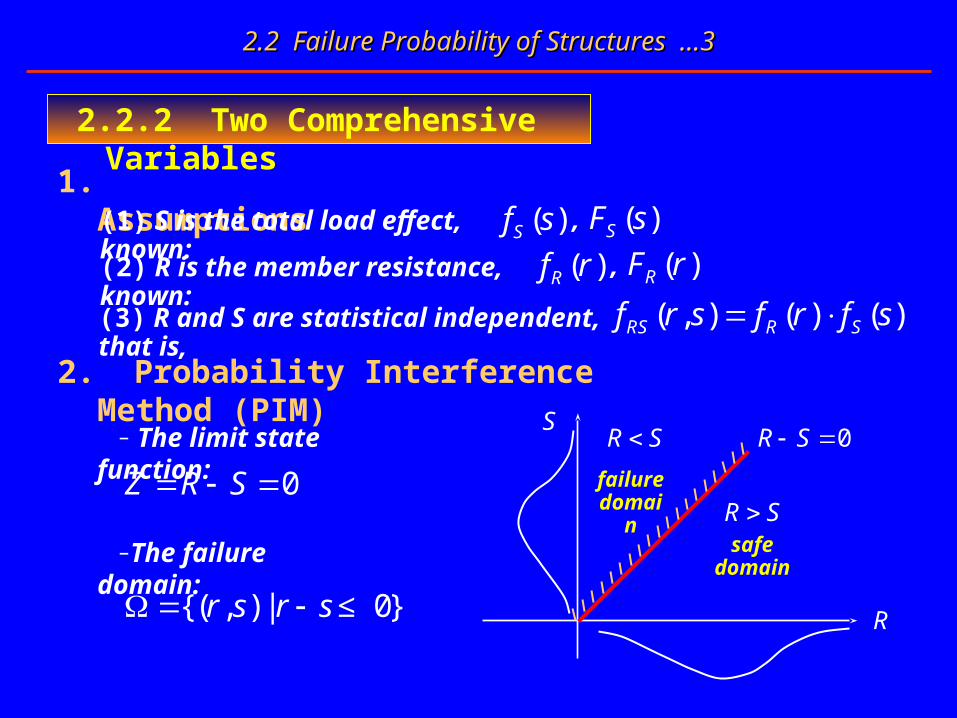
1. Assumptions(1) S is the total load effect, known:
0Z R S
( )Sf s
2. Probability Interference Method (PIM)
– The limit state function:
(2) R is the member resistance, known:
(3) R and S are statistical independent, that is,
( )SF s,
( )Rf r ( )RF r,
( , ) ( ) ( )RS R Sf r s f r f s
–The failure domain:
{( , ) | }r s r s ≤ 0 R
R S
R S
0R S S
failure domain
safe domain
2.2 Failure Probability of Structures 2.2 Failure Probability of Structures ……44
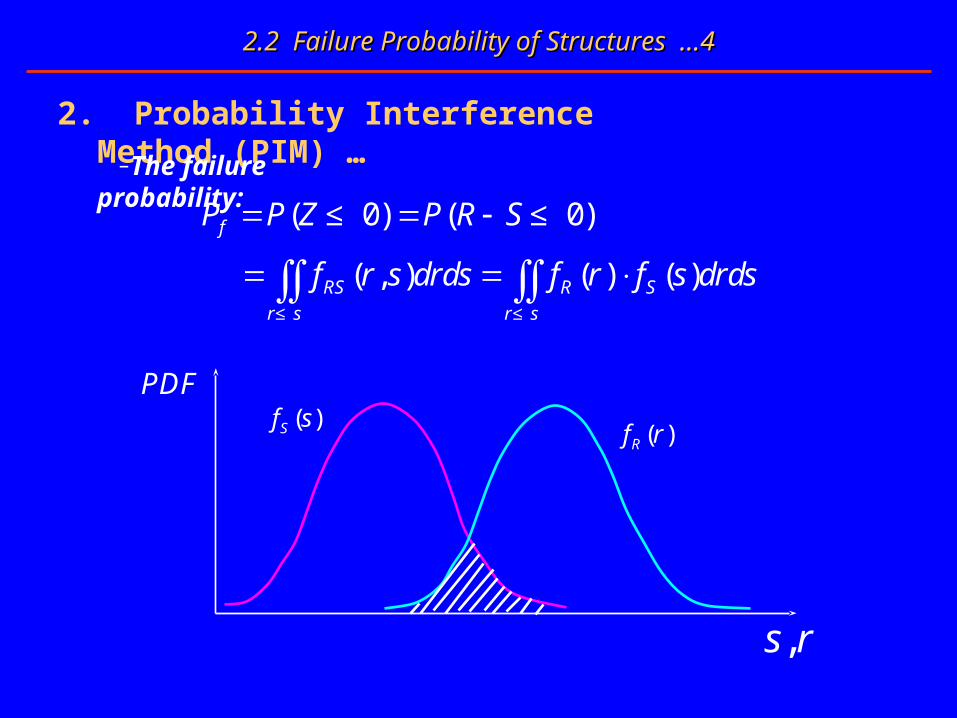
( 0) ( 0)
( , ) ( ) ( )
f
RS R S
r s r s
P P Z P R S
f r s drds f r f s drds
≤ ≤
≤ ≤
2. Probability Interference Method (PIM) …
–The failure probability:
( )Rf r
,s r
( )Sf s

2.2 Failure Probability of Structures 2.2 Failure Probability of Structures ……55
Formula 2 of PIM
– First integration for s, then for r
( ) ( ) ( ) ( )f R S S Rrr s
P f r f s drds f s dr f r ds
≤
1 ( ) ( ) 1 ( )f S R SP F r f r dr E F r
Formula 1 of PIM
– First integration for r, then for s
( ) ( ) ( ) ( )s
f R S R S
r s
P f r f s drds f r dr f s ds
≤
( ) ( ) ( )f R S RP F s f s ds E F s
( ) ( )RF s P R s ≤
( ) ( ) 1 ( )SF r P S r P S r ≤ >
2.2 Failure Probability of Structures 2.2 Failure Probability of Structures ……66
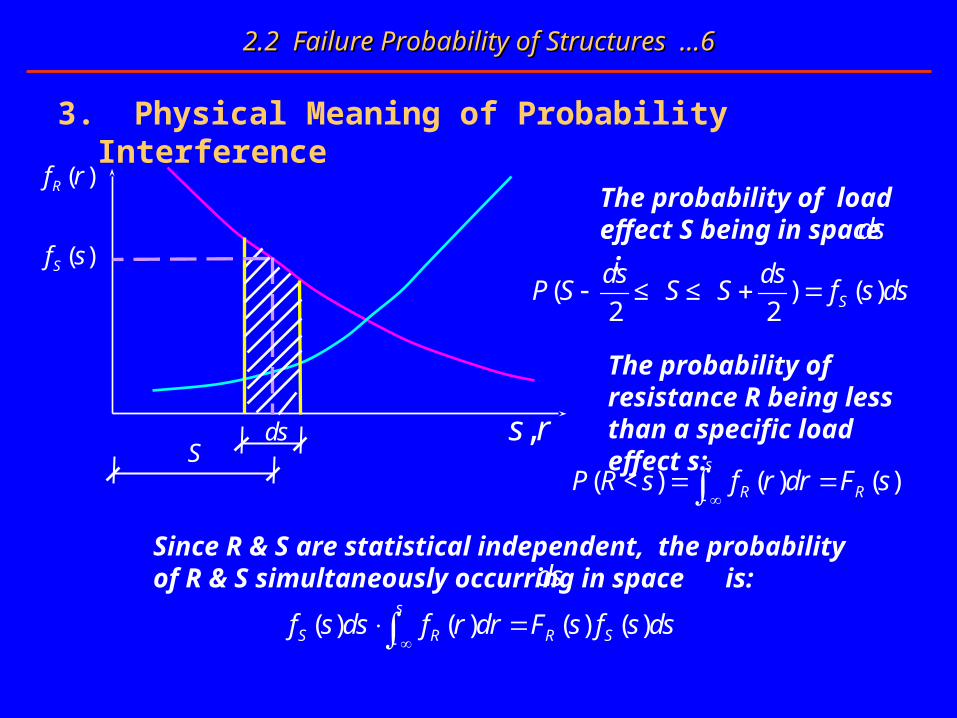
3. Physical Meaning of Probability Interference
The probability of load effect S being in space :
( )Rf r
,s r
( )Sf s
dsS
ds
( ) ( )2 2 S
ds dsP S S S f s ds ≤ ≤
The probability of resistance R being less than a specific load effect s:
( ) ( ) ( )s
R RP R s f r dr F s
<
Since R & S are statistical independent, the probability of R & S simultaneously occurring in space is:ds
( ) ( ) ( ) ( )s
S R R Sf s ds f r dr F s f s ds
2.2 Failure Probability of Structures 2.2 Failure Probability of Structures ……77
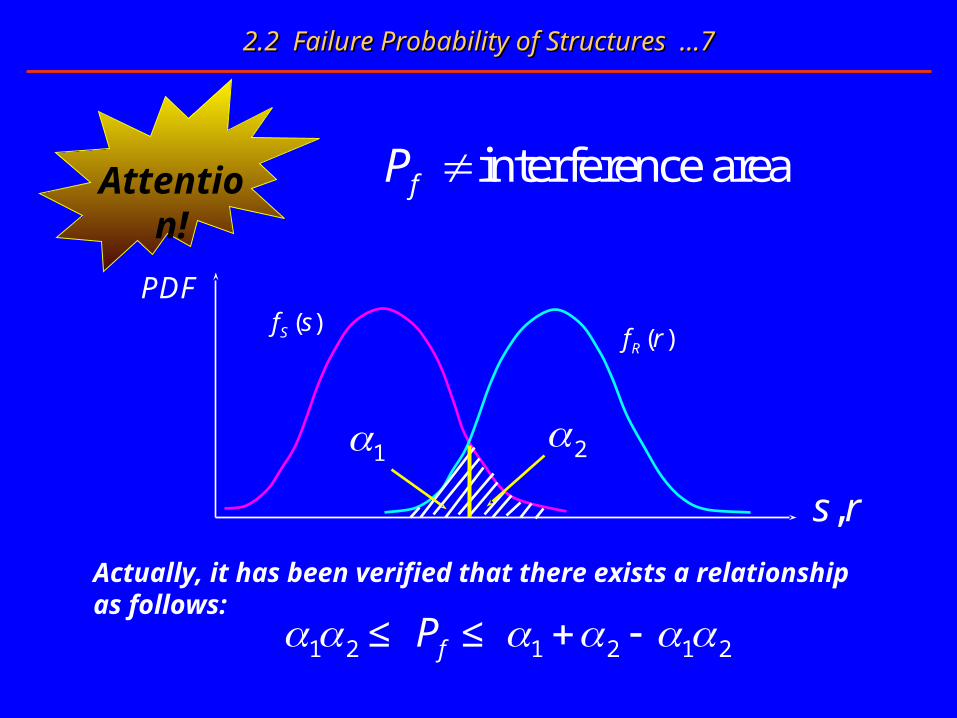
interference areafP Attention!
( )Rf r
,s r
( )Sf s
1 2
Actually, it has been verified that there exists a relationship as follows:
1 2 1 2 1 2fP ≤ ≤

2.2 Failure Probability of Structures 2.2 Failure Probability of Structures ……88
Example 2.1
Z R S
Consider the performance function of the square section strength of a structural element
where R and S are random variables.
The distribution parameters of R & S are shown below:
R is a normal RV210 /R kN cm
21 /R kN cm
S is a exponent RV21/ 5 /S kN cm 21/ 5 /S kN cm
( ) ( 0)sSf s e s ≥
The PDF of S is
Calculate the failure probability of the element.
2.2 Failure Probability of Structures 2.2 Failure Probability of Structures ……99
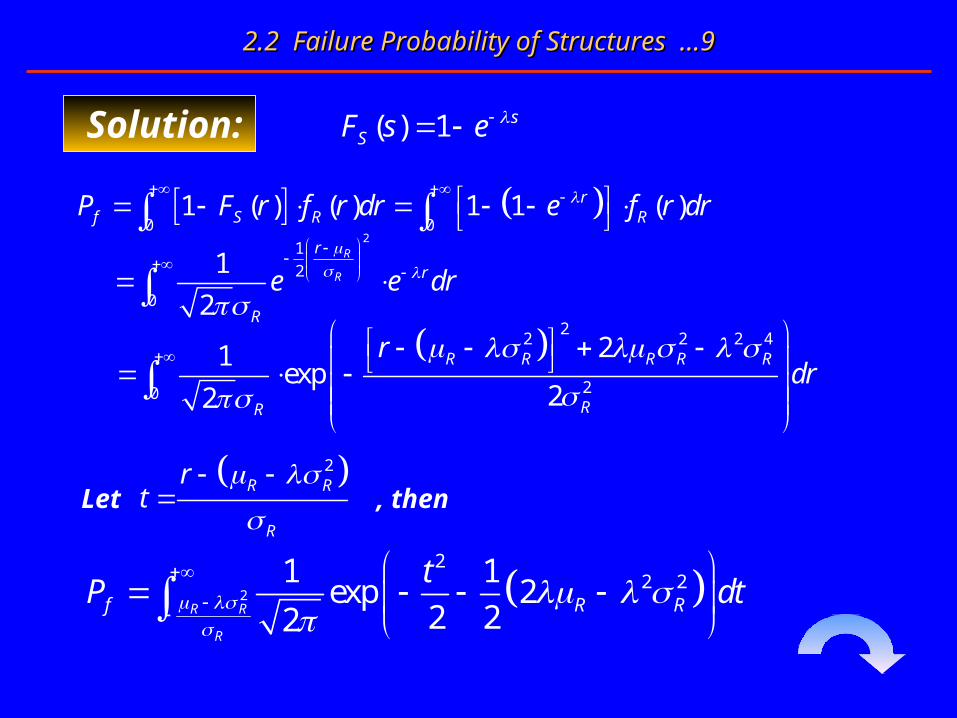
Solution:
0 0
1 ( ) ( ) 1 1 ( )rf S R RP F r f r dr e f r dr
( ) 1 sSF s e
21
2
0
1
2
R
R
r
r
R
e e dr
22 2 2 4
20
21exp
22
R R R R R
RR
rdr
Let 2
R R
R
rt
, then
2
22 21 1
exp 22 22R R
R
f R R
tP dt
2.2 Failure Probability of Structures 2.2 Failure Probability of Structures ……1010
2
22 21 1
exp 2 exp2 22R R
R
f R R
tP dt
2
2 21exp 2 1
2R R
R RR
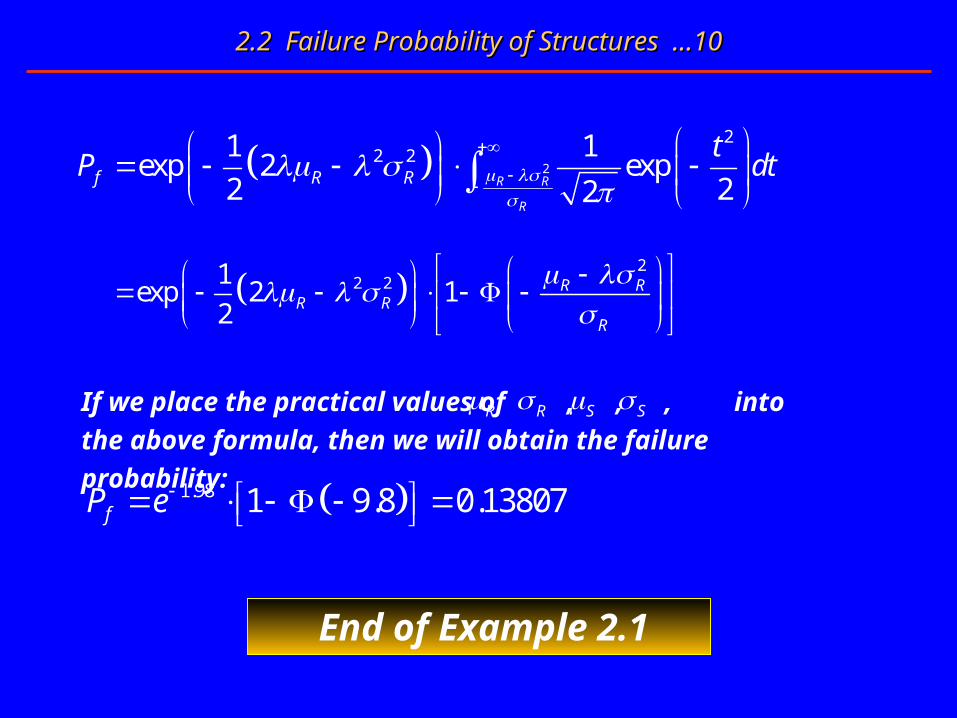
1.98 1 9.8 0.13807fP e
If we place the practical values of , , , into the
above formula, then we will obtain the failure probability:R R SS
End of Example 2.1
2.3 Reliability Index of Structures
Chapter 2Chapter 2 Basic Concepts of Basic Concepts of Structural Reliability TheoryStructural Reliability Theory
2.3 Reliability Index of Structures 2.3 Reliability Index of Structures ……11
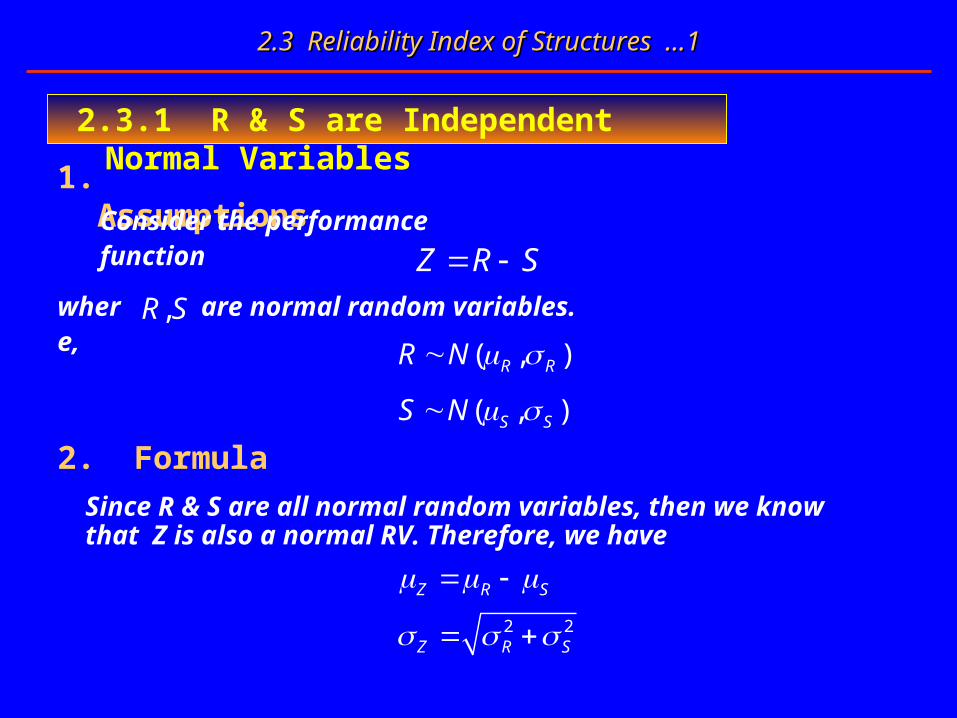
2.3.1 R & S are Independent Normal Variables
1. AssumptionsConsider the performance function
where, ,R S are normal random variables.
( , )R RR N
2. Formula
Since R & S are all normal random variables, then we know that Z is also a normal RV. Therefore, we have
Z R S
( , )S SS N
Z R S 2 2
Z R S
2.3 Reliability Index of Structures 2.3 Reliability Index of Structures ……22
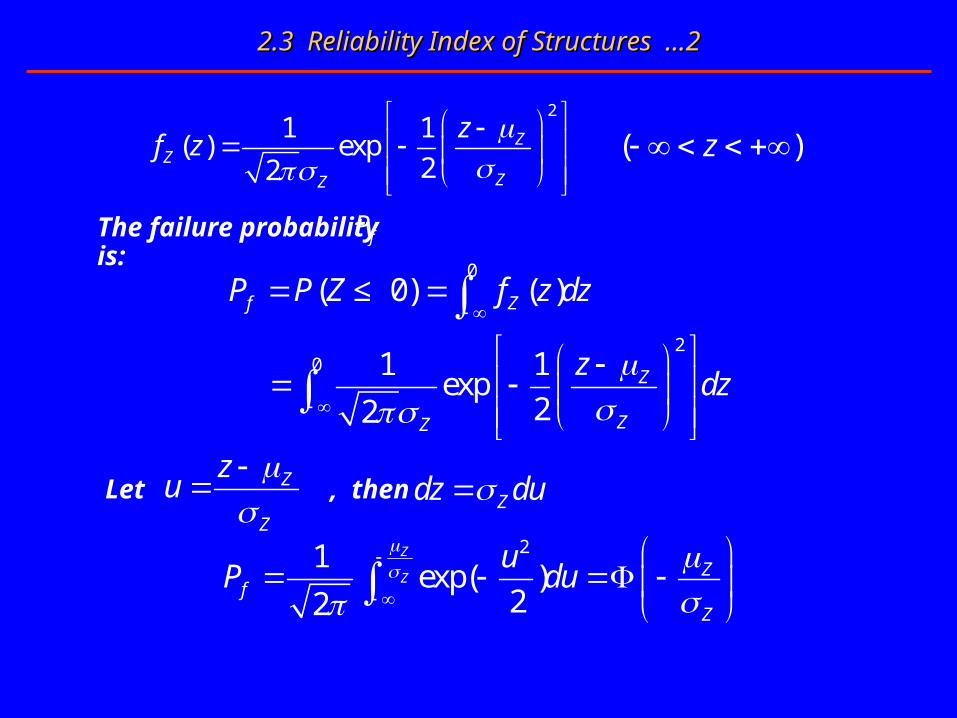
The failure probability is:
21 1
( ) exp22
ZZ
ZZ
zf z
( )z
fP
0
20
( 0) ( )
1 1exp
22
f Z
Z
ZZ
P P Z f z dz
zdz
≤
Let , thenZ
Z
zu
Zdz du
21exp( )
22
Z
Z Zf
Z
uP du
2.3 Reliability Index of Structures 2.3 Reliability Index of Structures ……33
Let , thenZ
Z
fP
2 2
R SZ
Z R S
Formula of Reliability Index
. is called Reliability Index.
1 1s fP P
> format short e > beta = 1.0:0.5:5.0; > Pf = normcdf( -beta,0,1)
MATLAB Programs
> n=1:9 > Pf = 10.^(-n); > beta = -norminv(Pf)
fP fP
2.3 Reliability Index of Structures 2.3 Reliability Index of Structures ……44
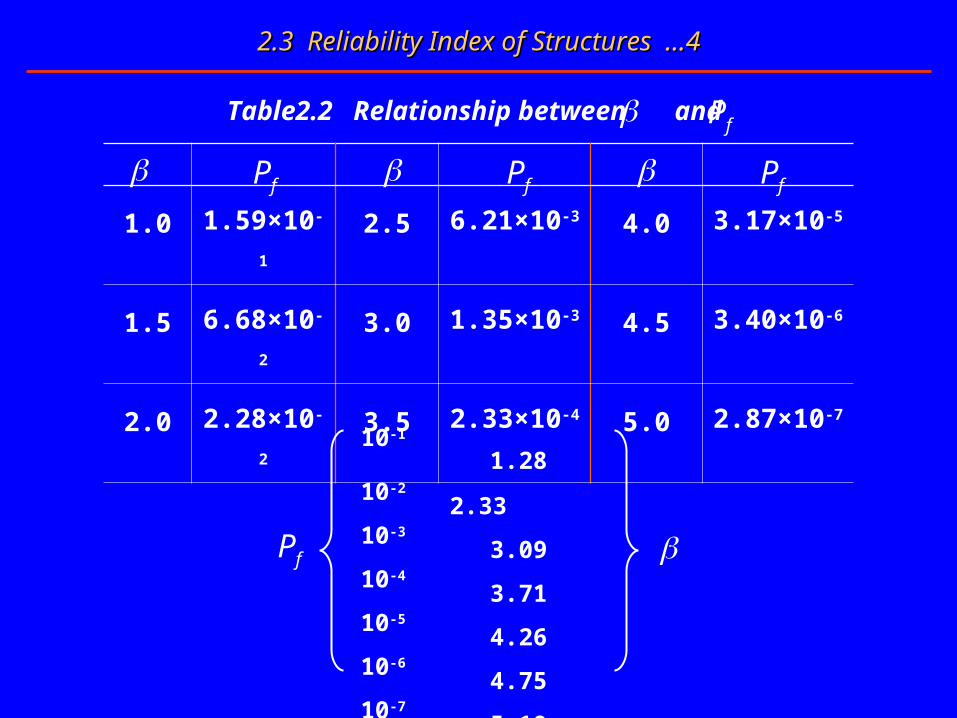
1.0 1.59×10⁻¹ 2.5 6.21×10⁻³ 4.0 3.17×10⁻⁵
1.5 6.68×10⁻² 3.0 1.35×10⁻³ 4.5 3.40×10⁻⁶
2.0 2.28×10⁻² 3.5 2.33×10⁻⁴ 5.0 2.87×10⁻⁷
fP
fP fP
Table2.2 Relationship between and fP
10-1 1.2810-2 2.3310-3 3.0910-4 3.7110-5 4.2610-6 4.7510-7 5.1910-8 5.6210-9 5.99
fP

2.3 Reliability Index of Structures 2.3 Reliability Index of Structures ……55
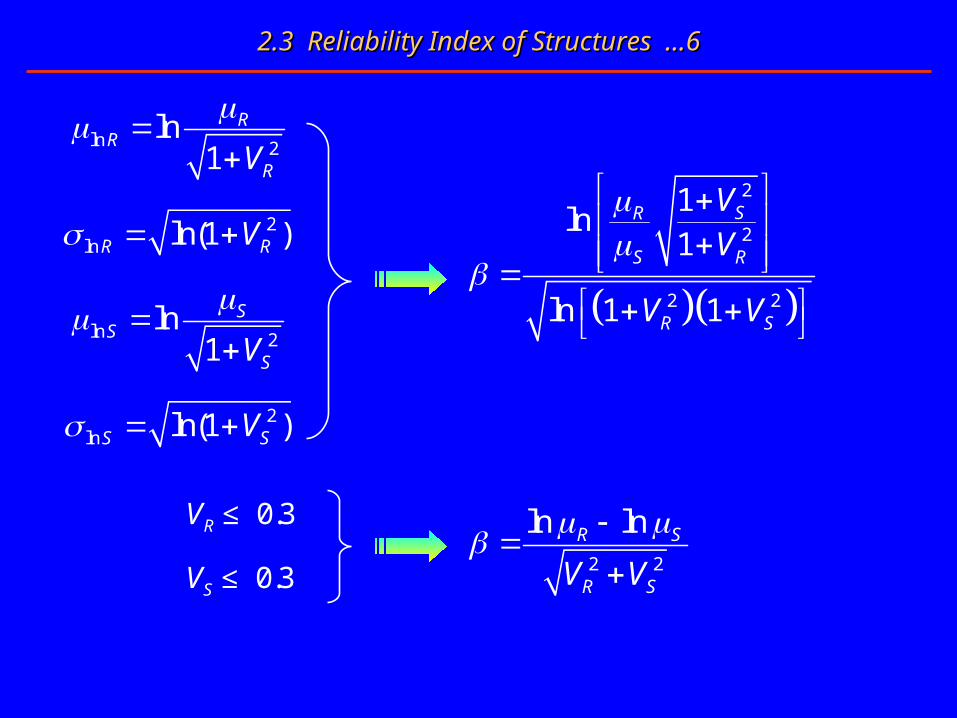
2.3.2 R & S are Independent Lognormal Variables
1. AssumptionsConsider the performance function
where, ,R S are lognormal random variables.
( , )R RR LN
2. Formula
ln lnZ R S
( , )S SS LN
ln ln
2 2ln ln
R SZ
Z R S
ln lnZ R S
2 2ln lnZ R S
2.3 Reliability Index of Structures 2.3 Reliability Index of Structures ……66
2
2
2 2
1ln
1
ln 1 1
SR
S R
R S
V
V
V V
ln 2ln
1R
R
RV
2ln ln(1 )R RV
ln 2ln
1S
S
SV
2ln ln(1 )S SV
0.3RV ≤
0.3SV ≤2 2
ln lnR S
R SV V
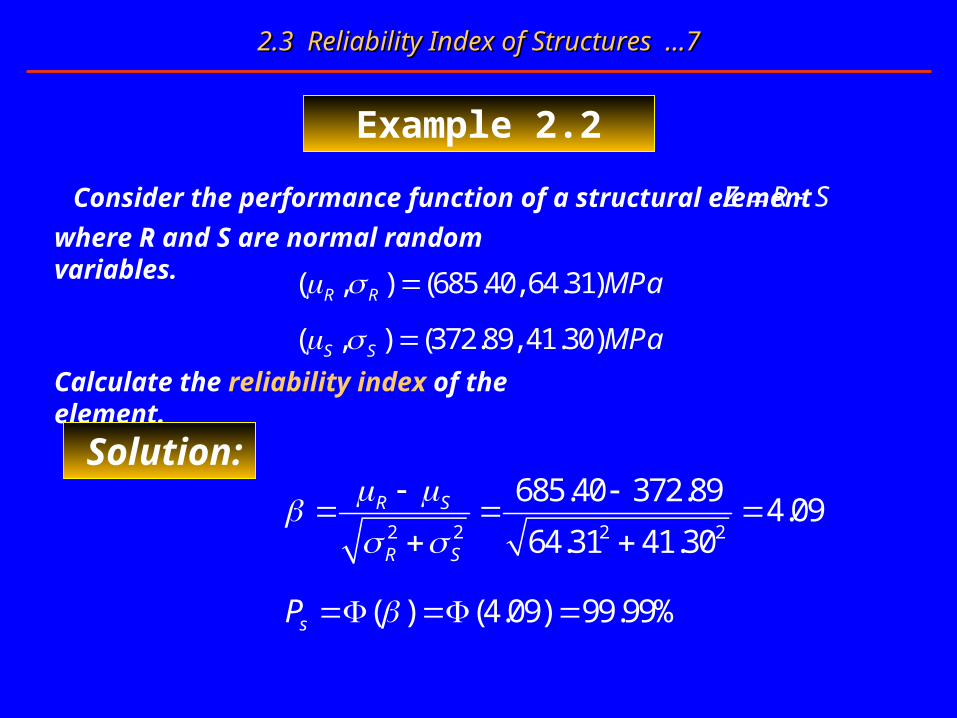
Example 2.2
Z R S Consider the performance function of a structural element ,
Calculate the reliability index of the element.
2.3 Reliability Index of Structures 2.3 Reliability Index of Structures ……77
( , ) (685.40, 64.31)R R MPa
where R and S are normal random variables.
( , ) (372.89, 41.30)S S MPa
Solution:
2 2 2 2
685.40 372.894.09
64.31 41.30R S
R S
( ) (4.09) 99.99%sP
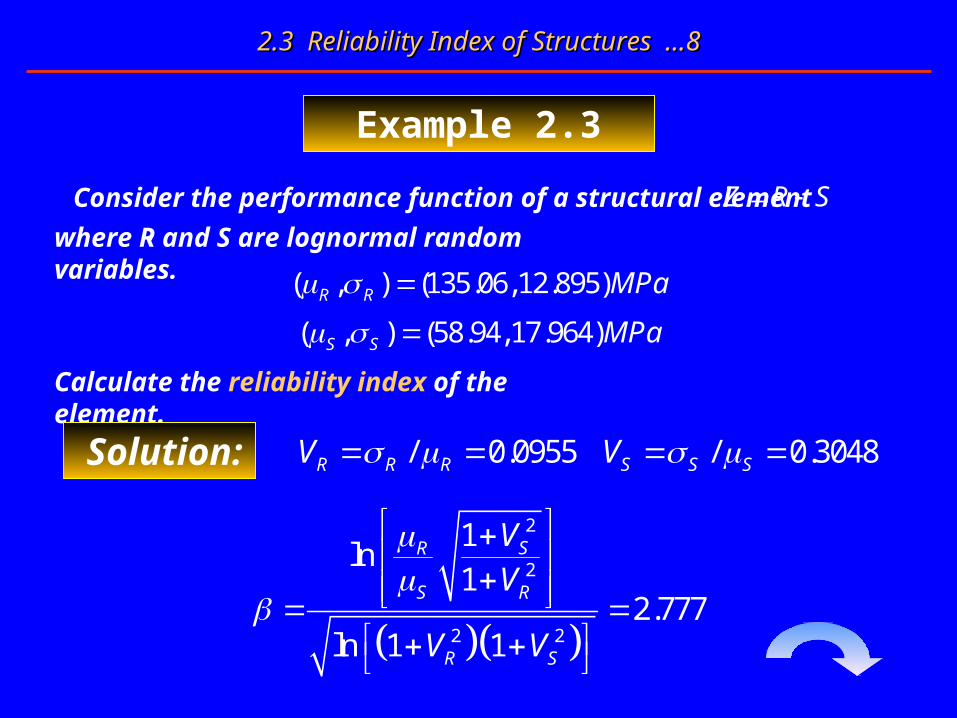
Example 2.3
Z R S Consider the performance function of a structural element ,
Calculate the reliability index of the element.
2.3 Reliability Index of Structures 2.3 Reliability Index of Structures ……88
( , ) (135.06,12.895)R R MPa
where R and S are lognormal random variables.
( , ) (58.94,17.964)S S MPa
Solution: / 0.0955R R RV / 0.3048S S SV
2
2
2 2
1ln
12.777
ln 1 1
SR
S R
R S
V
V
V V
2.3 Reliability Index of Structures 2.3 Reliability Index of Structures ……99
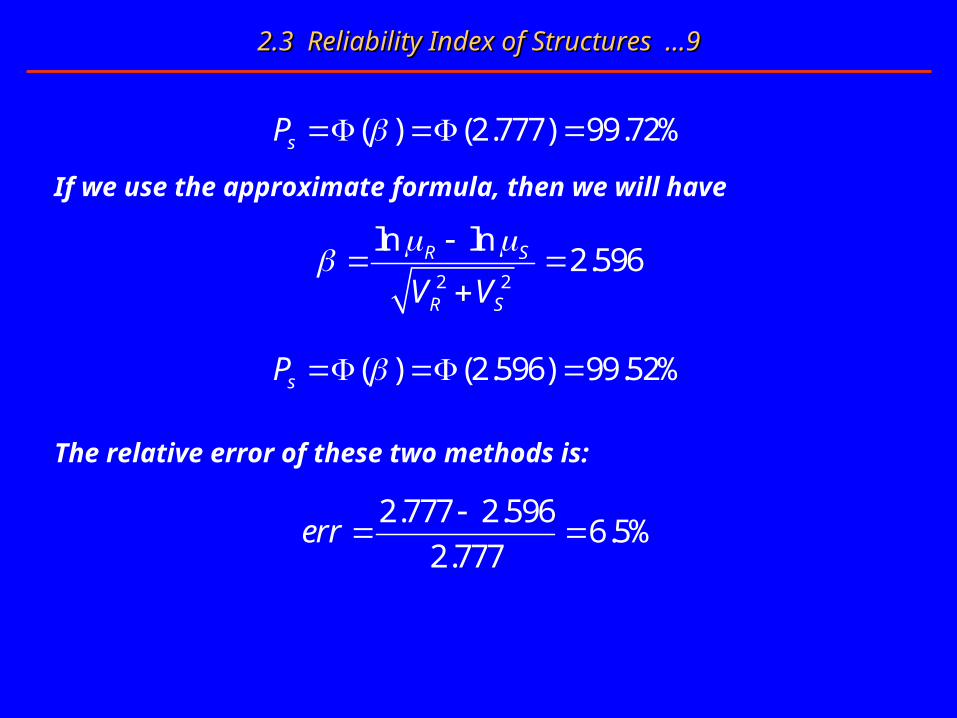
2.777 2.5966.5%
2.777err
( ) (2.777) 99.72%sP
If we use the approximate formula, then we will have
2 2
ln ln2.596R S
R SV V
( ) (2.596) 99.52%sP
The relative error of these two methods is:
2.4 Geometric Meaning of Reliability Index
Chapter 2Chapter 2 Basic Concepts of Basic Concepts of Structural Reliability TheoryStructural Reliability Theory

2.4 Geometric Meaning of Reliability Index 2.4 Geometric Meaning of Reliability Index ……11
2.4.1 Reduced Variables
The standard forms of the basic variables R & S can be expressed as:
RR
R
RU
SS
S
SU
The variables and are called reduced variables .SURU
R R RR U
S S SS U ( , )Z g R S R S
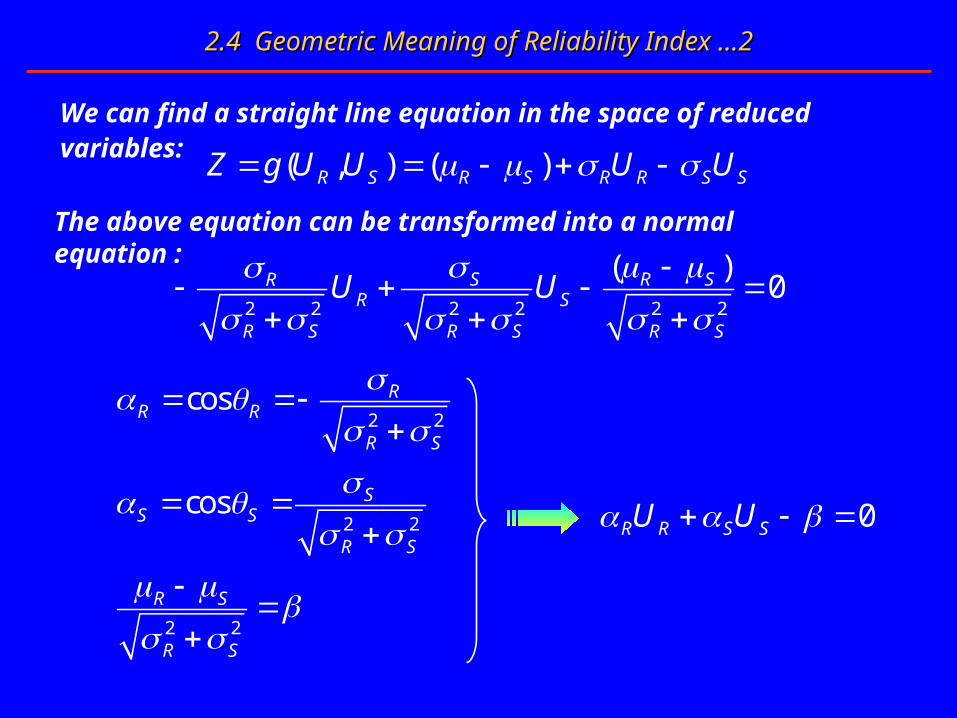
2.4 Geometric Meaning of Reliability Index 2.4 Geometric Meaning of Reliability Index ……22
We can find a straight line equation in the space of reduced variables:
The above equation can be transformed into a normal equation :
( , ) ( )R S R S R R S SZ g U U U U
2 2 2 2 2 2
( )0S R SR
R S
R S R S R S
U U
2 2cos R
R R
R S
2 2cos S
S S
R S
2 2
R S
R S
0R R S SU U
2.4 Geometric Meaning of Reliability Index 2.4 Geometric Meaning of Reliability Index ……33
R
failure domain
safe domain
S
R
S
RU
SU
o
o
*P
0Z *O P
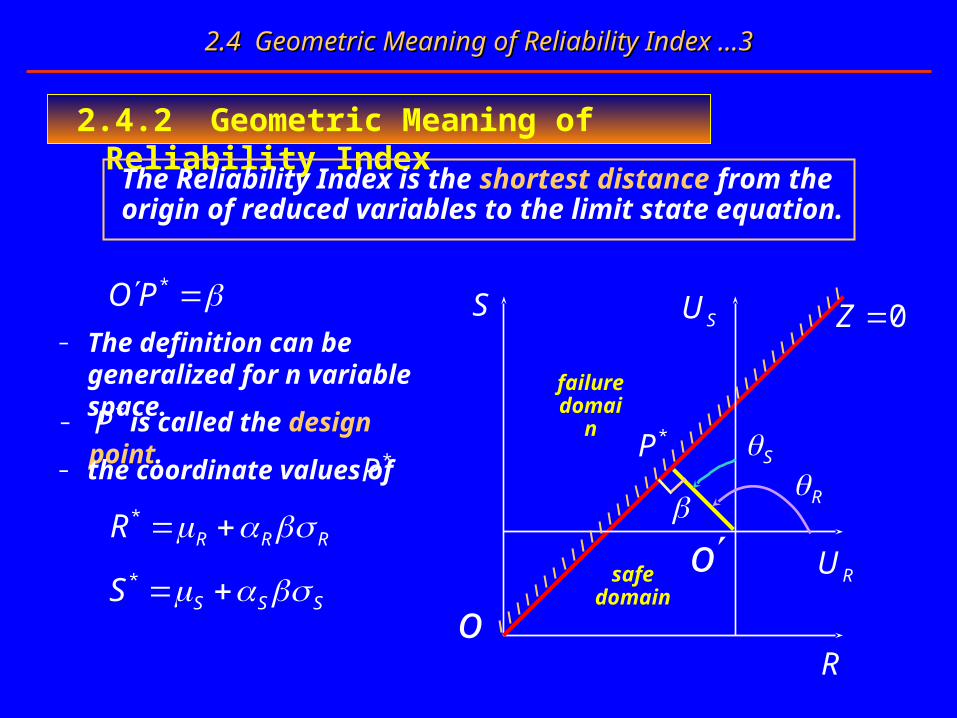
2.4.2 Geometric Meaning of Reliability Index
The Reliability Index is the shortest distance from the origin of reduced variables to the limit state equation.
– The definition can be generalized for n variable space.
– is called the design point.*P– the coordinate values of *P
*R R RR
*S S SS
2.5 Relationship between Reliability Index and Safety Factor
Chapter 2Chapter 2 Basic Concepts of Basic Concepts of Structural Reliability TheoryStructural Reliability Theory
2.5 Relationship between Reliability Index and Safety Factor2.5 Relationship between Reliability Index and Safety Factor……11
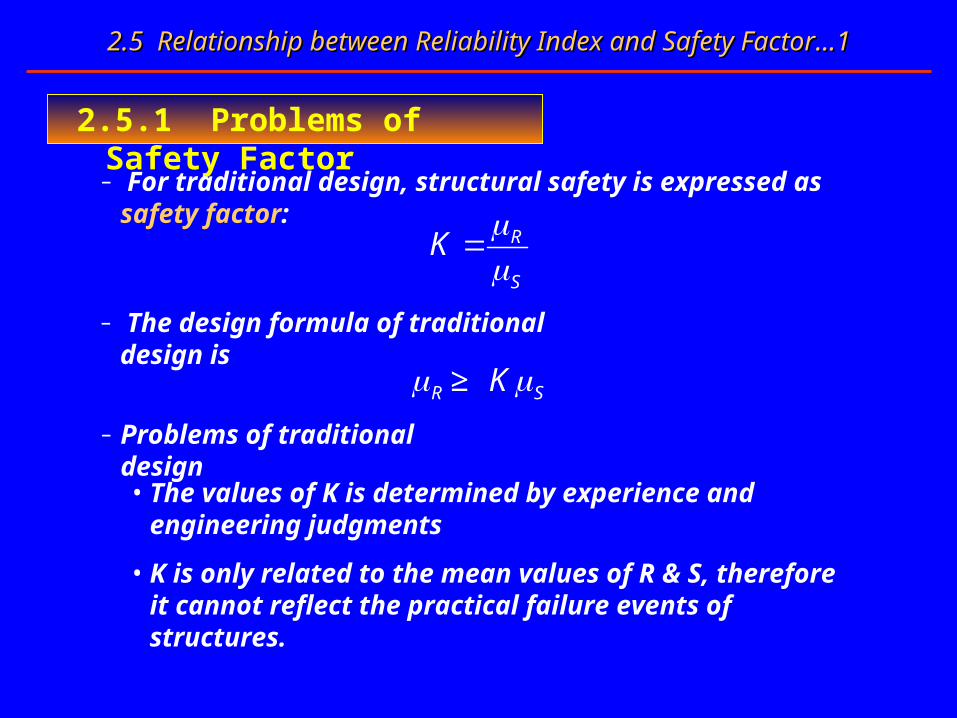
2.5.1 Problems of Safety Factor
– For traditional design, structural safety is expressed as safety factor:
R
S
K
– The design formula of traditional design is
R SK ≥
– Problems of traditional design
• The values of K is determined by experience and engineering judgments
• K is only related to the mean values of R & S, therefore it cannot reflect the practical failure events of structures.
2.5 Relationship between Reliability Index and Safety Factor2.5 Relationship between Reliability Index and Safety Factor……22
,s r
( )Sf s ( )Rf r
1S
2S
2R
1R
( )Sf s ( )Rf r
,s rPDF
1
1
1R
S
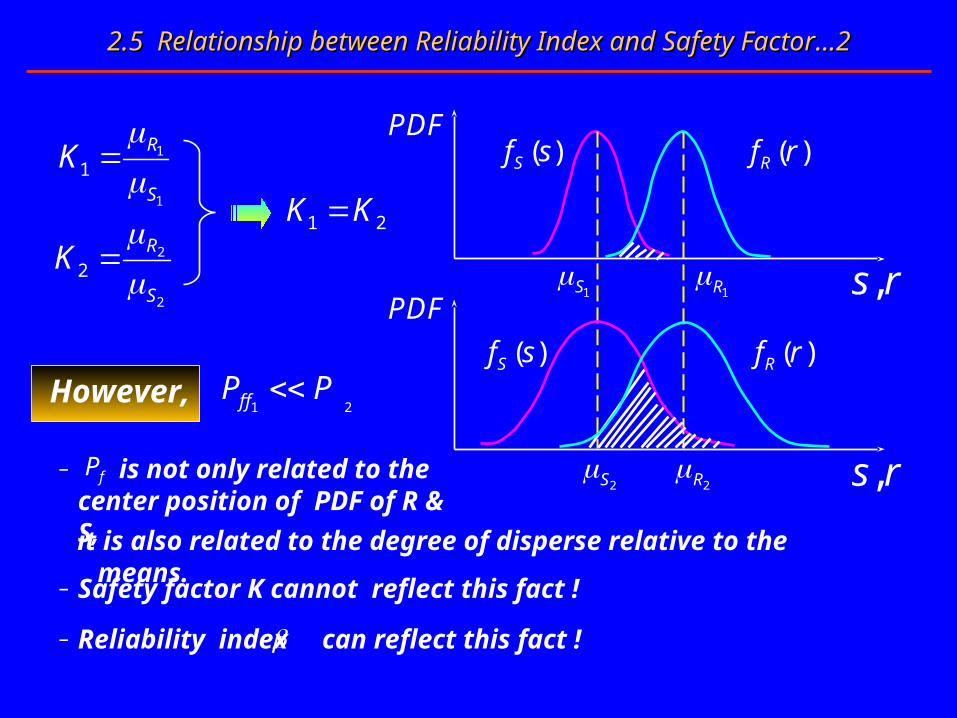
K
2
2
2R
S
K
1 2K K
1 2f fP P However,
– is not only related to the center position of PDF of R & S,
fP
– Safety factor K cannot reflect this fact !
– Reliability index can reflect this fact !
it is also related to the degree of disperse relative to the means.
2.5 Relationship between Reliability Index and Safety Factor2.5 Relationship between Reliability Index and Safety Factor……33
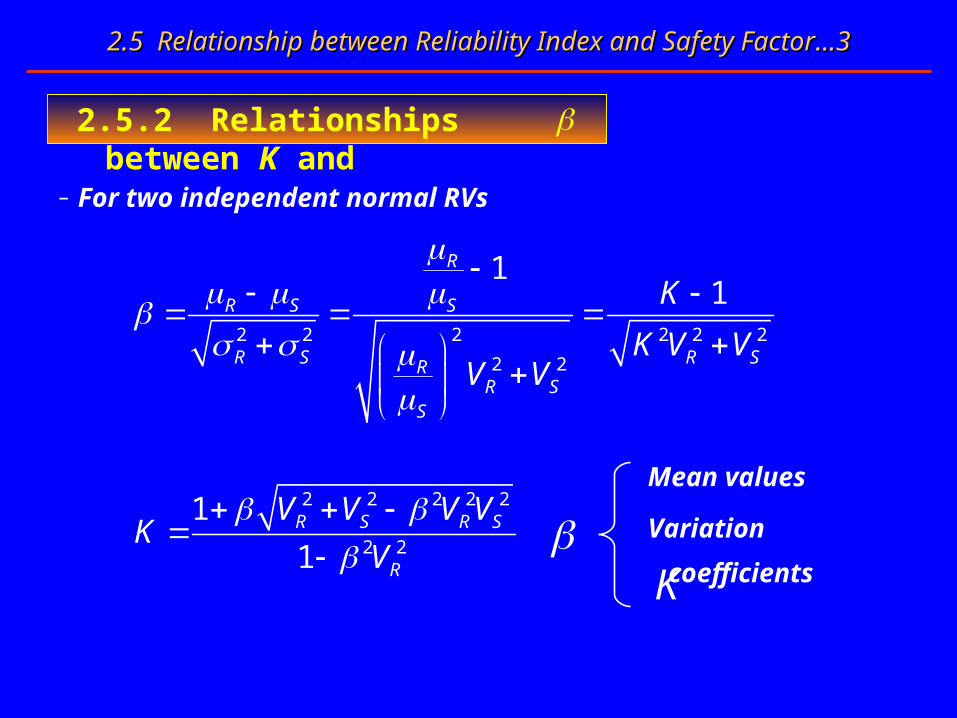
– For two independent normal RVs
2 2 2 2 2 2
2 2
11
R
R S S
R S R SRR S
S
K
K V VV V
2 2 2 2 2
2 2
1
1R S R S
R
V V V VK
V
K
Mean values
Variation coefficients
2.5.2 Relationships between K and

Chapter2: Homework 2Chapter2: Homework 2
Homework 2
2.1 Deduce the formula of safety probability of probability interference method.
Required: (1) Give two types of just like .
sP
sP
2.2 By using the formula that you deduce in homework 2.1, calculate the safety probability of the performance function shown in Example 2.1.
Known: All statistical information is identical to that in Example 2.1.
(2) The key point of your deduction should be shown by figure.
fP

End of
Chapter 2Chapter 2