Embed Size (px)
Citation preview

Chapter 2 Demand and Supply Analysis
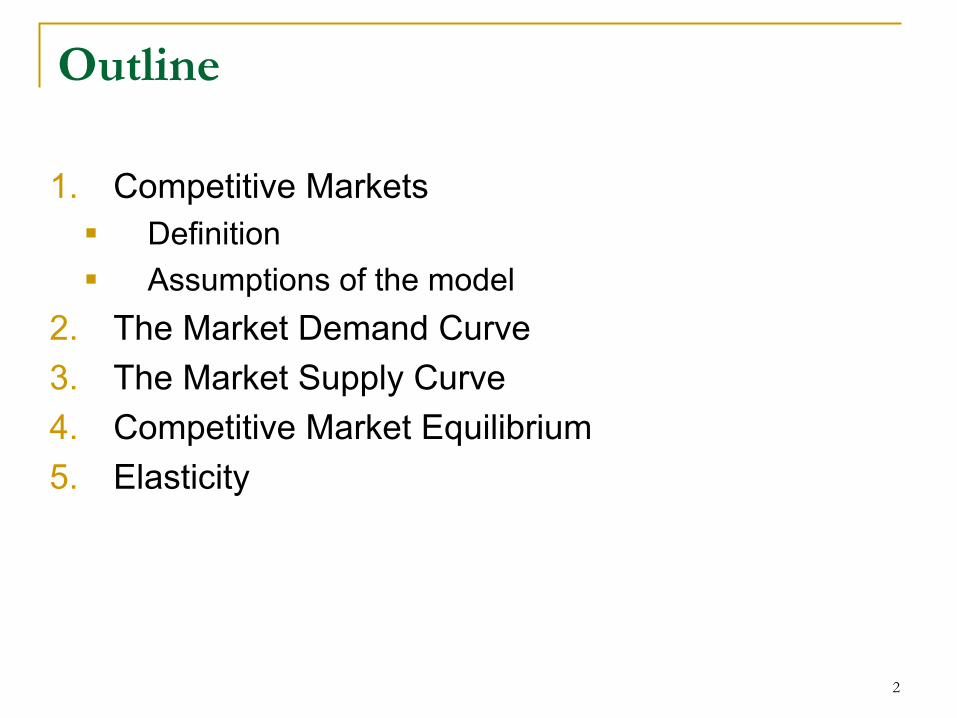
Outline
1. Competitive Markets § Definition§ Assumptions of the model
2. The Market Demand Curve3. The Market Supply Curve4. Competitive Market Equilibrium5. Elasticity
2
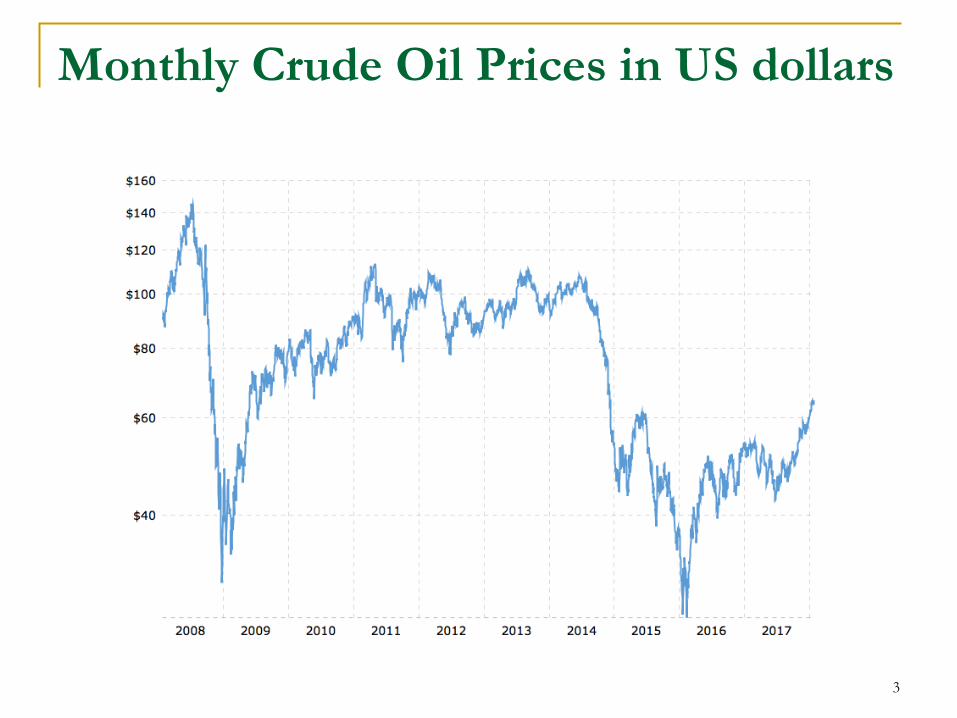
Monthly Crude Oil Prices in US dollars
3
Oil MarketWhy do oil price fluctuate?
1. Fall in Demand§ Weak economic activity§ Increased efficiency§ Substitute toward other fuels
2. Geopolitical Reasons§ Middle East trying to fold market to keep prices low to
make it hard for substitutes§ Wars in middle east
3. Increase Production in America§ Decreased oil imports to become more “energy
independent”
4
Competitive Markets
5
Definition: Markets were sellers and buyers are small and numerous, so they take the market price as given when they decide how much to buy and sell.
Competitive Market Assumptions
1. Fragmented market: many buyers and sellersØ Implies buyers and sellers are price takers
2. Undifferentiated Products: consumers perceive the product to be identical so don’t care who they buy it from
3. Perfect Information about price: consumers know the price of all sellers
4. Equal Access to Resources: everyone has access to the same technology and inputs.
Ø Free entry into the market, so if profitable for new firms to enter into the market they will
6
Market Demand
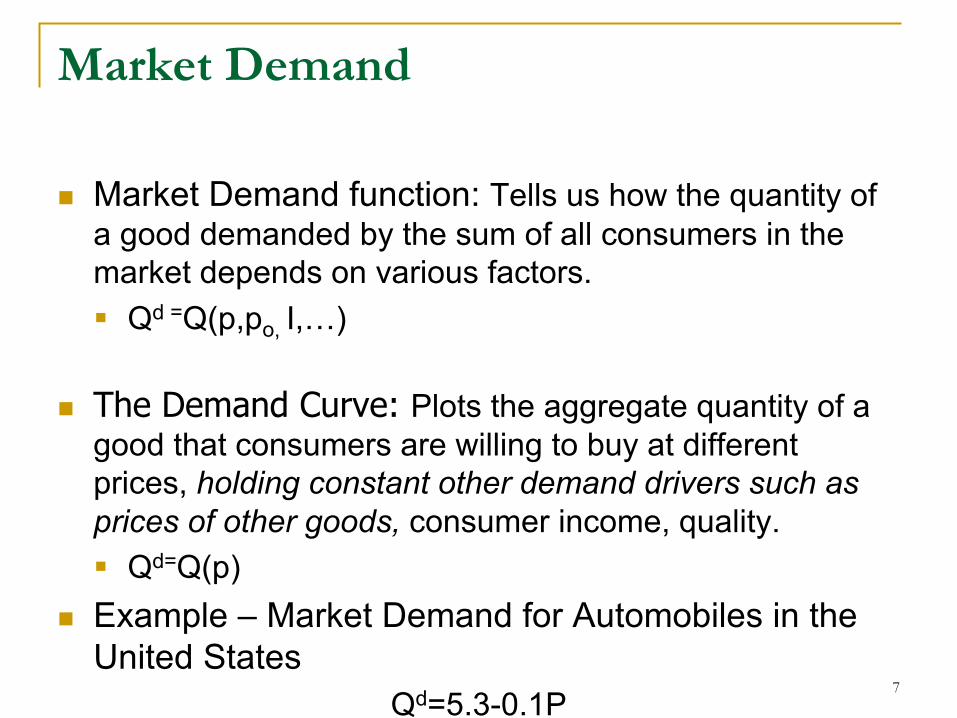
n Market Demand function: Tells us how the quantity of a good demanded by the sum of all consumers in the market depends on various factors.§ Qd =Q(p,po, I,…)
n The Demand Curve: Plots the aggregate quantity of a good that consumers are willing to buy at different prices, holding constant other demand drivers such as prices of other goods, consumer income, quality.§ Qd=Q(p)
n Example – Market Demand for Automobiles in the United States
Qd=5.3-0.1P7
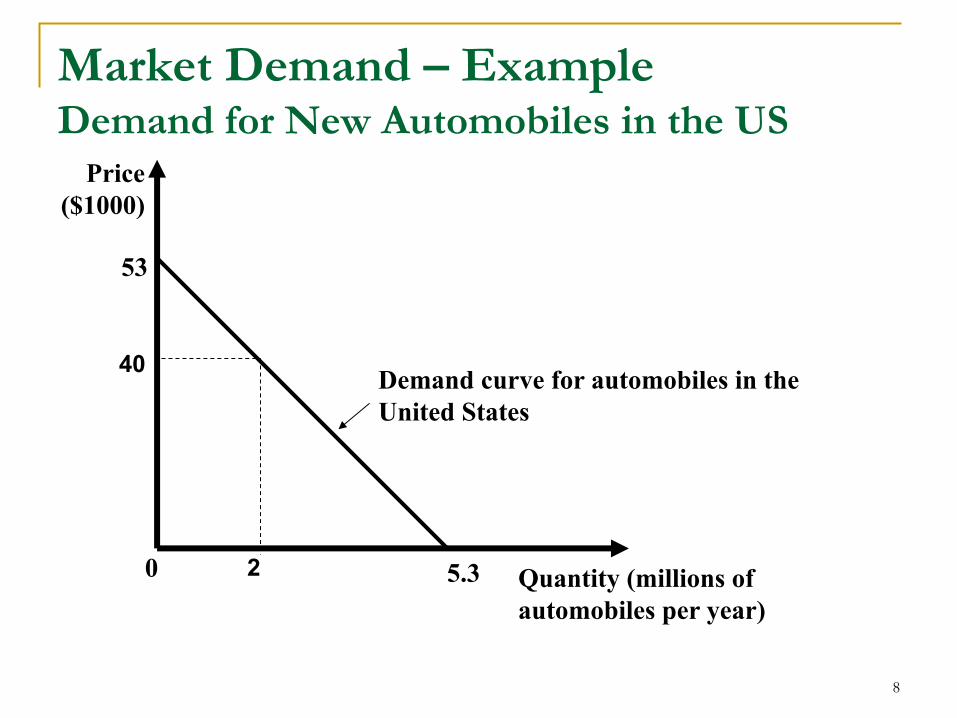
Market Demand – ExampleDemand for New Automobiles in the US
8
0 Quantity (millions ofautomobiles per year)
Price($1000)
Demand curve for automobiles in the United States
53
5.3
40
2
Market DemandNote
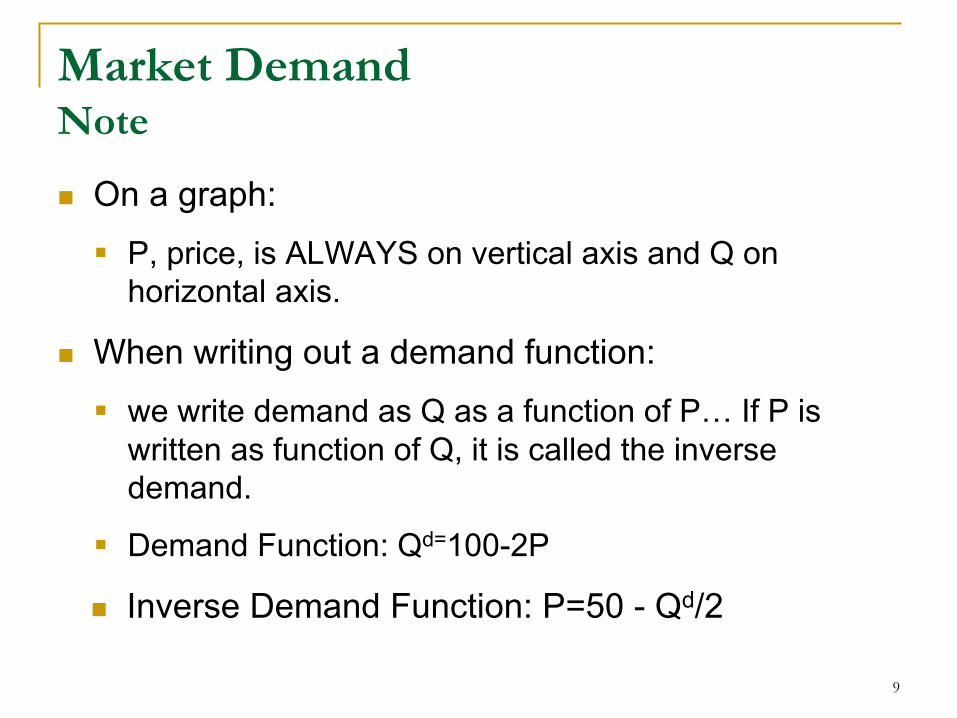
n On a graph: § P, price, is ALWAYS on vertical axis and Q on
horizontal axis.
n When writing out a demand function:§ we write demand as Q as a function of P… If P is
written as function of Q, it is called the inverse demand.
§ Demand Function: Qd=100-2P
n Inverse Demand Function: P=50 - Qd/2
9
Market DemandLaw of Demandn Law of Demand states that the quantity of a good
demanded decreases when the price of this good increases.§ Empirical regularity
n The demand curve shifts when factors other than own price change…§ If the change increases the willingness of consumers
to acquire the good, the demand curve shifts right§ If the change decreases the willingness of consumers
to acquire the good, the demand curve shifts left
10
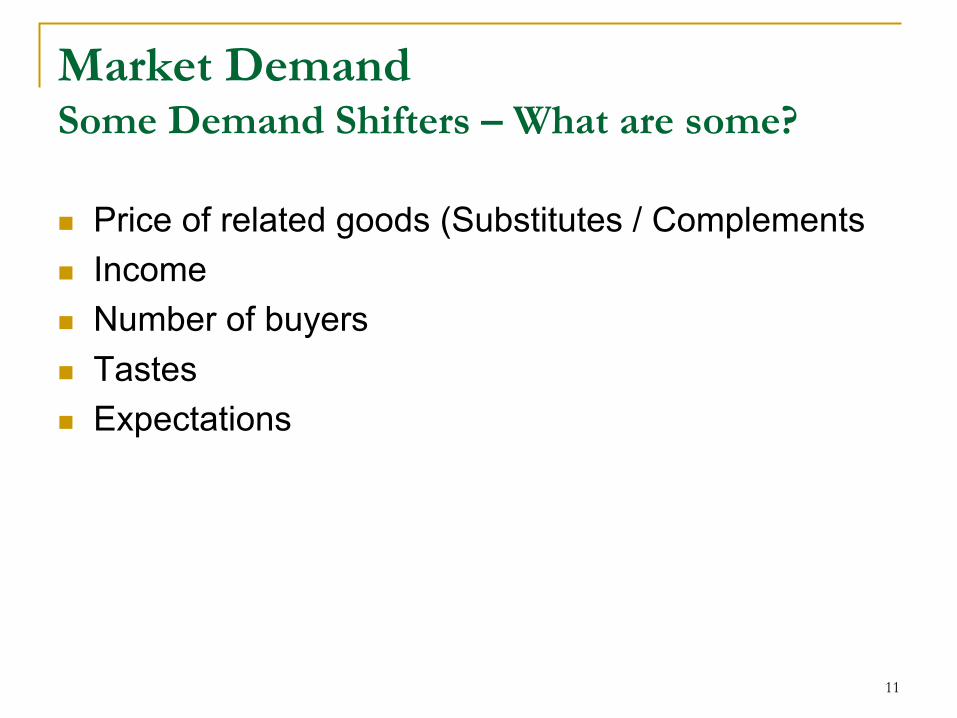
Market DemandSome Demand Shifters – What are some?
n Price of related goods (Substitutes / Complementsn Incomen Number of buyersn Tastesn Expectations
11
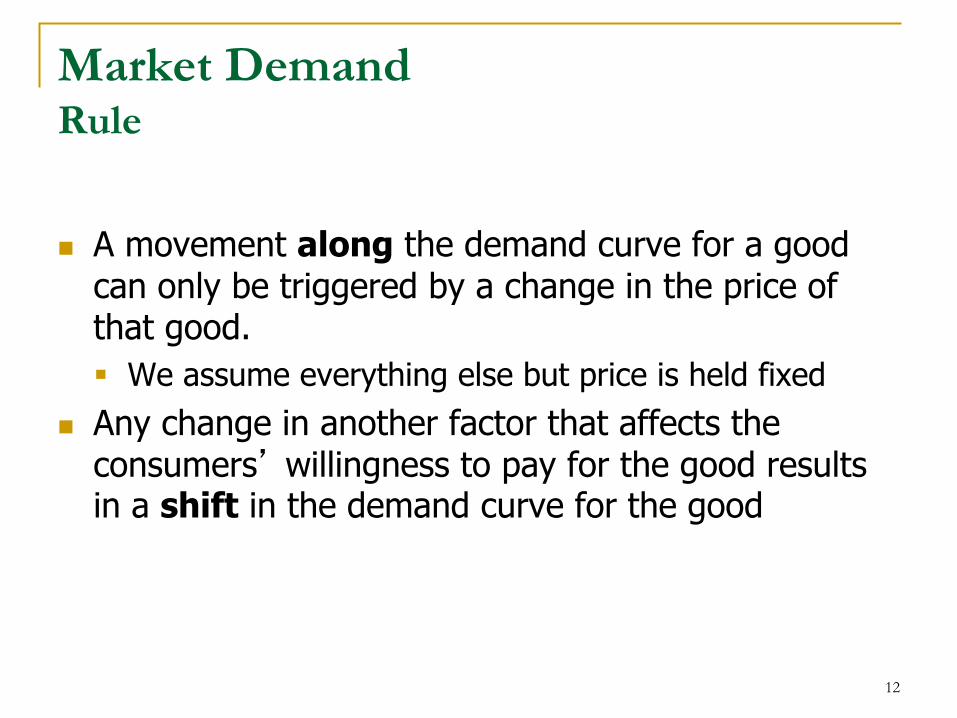
Market DemandRule
n A movement along the demand curve for a good can only be triggered by a change in the price of that good. § We assume everything else but price is held fixed
n Any change in another factor that affects the consumers’ willingness to pay for the good results in a shift in the demand curve for the good
12
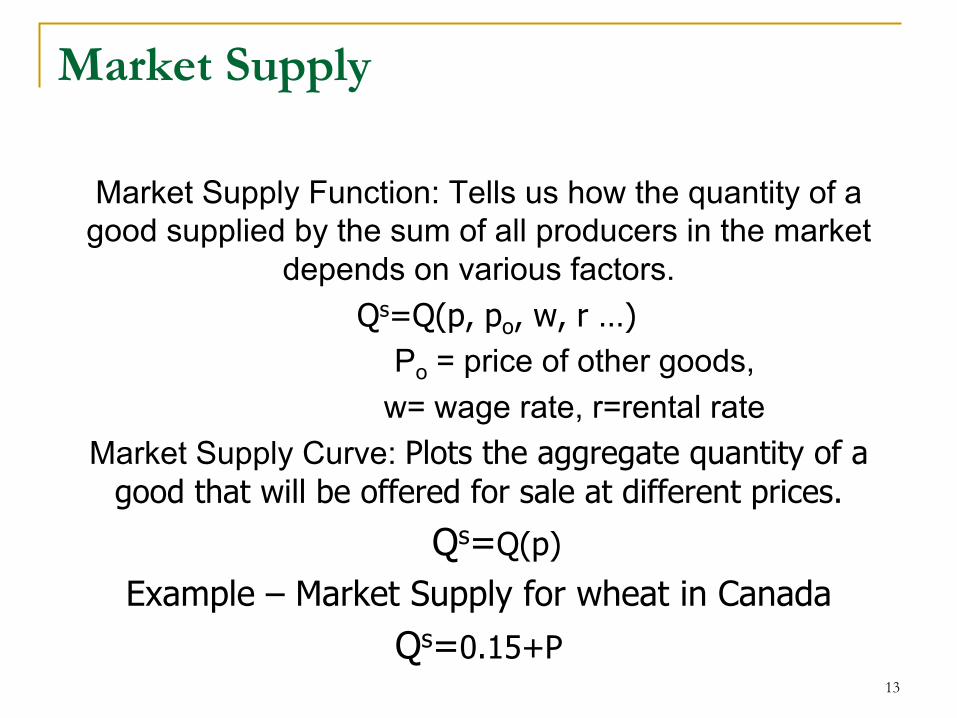
Market Supply
Market Supply Function: Tells us how the quantity of a good supplied by the sum of all producers in the market
depends on various factors.Qs=Q(p, po, w, r …)
Po = price of other goods, w= wage rate, r=rental rate
Market Supply Curve: Plots the aggregate quantity of a good that will be offered for sale at different prices.
Qs=Q(p)Example – Market Supply for wheat in Canada
Qs=0.15+P13
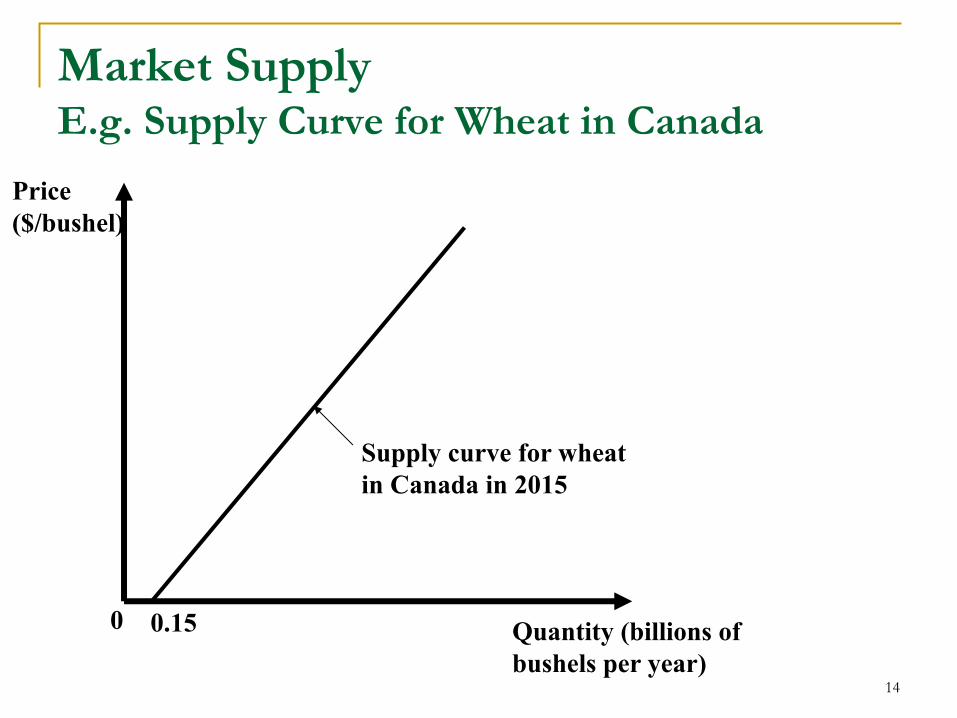
Market SupplyE.g. Supply Curve for Wheat in Canada
14
0 Quantity (billions ofbushels per year)
Price ($/bushel)
Supply curve for wheat in Canada in 2015
0.15
Market Supply
n The Law of Supply states that the quantity of a good offered increases when the price of this good increases.§ Empirical regularity
n The supply curve shifts when factors other than own price change…§ If the change increases the willingness of producers to
offer the good at the same price, the supply curve shifts right
§ If the change decreases the willingness of producers to offer the good at the same price, the supply curve shifts left
15
Market SupplySupply Shifters
n Price of related products n Input pricesn Number of sellersn Technologyn Expectations
16
Market SupplyRule
n A move along the supply curve for a good can only be triggered by a change in the price of that good.
n Any change in another factor that affects the producers’ willingness to sell the good results in a shift in the supply curve for the good.
17
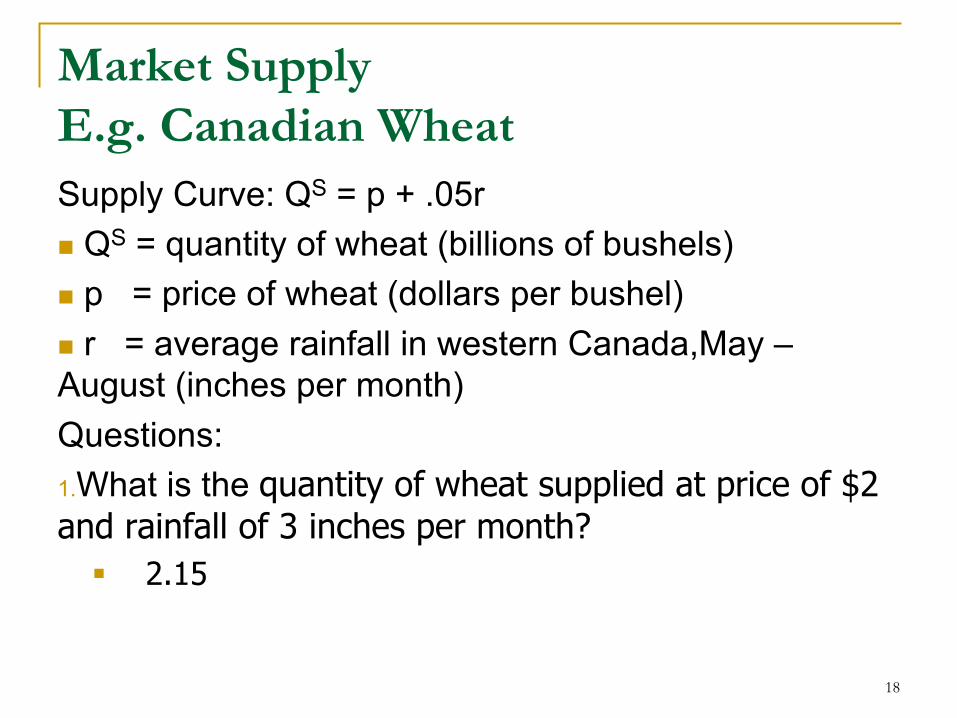
Market SupplyE.g. Canadian WheatSupply Curve: QS = p + .05rn QS = quantity of wheat (billions of bushels)n p = price of wheat (dollars per bushel)n r = average rainfall in western Canada,May –August (inches per month)Questions:1.What is the quantity of wheat supplied at price of $2 and rainfall of 3 inches per month?
§ 2.15
18
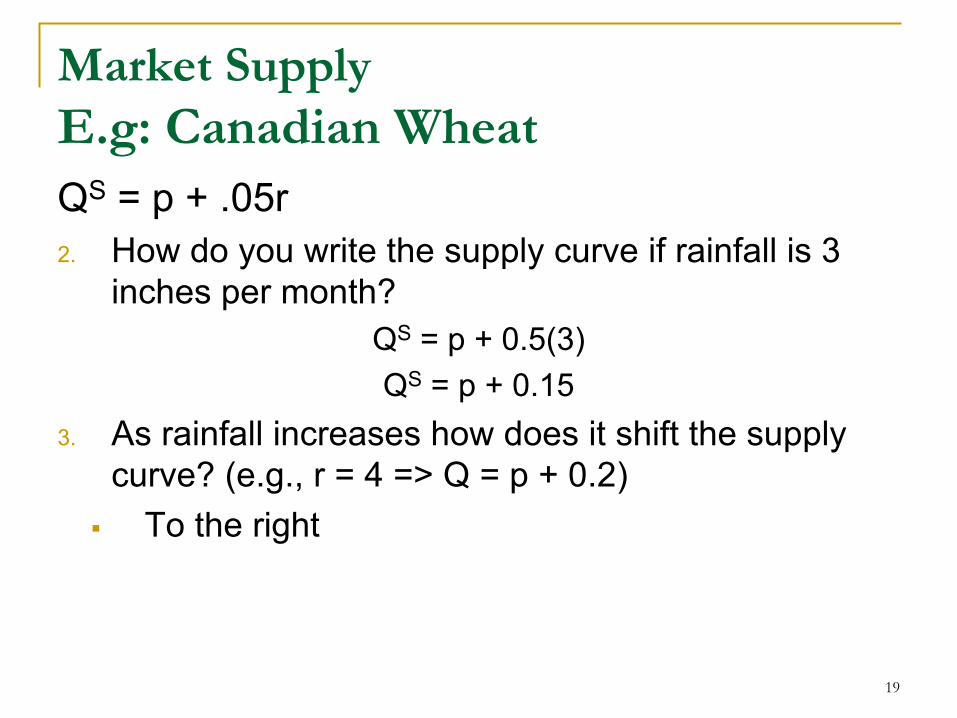
Market SupplyE.g: Canadian WheatQS = p + .05r2. How do you write the supply curve if rainfall is 3
inches per month?QS = p + 0.5(3)QS = p + 0.15
3. As rainfall increases how does it shift the supply curve? (e.g., r = 4 => Q = p + 0.2)
§ To the right
19
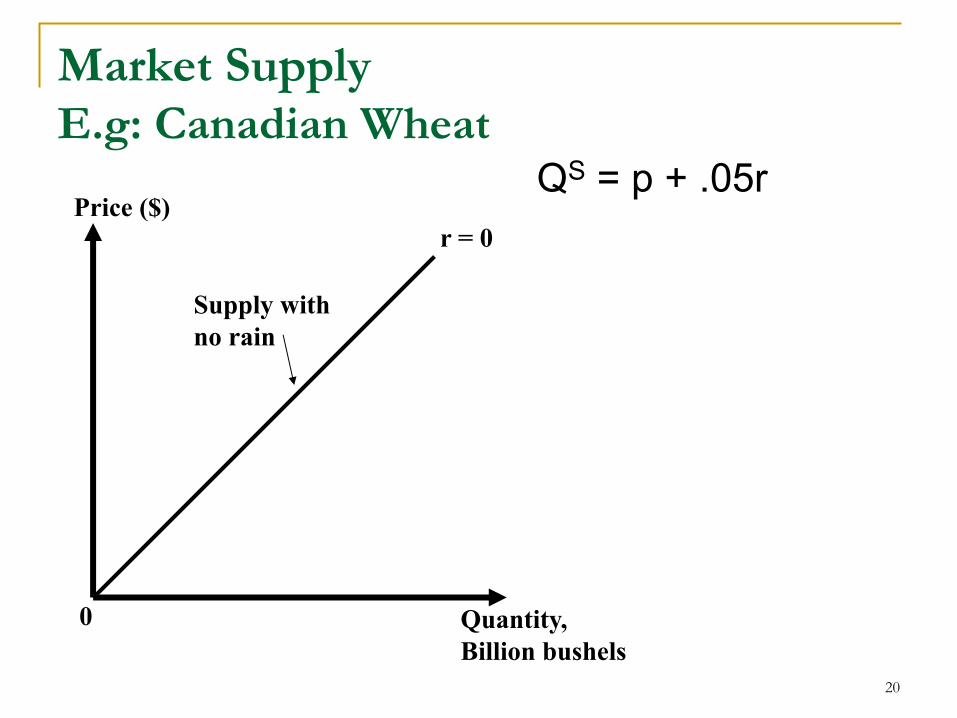
Market SupplyE.g: Canadian Wheat
20
Price ($)
Quantity, Billion bushels
0
r = 0
Supply withno rain
QS = p + .05r
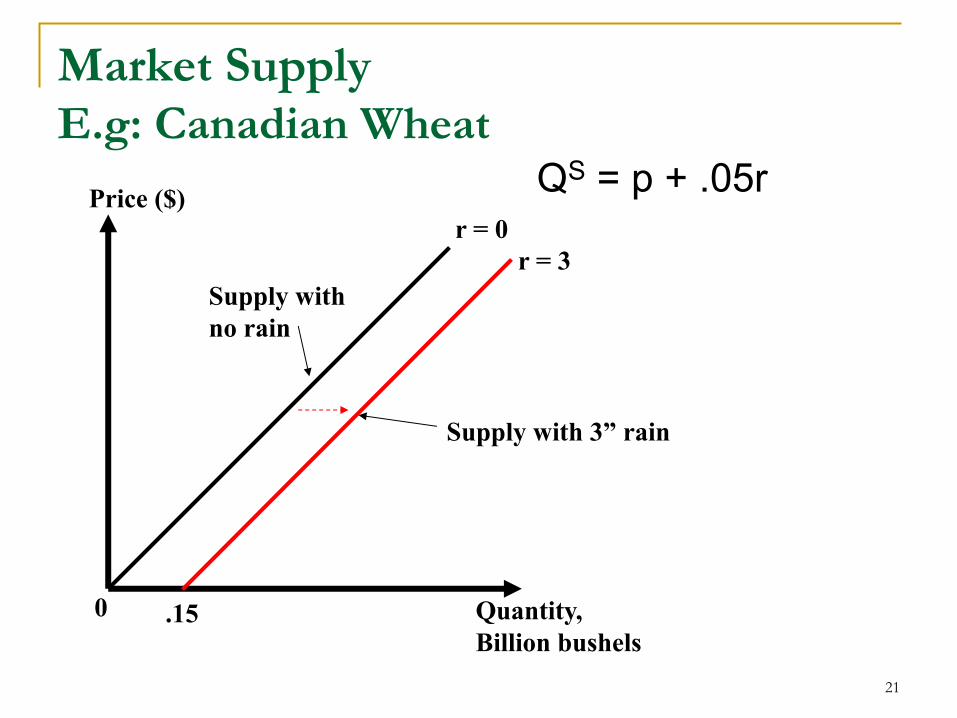
Market SupplyE.g: Canadian Wheat
21
Price ($)
Quantity, Billion bushels
0
r = 0r = 3
.15
Supply withno rain
Supply with 3” rain
QS = p + .05r
Market Equilibrium
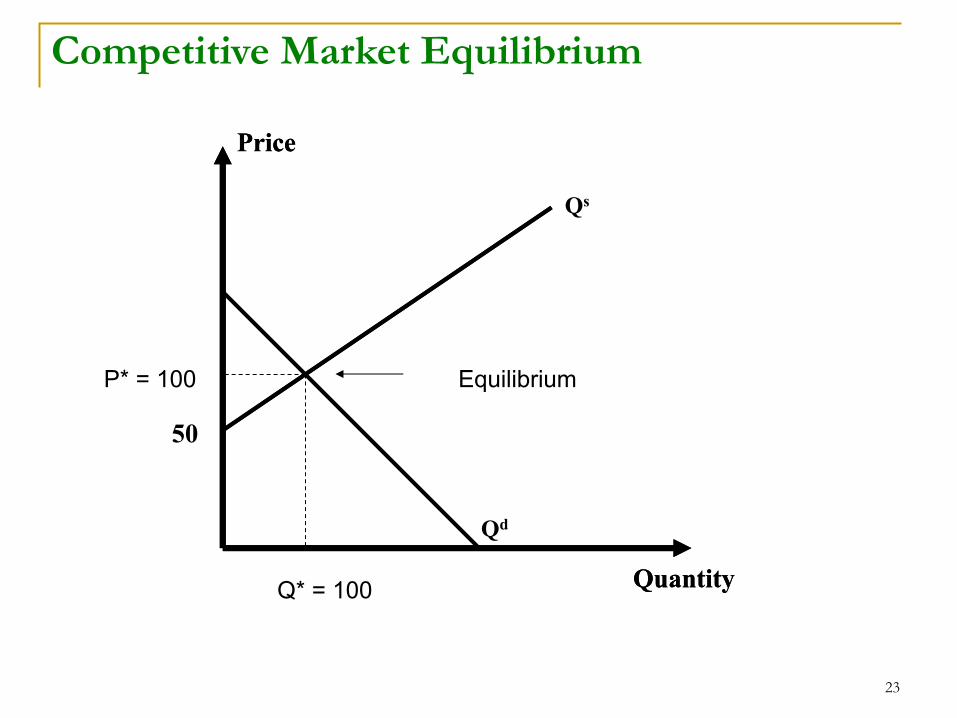
Definition: A market equilibrium is a price such that, at this price, the quantities demanded and supplied are the same.
Demand and supply curves intersect at equilibrium
22
23
Competitive Market Equilibrium
Price
Quantity
50
Price
QuantityQ* = 100
P* = 100 Equilibrium
Qs
Qd
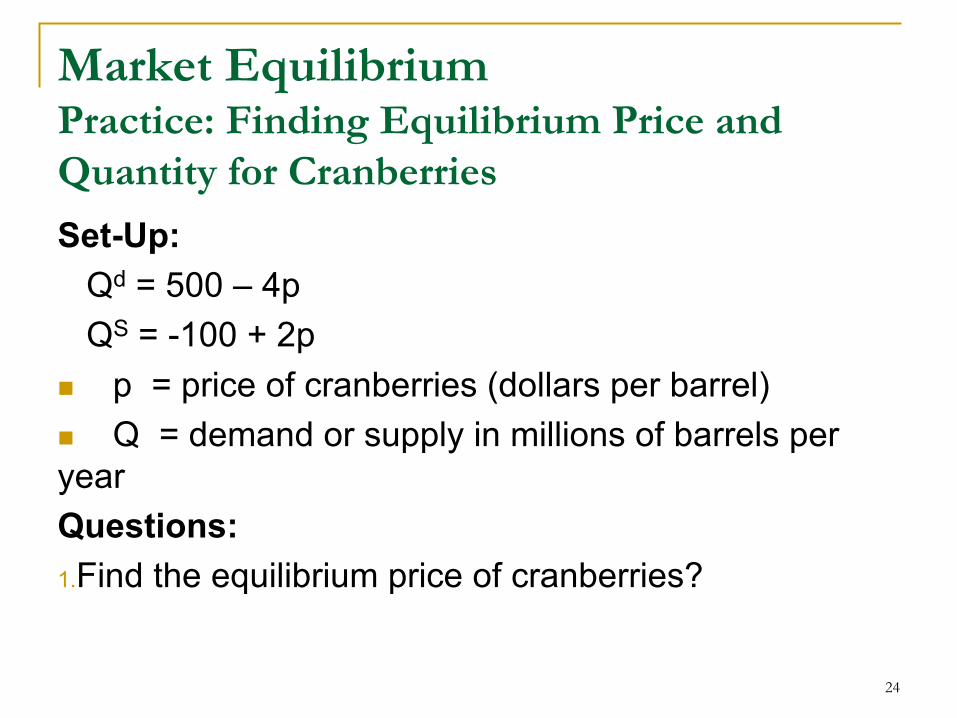
Market EquilibriumPractice: Finding Equilibrium Price and Quantity for CranberriesSet-Up:
Qd = 500 – 4pQS = -100 + 2p
n p = price of cranberries (dollars per barrel)n Q = demand or supply in millions of barrels per yearQuestions:1.Find the equilibrium price of cranberries?
24
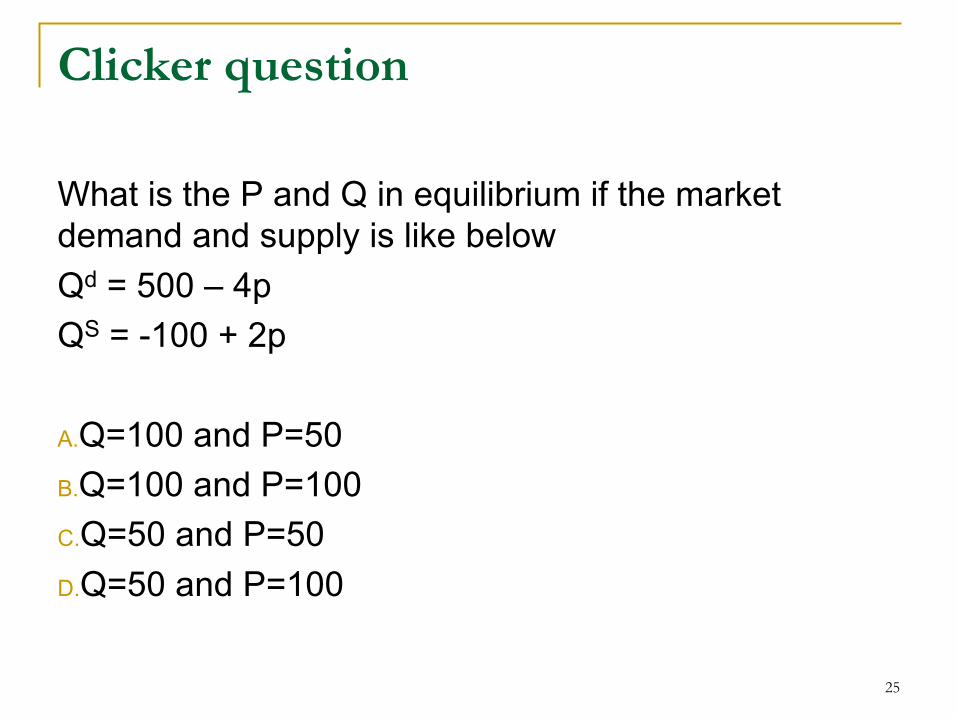
Clicker question
What is the P and Q in equilibrium if the market demand and supply is like belowQd = 500 – 4pQS = -100 + 2p
A.Q=100 and P=50B.Q=100 and P=100C.Q=50 and P=50D.Q=50 and P=100
25
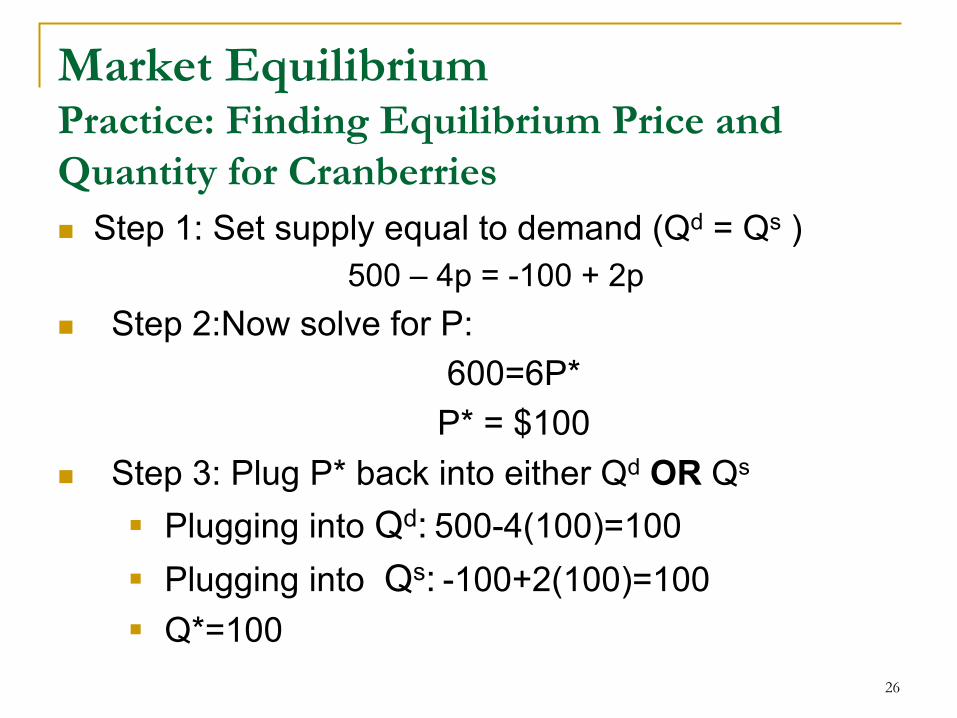
Market EquilibriumPractice: Finding Equilibrium Price and Quantity for Cranberriesn Step 1: Set supply equal to demand (Qd = Qs )
500 – 4p = -100 + 2p n Step 2:Now solve for P:
600=6P*P* = $100
n Step 3: Plug P* back into either Qd OR Qs
§ Plugging into Qd: 500-4(100)=100 § Plugging into Qs: -100+2(100)=100 § Q*=100
26
Market EquilibriumPractice: Finding Equilibrium Price and Quantity for Cranberries
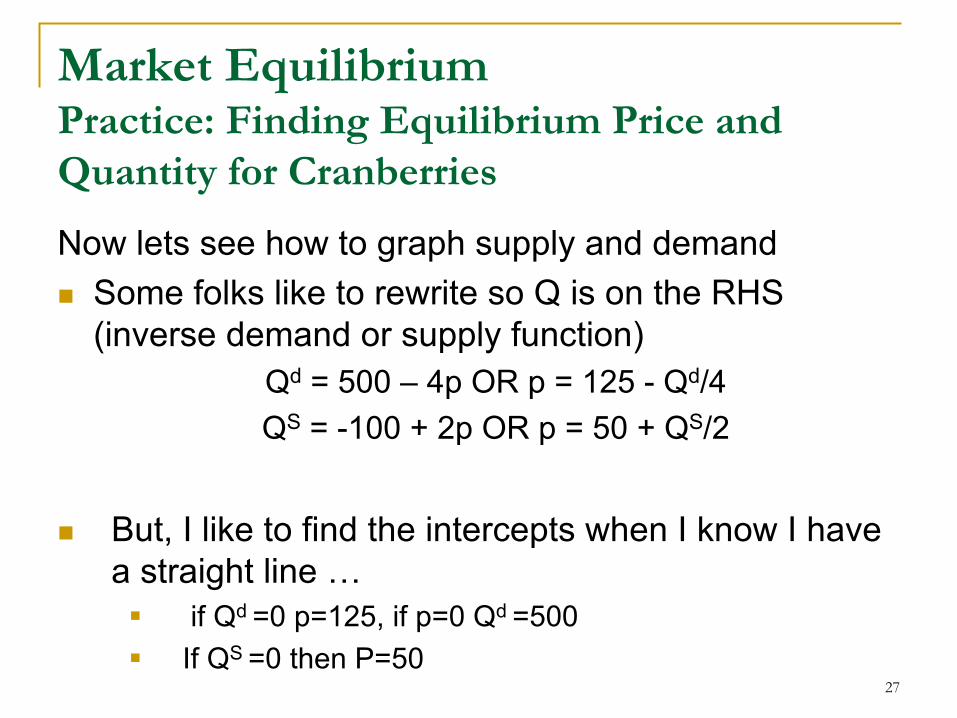
Now lets see how to graph supply and demandn Some folks like to rewrite so Q is on the RHS
(inverse demand or supply function)Qd = 500 – 4p OR p = 125 - Qd/4QS = -100 + 2p OR p = 50 + QS/2
n But, I like to find the intercepts when I know I have a straight line …§ if Qd =0 p=125, if p=0 Qd =500§ If QS =0 then P=50
27
28
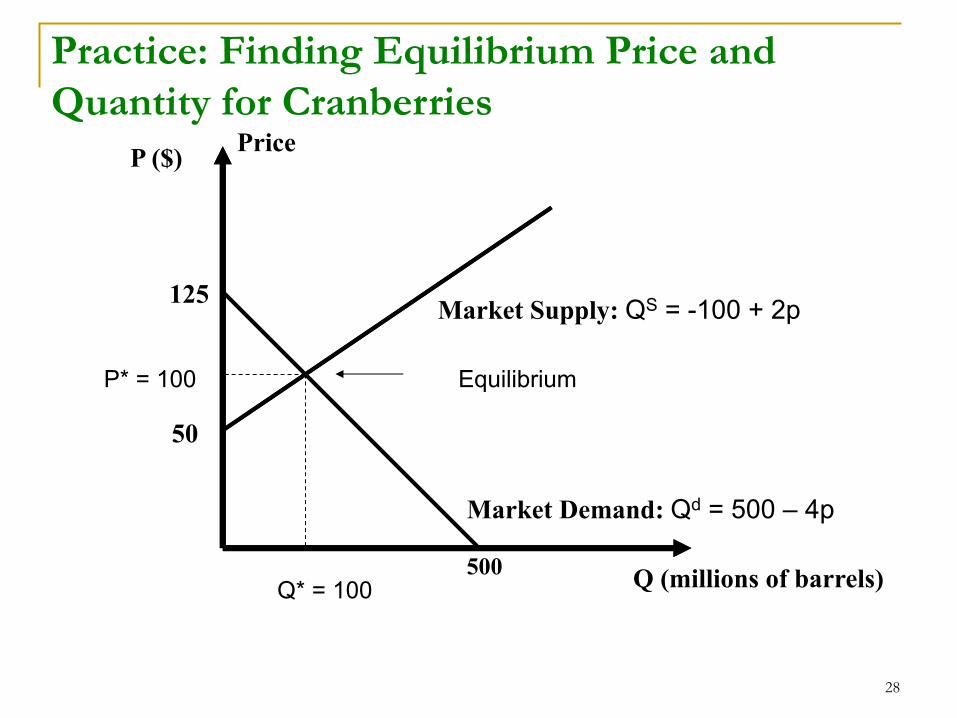
Practice: Finding Equilibrium Price and Quantity for Cranberries
Price
Q (millions of barrels)
Market Supply: QS = -100 + 2p
50
P ($)
Market Demand: Qd = 500 – 4p
125
Q* = 100
P* = 100 Equilibrium
500
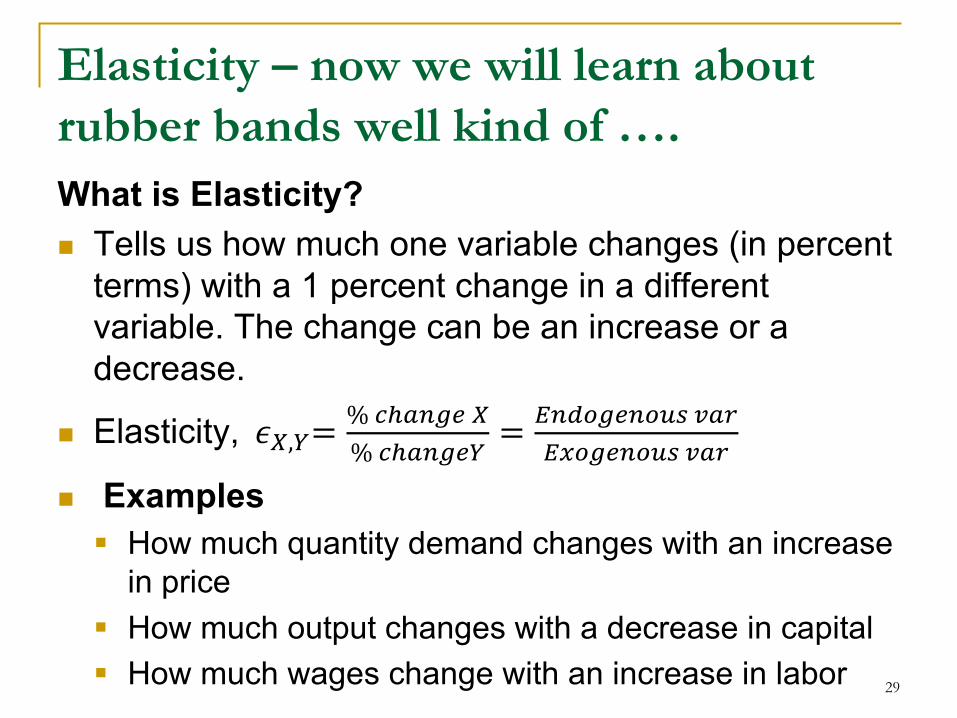
Elasticity – now we will learn about rubber bands well kind of ….What is Elasticity?n Tells us how much one variable changes (in percent
terms) with a 1 percent change in a different variable. The change can be an increase or a decrease.
n Elasticity,𝜖#,%=%()*+,-#%()*+,-%
= .+/0,-+0123*4.50,-+0123*4
n Examples§ How much quantity demand changes with an increase
in price§ How much output changes with a decrease in capital§ How much wages change with an increase in labor 29
Elasticity
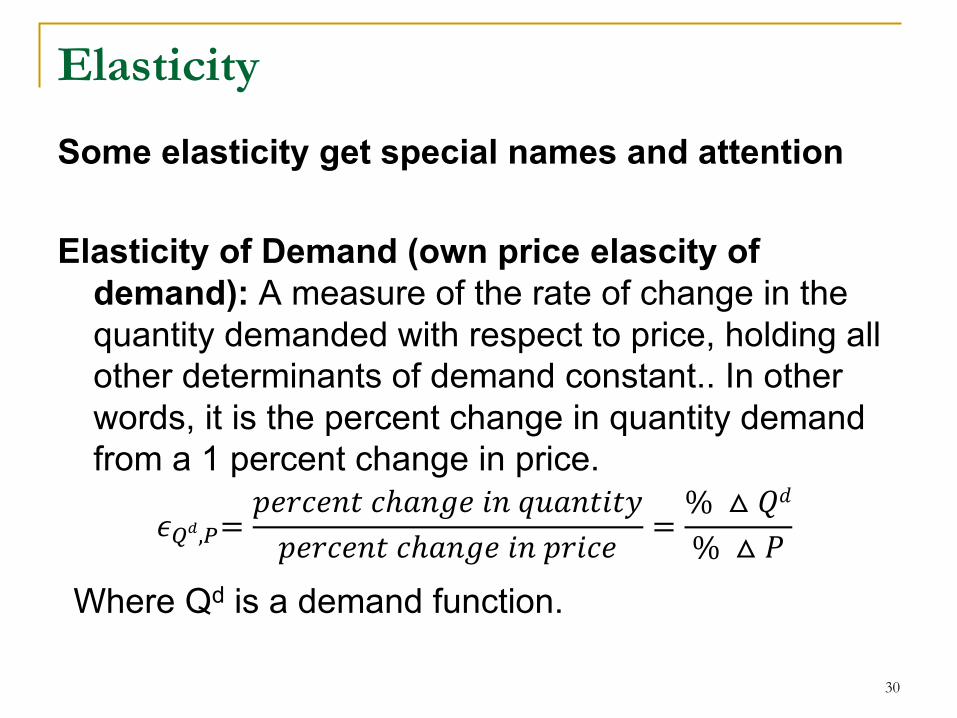
Some elasticity get special names and attention
Elasticity of Demand (own price elascity of demand): A measure of the rate of change in the quantity demanded with respect to price, holding all other determinants of demand constant.. In other words, it is the percent change in quantity demand from a 1 percent change in price.
Where Qd is a demand function.
30
𝜖6/,7=𝑝𝑒𝑟𝑐𝑒𝑛𝑡𝑐ℎ𝑎𝑛𝑔𝑒𝑖𝑛𝑞𝑢𝑎𝑛𝑡𝑖𝑡𝑦𝑝𝑒𝑟𝑐𝑒𝑛𝑡𝑐ℎ𝑎𝑛𝑔𝑒𝑖𝑛𝑝𝑟𝑖𝑐𝑒 =
% △ 𝑄𝑑
% △ 𝑃
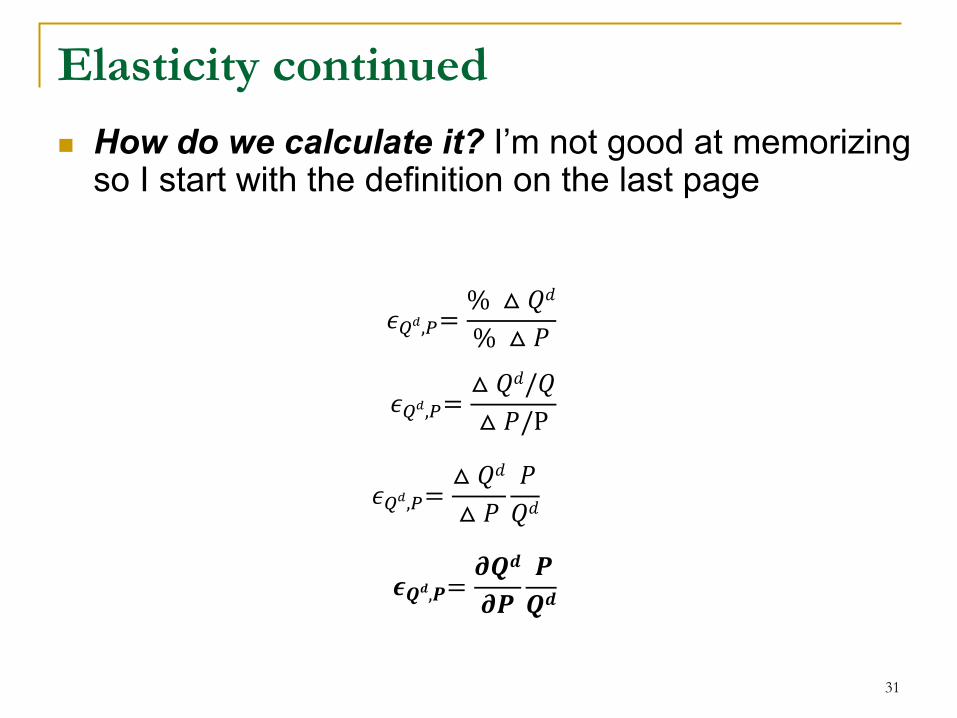
Elasticity continuedn How do we calculate it? I’m not good at memorizing
so I start with the definition on the last page
𝝐𝑸𝒅,𝑷=𝝏𝑸𝒅
𝝏𝑷𝑷𝑸𝒅
31
𝜖6/,7=% △ 𝑄𝑑
% △ 𝑃
𝜖6/,7=△ 𝑄𝑑/𝑄△ 𝑃/P
𝜖6/,7=△ 𝑄𝑑
△ 𝑃𝑃𝑄𝑑
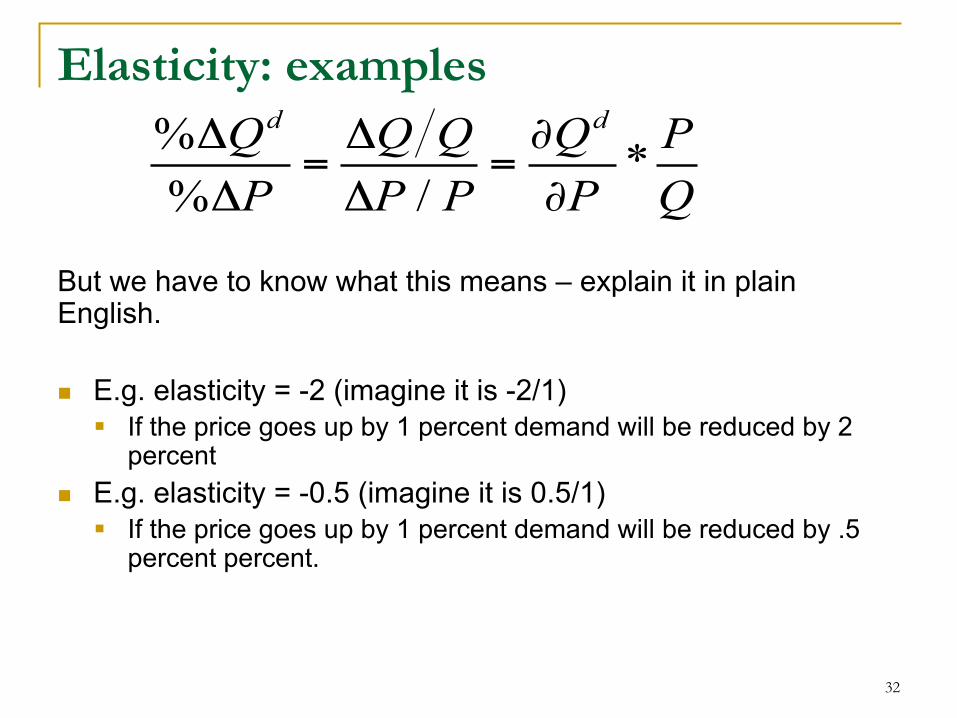
Elasticity: examples
But we have to know what this means – explain it in plain English.
n E.g. elasticity = -2 (imagine it is -2/1)§ If the price goes up by 1 percent demand will be reduced by 2
percentn E.g. elasticity = -0.5 (imagine it is 0.5/1)
§ If the price goes up by 1 percent demand will be reduced by .5 percent percent.
32
%ΔQd
%ΔP=ΔQ QΔP / P
=∂Qd
∂P* PQ
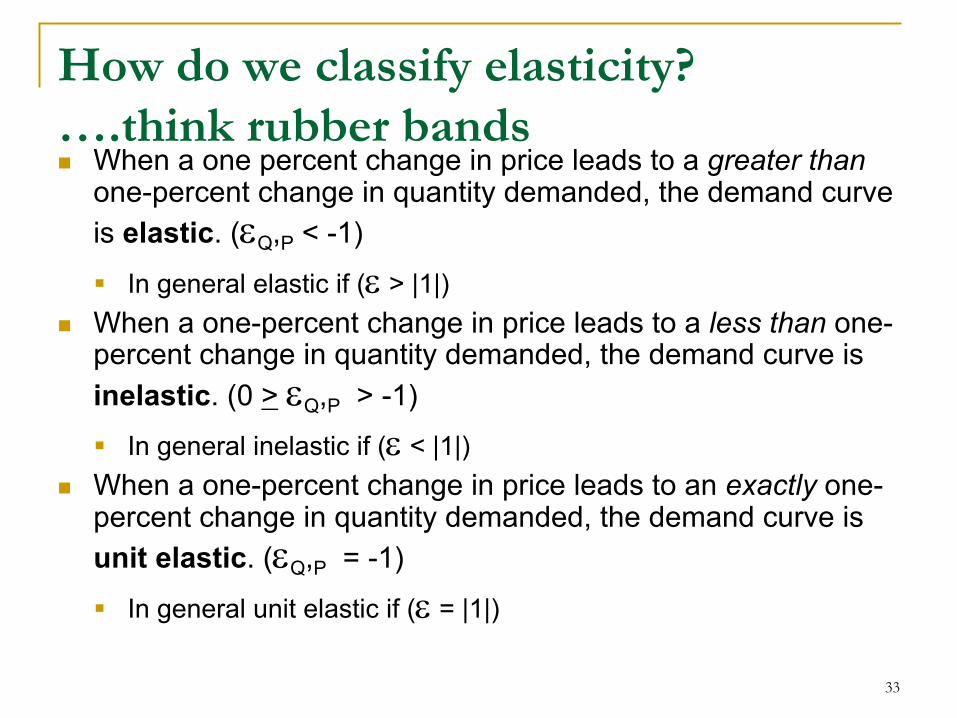
How do we classify elasticity?….think rubber bandsn When a one percent change in price leads to a greater than
one-percent change in quantity demanded, the demand curve is elastic. (eQ,P < -1)
§ In general elastic if (e > |1|)n When a one-percent change in price leads to a less than one-
percent change in quantity demanded, the demand curve is inelastic. (0 > eQ,P > -1)§ In general inelastic if (e < |1|)
n When a one-percent change in price leads to an exactly one-percent change in quantity demanded, the demand curve is unit elastic. (eQ,P = -1)
§ In general unit elastic if (e = |1|)
33
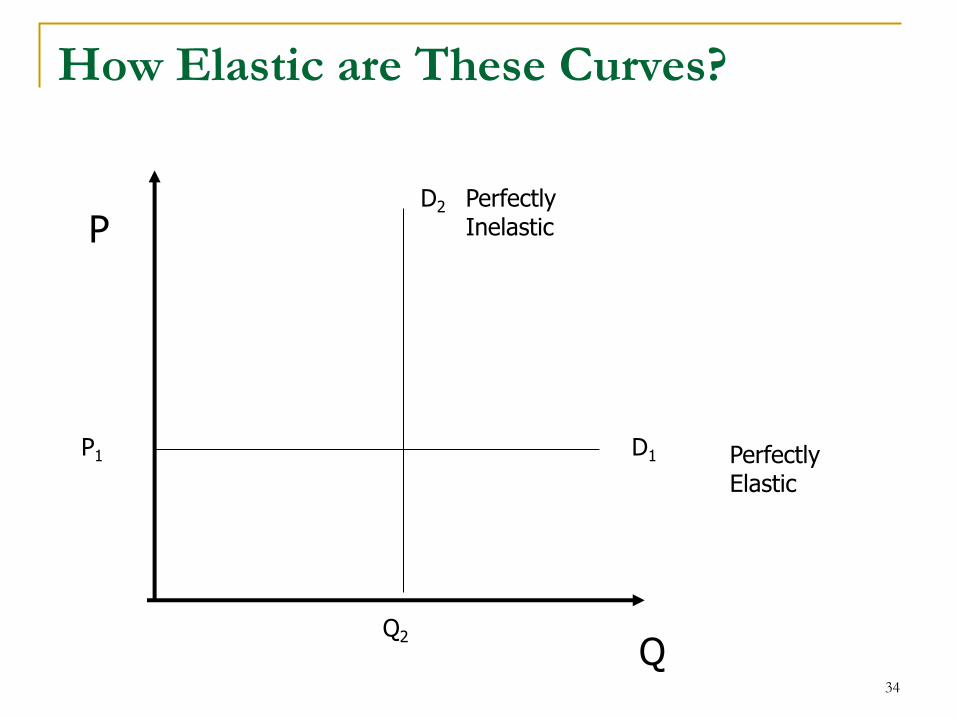
How Elastic are These Curves?
34
P
Q
D1
D2
Perfectly Elastic
Perfectly Inelastic
P1
Q2
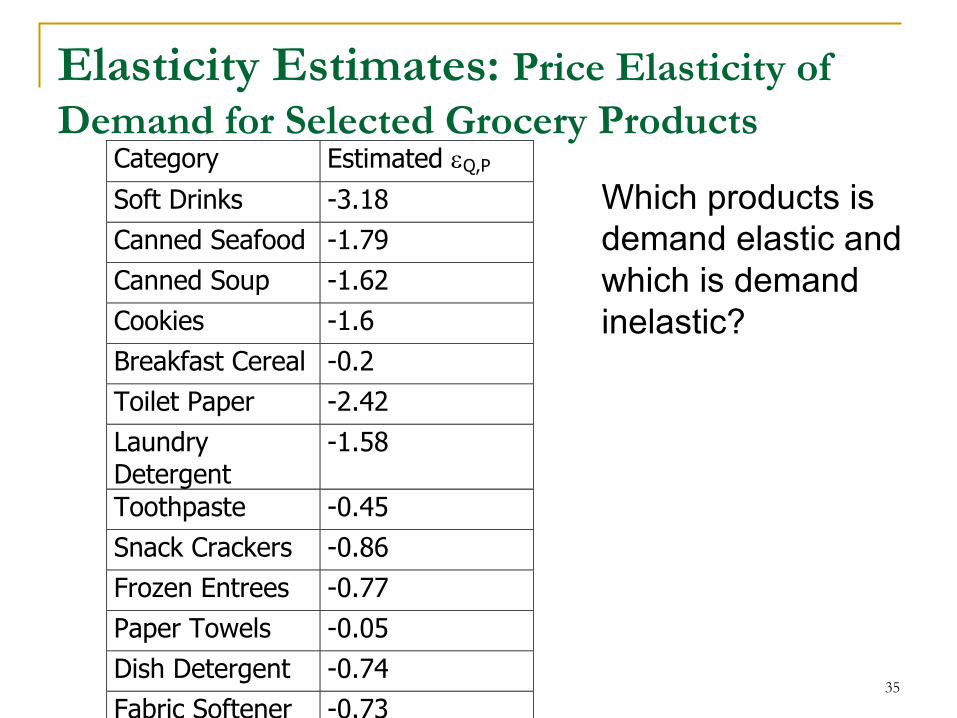
Elasticity Estimates: Price Elasticity of Demand for Selected Grocery Products
35
Category Estimated eQ,P
Soft Drinks -3.18Canned Seafood -1.79Canned Soup -1.62Cookies -1.6Breakfast Cereal -0.2Toilet Paper -2.42LaundryDetergent
-1.58
Toothpaste -0.45Snack Crackers -0.86Frozen Entrees -0.77Paper Towels -0.05Dish Detergent -0.74Fabric Softener -0.73
Which products is demand elastic and which is demand inelastic?
Elasticity Versus Slope
n Slope: is the ratio of absolute changes in quantity and price. (= DQ/DP).§ Measures the absolute change in quantity demanded
(in units of quantity) due to a one-unit change in price. § Qd=a-bP
§ a is the intercept, -b is the slopen Elasticity: is the ratio of relative (or percentage)
changes in quantity and price.§ Measure percentage change in quantity demanded
due to one-percent change in the price of the good
36
Elasticity Versus Slope
n Why elasticity is more useful?§ it is unitless so allows us to easily compare across
countries and goods§ Units of quantities will be different for different goods.
How to compare snow boards to oranges.§ Prices are different across different countries. More
difficult to compare Euro to US $
37
What Affects Elasticity?n Availability of Substitutes:
§ Demand is more(less) elastic when there are more(fewer) substitutes for a product.
§ E.g: Demand for all beverages less elastic than demand for Coca-Cola§ There are substitute for Coca-Cola, drink Pepsi§ It is harder to find a substitute for soda if you love soda.
n % of Income Spent on Product§ Demand is more(less) when the consumer’s expenditure
on the product is large(small)n Necessity Products
§ The demand is less price elastic when the product is a necessity
n Market Level vs Brand-Level Price§ Demand tends to be more elastic for a particular brand of a
good, than for the good in general 38
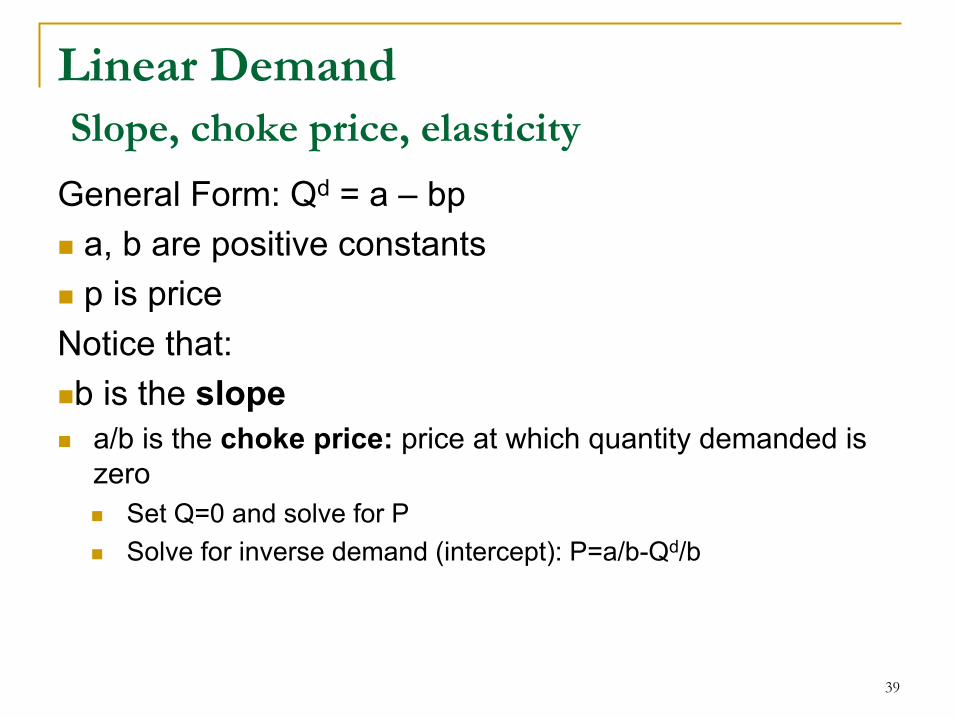
Linear Demand Slope, choke price, elasticity
General Form: Qd = a – bpn a, b are positive constantsn p is priceNotice that:nb is the slopen a/b is the choke price: price at which quantity demanded is
zeron Set Q=0 and solve for Pn Solve for inverse demand (intercept): P=a/b-Qd/b
39
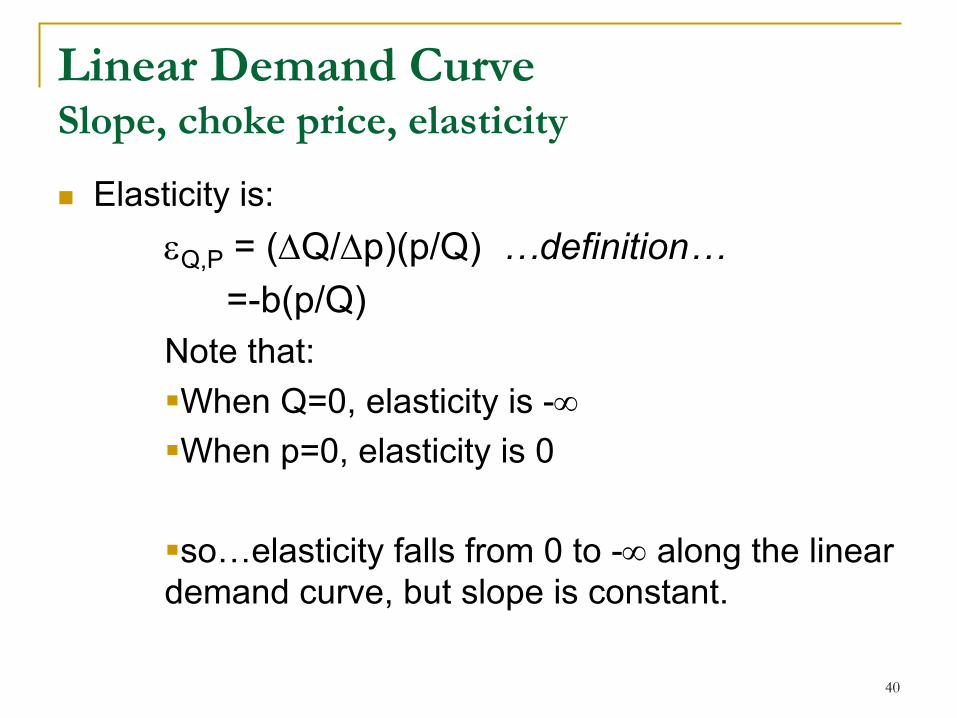
Linear Demand CurveSlope, choke price, elasticity
n Elasticity is:eQ,P = (DQ/Dp)(p/Q) …definition…
=-b(p/Q)Note that:§When Q=0, elasticity is -¥§When p=0, elasticity is 0
§so…elasticity falls from 0 to -¥ along the linear demand curve, but slope is constant.
40
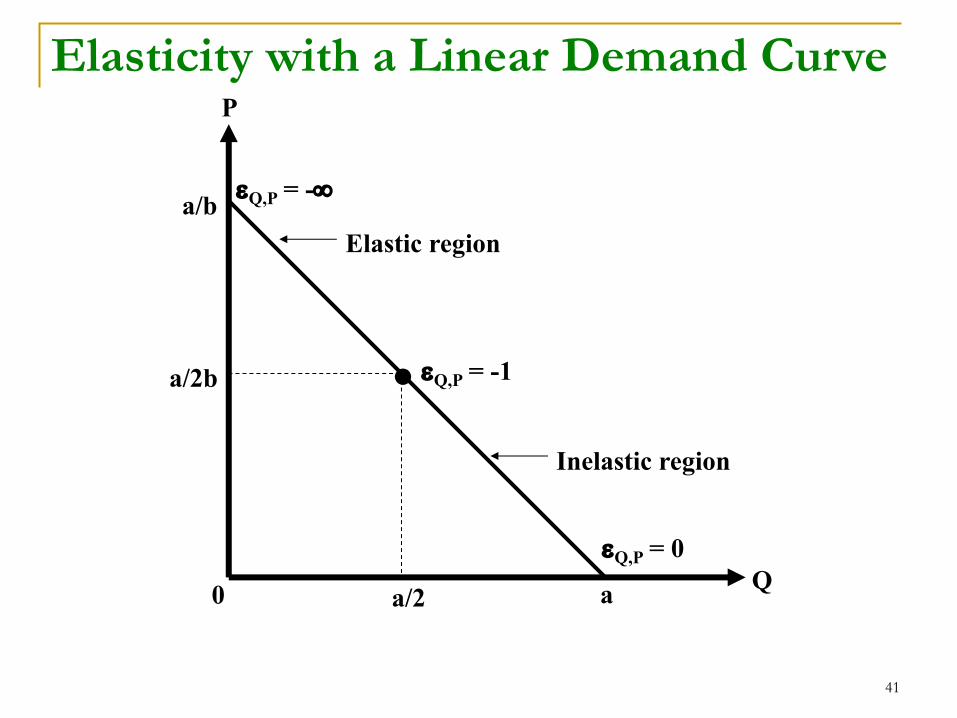
41
0
P
Qa/2 a
a/2b
a/b
• eQ,P = -1
Inelastic region
Elastic region
eQ,P = -¥
eQ,P = 0
Elasticity with a Linear Demand Curve
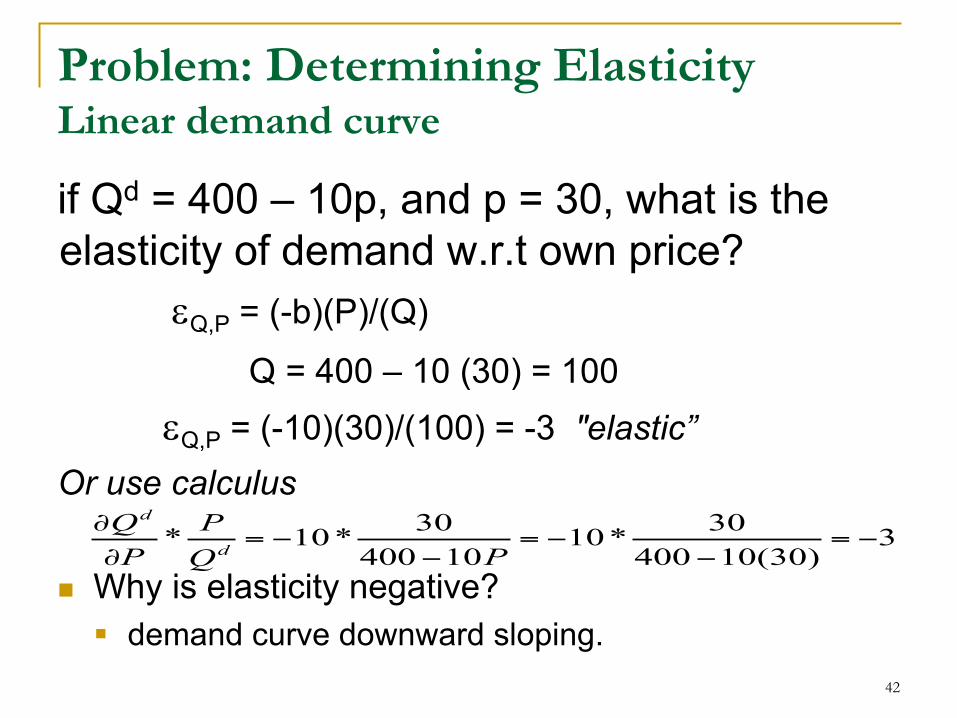
Problem: Determining ElasticityLinear demand curve
if Qd = 400 – 10p, and p = 30, what is the elasticity of demand w.r.t own price?
eQ,P = (-b)(P)/(Q)
Q = 400 – 10 (30) = 100eQ,P = (-10)(30)/(100) = -3 "elastic”
Or use calculus
n Why is elasticity negative? § demand curve downward sloping.
42
∂Qd
∂P* PQd
= −10* 30400−10P
= −10* 30400−10(30)
= −3
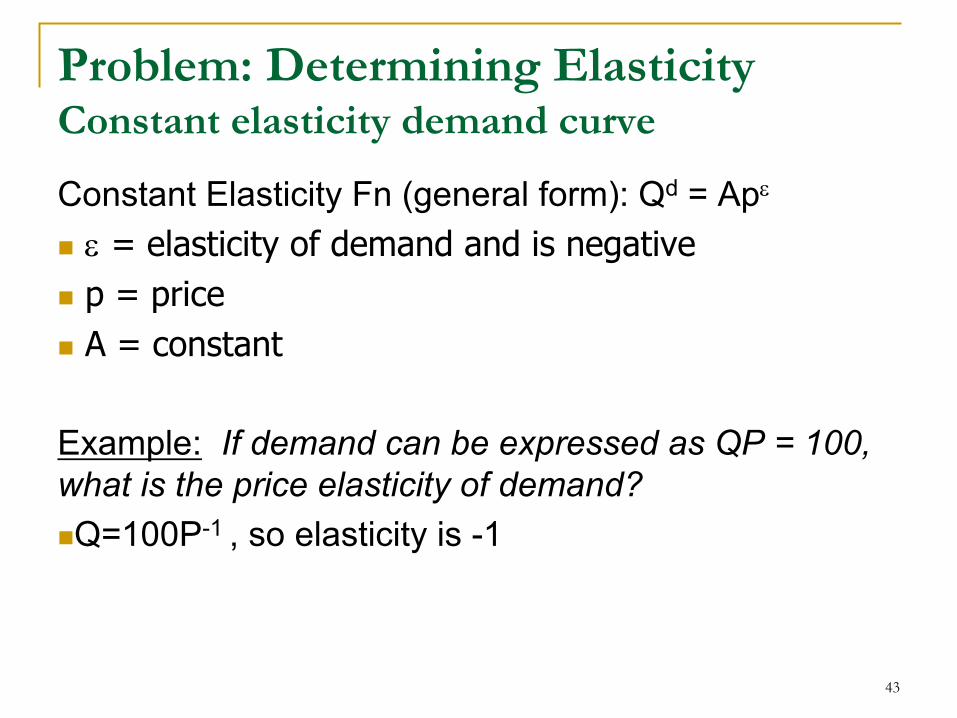
Problem: Determining ElasticityConstant elasticity demand curve
Constant Elasticity Fn (general form): Qd = Ape
n e = elasticity of demand and is negativen p = pricen A = constant
Example: If demand can be expressed as QP = 100, what is the price elasticity of demand?nQ=100P-1 , so elasticity is -1
43
44
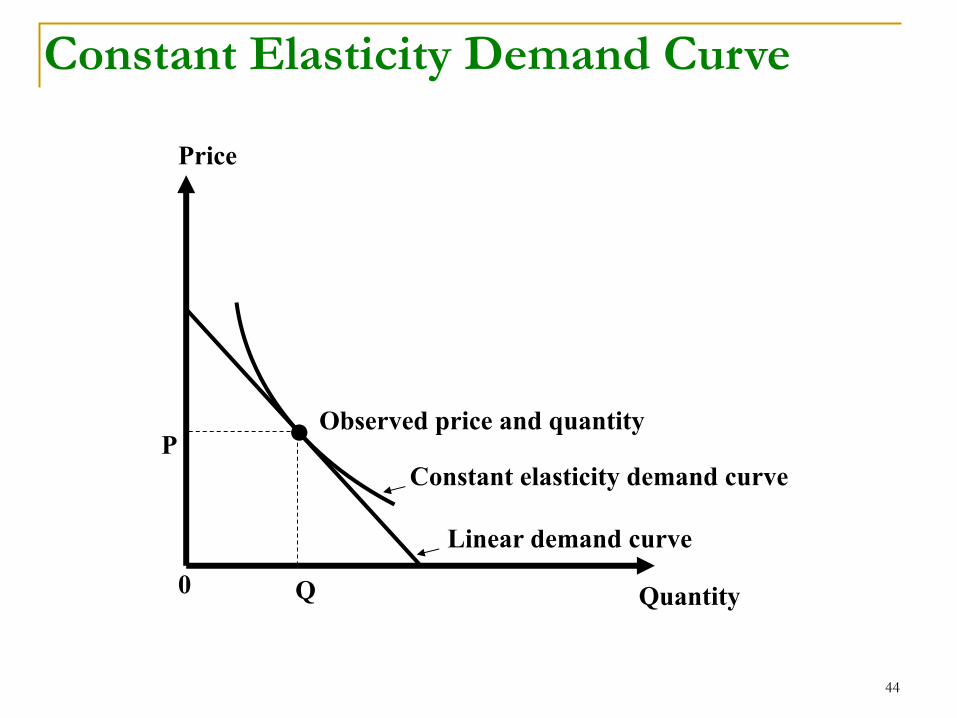
Quantity
Price
0 Q
P • Observed price and quantity
Constant elasticity demand curve
Linear demand curve
Constant Elasticity Demand Curve
Importance of Brands
45
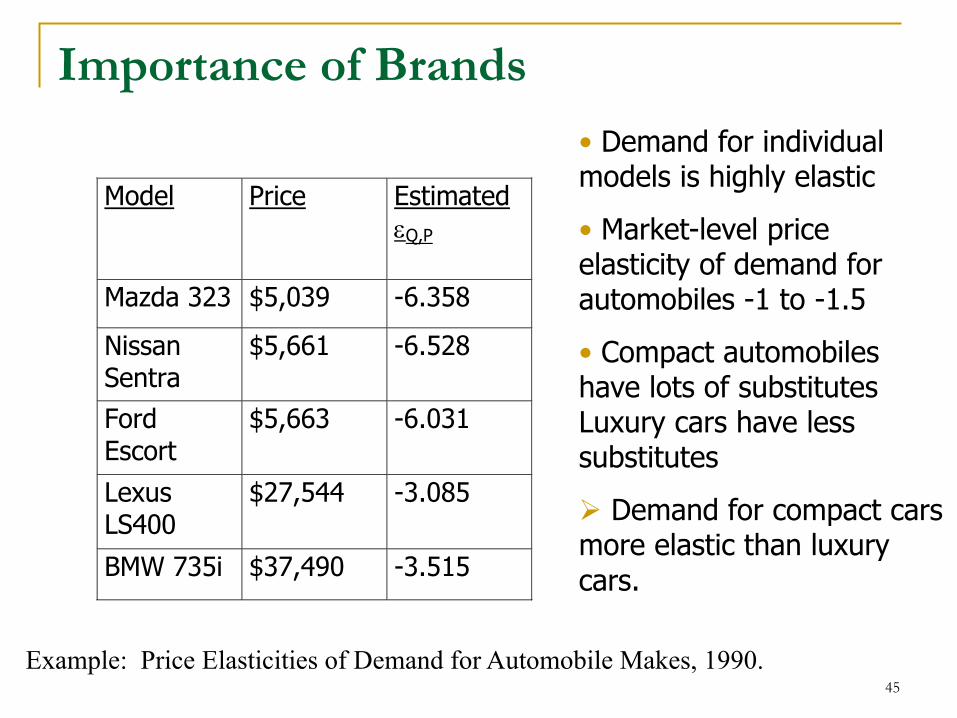
Model Price Estimated eQ,P
Mazda 323 $5,039 -6.358
Nissan Sentra
$5,661 -6.528
Ford Escort
$5,663 -6.031
Lexus LS400
$27,544 -3.085
BMW 735i $37,490 -3.515
Example: Price Elasticities of Demand for Automobile Makes, 1990.
• Demand for individual models is highly elastic• Market-level price elasticity of demand for automobiles -1 to -1.5• Compact automobiles have lots of substitutes Luxury cars have less substitutesØ Demand for compact cars more elastic than luxury cars.
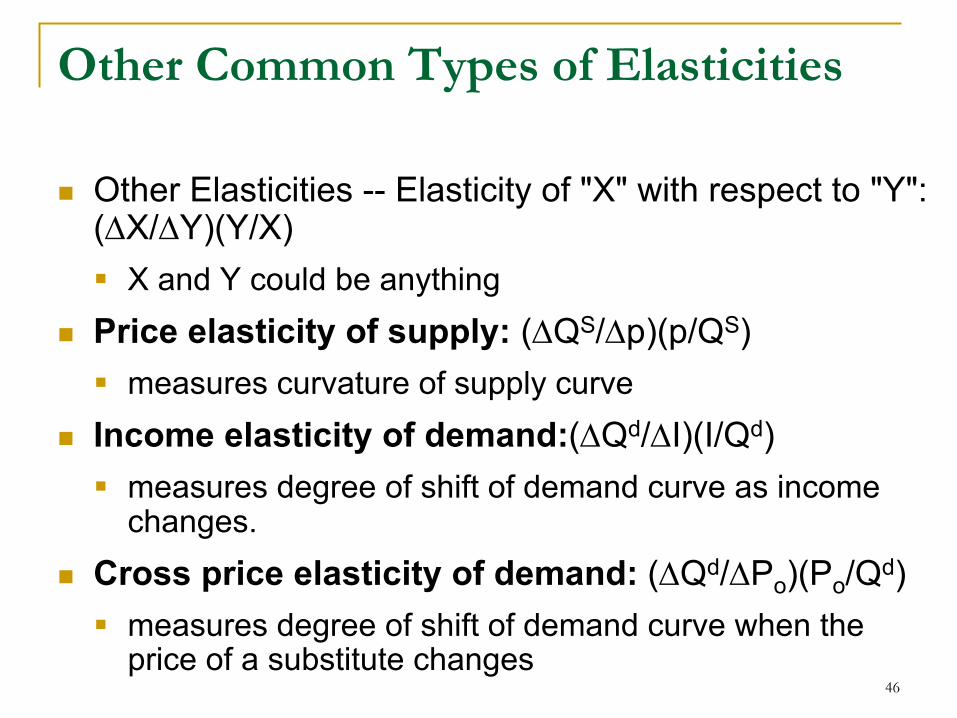
Other Common Types of Elasticities
n Other Elasticities -- Elasticity of "X" with respect to "Y": (DX/DY)(Y/X)§ X and Y could be anything
n Price elasticity of supply: (DQS/Dp)(p/QS)§ measures curvature of supply curve
n Income elasticity of demand:(DQd/DI)(I/Qd)§ measures degree of shift of demand curve as income
changes.n Cross price elasticity of demand: (DQd/DPo)(Po/Qd)
§ measures degree of shift of demand curve when the price of a substitute changes
46
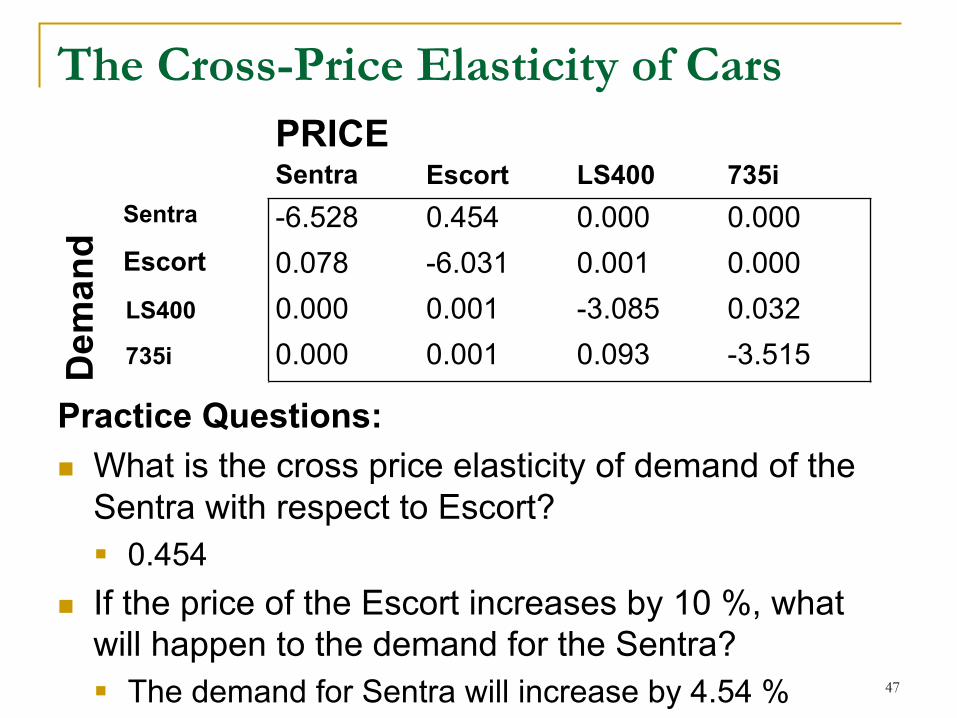
The Cross-Price Elasticity of Cars
Practice Questions:n What is the cross price elasticity of demand of the
Sentra with respect to Escort?§ 0.454
n If the price of the Escort increases by 10 %, what will happen to the demand for the Sentra?§ The demand for Sentra will increase by 4.54 % 47
PRICESentra Escort LS400 735i
Dem
and
Sentra -6.528 0.454 0.000 0.000Escort 0.078 -6.031 0.001 0.000LS400 0.000 0.001 -3.085 0.032735i 0.000 0.001 0.093 -3.515
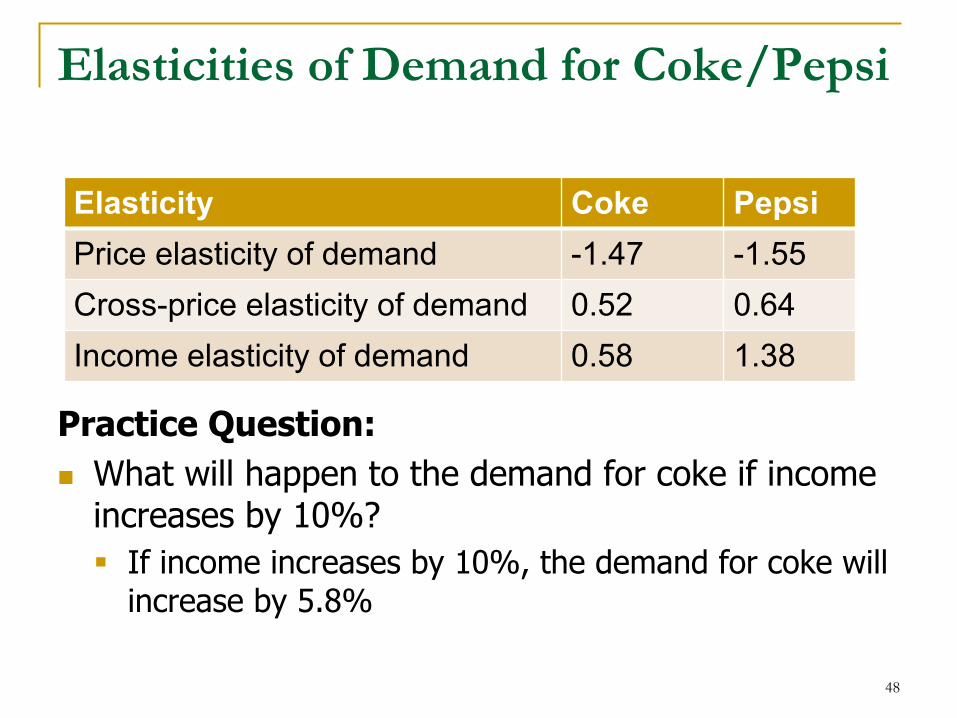
Elasticities of Demand for Coke/Pepsi
Practice Question:n What will happen to the demand for coke if income
increases by 10%? § If income increases by 10%, the demand for coke will
increase by 5.8%
48
Elasticity Coke PepsiPrice elasticity of demand -1.47 -1.55Cross-price elasticity of demand 0.52 0.64Income elasticity of demand 0.58 1.38