Embed Size (px)
Citation preview
VDOT BMP Design Manual of Practice
i
Chapter 2 – Dry Extended Detention Basin
Chapter 2 – Dry Extended Detention Basin TABLE OF CONTENTS
2.1 Overview of Practice ............................................................................................................. 1
2.2 Site Constraints and Siting of the Facility .......................................................................... 2
2.2.1 Minimum Drainage Area .............................................................................................. 2
2.2.2 Maximum Drainage Area ............................................................................................. 5
2.2.3 Separation Distances ................................................................................................... 5
2.2.4 Site Slopes ................................................................................................................... 5
2.2.5 Site Soils ...................................................................................................................... 6
2.2.6 Rock ............................................................................................................................. 6
2.2.7 Existing Utilities ............................................................................................................ 6
2.2.8 Karst ............................................................................................................................. 6
2.2.9 Wetlands ...................................................................................................................... 6
2.2.10 Upstream Sediment Considerations ............................................................................ 7
2.2.11 Floodplains ................................................................................................................... 7
2.2.12 Basin Location .............................................................................................................. 7
2.3 General Design Guidelines .................................................................................................. 8
2.3.1 Foundation and Embankment Material ........................................................................ 8
2.3.2 Outfall Piping ................................................................................................................ 8
2.3.3 Embankment ................................................................................................................ 8
2.3.4 Embankment Height..................................................................................................... 9
2.3.5 Prevention of Short-Circuiting ...................................................................................... 9
2.3.6 Ponded Depth .............................................................................................................. 9
2.3.7 Principal Spillway Design ............................................................................................. 9
2.3.8 Emergency Spillway Stabilization .............................................................................. 10
2.3.9 Fencing ...................................................................................................................... 10
2.3.10 Sediment Forebays .................................................................................................... 10
2.3.11 Discharge Flows ......................................................................................................... 10
2.4 Design Process ................................................................................................................... 11
Step 1. Compute the Required Water Quality Volume ....................................................... 11
Step 2. Estimate the Volume Required for Mitigation of Post-Development Runoff Peaks to Equal or Less than Pre-Development Levels .......................................... 13
Step 3. Development of Runoff Hydrographs ..................................................................... 17
Table of Contents
VDOT BMP Design Manual of Practice
ii
Chapter 2 – Dry Extended Detention Basin
Step 4. Development of Storage Versus Elevation Data .................................................... 19
Step 5. Design of the Water Quality Control Orifice ............................................................ 20
Step 6. Design of the Principal Spillway .............................................................................. 22
Step 6A. Size Basin Outfall Culvert ....................................................................................... 22
Step 6B. Design the 2-Year Control Outlet............................................................................ 25
Step 6C. Design the 10-Year Control Outlet ......................................................................... 28
Step 6D. Evaluate the Performance of the Principal Spillway Under 100-Year Runoff Conditions ............................................................................................................... 33
Step 6E. Verify Target Draw Down Time for Water Quality Volume ..................................... 33
Step 7. Design of the Emergency Spillway ......................................................................... 35
Step 8. Provision for Seepage Control ................................................................................ 41
Step 9. Embankment Design .............................................................................................. 42
Step 10. Buoyancy Calculation ............................................................................................. 44
Step 11. Design of Sediment Forebays ................................................................................ 46
Step 12. Landscaping............................................................................................................ 49
Table of Contents
VDOT BMP Design Manual of Practice
iii
Chapter 2 – Dry Extended Detention Basin
LIST OF TABLES Table 2.1 Hydrologic Characteristics of Example Project Site .............................................. 11 Table 2.2 Peak Rates of Runoff (cfs) .................................................................................... 11 Table 2.3 Rainfall Regression Constants for Montgomery County ....................................... 15 Table 2.4 Basin Storage Versus Elevation Data ................................................................... 20 Table 2.5 Preliminary Stage – Discharge Relationship ......................................................... 27 Table 2.6 Final Stage – Discharge Relationship ................................................................... 31 Table 2.7 100-Year Post-Development Runoff Parameters ................................................. 36 Table 2.8 Armored Emergency Spillway Parameters ........................................................... 38 Table 2.9 Exit Channel Permissible Velocities ...................................................................... 39 Table 2.10 Summary of Pond Inflow Points ............................................................................ 47
LIST OF FIGURES
Figure 2.1 Schematic Dry Extended Detention Basin Plan View............................................... 2 Figure 2.2 DCR Recommended Outlet Configuration 1 for the Control of Trash, Sediment
and Debris (Virginia Stormwater Management Handbook,1999, Et seq.)................ 3 Figure 2.3 DCR Recommended Outlet Configuration 2 for the Control of Trash, Sediment
and Debris (Virginia Stormwater Management Handbook,1999, Et seq.)................ 4 Figure 2.4 DCR Recommended Outlet Configuration 3 for the Control of Trash, Sediment
and Debris (Virginia Stormwater Management Handbook,1999, Et seq.)................ 5 Figure 2.5 Modified Rational Runoff Hydrographs ................................................................... 13 Figure 2.6 Graphical Determination of Critical Rainfall Intensity Duration ............................... 14 Figure 2.7 Modified Rational Hydrograph Shape ..................................................................... 17 Figure 2.8 2-Year Post-Development Modified Rational Hydrograph ..................................... 18 Figure 2.9 10-Year Post-Development Modified Rational Hydrograph ................................... 18 Figure 2.10 Basin Storage Versus Elevation Curve .................................................................. 20 Figure 2.11 Culvert Design Chart (FHWA, 2001) ...................................................................... 24 Figure 2.12 Preliminary Routing Results – 2-Year Inflow Hydrograph ...................................... 28 Figure 2.13 VDOT SWM-DR Inlet Top (Metal) .......................................................................... 29 Figure 2.14 VDOT SWM-1 Riser ............................................................................................... 29 Figure 2.15 Routing Results – 10-Year Inflow Hydrograph ....................................................... 32 Figure 2.16 Water Quality Draw Down Calculator ..................................................................... 33 Figure 2.17 Verification of Water Quality Draw .......................................................................... 34 Figure 2.18 Profile and Cross Section of Typical Vegetated Emergency Spillway.................... 35 Figure 2.19 Design Data for Earth Spillways ............................................................................. 37 Figure 2.20 Schematic Illustration of Principal and Emergency ................................................ 40 Figure 2.21 Typical Concrete Cradle for Minimization of Piping Along ..................................... 41 Figure 2.22 Typical Cutoff Trench Configuration ....................................................................... 43 Figure 2.23 VDOT SWM-1 Side View ........................................................................................ 44 Figure 2.24 Plan View Sediment Forebay 1 .............................................................................. 48 Figure 2.25 Cross-Section View Sediment Forebay 1 ............................................................... 49 Figure 2.26 USDA Plant Hardiness Zones ................................................................................ 50

2.1 - Overview of Practice
VDOT BMP Design Manual of Practice 1 of 50
Chapter 2 – Dry Extended Detention Basin
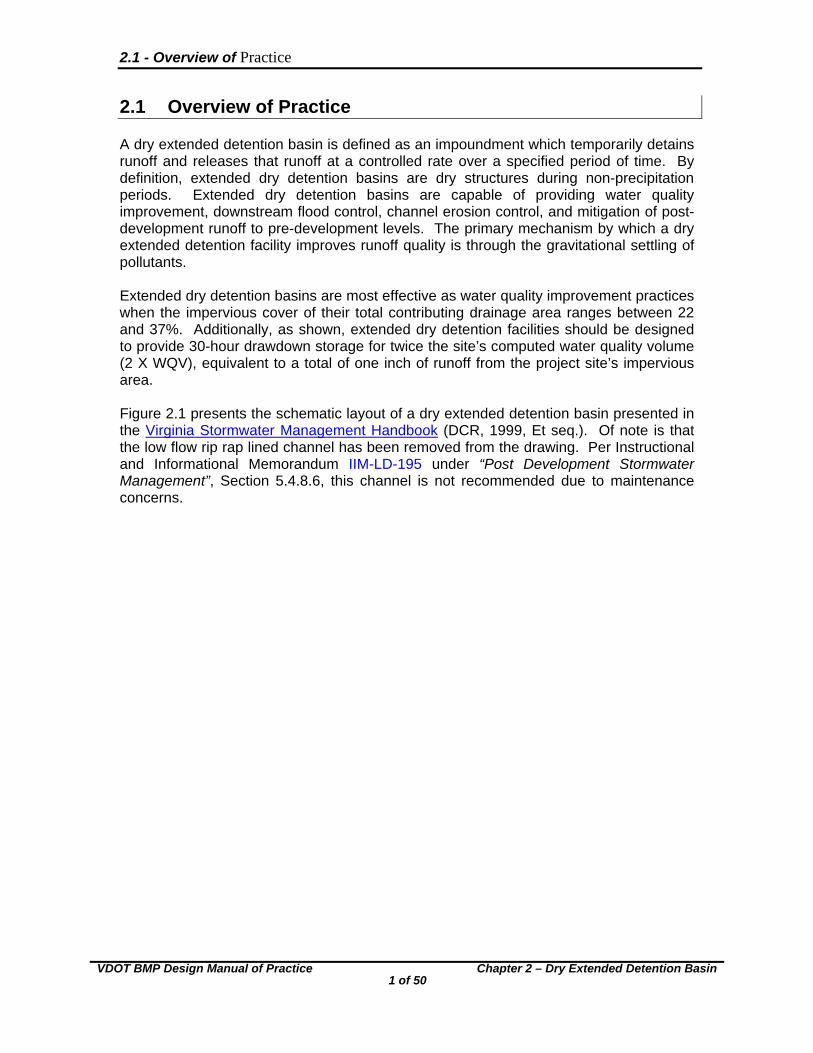
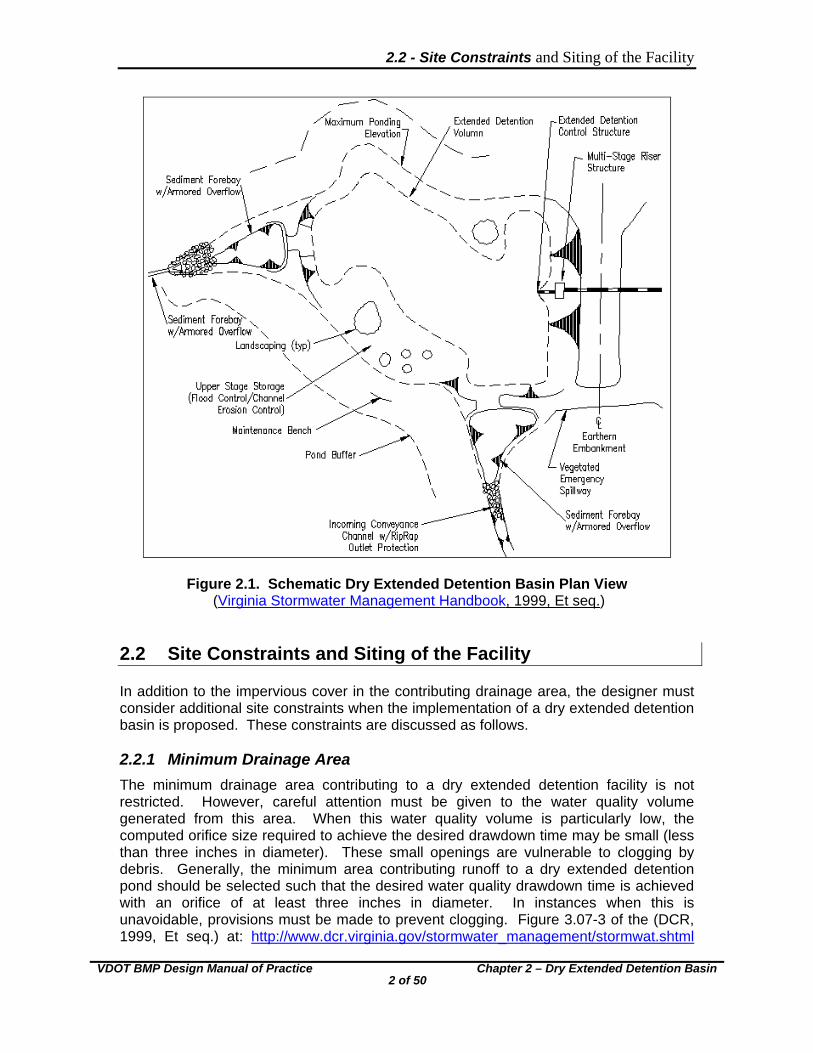
2.1 Overview of Practice A dry extended detention basin is defined as an impoundment which temporarily detains runoff and releases that runoff at a controlled rate over a specified period of time. By definition, extended dry detention basins are dry structures during non-precipitation periods. Extended dry detention basins are capable of providing water quality improvement, downstream flood control, channel erosion control, and mitigation of post-development runoff to pre-development levels. The primary mechanism by which a dry extended detention facility improves runoff quality is through the gravitational settling of pollutants. Extended dry detention basins are most effective as water quality improvement practices when the impervious cover of their total contributing drainage area ranges between 22 and 37%. Additionally, as shown, extended dry detention facilities should be designed to provide 30-hour drawdown storage for twice the site’s computed water quality volume (2 X WQV), equivalent to a total of one inch of runoff from the project site’s impervious area. Figure 2.1 presents the schematic layout of a dry extended detention basin presented in the Virginia Stormwater Management Handbook (DCR, 1999, Et seq.). Of note is that the low flow rip rap lined channel has been removed from the drawing. Per Instructional and Informational Memorandum IIM-LD-195 under “Post Development Stormwater Management”, Section 5.4.8.6, this channel is not recommended due to maintenance concerns.
2.2 - Site Constraints and Siting of the Facility
VDOT BMP Design Manual of Practice 2 of 50
Chapter 2 – Dry Extended Detention Basin
Figure 2.1. Schematic Dry Extended Detention Basin Plan View (Virginia Stormwater Management Handbook, 1999, Et seq.)
2.2 Site Constraints and Siting of the Facility In addition to the impervious cover in the contributing drainage area, the designer must consider additional site constraints when the implementation of a dry extended detention basin is proposed. These constraints are discussed as follows. 2.2.1 Minimum Drainage Area
The minimum drainage area contributing to a dry extended detention facility is not restricted. However, careful attention must be given to the water quality volume generated from this area. When this water quality volume is particularly low, the computed orifice size required to achieve the desired drawdown time may be small (less than three inches in diameter). These small openings are vulnerable to clogging by debris. Generally, the minimum area contributing runoff to a dry extended detention pond should be selected such that the desired water quality drawdown time is achieved with an orifice of at least three inches in diameter. In instances when this is unavoidable, provisions must be made to prevent clogging. Figure 3.07-3 of the (DCR, 1999, Et seq.) at: http://www.dcr.virginia.gov/stormwater_management/stormwat.shtml
2.2 - Site Constraints and Siting of the Facility
VDOT BMP Design Manual of Practice
3 of 50
Chapter 2 – Dry Extended Detention Basin
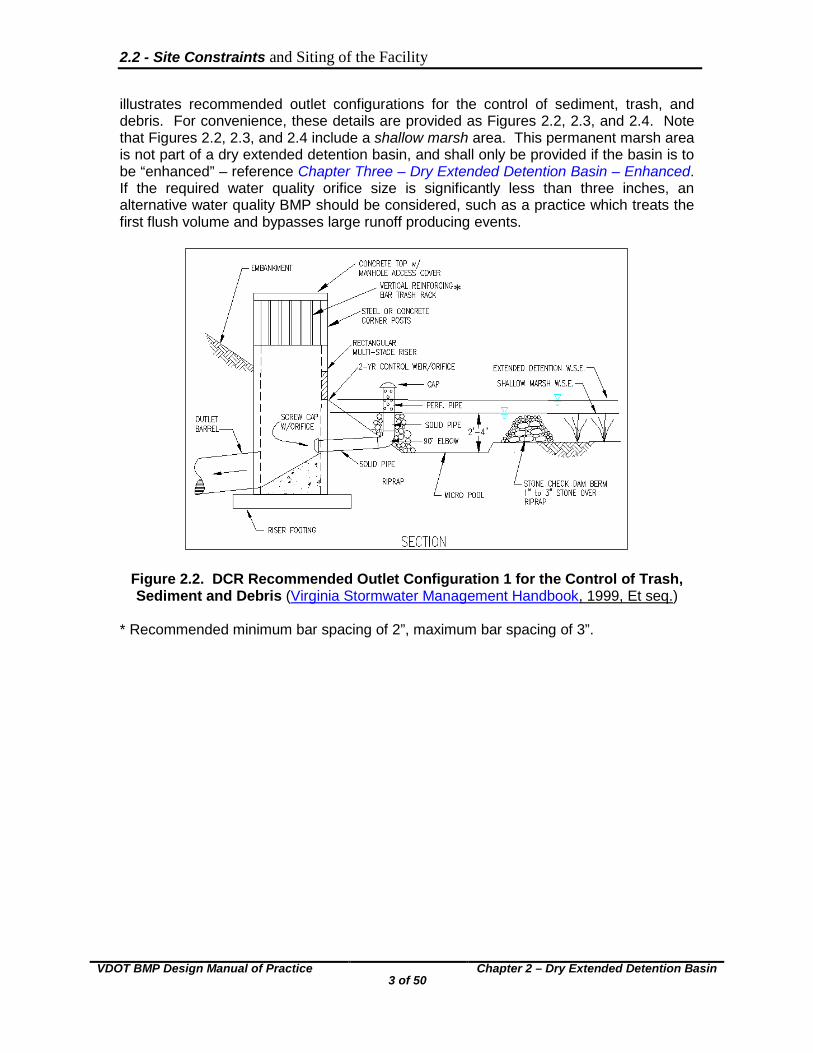
illustrates recommended outlet configurations for the control of sediment, trash, and debris. For convenience, these details are provided as Figures 2.2, 2.3, and 2.4. Note that Figures 2.2, 2.3, and 2.4 include a shallow marsh area. This permanent marsh area is not part of a dry extended detention basin, and shall only be provided if the basin is to be “enhanced” – reference Chapter Three – Dry Extended Detention Basin – Enhanced. If the required water quality orifice size is significantly less than three inches, an alternative water quality BMP should be considered, such as a practice which treats the first flush volume and bypasses large runoff producing events.
Figure 2.2. DCR Recommended Outlet Configuration 1 for the Control of Trash, Sediment and Debris (Virginia Stormwater Management Handbook, 1999, Et seq.)
* Recommended minimum bar spacing of 2”, maximum bar spacing of 3”.
*
2.2 - Site Constraints and Siting of the Facility
VDOT BMP Design Manual of Practice
4 of 50
Chapter 2 – Dry Extended Detention Basin
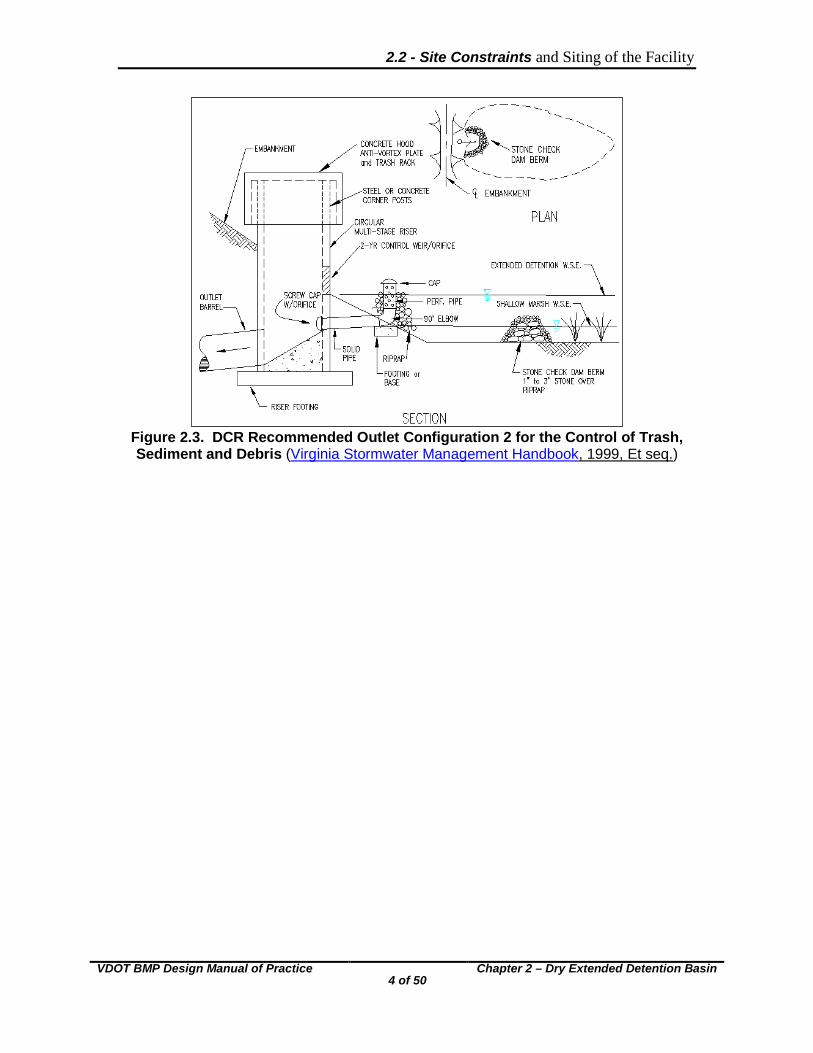
Figure 2.3. DCR Recommended Outlet Configuration 2 for the Control of Trash, Sediment and Debris (Virginia Stormwater Management Handbook, 1999, Et seq.)
2.2 - Site Constraints and Siting of the Facility
VDOT BMP Design Manual of Practice
5 of 50
Chapter 2 – Dry Extended Detention Basin
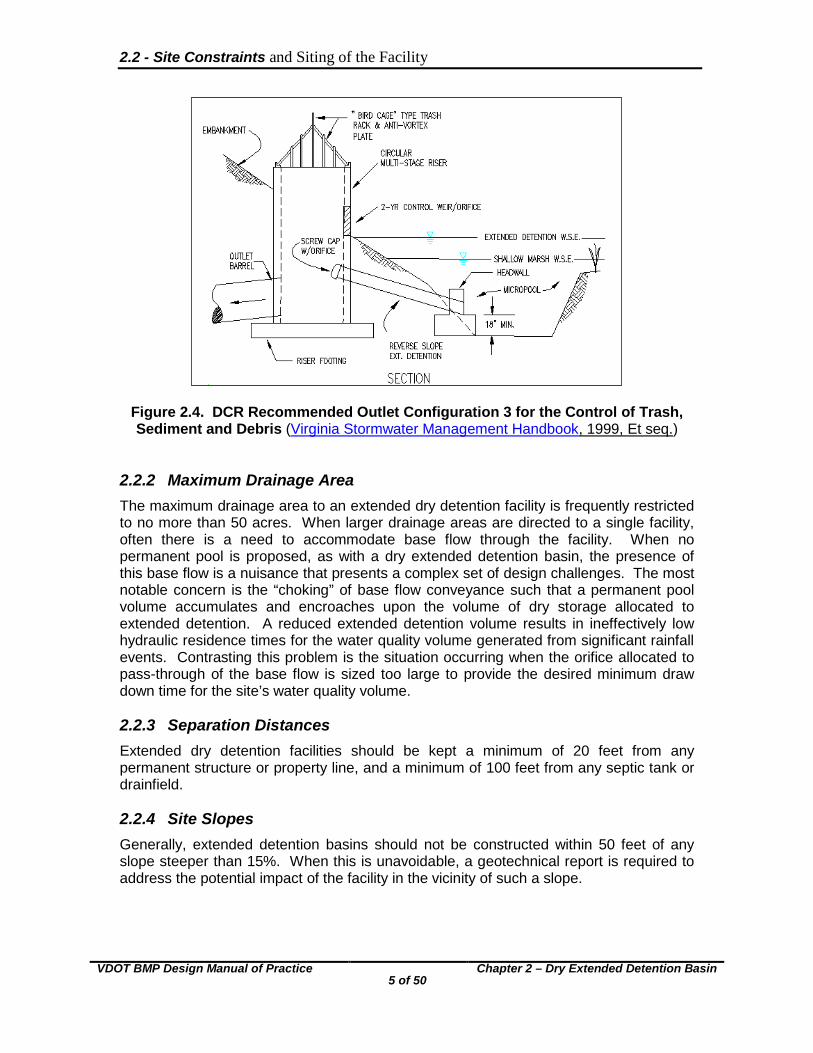
Figure 2.4. DCR Recommended Outlet Configuration 3 for the Control of Trash, Sediment and Debris (Virginia Stormwater Management Handbook, 1999, Et seq.)
2.2.2 Maximum Drainage Area The maximum drainage area to an extended dry detention facility is frequently restricted to no more than 50 acres. When larger drainage areas are directed to a single facility, often there is a need to accommodate base flow through the facility. When no permanent pool is proposed, as with a dry extended detention basin, the presence of this base flow is a nuisance that presents a complex set of design challenges. The most notable concern is the “choking” of base flow conveyance such that a permanent pool volume accumulates and encroaches upon the volume of dry storage allocated to extended detention. A reduced extended detention volume results in ineffectively low hydraulic residence times for the water quality volume generated from significant rainfall events. Contrasting this problem is the situation occurring when the orifice allocated to pass-through of the base flow is sized too large to provide the desired minimum draw down time for the site’s water quality volume. 2.2.3 Separation Distances Extended dry detention facilities should be kept a minimum of 20 feet from any permanent structure or property line, and a minimum of 100 feet from any septic tank or drainfield. 2.2.4 Site Slopes Generally, extended detention basins should not be constructed within 50 feet of any slope steeper than 15%. When this is unavoidable, a geotechnical report is required to address the potential impact of the facility in the vicinity of such a slope.
2.2 - Site Constraints and Siting of the Facility
VDOT BMP Design Manual of Practice
6 of 50
Chapter 2 – Dry Extended Detention Basin
2.2.5 Site Soils The implementation of a dry extended detention basin can be successfully accomplished in the presence of a variety of soil types. However, when such a facility is proposed, a subsurface analysis and permeability test is required. Soils exhibiting excessively high infiltration rates are not suited for the construction of a dry extended detention facility, as they will behave as an infiltration facility until clogging occurs. The designer should also keep in mind that as the ponded depth within the basin increases, so does the hydraulic head. This increase in hydraulic head results in increased pressure, which leads to an increase in the observed rate of infiltration. To combat excessively high infiltration rates, a clay liner, geosynthetic membrane, or other material (as approved by the Materials Division) may be employed. The basin’s embankment material must meet the specifications detailed later in this section and/or be approved by the Materials Division. Embankment design shall be in accordance with DCR dam safety regulations. 2.2.6 Rock The presence of rock within the proposed construction envelope of a dry extended detention basin should be investigated during the aforementioned subsurface investigation. When blasting of rock is necessary to obtain the desired basin volume, a liner should be used to eliminate unwanted losses through seams in the underlying rock. 2.2.7 Existing Utilities Basins should not be constructed over existing utility rights-of-way or easements. When this situation is unavoidable, permission to impound water over these easements must be obtained from the utility owner prior to design of the basin. When it is proposed to relocate existing utility lines, the costs associated with their relocation should be considered in the estimated overall basin construction cost. 2.2.8 Karst The presence of Karst topography places even greater importance on the subsurface investigation. Implementation of dry extended detention facilities in Karst regions may greatly impact the design and cost of the facility, and must be evaluated early in the planning phases of a project. Construction of stormwater management facilities within a sinkhole is prohibited. When the construction of such facilities is planned along the periphery of a sinkhole, the facility design must comply with the guidelines found in Instructional and Informational Memorandum IIM-LD-228, “Sinkholes” and DCR’s Technical Bulletin #2 “Hydrologic Modeling and Design in Karst” at: http://www.dcr.virginia.gov/stormwater_management/documents/tecbltn2.PDF. 2.2.9 Wetlands When the construction of a dry extended detention facility is planned in the vicinity of known wetlands, the designer must coordinate with the appropriate local, state, and federal agencies to identify the wetlands’ boundaries, their protected status, and the feasibility of BMP implementation in their vicinity. In Virginia, the Department of Environmental Quality (DEQ) and the U.S. Army Corps of Engineers (USACOE) should be contacted when such a facility is proposed in the vicinity of known wetlands.
2.2 - Site Constraints and Siting of the Facility
VDOT BMP Design Manual of Practice
7 of 50
Chapter 2 – Dry Extended Detention Basin
2.2.10 Upstream Sediment Considerations Close examination should be given to the flow velocity at all basin inflow points. When entering flows exhibit erosive velocities, they have the potential to greatly increase the basin’s maintenance requirements by transporting large amounts of sediment. Additionally, when a basin’s contributing drainage area is highly pervious, there is a potential hindrance to the basin’s performance by the transport of excessive sediment. 2.2.11 Floodplains The construction of dry extended detention facilities within floodplains is strongly discouraged. When this situation is deemed unavoidable, critical examination must be given to ensure that the proposed basin remains functioning effectively during the 10-year flood event. The structural integrity and safety of the basin must also be evaluated thoroughly under 100-year flood conditions as well as the basin’s impact on the characteristics of the 100-year floodplain. When basin construction is proposed within a floodplain, construction and permitting must comply with all applicable regulations under FEMA’s National Flood Insurance Program. 2.2.12 Basin Location When possible, dry extended detention facilities should be placed in low profile areas. When such a basin must be situated in a high profile area, care must be given to ensure that the facility empties completely within a 72 hour maximum, and that no stagnation occurs (see DCR Reg. 44 CFR Part 5). The location of a dry extended detention basin in a high profile area places a great emphasis on facility maintenance. Per Instructional and Informational Memorandum IIM-LD-195, under “Post Development Stormwater Management,” Section 6.9: “Design of any stormwater management facilities with permanent water features (proposed or potential) located within five (5) miles of a public use or military airport is to be reviewed and coordinated in accordance with Section A-6 of the VDOT Road Design Manual.”
2.3 - General Design Guidelines
VDOT BMP Design Manual of Practice
8 of 50
Chapter 2 – Dry Extended Detention Basin
2.3 General Design Guidelines The following presents a collection of broad design issues to be considered when designing a dry extended detention basin. Many of these items are expanded upon later in this document within the context of a full design scenario. 2.3.1 Foundation and Embankment Material Foundation data for the dam must be secured by the Materials Division to determine whether or not the native material is capable of supporting the dam while not allowing water to seep under the dam. Per Instructional and Informational Memorandum IIM-LD-195 under “Post Development Stormwater Management”, Section 12.1.1: “The foundation material under the dam and the material used for the embankment of the dam should be an AASHTO Type A-4 or finer and/or meet the approval of the Materials Division. If the native material is not adequate, the foundation of the dam is to be excavated and backfilled a minimum of 4 feet or the amount recommended by the VDOT Materials Division. The backfill and embankment material must meet the soil classification requirements identified herein or the design of the dam may incorporate a trench lined with a membrane (such as bentonite penetrated fabric or an HDPE or LDPE liner). Such designs shall be reviewed and approved by the VDOT Materials Division before use.” If the basin embankment height exceeds 15’, or if the basin includes a permanent pool, the design of the dam should employ a homogenous embankment with seepage controls or zoned embankments, or similar design in accordance with the Virginia Stormwater Management Handbook and recommendations of the VDOT Materials Division. During the initial subsurface investigation, additional borings should be made near the center of the proposed basin when:
o Excavation from the basin will be used to construct the embankment o There is a potential of encountering rock during excavation o A high or seasonally high water table, generally two feet or less, is suspected
2.3.2 Outfall Piping The pipe culvert under or through the basin’s embankment shall be reinforced concrete equipped with rubber gaskets. Pipe: Specifications Section 232 (AASHTO M170), Gasket: Specification Section 212 (ASTM C443). A concrete cradle shall be used under the pipe to prevent seepage through the dam. The cradle shall begin at the riser or inlet end of the pipe, and run the full length of the pipe. 2.3.3 Embankment The top width of the embankment should be a minimum of 10’ in width to provide ease of construction and maintenance. To permit mowing and other maintenance, the embankment slopes should be no steeper than 3H:1V.
2.3 - General Design Guidelines
VDOT BMP Design Manual of Practice
9 of 50
Chapter 2 – Dry Extended Detention Basin
2.3.4 Embankment Height A detention basin embankment may be regulated under the Virginia Dam Safety Act, Article 2, Chapter 6, Title 10.1 (10.1-604 et seq.) of the Code of Virginia and Dam Safety Regulations established by the Virginia Soil and Water Conservation Board (VS&WCB). A detention basin embankment may be excluded from regulation if it meets any of the following criteria:
o is less than six feet in height o has a capacity of less than 50 acre-feet and is less than 25 feet in height o has a capacity of less than 15 acre-feet and is more than 25 feet in height o will be owned or licensed by the Federal Government
When an embankment is not regulated by the Virginia Dam Regulations, it must still be evaluated for structural integrity when subjected to the 100-year flood event. 2.3.5 Prevention of Short-Circuiting Short circuiting of inflow occurs when the basin floor slope is excessive and/or the pond’s length to width ratio is not large enough. Short circuiting of flow can greatly reduce the hydraulic residence time within the basin, thus negatively impacting the desired water quality benefit. To combat short-circuiting, and reduce erosion, the maximum longitudinal slope of the basin floor shall be no more than 2%. To maintain minimal drainage within the facility, the floor shall be no less than 0.5% slope from entrance to discharge point. It is preferable to construct the basin such that the length to width ratio is 3:1 or greater, with the widest point observed at the outlet end. If this is not possible, every effort should be made to design the basin with no less than a 2:1 length to width ratio. When this minimum ratio is not possible, consideration should be given to pervious baffles. 2.3.6 Ponded Depth The basin depth, measured from basin floor to primary outflow point (riser top or crest of orifice or weir) should not exceed three feet, if practical, to reduce hazard potential and liability issues. 2.3.7 Principal Spillway Design The basin outlet should be designed in accordance with Minimum Standard 3.02 of the Virginia Stormwater Management Handbook, (DCR, 1999, Et seq.) The primary control structure (riser or weir) should be designed to operate in weir flow conditions for the full range of design flows. If this is not possible, and orifice flow regimes are anticipated, the outlet must be equipped with an anti-vortex device, consistent with that described in Minimum Standard 3.02. The riser and barrel shall be designed to prevent surging or other adverse hydraulic conditions.
2.3 - General Design Guidelines
VDOT BMP Design Manual of Practice 10 of 50
Chapter 2 – Dry Extended Detention Basin
2.3.8 Emergency Spillway Stabilization
The emergency spillway shall be stabilized with rip rap, concrete, or any other non-erodible material approved by the VDOT Material Division. 2.3.9 Fencing
Per Instructional and Informational Memorandum IIM-LD-195 under “Post Development Stormwater Management”, Section 13.1.1, fencing is typically not required or recommended on most VDOT detention facilities. However, exceptions do arise, and the fencing of a dry extended detention facility may be needed. Such situations include:
o Ponded depths greater than 3’ and/or excessively steep embankment slopes
o The basin is situated in close proximity to schools or playgrounds, or other areas where children are expected to frequent
o It is recommended by the VDOT Field Inspection Review Team, the VDOT
Residency Administrator, or a representative of the City or County who will take over maintenance of the facility
“No Trespassing” signs should be considered for inclusion on all detention facilities, whether fenced or unfenced. 2.3.10 Sediment Forebays
Each basin inflow point should be equipped with a sediment forebay. The forebay volume should range between 0.1” and 0.25” over the individual outfall’s impervious area or 10% of the required WQV (whichever is greater). 2.3.11 Discharge Flows
All basin outfalls must discharge into an adequate receiving channel per the most current Virginia Erosion and Sediment Control (ESC) laws and regulations. Existing natural channels conveying pre-development flows may be considered receiving channels if they satisfactorily meet the standards outlined in the VESCH MS-19. Unless unique site conditions mandate otherwise, receiving channels should be analyzed for overtopping during conveyance of the 10-year runoff producing event and for erosive potential under the 2-year event.

2.4 - Design Process
VDOT BMP Design Manual of Practice 11 of 50
Chapter 2 – Dry Extended Detention Basin
2.4 Design Process This section presents the design process applicable to dry extended detention basins serving as water quality BMPs. The pre and post-development runoff characteristics are intended to replicate stormwater management needs routinely encountered during linear development projects. The hydrologic calculations and assumptions presented in this section serve only as input data for the detailed BMP design steps. Full hydrologic discussion is beyond the scope of this report, and the user is referred to Chapter 4 of the Virginia Stormwater Management Handbook (DCR, 1999, Et seq.) for expanded hydrologic methodology. The following example basin design will provide the water quality and quantity needs arising from the construction of a section of two lane divided highway situated in Montgomery County. The total project site, including right-of-way and all permanent easements, consists of 17.4 acres. Pre and post-development hydrologic characteristics are summarized below in Tables 2.1 and 2.2. Peak rates of runoff for both pre and post-development conditions were computed by the Rational Method and the regional NOAA Atlas 14 factors (B, D, and E) recommended in the VDOT Drainage Manual. Pre-Development Post-Development Project Area (acres) 17.4 17.4 Land Cover Unimproved Grass Cover 4.75 acres impervious cover Rational Runoff Coefficient 0.30 0.50* Time of Concentration (min) 45 10 *Represents a weighted runoff coefficient reflecting undisturbed site area and impervious cover
Table 2.1. Hydrologic Characteristics of Example Project Site Pre-Development Post-Development 2-Year Return Frequency 7.97 15.7 10-Year Return Frequency 11.37 21.0
Table 2.2. Peak Rates of Runoff (cfs)
Step 1. Compute the Required Water Quality Volume The project site’s water quality volume is a function of the development’s impervious area. This basic water quality volume is computed as follows:
ft
in
inIAWQV
12
2
1
IA= Impervious Area (ft2) Dry extended detention basins should be designed to provide extended draw down for two times the computed water quality volume (2xWQV).
2.4 - Design Process
VDOT BMP Design Manual of Practice 12 of 50
Chapter 2 – Dry Extended Detention Basin
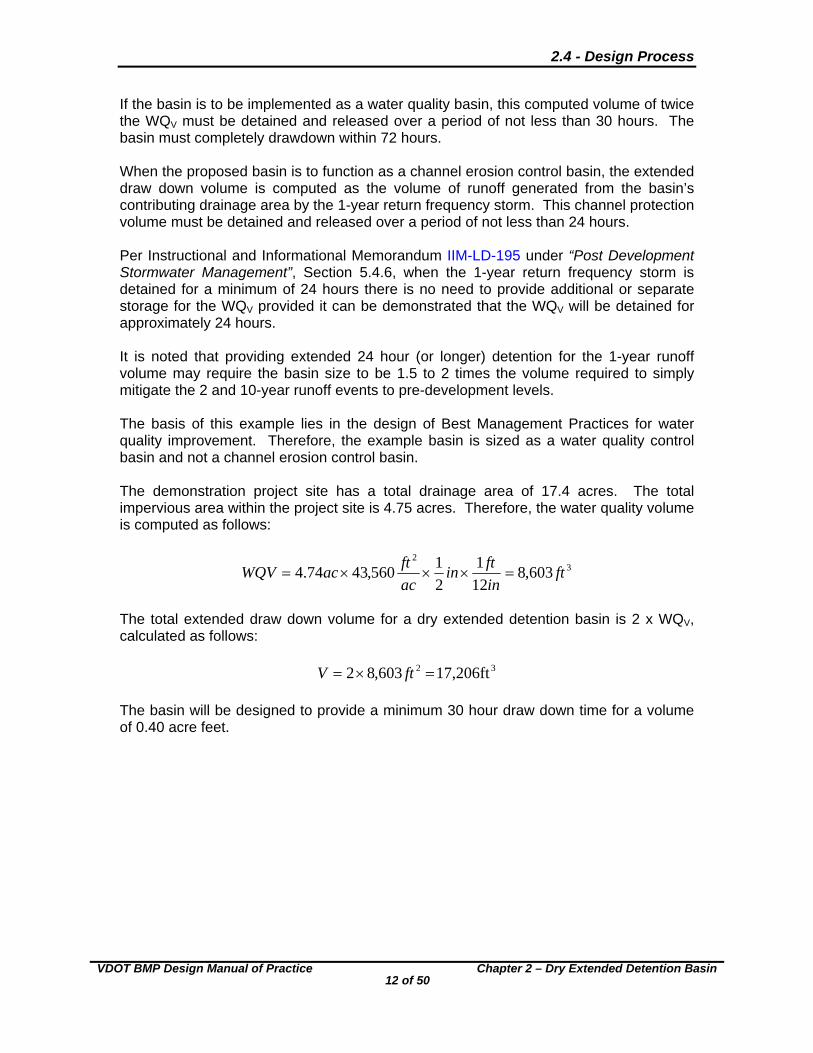
If the basin is to be implemented as a water quality basin, this computed volume of twice the WQV must be detained and released over a period of not less than 30 hours. The basin must completely drawdown within 72 hours. When the proposed basin is to function as a channel erosion control basin, the extended draw down volume is computed as the volume of runoff generated from the basin’s contributing drainage area by the 1-year return frequency storm. This channel protection volume must be detained and released over a period of not less than 24 hours. Per Instructional and Informational Memorandum IIM-LD-195 under “Post Development Stormwater Management”, Section 5.4.6, when the 1-year return frequency storm is detained for a minimum of 24 hours there is no need to provide additional or separate storage for the WQV provided it can be demonstrated that the WQV will be detained for approximately 24 hours. It is noted that providing extended 24 hour (or longer) detention for the 1-year runoff volume may require the basin size to be 1.5 to 2 times the volume required to simply mitigate the 2 and 10-year runoff events to pre-development levels. The basis of this example lies in the design of Best Management Practices for water quality improvement. Therefore, the example basin is sized as a water quality control basin and not a channel erosion control basin. The demonstration project site has a total drainage area of 17.4 acres. The total impervious area within the project site is 4.75 acres. Therefore, the water quality volume is computed as follows:
32
603,812
1
2
1560,4374.4 ft
in
ftin
ac
ftacWQV
The total extended draw down volume for a dry extended detention basin is 2 x WQV, calculated as follows:
32 17,206ft 603,82 ftV The basin will be designed to provide a minimum 30 hour draw down time for a volume of 0.40 acre feet.
2.4 - Design Process
VDOT BMP Design Manual of Practice
13 of 50
Chapter 2 – Dry Extended Detention Basin
Step 2. Estimate the Volume Required for Mitigation of Post-Development Runoff Peaks to Equal or Less than Pre-Development Levels
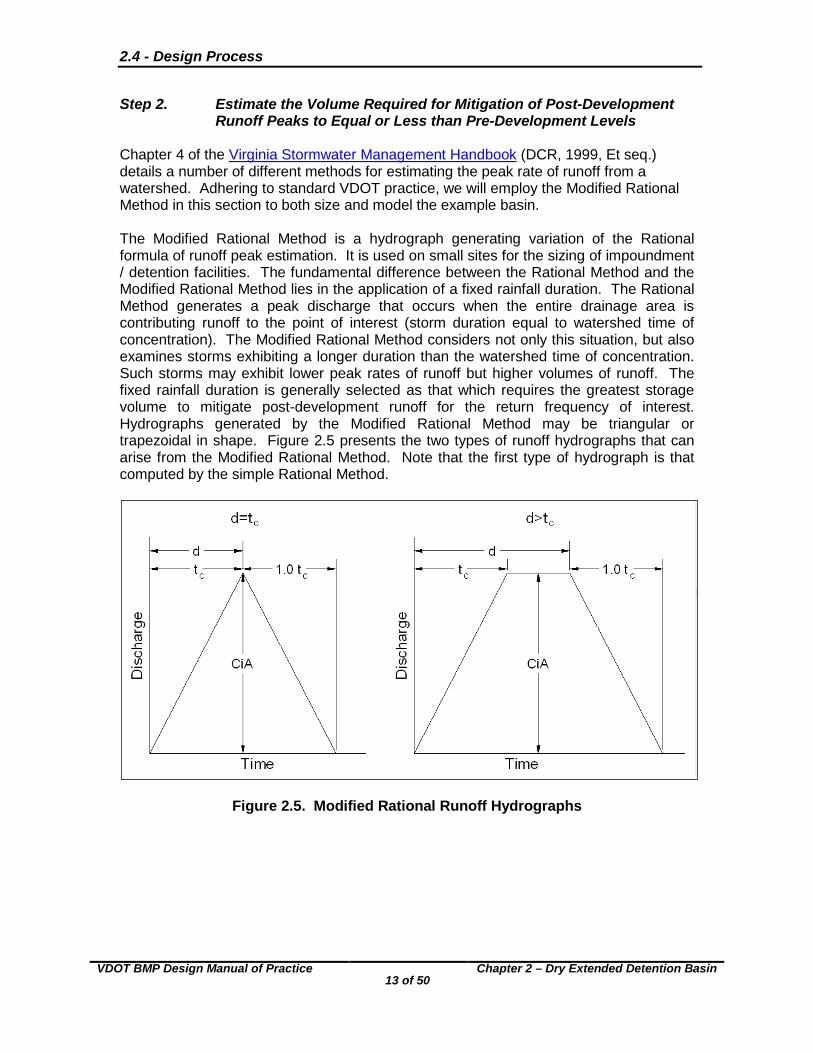
Chapter 4 of the Virginia Stormwater Management Handbook (DCR, 1999, Et seq.) details a number of different methods for estimating the peak rate of runoff from a watershed. Adhering to standard VDOT practice, we will employ the Modified Rational Method in this section to both size and model the example basin. The Modified Rational Method is a hydrograph generating variation of the Rational formula of runoff peak estimation. It is used on small sites for the sizing of impoundment / detention facilities. The fundamental difference between the Rational Method and the Modified Rational Method lies in the application of a fixed rainfall duration. The Rational Method generates a peak discharge that occurs when the entire drainage area is contributing runoff to the point of interest (storm duration equal to watershed time of concentration). The Modified Rational Method considers not only this situation, but also examines storms exhibiting a longer duration than the watershed time of concentration. Such storms may exhibit lower peak rates of runoff but higher volumes of runoff. The fixed rainfall duration is generally selected as that which requires the greatest storage volume to mitigate post-development runoff for the return frequency of interest. Hydrographs generated by the Modified Rational Method may be triangular or trapezoidal in shape. Figure 2.5 presents the two types of runoff hydrographs that can arise from the Modified Rational Method. Note that the first type of hydrograph is that computed by the simple Rational Method.
Figure 2.5. Modified Rational Runoff Hydrographs
2.4 - Design Process
VDOT BMP Design Manual of Practice
14 of 50
Chapter 2 – Dry Extended Detention Basin
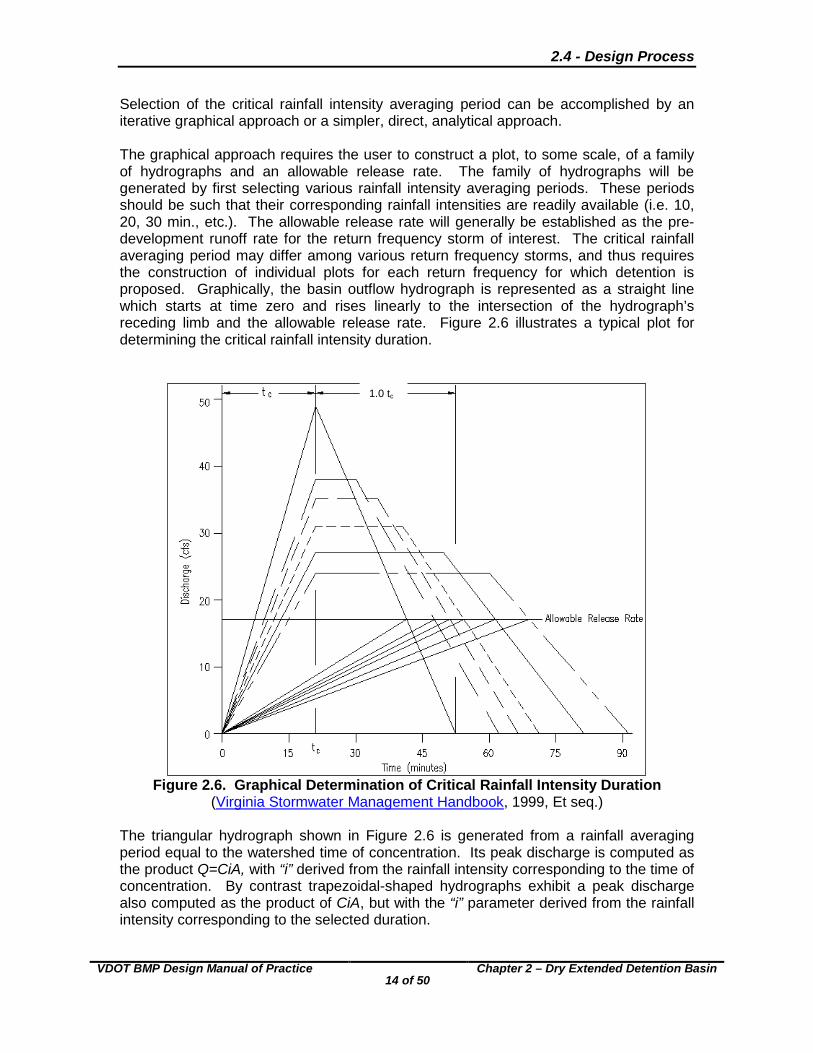
Selection of the critical rainfall intensity averaging period can be accomplished by an iterative graphical approach or a simpler, direct, analytical approach. The graphical approach requires the user to construct a plot, to some scale, of a family of hydrographs and an allowable release rate. The family of hydrographs will be generated by first selecting various rainfall intensity averaging periods. These periods should be such that their corresponding rainfall intensities are readily available (i.e. 10, 20, 30 min., etc.). The allowable release rate will generally be established as the pre-development runoff rate for the return frequency storm of interest. The critical rainfall averaging period may differ among various return frequency storms, and thus requires the construction of individual plots for each return frequency for which detention is proposed. Graphically, the basin outflow hydrograph is represented as a straight line which starts at time zero and rises linearly to the intersection of the hydrograph’s receding limb and the allowable release rate. Figure 2.6 illustrates a typical plot for determining the critical rainfall intensity duration.
Figure 2.6. Graphical Determination of Critical Rainfall Intensity Duration
(Virginia Stormwater Management Handbook, 1999, Et seq.) The triangular hydrograph shown in Figure 2.6 is generated from a rainfall averaging period equal to the watershed time of concentration. Its peak discharge is computed as the product Q=CiA, with “i” derived from the rainfall intensity corresponding to the time of concentration. By contrast trapezoidal-shaped hydrographs exhibit a peak discharge also computed as the product of CiA, but with the “i” parameter derived from the rainfall intensity corresponding to the selected duration.
1.0 tc
2.4 - Design Process
VDOT BMP Design Manual of Practice
15 of 50
Chapter 2 – Dry Extended Detention Basin
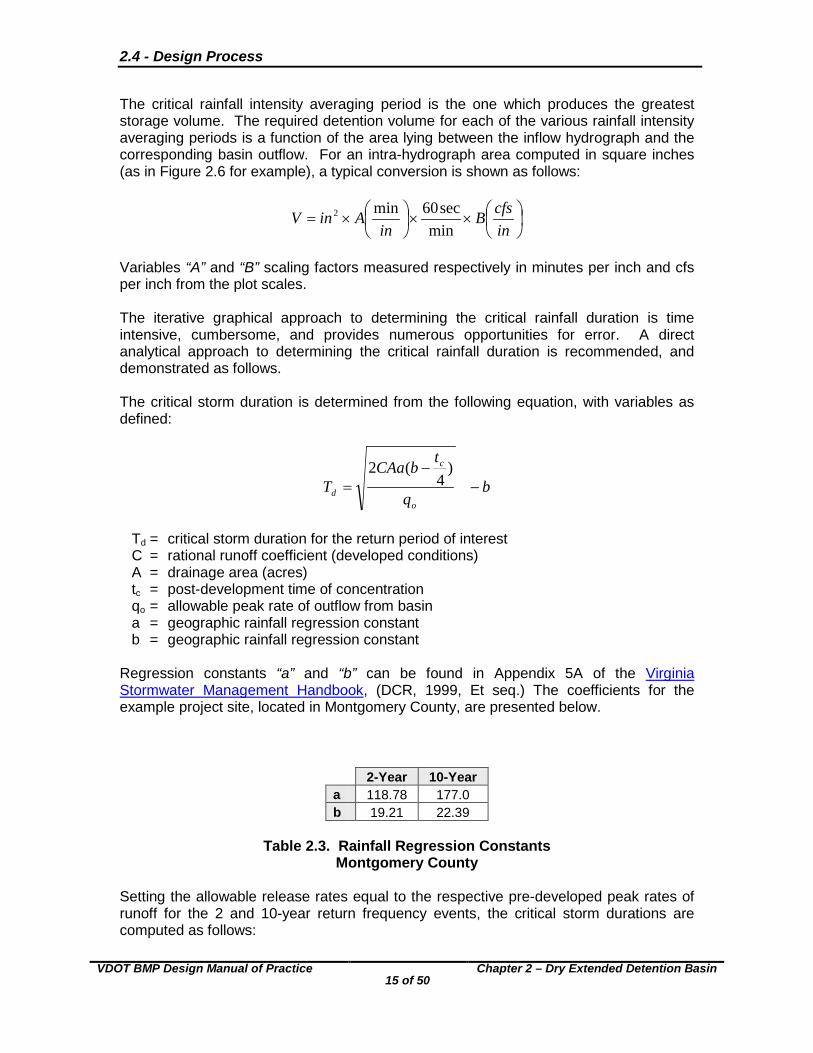
The critical rainfall intensity averaging period is the one which produces the greatest storage volume. The required detention volume for each of the various rainfall intensity averaging periods is a function of the area lying between the inflow hydrograph and the corresponding basin outflow. For an intra-hydrograph area computed in square inches (as in Figure 2.6 for example), a typical conversion is shown as follows:
××
×=
incfsB
inAinV
minsec60min2
Variables “A” and “B” scaling factors measured respectively in minutes per inch and cfs per inch from the plot scales. The iterative graphical approach to determining the critical rainfall duration is time intensive, cumbersome, and provides numerous opportunities for error. A direct analytical approach to determining the critical rainfall duration is recommended, and demonstrated as follows. The critical storm duration is determined from the following equation, with variables as defined:
b q
tbCAa
To
c
d −−
=)
4(2
Td = critical storm duration for the return period of interest C = rational runoff coefficient (developed conditions) A = drainage area (acres) tc = post-development time of concentration qo = allowable peak rate of outflow from basin a = geographic rainfall regression constant b = geographic rainfall regression constant
Regression constants “a” and “b” can be found in Appendix 5A of the Virginia Stormwater Management Handbook, (DCR, 1999, Et seq.) The coefficients for the example project site, located in Montgomery County, are presented below.
2-Year 10-Year a 118.78 177.0 b 19.21 22.39
Table 2.3. Rainfall Regression Constants
Montgomery County Setting the allowable release rates equal to the respective pre-developed peak rates of runoff for the 2 and 10-year return frequency events, the critical storm durations are computed as follows:
2.4 - Design Process
VDOT BMP Design Manual of Practice
16 of 50
Chapter 2 – Dry Extended Detention Basin
min6.4621.1997.7
)4min1021.19)(78.118)(4.17)(50.0)(2(
2 =−−
=cfs
acT
min0.5139.2237.11
)4min1039.22)(95.176)(4.17)(50.0)(2(
10 =−−
=cfs
acT
The next step is to apply the computed critical durations to determine the corresponding rainfall intensities. This intensity is defined as follows, with variables as previously defined.
dTbaI
+=
The 2 and 10-year return intensities are computed as follows:
hrinI 80.1
6.4621.1978.118
2 =+
=
hrinI 41.2
0.5139.2295.176
10 =+
=
The peak rate of runoff from the post-development site under the critical storm is then determined using the Rational Method equation.
fCiACQ = Q = runoff rate (cfs) i = rainfall intensity (in/hr) corresponding to the critical duration C = post-development runoff coefficient A = drainage area (acres) Cf = Correction factor for ground saturation (1.0 for storm return frequency of 10 years
or less)
( ) cfsQ 7.150.1)4.17)(80.1)(50.0(2 ==
( ) cfsQ 0.210.1)4.17)(41.2)(50.0(10 == Finally, the volume of detention storage required to reduce the post-development runoff rates to pre-development levels can be estimated from the following equation.
2.4 - Design Process
VDOT BMP Design Manual of Practice
17 of 50
Chapter 2 – Dry Extended Detention Basin
604
324
−−+= codoci
ditqTqtQ
TQV
V = required storage volume (ft3) Qi = peak inflow for critical storm (cfs) tc = post-development time of concentration qo = allowable release rate from basin Td = critical storm duration
The estimated detention volumes required to mitigate the peak rate of runoff from the 2 and 10-year post-development events to pre-development levels are computed as follows.
32 6.523,3160
4)10)(97.7)(3(
2)6.46)(97.7(
4)10)(7.15()6.46)(7.15( ftV =
−−+=
310 4.897,4460
4)10)(37.11)(3(
2)0.51)(37.11(
4)10)(0.21()0.51)(0.21( ftV =
−−+=
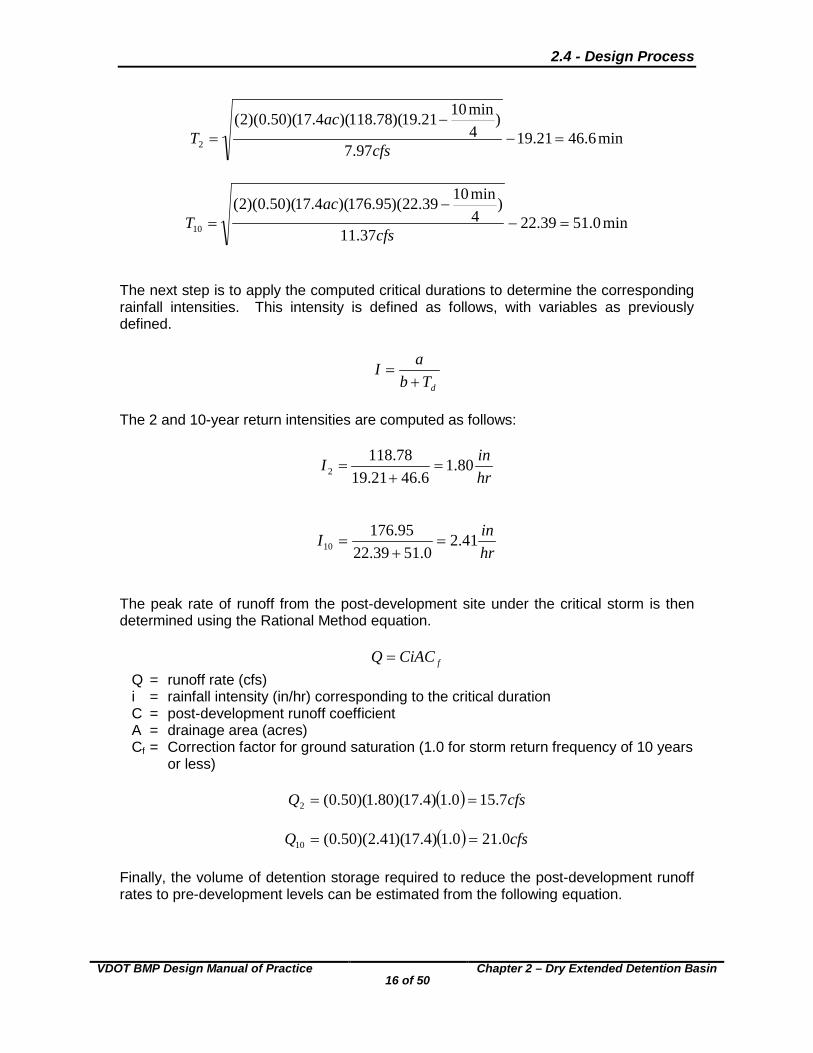
Step 3. Development of Runoff Hydrographs Having determined the critical storm durations and their corresponding peak runoff rates, it is now possible to construct full inflow hydrographs by the Modified Rational Method. The general shape of these hydrographs is shown in Figure 2.7.
Figure 2.7. Modified Rational Hydrograph Shape
2.4 - Design Process
VDOT BMP Design Manual of Practice
18 of 50
Chapter 2 – Dry Extended Detention Basin
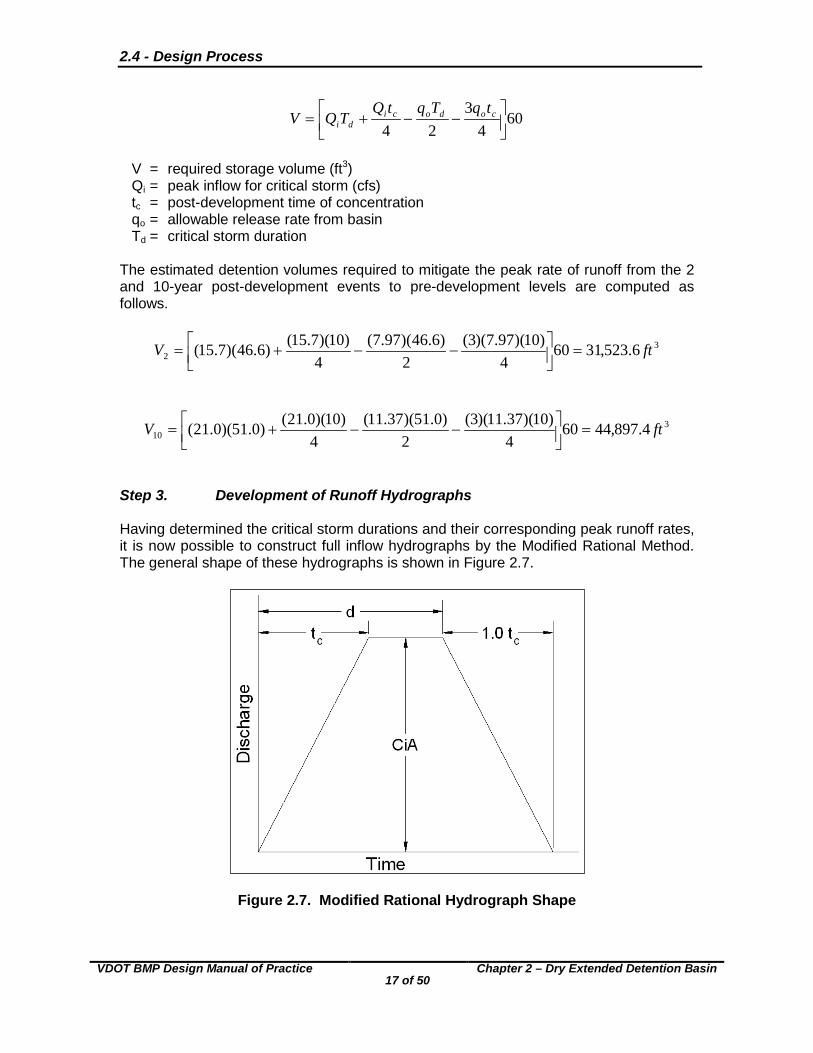
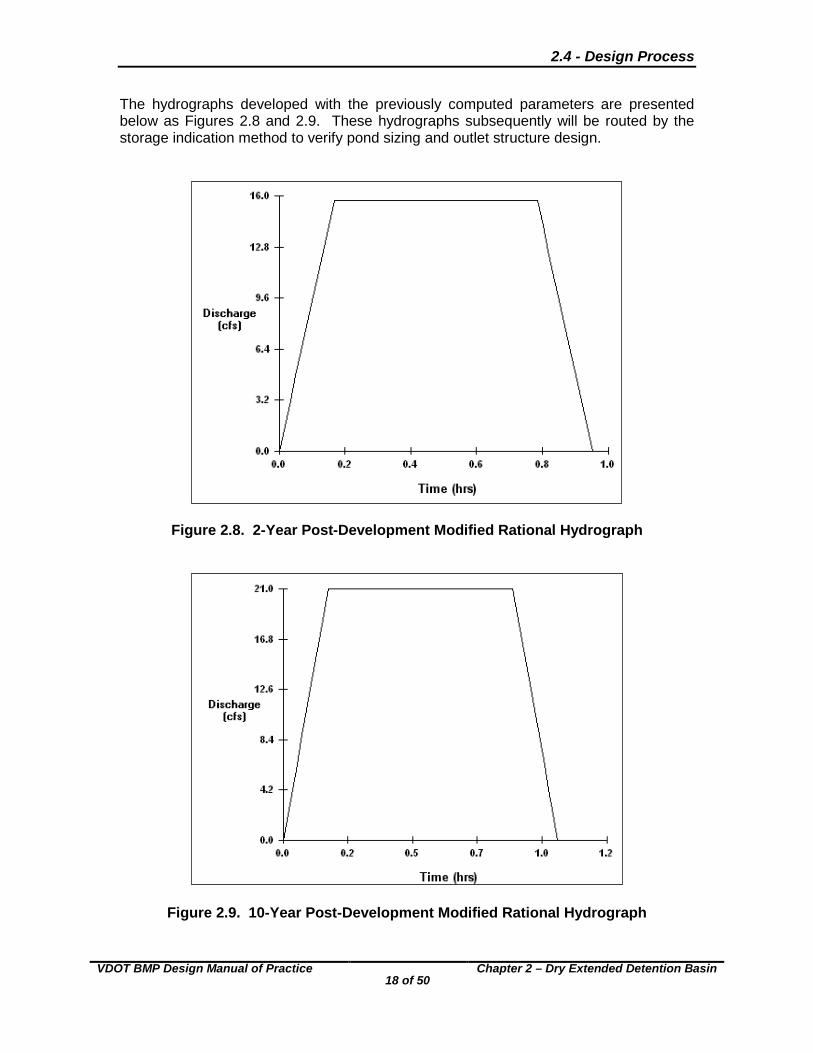
The hydrographs developed with the previously computed parameters are presented below as Figures 2.8 and 2.9. These hydrographs subsequently will be routed by the storage indication method to verify pond sizing and outlet structure design.
Figure 2.8. 2-Year Post-Development Modified Rational Hydrograph
Figure 2.9. 10-Year Post-Development Modified Rational Hydrograph
2.4 - Design Process
VDOT BMP Design Manual of Practice
19 of 50
Chapter 2 – Dry Extended Detention Basin
Step 4. Development of Storage Versus Elevation Data Having determined the required storage volumes, we now turn to developing the preliminary basin grading plan in order to establish the relationship between ponded depth and storage volume. Site geometry and topography must be carefully examined during the siting and grading of the basin. As well as providing the peak mitigation volumes estimated previously, the pond grading must also provide safe passage of the 100-year runoff producing event without breaching the basin embankment. The required freeboard depths under 100-year conditions are as follows:
o When equipped with an emergency spillway, the basin must provide a minimum of one foot of freeboard from the maximum water surface elevation arising from the 100-year event and the lowest point in the embankment.
o When no emergency spillway is provided, a minimum of two feet of freeboard
should be provided between the maximum water surface elevation produced by the 100-year runoff event and the lowest point in the embankment.
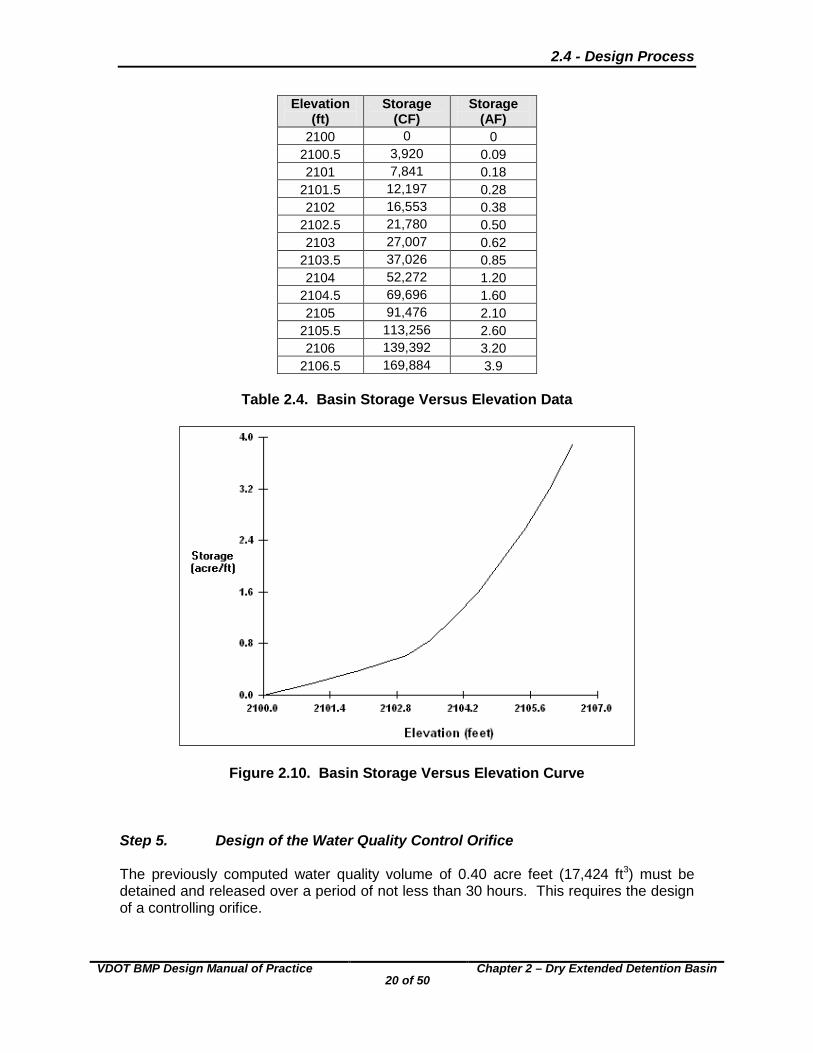
In addition to considering site geometry and topography, the previously discussed “General Design Guidelines” should also be closely integrated into the proposed basin grading. Side slope steepness, length-to-width ratio, and desirable ponded depth must be considered. The total storage volume is computed from the lowest stage outlet. Pond sizing is, generally, an iterative process. A typical storage versus elevation data table and curve are presented in Table 2.4 and Figure 2.10. The data presented represents a basin of rectangular orientation with an approximate length-to-width ratio of 3:1 and variable side slopes (minimum 3H:1V). Note that the computed water quality volume is provided at a depth of less than three feet. This will permit the invert of the principal outlet or weir to be placed at a depth of less than three feet. This condition should be met when practically possible. The storage – elevation data presented below is intended only to serve as a means of illustrating the outlet structure design and storm routing steps of the design procedure. It does not reflect an actual grading plan.
2.4 - Design Process
VDOT BMP Design Manual of Practice
20 of 50
Chapter 2 – Dry Extended Detention Basin
Elevation (ft)
Storage (CF)
Storage (AF)
2100 0 0 2100.5 3,920 0.09 2101 7,841 0.18
2101.5 12,197 0.28 2102 16,553 0.38
2102.5 21,780 0.50 2103 27,007 0.62
2103.5 37,026 0.85 2104 52,272 1.20
2104.5 69,696 1.60 2105 91,476 2.10
2105.5 113,256 2.60 2106 139,392 3.20
2106.5 169,884 3.9
Table 2.4. Basin Storage Versus Elevation Data
Figure 2.10. Basin Storage Versus Elevation Curve
Step 5. Design of the Water Quality Control Orifice The previously computed water quality volume of 0.40 acre feet (17,424 ft3) must be detained and released over a period of not less than 30 hours. This requires the design of a controlling orifice.
2.4 - Design Process
VDOT BMP Design Manual of Practice
21 of 50
Chapter 2 – Dry Extended Detention Basin
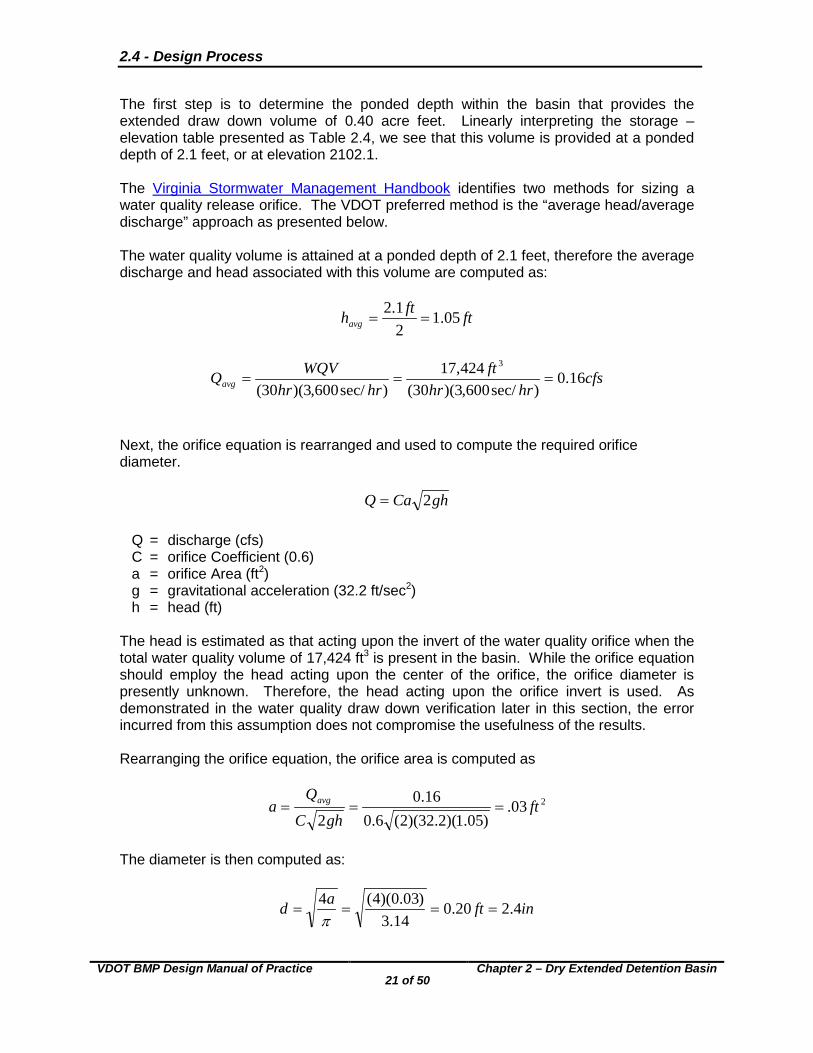
The first step is to determine the ponded depth within the basin that provides the extended draw down volume of 0.40 acre feet. Linearly interpreting the storage – elevation table presented as Table 2.4, we see that this volume is provided at a ponded depth of 2.1 feet, or at elevation 2102.1. The Virginia Stormwater Management Handbook identifies two methods for sizing a water quality release orifice. The VDOT preferred method is the “average head/average discharge” approach as presented below. The water quality volume is attained at a ponded depth of 2.1 feet, therefore the average discharge and head associated with this volume are computed as:
ftfthavg 05.121.2
==
cfshrhr
fthrhr
WQVQavg 16.0)sec/600,3)(30(
424,17)sec/600,3)(30(
3
===
Next, the orifice equation is rearranged and used to compute the required orifice diameter.
ghCaQ 2=
Q = discharge (cfs) C = orifice Coefficient (0.6) a = orifice Area (ft2) g = gravitational acceleration (32.2 ft/sec2) h = head (ft)
The head is estimated as that acting upon the invert of the water quality orifice when the total water quality volume of 17,424 ft3 is present in the basin. While the orifice equation should employ the head acting upon the center of the orifice, the orifice diameter is presently unknown. Therefore, the head acting upon the orifice invert is used. As demonstrated in the water quality draw down verification later in this section, the error incurred from this assumption does not compromise the usefulness of the results. Rearranging the orifice equation, the orifice area is computed as
203.)05.1)(2.32)(2(6.0
16.02
ftghC
Qa avg ===
The diameter is then computed as:
inftad 4.220.014.3
)03.0)(4(4====
π
2.4 - Design Process
VDOT BMP Design Manual of Practice
22 of 50
Chapter 2 – Dry Extended Detention Basin
The computed orifice diameter is less than three inches. However, a three inch diameter will be chosen, and later verified for adequacy by storage indication routing. Step 6. Design of the Principal Spillway The basin principal spillway controls the rate at which storms are released from the basin. To control the release rate for multiple return frequency storms, the spillway will typically need to be multi-staged. A multi-stage riser employs various precisely located outlets such that the desired target release rates are achieved for all chosen return frequencies. Hydraulic modeling of a basin’s principal spillway is termed “Reservoir Routing” or “Storage Indication Routing.” The basic input parameters for this modeling are:
o Stage – Storage Relationship o Stage – Discharge Relationship o Inflow Hydrograph(s)
The design of a principal spillway to control multiple return frequency storms is usually iterative. A design which attains target release rates along with minimized storage volume and ponded depth, will often require several iterations and the subsequent refinement of stage – discharge and/or stage – storage data. A number of proprietary desktop computing programs are available to assist in principal spillway design process. A non exhaustive list of these programs includes Eagle Point, Hydraflow, PondPack, HydroCAD, and the Virginia Tech Penn State Urban Hydrology Model (VTPSUHM). Each of these programs employ the same basic methodology of routing, which includes subjecting a given pair of stage – storage and stage – discharge relationships to some inflow hydrograph. The following steps will demonstrate the fundamental process of designing a basin’s principal spillway. The routing operations are conducted using the Virginia Tech/Penn State Urban Hydrology Model (VTPSUHM). In the absence of acceptable hydraulic computing software, the calculations shown here can be done by hand. Refer to Section 5-9 of the Virginia Stormwater Management Handbook, 1999, Et seq. or any standard textbook on water resources engineering for information on manual storage indication routing. Step 6A. Size Basin Outfall Culvert Before proceeding to the design of various outlets in the multi-stage riser structure, we must first size the outfall conduit conveying pond releases through the embankment and into the receiving channel. The first step is to determine the outlet conduit’s maximum discharge and corresponding ponded depth in the basin. Flows in excess of the 10-year runoff producing event will be conveyed through an emergency spillway. Therefore, the design discharge for the culvert is that of the routed 10-year event. The 10-year post-development runoff must be detained and released at a rate equal to or less than the 10-year pre-development runoff. This value was computed previously as 11.37 cfs. Step 2 of this example detailed the Modified Rational approach to estimating the detention volume necessary to reduce the 10-year peak runoff rate to that of pre-development conditions. This volume was found to be 44,897ft3. Linearly interpreting the stage – storage data (Table 2.4), we find this volume at basin elevation 2103.7. This ponded depth corresponds to an approximate head of 3.7 ft acting upon the outfall culvert during 10-year conditions.
2.4 - Design Process
VDOT BMP Design Manual of Practice
23 of 50
Chapter 2 – Dry Extended Detention Basin
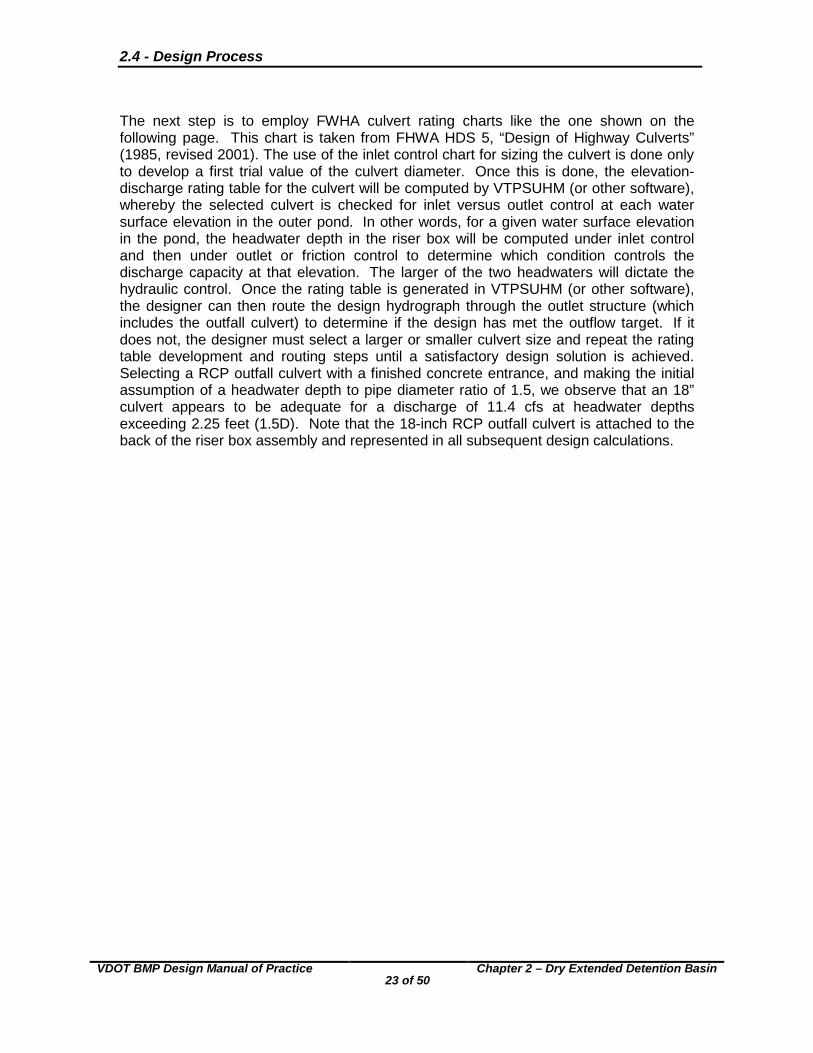
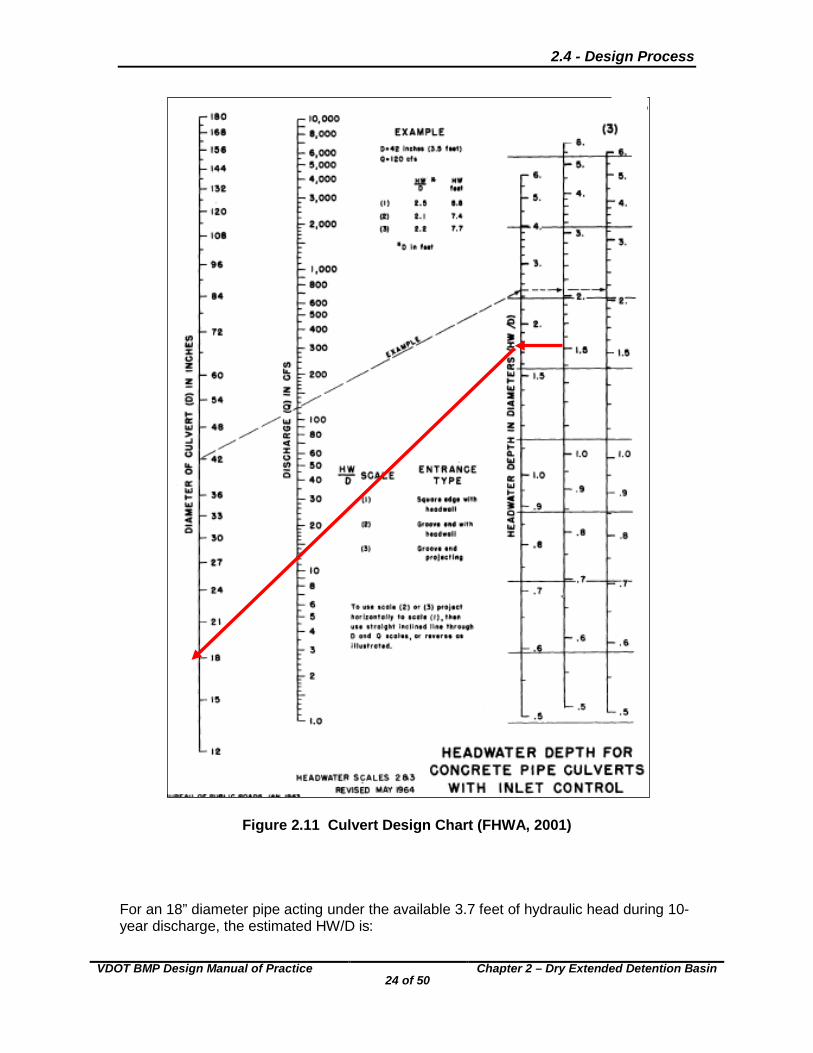
The next step is to employ FWHA culvert rating charts like the one shown on the following page. This chart is taken from FHWA HDS 5, “Design of Highway Culverts” (1985, revised 2001). The use of the inlet control chart for sizing the culvert is done only to develop a first trial value of the culvert diameter. Once this is done, the elevation-discharge rating table for the culvert will be computed by VTPSUHM (or other software), whereby the selected culvert is checked for inlet versus outlet control at each water surface elevation in the outer pond. In other words, for a given water surface elevation in the pond, the headwater depth in the riser box will be computed under inlet control and then under outlet or friction control to determine which condition controls the discharge capacity at that elevation. The larger of the two headwaters will dictate the hydraulic control. Once the rating table is generated in VTPSUHM (or other software), the designer can then route the design hydrograph through the outlet structure (which includes the outfall culvert) to determine if the design has met the outflow target. If it does not, the designer must select a larger or smaller culvert size and repeat the rating table development and routing steps until a satisfactory design solution is achieved. Selecting a RCP outfall culvert with a finished concrete entrance, and making the initial assumption of a headwater depth to pipe diameter ratio of 1.5, we observe that an 18” culvert appears to be adequate for a discharge of 11.4 cfs at headwater depths exceeding 2.25 feet (1.5D). Note that the 18-inch RCP outfall culvert is attached to the back of the riser box assembly and represented in all subsequent design calculations.
2.4 - Design Process
VDOT BMP Design Manual of Practice
24 of 50
Chapter 2 – Dry Extended Detention Basin
Figure 2.11 Culvert Design Chart (FHWA, 2001)
For an 18” diameter pipe acting under the available 3.7 feet of hydraulic head during 10-year discharge, the estimated HW/D is:
2.4 - Design Process
VDOT BMP Design Manual of Practice
25 of 50
Chapter 2 – Dry Extended Detention Basin
5.2
121)18(
7.3=
=
inftin
ftD
HW
By aligning HW/D = 2.5 and D = 18”, we see that the estimated capacity is about 29 cfs. This is certainly conservative. For purposes of this design, we will employ an 18” culvert placed on a 1% slope leaving the proposed riser structure. Note that this culvert will be submitted to full testing in subsequent flood routings by VTPSUHM, as described later. Step 6B. Design the 2-Year Control Outlet The first step in sizing the 2-year control outlet is to determine the basin water surface elevation at which the estimated 2-year detention volume is provided. Step 2 detailed the Modified Rational approach to estimating the 2-year detention volume required to reduce the 2-year peak runoff rate to the pre-development level. This volume was found to be 31,523.6 ft3. Linearly interpreting the stage – elevation data (Table 2.4), we find this volume at basin elevation 2103.2. The next step is to estimate the maximum hydraulic head acting on the 2-year control outlet. The crest/invert of the 2-year control outlet should be set just above the surface of the ponded water quality volume. The water quality volume was found to occur at basin elevation 2102.1. Therefore, the crest of the 2-year control outlet is set at elevation 2102.2, and the maximum estimated head acting upon the 2-year outlet is the difference between the ponded water surface elevation and the crest of the outlet:
.0.12.21022.21032 ftftfth year =−=− The designer has an essentially unlimited number of weir and orifice shapes, geometries, and sizes from which to choose. However, unless unique site restraints prohibit such a design, the outlets comprising the principal spillway should function in weir flow for all design storms. When site conditions are such that weir flow cannot be maintained, an anti-vortex device must be provided in accordance with the specifications detailed in the Virginia Stormwater Management Handbook, (DCR, 1999, Et seq.). Regardless of the shape and size chosen, the outlet will function under weir flow conditions until the entire opening is submerged. Therefore, the weir equation is very useful in selecting control outlet sizes and shapes. The weir equation is shown as follows:
5.1LhCQ W=
Q = Weir flow discharge (cfs) CW= Weir coefficient (3.1 for most sharp-crested weirs) L = Weir crest length (ft) H = Head measured from the water surface elevation to the crest of the weir (ft)
2.4 - Design Process
VDOT BMP Design Manual of Practice
26 of 50
Chapter 2 – Dry Extended Detention Basin
When rearranged, the weir equation can be used to compute weir lengths necessary to meet basin release targets. The rearranged form of the weir equation, with variables as previously defined, is shown as follows:
5.1hCQL
W
=
Another useful approach in the sizing of circular orifices is to select an orifice diameter that is just slightly larger than that required under orifice flow. Sizing the orifice in this manner will ensure that, for the available storage volume, the orifice provides the minimal release from the basin that is possible while remaining under weir flow conditions. This approach utilizes the orifice equation, shown as follows:
ghCaQ 2=
Q = Discharge (cfs) C = Orifice coefficient (0.6) a = Orifice area (ft2) g = Gravitational acceleration (32.2 ft/sec2) h = Head (ft)
The previously estimated head acting upon the 2-year control outlet is 1.1 ft, and the target 2-year release from the basin is 7.97 cfs. Rearranging the orifice equation and applying these values, we compute the diameter as follows:
265.1)0.1)(2.32)(2(6.0
97.72
ftghC
Qa ===
The diameter is then computed as:
inftad 8.164.114.3
)65.1)(4(4====
π
To ensure that the orifice does not become submerged, thus inducing orifice flow, the orifice diameter is increased to the nominal size of 18 inches. Next, the designer must construct the stage – discharge relationship for the chosen outlet. It is noted that the stage – discharge curve should reflect not only the 2-year control outlet, but also the 18” concrete outfall culvert. Typically, on VDOT projects, the water quality orifice is not considered in the flood control rating curve(s). Table 2.5 presents the stage – discharge relationship for the 2-year control orifice, and the 18” concrete outfall culvert.
2.4 - Design Process
VDOT BMP Design Manual of Practice
27 of 50
Chapter 2 – Dry Extended Detention Basin
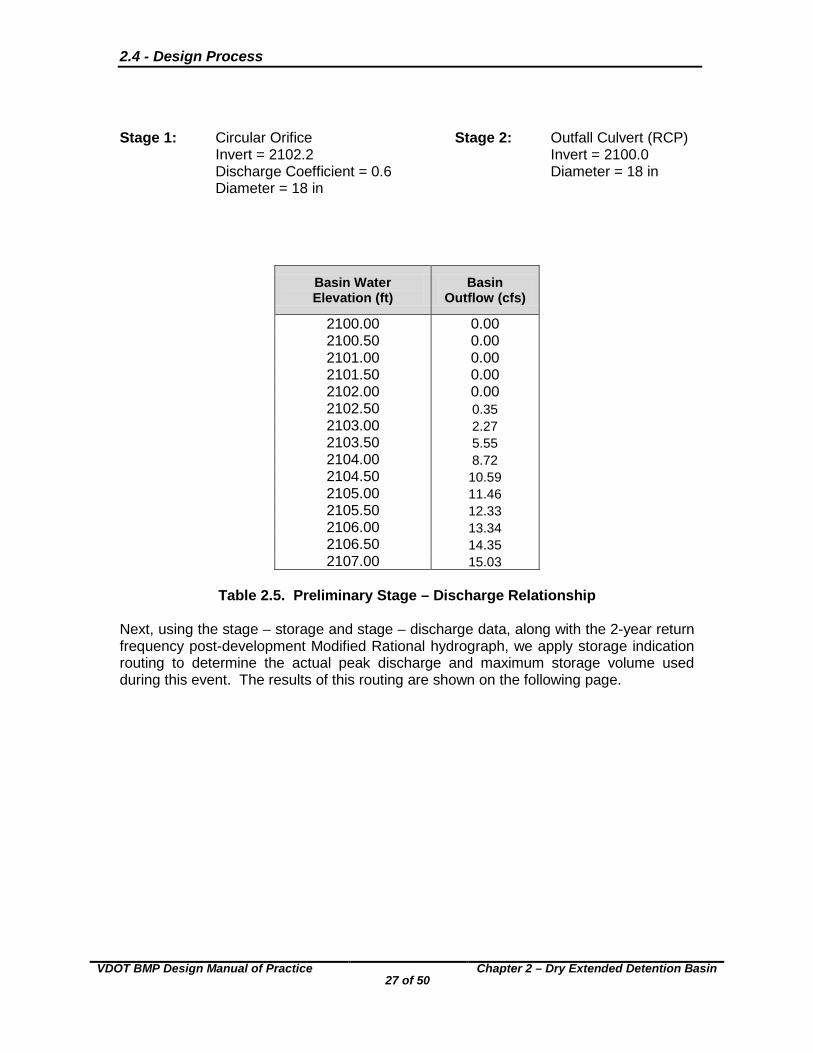
Stage 1: Circular Orifice Stage 2: Outfall Culvert (RCP) Invert = 2102.2 Invert = 2100.0 Discharge Coefficient = 0.6 Diameter = 18 in Diameter = 18 in
Basin Water Elevation (ft)
Basin Outflow (cfs)
2100.00 0.00 2100.50 0.00 2101.00 0.00 2101.50 0.00 2102.00 0.00 2102.50 0.35 2103.00 2.27 2103.50 5.55 2104.00 8.72 2104.50 10.59 2105.00 11.46 2105.50 12.33 2106.00 13.34 2106.50 14.35 2107.00 15.03
Table 2.5. Preliminary Stage – Discharge Relationship
Next, using the stage – storage and stage – discharge data, along with the 2-year return frequency post-development Modified Rational hydrograph, we apply storage indication routing to determine the actual peak discharge and maximum storage volume used during this event. The results of this routing are shown on the following page.
2.4 - Design Process
VDOT BMP Design Manual of Practice
28 of 50
Chapter 2 – Dry Extended Detention Basin
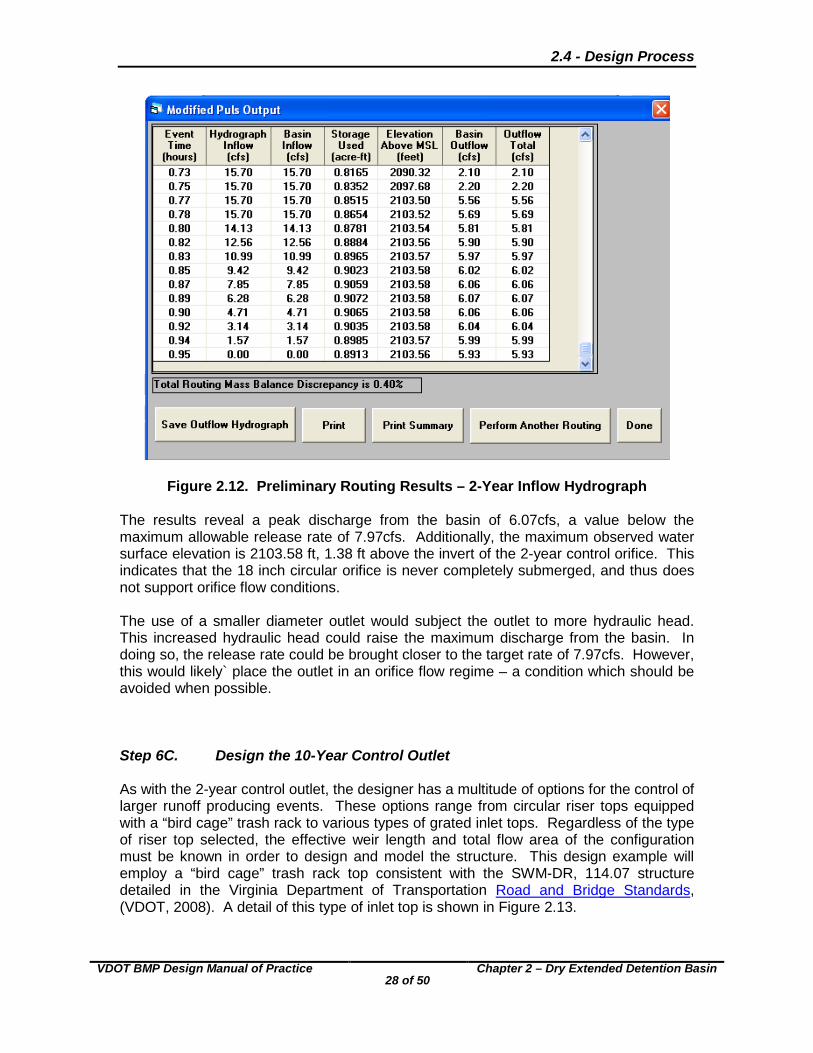
Figure 2.12. Preliminary Routing Results – 2-Year Inflow Hydrograph
The results reveal a peak discharge from the basin of 6.07cfs, a value below the maximum allowable release rate of 7.97cfs. Additionally, the maximum observed water surface elevation is 2103.58 ft, 1.38 ft above the invert of the 2-year control orifice. This indicates that the 18 inch circular orifice is never completely submerged, and thus does not support orifice flow conditions. The use of a smaller diameter outlet would subject the outlet to more hydraulic head. This increased hydraulic head could raise the maximum discharge from the basin. In doing so, the release rate could be brought closer to the target rate of 7.97cfs. However, this would likely` place the outlet in an orifice flow regime – a condition which should be avoided when possible. Step 6C. Design the 10-Year Control Outlet As with the 2-year control outlet, the designer has a multitude of options for the control of larger runoff producing events. These options range from circular riser tops equipped with a “bird cage” trash rack to various types of grated inlet tops. Regardless of the type of riser top selected, the effective weir length and total flow area of the configuration must be known in order to design and model the structure. This design example will employ a “bird cage” trash rack top consistent with the SWM-DR, 114.07 structure detailed in the Virginia Department of Transportation Road and Bridge Standards, (VDOT, 2008). A detail of this type of inlet top is shown in Figure 2.13.
2.4 - Design Process
VDOT BMP Design Manual of Practice
29 of 50
Chapter 2 – Dry Extended Detention Basin
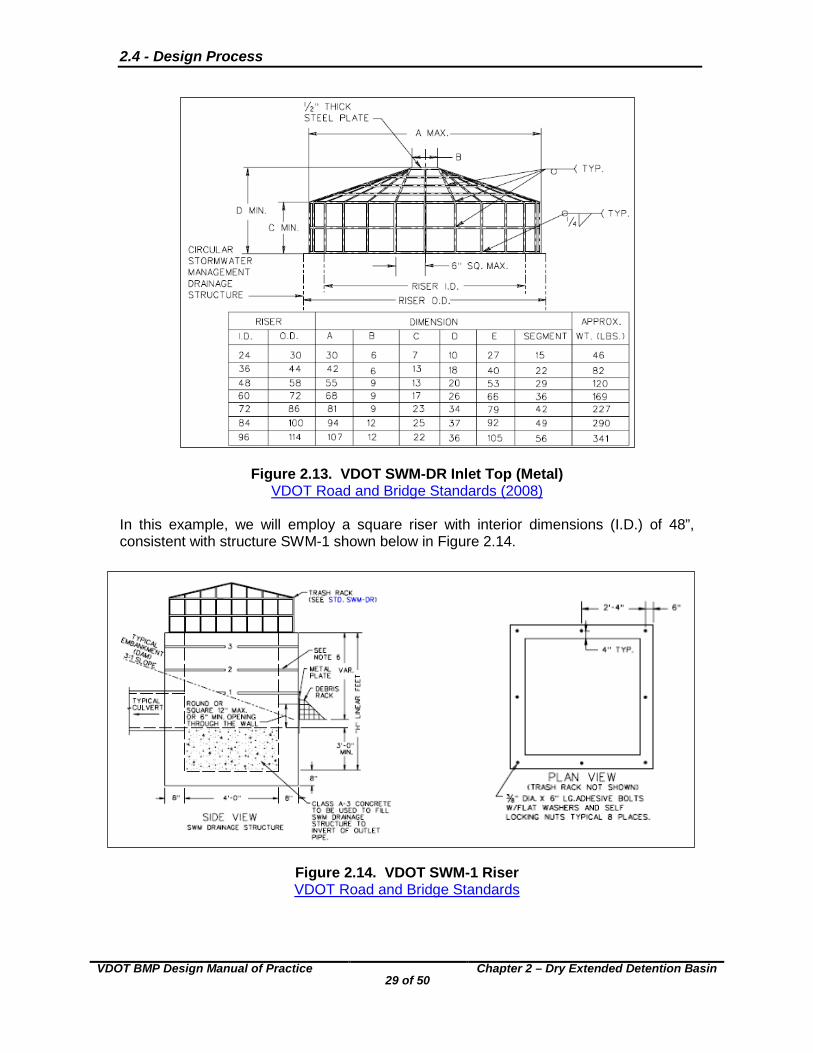
Figure 2.13. VDOT SWM-DR Inlet Top (Metal) VDOT Road and Bridge Standards (2008)
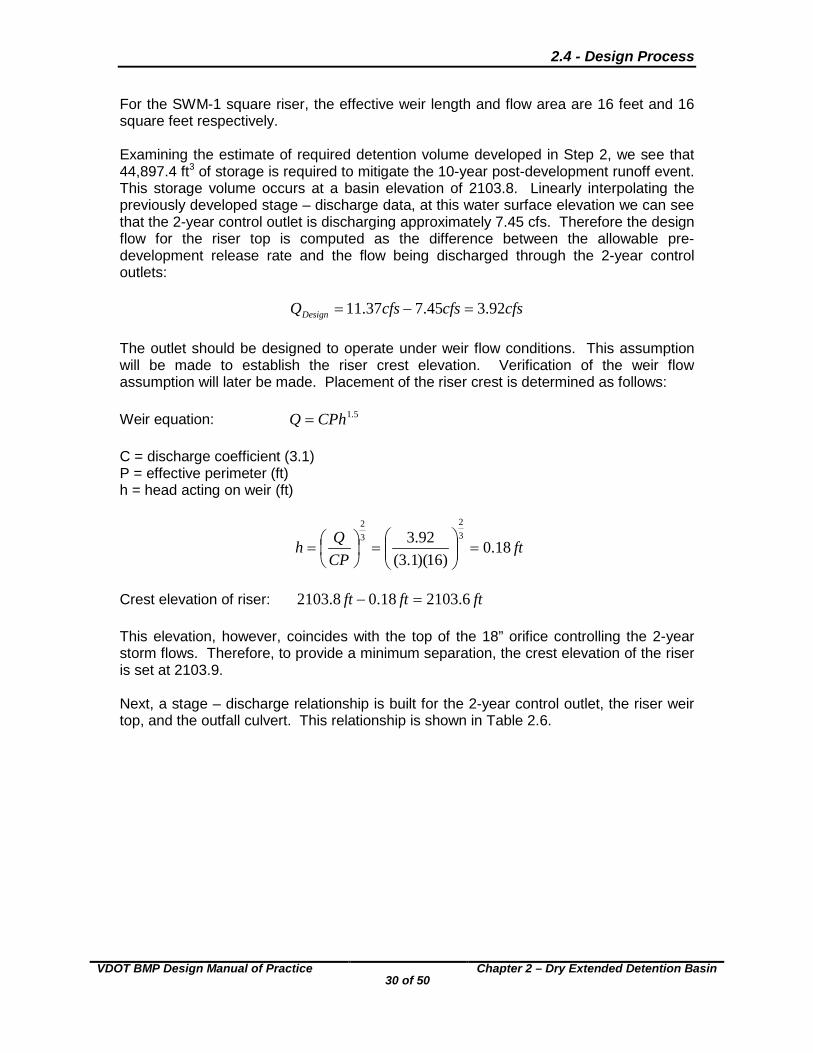
In this example, we will employ a square riser with interior dimensions (I.D.) of 48”, consistent with structure SWM-1 shown below in Figure 2.14.
Figure 2.14. VDOT SWM-1 Riser VDOT Road and Bridge Standards
2.4 - Design Process
VDOT BMP Design Manual of Practice
30 of 50
Chapter 2 – Dry Extended Detention Basin
For the SWM-1 square riser, the effective weir length and flow area are 16 feet and 16 square feet respectively. Examining the estimate of required detention volume developed in Step 2, we see that 44,897.4 ft3 of storage is required to mitigate the 10-year post-development runoff event. This storage volume occurs at a basin elevation of 2103.8. Linearly interpolating the previously developed stage – discharge data, at this water surface elevation we can see that the 2-year control outlet is discharging approximately 7.45 cfs. Therefore the design flow for the riser top is computed as the difference between the allowable pre-development release rate and the flow being discharged through the 2-year control outlets:
cfscfscfsQDesign 92.345.737.11 =−=
The outlet should be designed to operate under weir flow conditions. This assumption will be made to establish the riser crest elevation. Verification of the weir flow assumption will later be made. Placement of the riser crest is determined as follows: Weir equation: 5.1CPhQ = C = discharge coefficient (3.1) P = effective perimeter (ft) h = head acting on weir (ft)
ftCPQh 18.0
)16)(1.3(92.3 3
232
=
=
=
Crest elevation of riser: ftftft 6.210318.08.2103 =− This elevation, however, coincides with the top of the 18” orifice controlling the 2-year storm flows. Therefore, to provide a minimum separation, the crest elevation of the riser is set at 2103.9. Next, a stage – discharge relationship is built for the 2-year control outlet, the riser weir top, and the outfall culvert. This relationship is shown in Table 2.6.
2.4 - Design Process
VDOT BMP Design Manual of Practice
31 of 50
Chapter 2 – Dry Extended Detention Basin
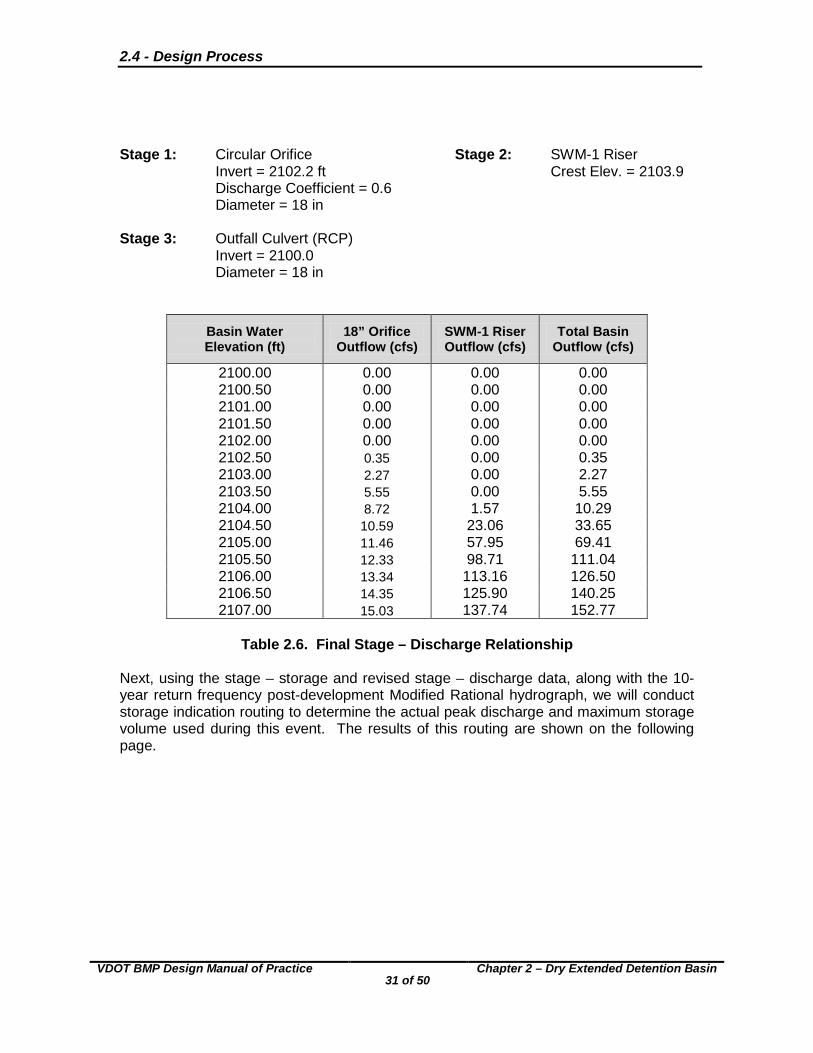
Stage 1: Circular Orifice Stage 2: SWM-1 Riser Invert = 2102.2 ft Crest Elev. = 2103.9 Discharge Coefficient = 0.6 Diameter = 18 in
Stage 3: Outfall Culvert (RCP) Invert = 2100.0 Diameter = 18 in
Basin Water Elevation (ft)
18” Orifice Outflow (cfs)
SWM-1 Riser Outflow (cfs)
Total Basin Outflow (cfs)
2100.00 0.00 0.00 0.00 2100.50 0.00 0.00 0.00 2101.00 0.00 0.00 0.00 2101.50 0.00 0.00 0.00 2102.00 0.00 0.00 0.00 2102.50 0.35 0.00 0.35 2103.00 2.27 0.00 2.27 2103.50 5.55 0.00 5.55 2104.00 8.72 1.57 10.29 2104.50 10.59 23.06 33.65 2105.00 11.46 57.95 69.41 2105.50 12.33 98.71 111.04 2106.00 13.34 113.16 126.50 2106.50 14.35 125.90 140.25 2107.00 15.03 137.74 152.77
Table 2.6. Final Stage – Discharge Relationship
Next, using the stage – storage and revised stage – discharge data, along with the 10-year return frequency post-development Modified Rational hydrograph, we will conduct storage indication routing to determine the actual peak discharge and maximum storage volume used during this event. The results of this routing are shown on the following page.
2.4 - Design Process
VDOT BMP Design Manual of Practice
32 of 50
Chapter 2 – Dry Extended Detention Basin
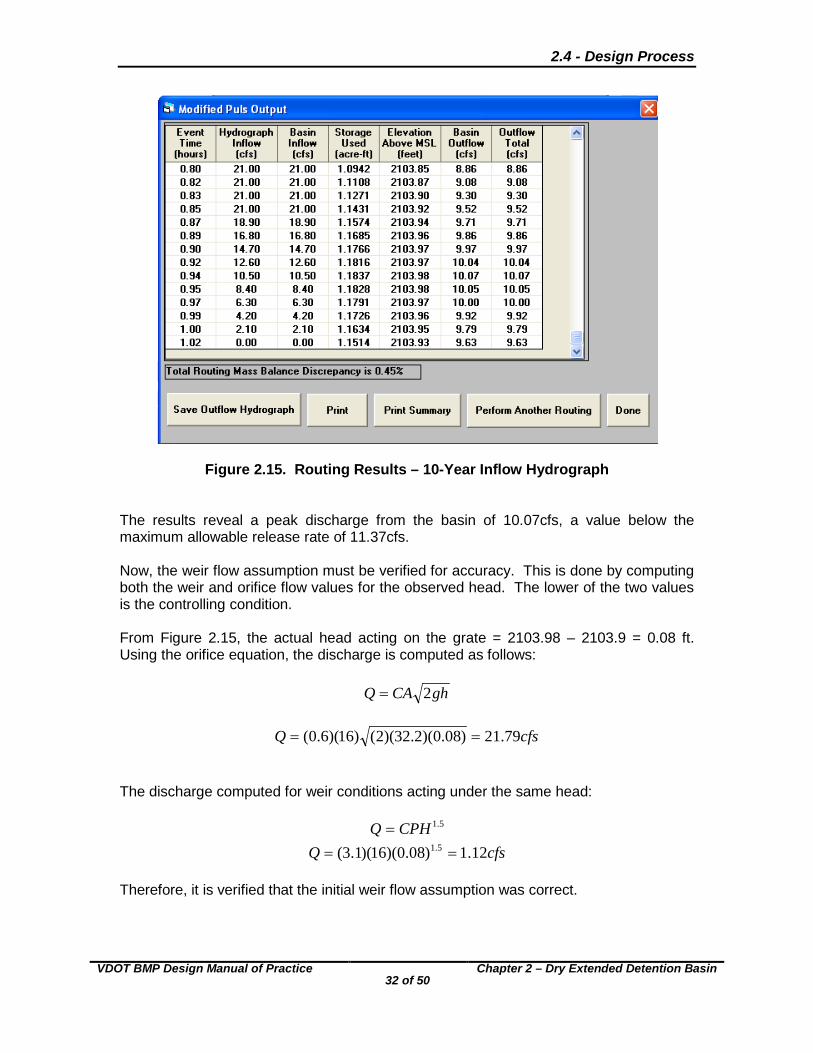
Figure 2.15. Routing Results – 10-Year Inflow Hydrograph
The results reveal a peak discharge from the basin of 10.07cfs, a value below the maximum allowable release rate of 11.37cfs. Now, the weir flow assumption must be verified for accuracy. This is done by computing both the weir and orifice flow values for the observed head. The lower of the two values is the controlling condition. From Figure 2.15, the actual head acting on the grate = 2103.98 – 2103.9 = 0.08 ft. Using the orifice equation, the discharge is computed as follows:
ghCAQ 2=
cfsQ 79.21)08.0)(2.32)(2()16)(6.0( ==
The discharge computed for weir conditions acting under the same head:
5.1CPHQ = cfsQ 12.1)08.0)(16)(1.3( 5.1 ==
Therefore, it is verified that the initial weir flow assumption was correct.
2.4 - Design Process
VDOT BMP Design Manual of Practice
33 of 50
Chapter 2 – Dry Extended Detention Basin
Step 6D. Evaluate the Performance of the Principal Spillway Under 100-Year Runoff Conditions
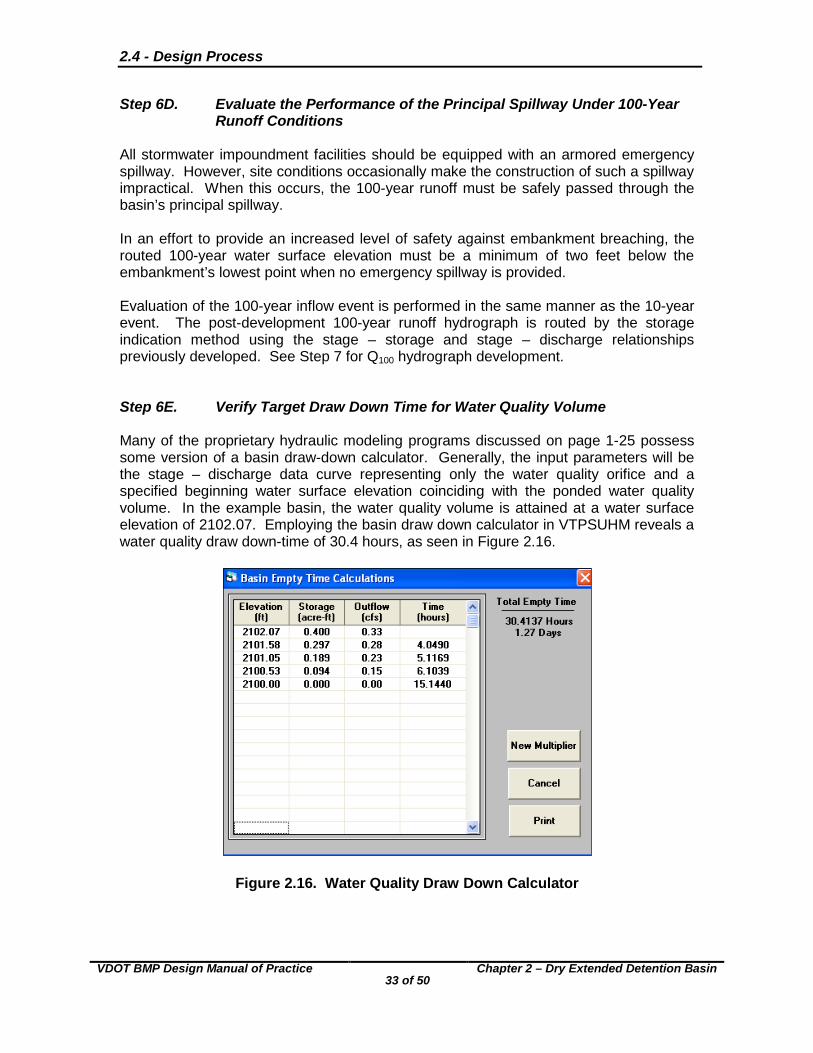
All stormwater impoundment facilities should be equipped with an armored emergency spillway. However, site conditions occasionally make the construction of such a spillway impractical. When this occurs, the 100-year runoff must be safely passed through the basin’s principal spillway. In an effort to provide an increased level of safety against embankment breaching, the routed 100-year water surface elevation must be a minimum of two feet below the embankment’s lowest point when no emergency spillway is provided. Evaluation of the 100-year inflow event is performed in the same manner as the 10-year event. The post-development 100-year runoff hydrograph is routed by the storage indication method using the stage – storage and stage – discharge relationships previously developed. See Step 7 for Q100 hydrograph development. Step 6E. Verify Target Draw Down Time for Water Quality Volume Many of the proprietary hydraulic modeling programs discussed on page 1-25 possess some version of a basin draw-down calculator. Generally, the input parameters will be the stage – discharge data curve representing only the water quality orifice and a specified beginning water surface elevation coinciding with the ponded water quality volume. In the example basin, the water quality volume is attained at a water surface elevation of 2102.07. Employing the basin draw down calculator in VTPSUHM reveals a water quality draw down-time of 30.4 hours, as seen in Figure 2.16.
Figure 2.16. Water Quality Draw Down Calculator
2.4 - Design Process
VDOT BMP Design Manual of Practice
34 of 50
Chapter 2 – Dry Extended Detention Basin
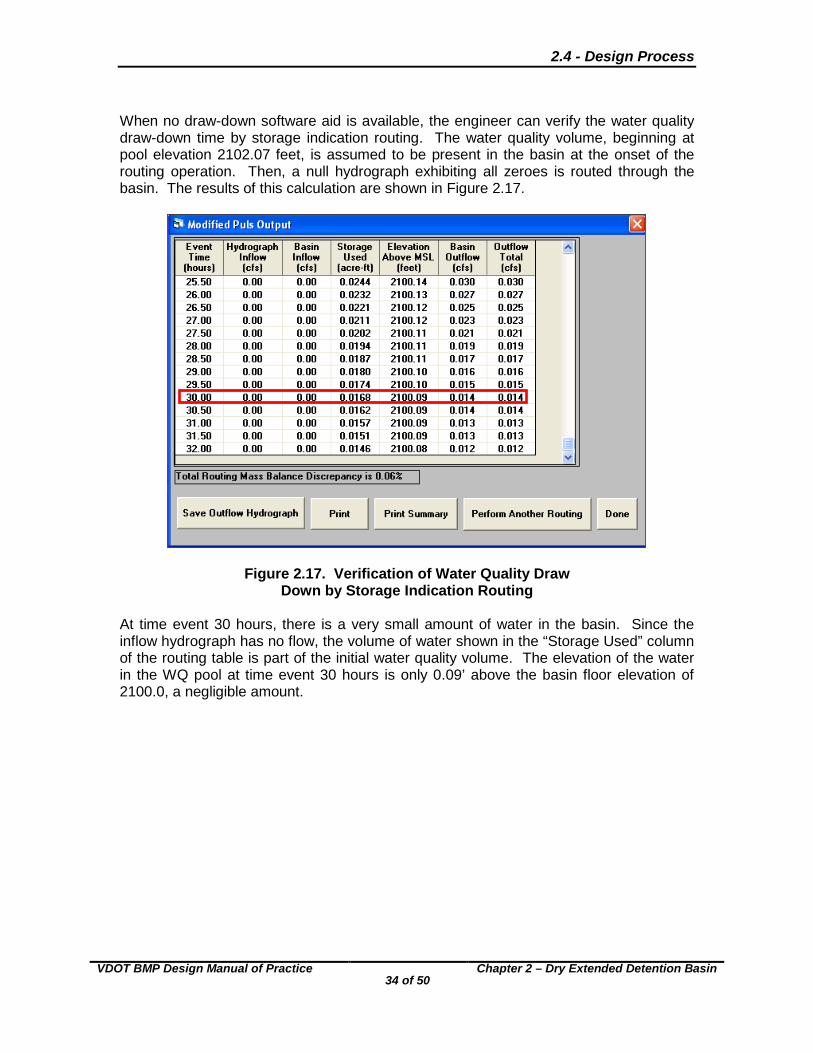
When no draw-down software aid is available, the engineer can verify the water quality draw-down time by storage indication routing. The water quality volume, beginning at pool elevation 2102.07 feet, is assumed to be present in the basin at the onset of the routing operation. Then, a null hydrograph exhibiting all zeroes is routed through the basin. The results of this calculation are shown in Figure 2.17.
Figure 2.17. Verification of Water Quality Draw Down by Storage Indication Routing
At time event 30 hours, there is a very small amount of water in the basin. Since the inflow hydrograph has no flow, the volume of water shown in the “Storage Used” column of the routing table is part of the initial water quality volume. The elevation of the water in the WQ pool at time event 30 hours is only 0.09’ above the basin floor elevation of 2100.0, a negligible amount.
2.4 - Design Process
VDOT BMP Design Manual of Practice
35 of 50
Chapter 2 – Dry Extended Detention Basin
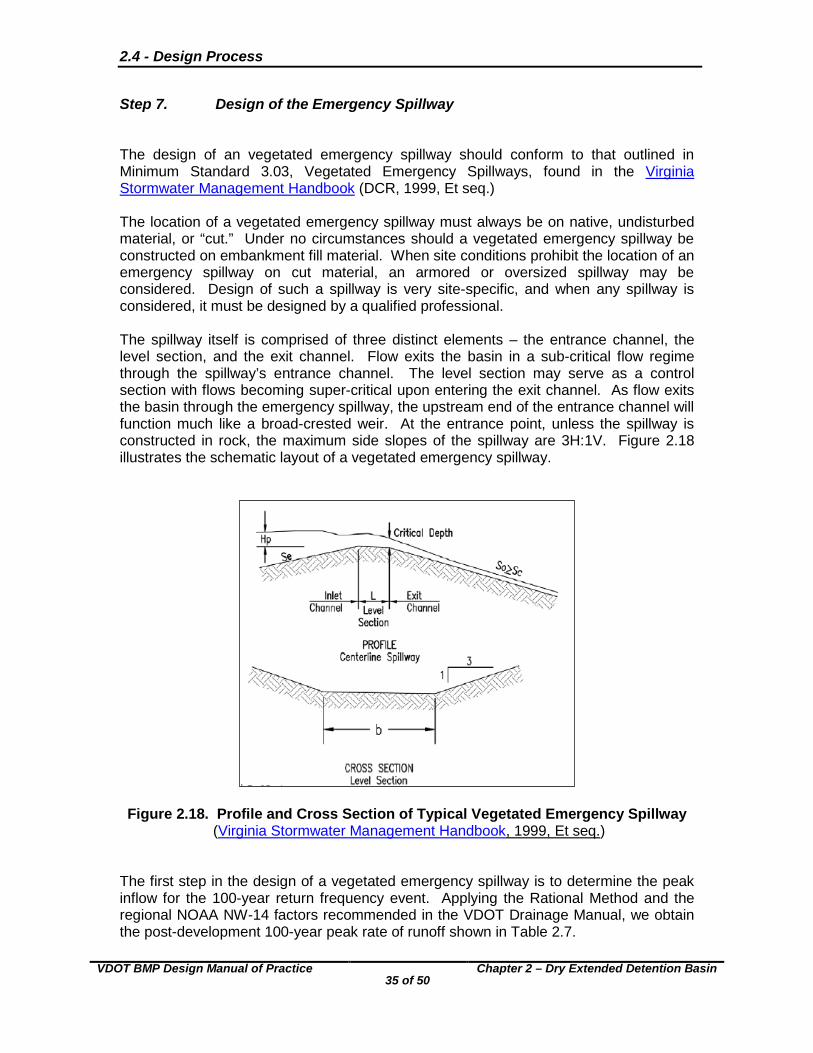
Step 7. Design of the Emergency Spillway The design of an vegetated emergency spillway should conform to that outlined in Minimum Standard 3.03, Vegetated Emergency Spillways, found in the Virginia Stormwater Management Handbook (DCR, 1999, Et seq.) The location of a vegetated emergency spillway must always be on native, undisturbed material, or “cut.” Under no circumstances should a vegetated emergency spillway be constructed on embankment fill material. When site conditions prohibit the location of an emergency spillway on cut material, an armored or oversized spillway may be considered. Design of such a spillway is very site-specific, and when any spillway is considered, it must be designed by a qualified professional. The spillway itself is comprised of three distinct elements – the entrance channel, the level section, and the exit channel. Flow exits the basin in a sub-critical flow regime through the spillway’s entrance channel. The level section may serve as a control section with flows becoming super-critical upon entering the exit channel. As flow exits the basin through the emergency spillway, the upstream end of the entrance channel will function much like a broad-crested weir. At the entrance point, unless the spillway is constructed in rock, the maximum side slopes of the spillway are 3H:1V. Figure 2.18 illustrates the schematic layout of a vegetated emergency spillway.
Figure 2.18. Profile and Cross Section of Typical Vegetated Emergency Spillway (Virginia Stormwater Management Handbook, 1999, Et seq.)
The first step in the design of a vegetated emergency spillway is to determine the peak inflow for the 100-year return frequency event. Applying the Rational Method and the regional NOAA NW-14 factors recommended in the VDOT Drainage Manual, we obtain the post-development 100-year peak rate of runoff shown in Table 2.7.
2.4 - Design Process
VDOT BMP Design Manual of Practice
36 of 50
Chapter 2 – Dry Extended Detention Basin
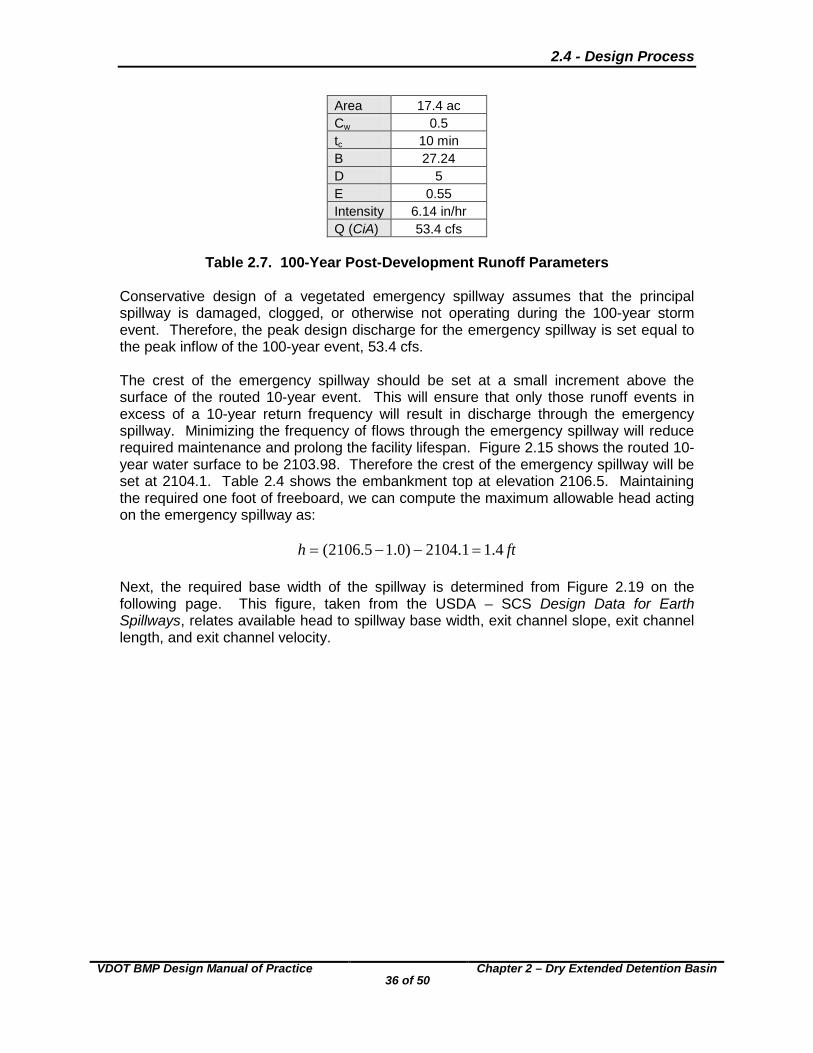
Area 17.4 ac Cw 0.5 tc 10 min B 27.24 D 5 E 0.55 Intensity 6.14 in/hr Q (CiA) 53.4 cfs
Table 2.7. 100-Year Post-Development Runoff Parameters
Conservative design of a vegetated emergency spillway assumes that the principal spillway is damaged, clogged, or otherwise not operating during the 100-year storm event. Therefore, the peak design discharge for the emergency spillway is set equal to the peak inflow of the 100-year event, 53.4 cfs. The crest of the emergency spillway should be set at a small increment above the surface of the routed 10-year event. This will ensure that only those runoff events in excess of a 10-year return frequency will result in discharge through the emergency spillway. Minimizing the frequency of flows through the emergency spillway will reduce required maintenance and prolong the facility lifespan. Figure 2.15 shows the routed 10-year water surface to be 2103.98. Therefore the crest of the emergency spillway will be set at 2104.1. Table 2.4 shows the embankment top at elevation 2106.5. Maintaining the required one foot of freeboard, we can compute the maximum allowable head acting on the emergency spillway as:
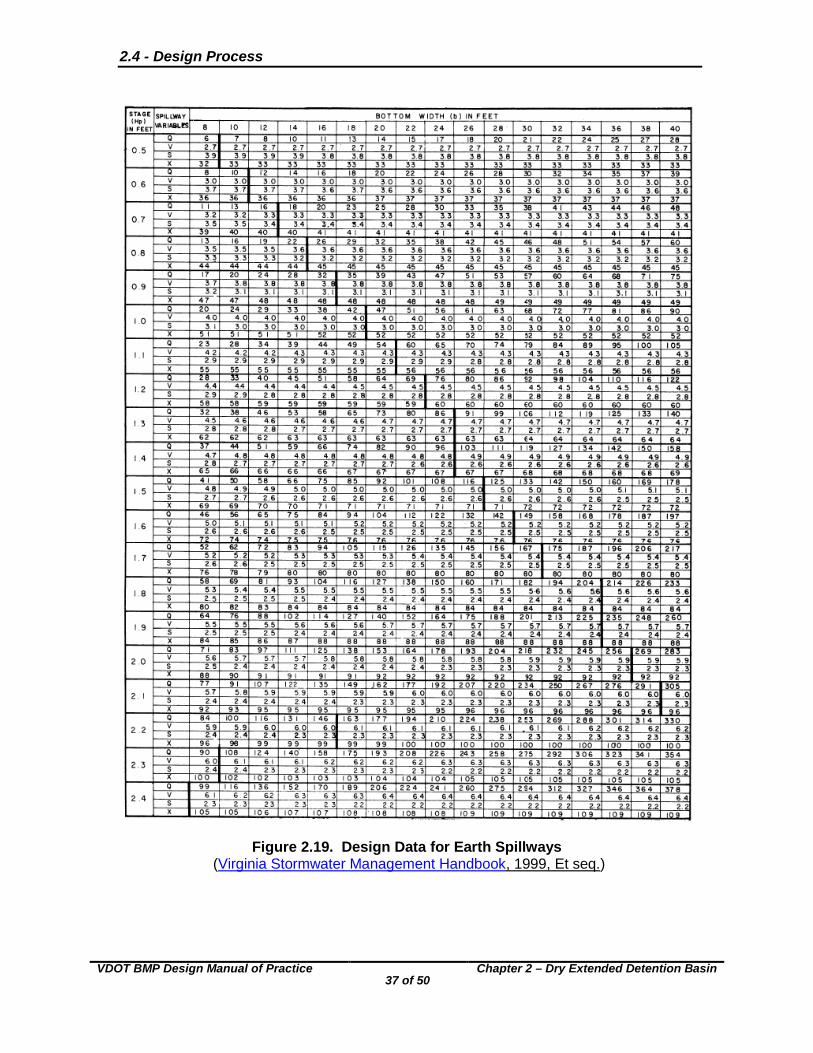
fth 4.11.2104)0.15.2106( =−−= Next, the required base width of the spillway is determined from Figure 2.19 on the following page. This figure, taken from the USDA – SCS Design Data for Earth Spillways, relates available head to spillway base width, exit channel slope, exit channel length, and exit channel velocity.
2.4 - Design Process
VDOT BMP Design Manual of Practice
37 of 50
Chapter 2 – Dry Extended Detention Basin
Figure 2.19. Design Data for Earth Spillways (Virginia Stormwater Management Handbook, 1999, Et seq.)
2.4 - Design Process
VDOT BMP Design Manual of Practice
38 of 50
Chapter 2 – Dry Extended Detention Basin
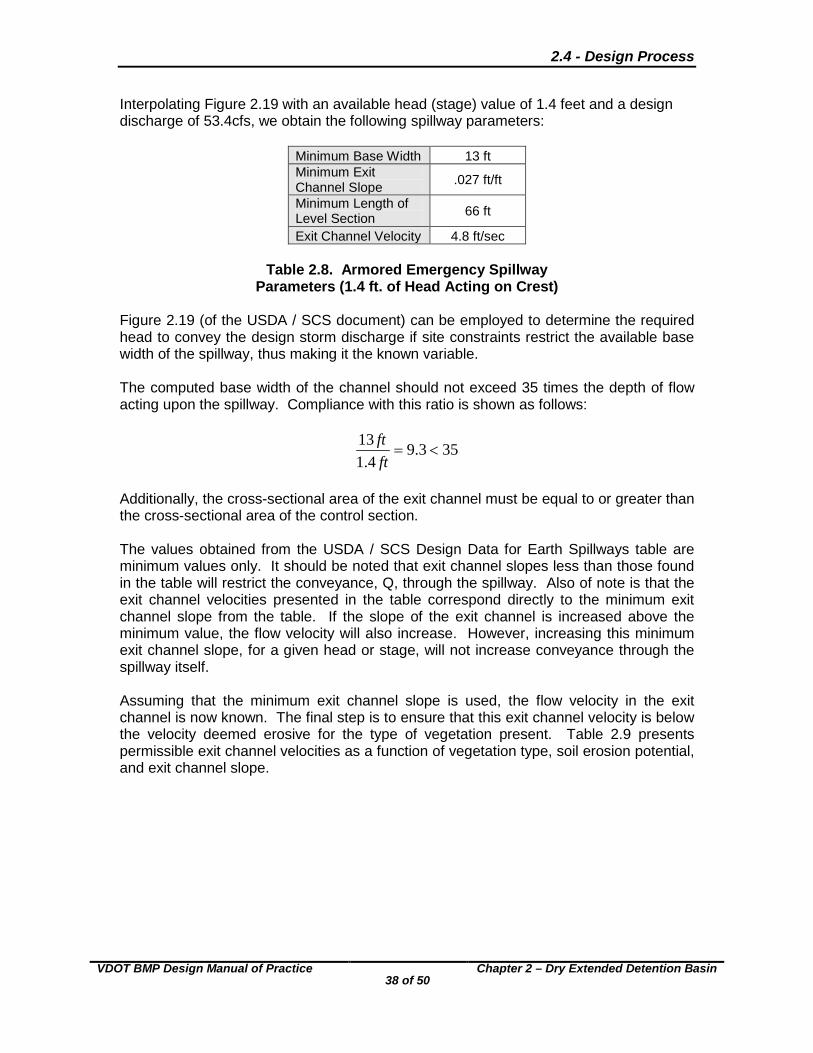
Interpolating Figure 2.19 with an available head (stage) value of 1.4 feet and a design discharge of 53.4cfs, we obtain the following spillway parameters:
Minimum Base Width 13 ft Minimum Exit Channel Slope .027 ft/ft
Minimum Length of Level Section 66 ft
Exit Channel Velocity 4.8 ft/sec
Table 2.8. Armored Emergency Spillway Parameters (1.4 ft. of Head Acting on Crest)
Figure 2.19 (of the USDA / SCS document) can be employed to determine the required head to convey the design storm discharge if site constraints restrict the available base width of the spillway, thus making it the known variable. The computed base width of the channel should not exceed 35 times the depth of flow acting upon the spillway. Compliance with this ratio is shown as follows:
353.94.1
13<=
ftft
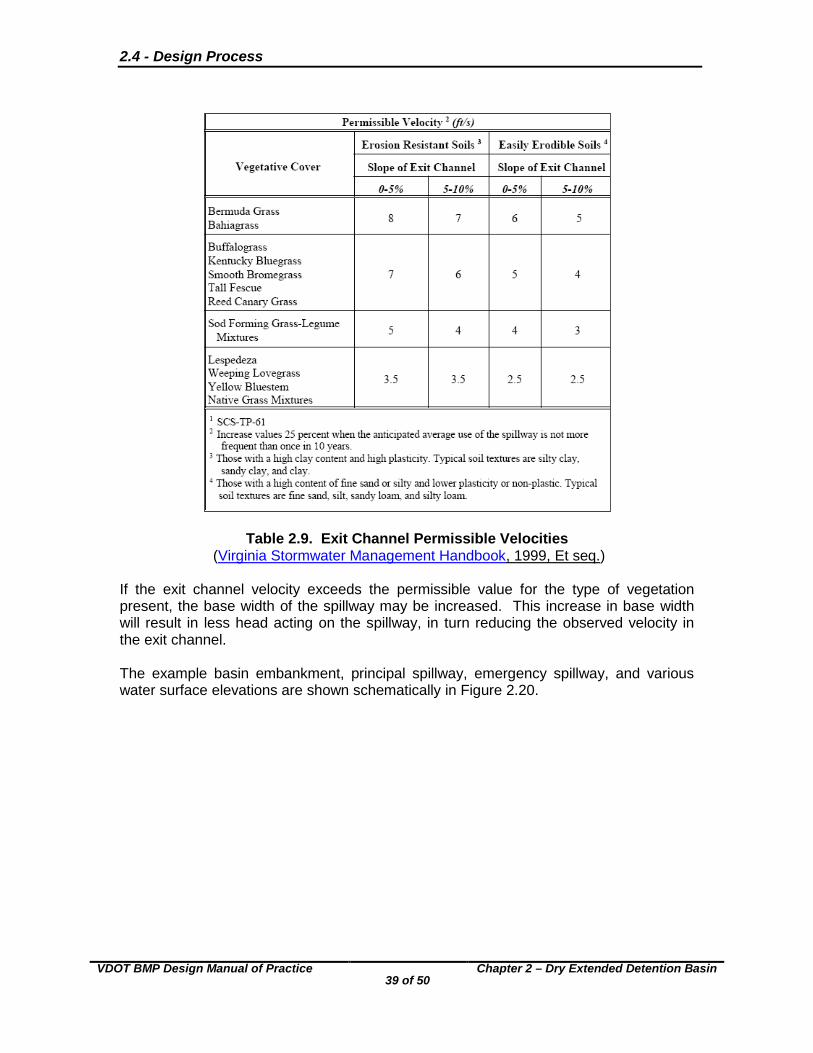
Additionally, the cross-sectional area of the exit channel must be equal to or greater than the cross-sectional area of the control section. The values obtained from the USDA / SCS Design Data for Earth Spillways table are minimum values only. It should be noted that exit channel slopes less than those found in the table will restrict the conveyance, Q, through the spillway. Also of note is that the exit channel velocities presented in the table correspond directly to the minimum exit channel slope from the table. If the slope of the exit channel is increased above the minimum value, the flow velocity will also increase. However, increasing this minimum exit channel slope, for a given head or stage, will not increase conveyance through the spillway itself. Assuming that the minimum exit channel slope is used, the flow velocity in the exit channel is now known. The final step is to ensure that this exit channel velocity is below the velocity deemed erosive for the type of vegetation present. Table 2.9 presents permissible exit channel velocities as a function of vegetation type, soil erosion potential, and exit channel slope.
2.4 - Design Process
VDOT BMP Design Manual of Practice
39 of 50
Chapter 2 – Dry Extended Detention Basin
Table 2.9. Exit Channel Permissible Velocities (Virginia Stormwater Management Handbook, 1999, Et seq.)
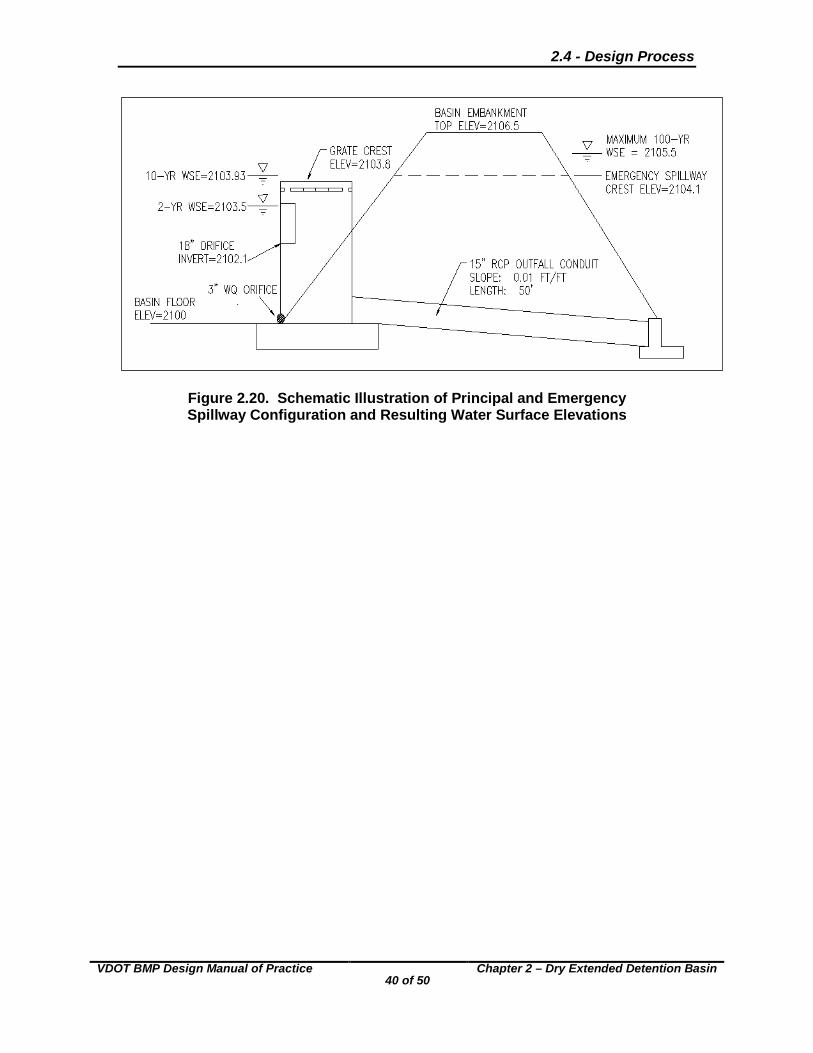
If the exit channel velocity exceeds the permissible value for the type of vegetation present, the base width of the spillway may be increased. This increase in base width will result in less head acting on the spillway, in turn reducing the observed velocity in the exit channel. The example basin embankment, principal spillway, emergency spillway, and various water surface elevations are shown schematically in Figure 2.20.
2.4 - Design Process
VDOT BMP Design Manual of Practice
40 of 50
Chapter 2 – Dry Extended Detention Basin
Figure 2.20. Schematic Illustration of Principal and Emergency Spillway Configuration and Resulting Water Surface Elevations
2.4 - Design Process
VDOT BMP Design Manual of Practice
41 of 50
Chapter 2 – Dry Extended Detention Basin
Step 8. Provision for Seepage Control A primary cause of failure in earthen embankments arises from piping/seepage along the principal spillway’s outfall conduit. Traditionally, an attempt to reduce the severity of piping has been made through the use of anti-seep collars. These collars attempt to lengthen the percolation path along the conduit, thus reducing the available hydraulic gradient. This, in effect, discourages piping along the conduit. In 1987, the U.S. Army Corps of Engineers released Technical Memorandum No. 9 at http://www.usace.army.mil/Library.aspx stating:
“When a conduit is selected for a waterway through an earth or rockfill embankment, cutoff collars will not be selected as the seepage control measure.”
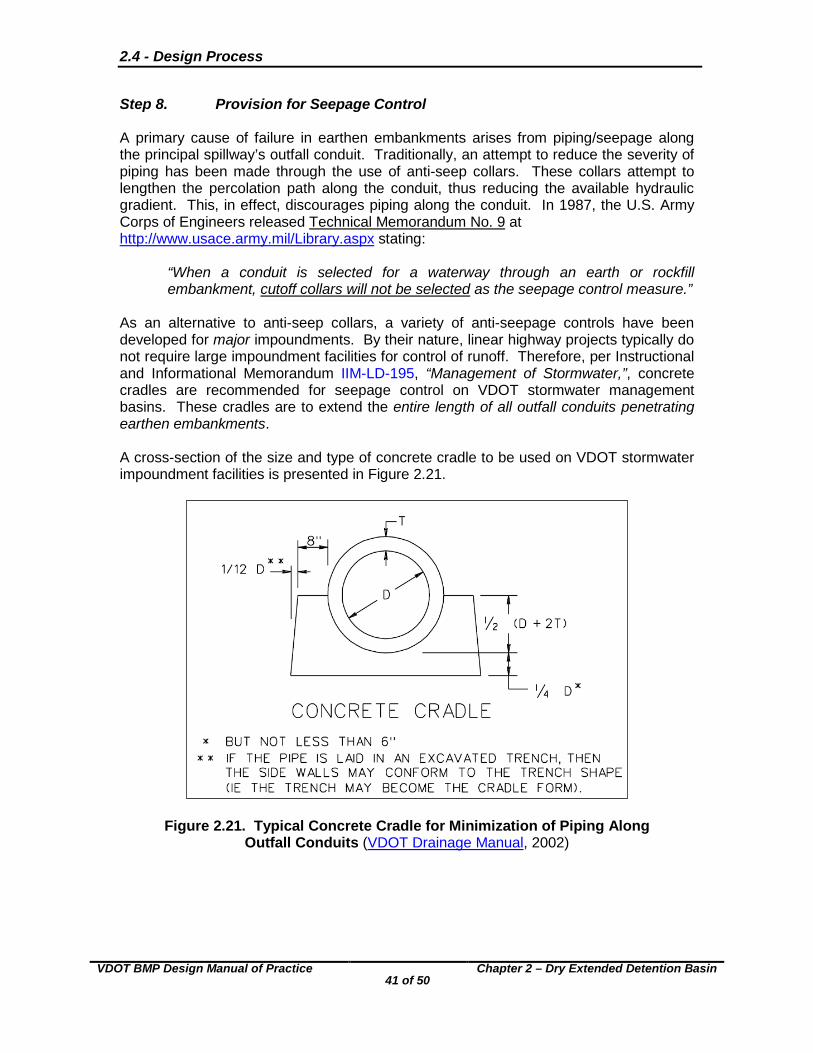
As an alternative to anti-seep collars, a variety of anti-seepage controls have been developed for major impoundments. By their nature, linear highway projects typically do not require large impoundment facilities for control of runoff. Therefore, per Instructional and Informational Memorandum IIM-LD-195, “Management of Stormwater,”, concrete cradles are recommended for seepage control on VDOT stormwater management basins. These cradles are to extend the entire length of all outfall conduits penetrating earthen embankments. A cross-section of the size and type of concrete cradle to be used on VDOT stormwater impoundment facilities is presented in Figure 2.21.
Figure 2.21. Typical Concrete Cradle for Minimization of Piping Along Outfall Conduits (VDOT Drainage Manual, 2002)

2.4 - Design Process
VDOT BMP Design Manual of Practice
42 of 50
Chapter 2 – Dry Extended Detention Basin
Step 9. Embankment Design Proper design and construction of the earthen impounding structure is of critical importance to the long-term performance of a stormwater detention basin. Early in the design stages of a project for which a detention basin is proposed, foundation data for the dam must be secured by the Materials Division to determine whether or not the native material is capable of supporting the dam while not allowing water to seep under the dam. Per Instructional and Informational Memorandum IIM-LD-195 under “Post Development Stormwater Management,” Section 12.1.1: “The foundation material under the dam and the material used for the embankment of the dam should be an AASHTO Type A-4 or finer and/or meet the approval of the Materials Division. If the native material is not adequate, the foundation of the dam is to be excavated and backfilled a minimum of 4 feet or the amount recommended by the VDOT Materials Division. The backfill and embankment material must meet the soil classification requirements identified herein or the design of the dam may incorporate a trench lined with a membrane (such as bentonite penetrated fabric or an HDPE or LDPE liner). Such designs shall be reviewed and approved by the VDOT Materials Division before use.” If the basin embankment height exceeds 15’, or if the basin includes a permanent pool, the design of the dam should employ a homogenous embankment with seepage controls or zoned embankments, or similar design in accordance with the Virginia SWM Handbook and recommendations of the VDOT Materials Division. During the initial subsurface investigation, additional borings should be made near the center of the proposed basin when:
o Excavation from the basin will be used to construct the embankment o There is a potential of encountering rock during excavation o A high or seasonally high water table, generally two feet or less, is suspected
On larger projects, multiple borings for the dam and/or basin may be deemed necessary. The number and location of these borings should be determined by the Hydraulics and/or Materials Engineer. If the basin embankment height exceeds 15’, or if the basin includes a permanent pool, the design of the dam should employ a homogenous embankment with seepage controls or zoned embankments. Embankment height is largely dictated by freeboard requirements. The required freeboard depths under 100-year conditions are as follows:
o When equipped with an emergency spillway, the basin must provide a minimum of one foot of freeboard from the maximum water surface elevation arising from the 100-year event and the lowest point in the embankment (excluding the emergency spillway itself).
o When no emergency spillway is provided, a minimum of two feet of freeboard
should be provided between the maximum water surface elevation induced by the 100-year runoff event and the lowest point in the embankment.
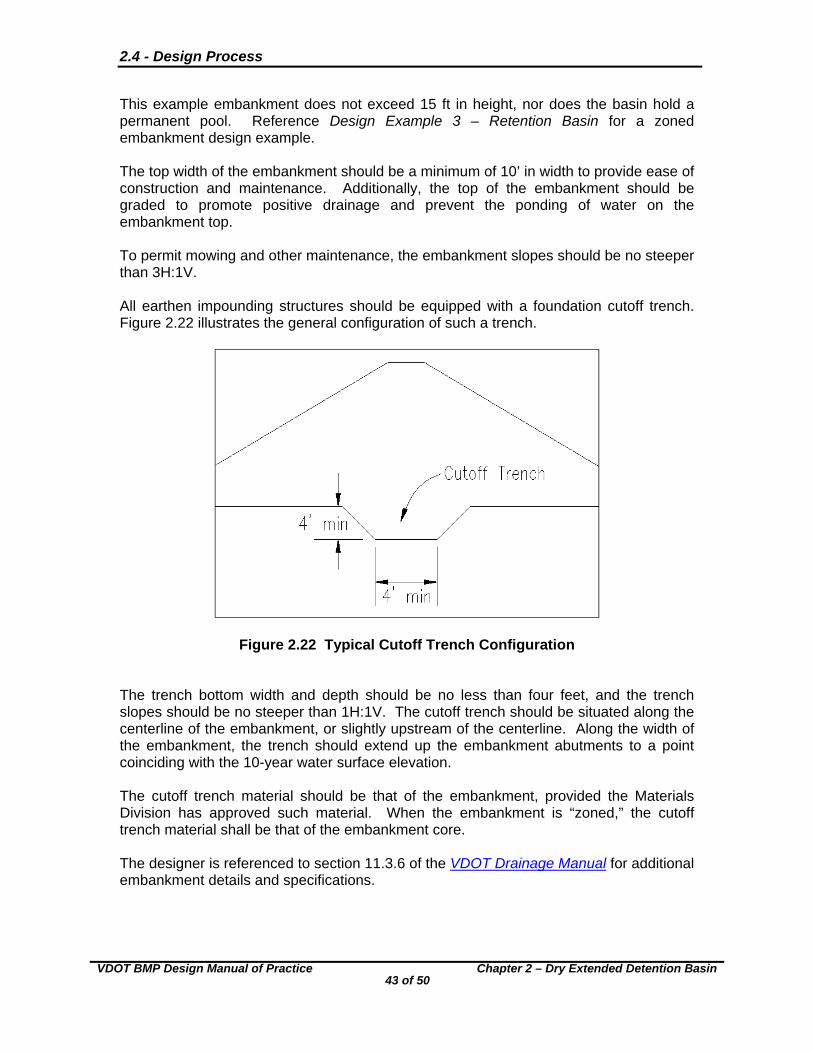
2.4 - Design Process
VDOT BMP Design Manual of Practice 43 of 50
Chapter 2 – Dry Extended Detention Basin
This example embankment does not exceed 15 ft in height, nor does the basin hold a permanent pool. Reference Design Example 3 – Retention Basin for a zoned embankment design example. The top width of the embankment should be a minimum of 10’ in width to provide ease of construction and maintenance. Additionally, the top of the embankment should be graded to promote positive drainage and prevent the ponding of water on the embankment top. To permit mowing and other maintenance, the embankment slopes should be no steeper than 3H:1V. All earthen impounding structures should be equipped with a foundation cutoff trench. Figure 2.22 illustrates the general configuration of such a trench.
Figure 2.22 Typical Cutoff Trench Configuration The trench bottom width and depth should be no less than four feet, and the trench slopes should be no steeper than 1H:1V. The cutoff trench should be situated along the centerline of the embankment, or slightly upstream of the centerline. Along the width of the embankment, the trench should extend up the embankment abutments to a point coinciding with the 10-year water surface elevation. The cutoff trench material should be that of the embankment, provided the Materials Division has approved such material. When the embankment is “zoned,” the cutoff trench material shall be that of the embankment core. The designer is referenced to section 11.3.6 of the VDOT Drainage Manual for additional embankment details and specifications.
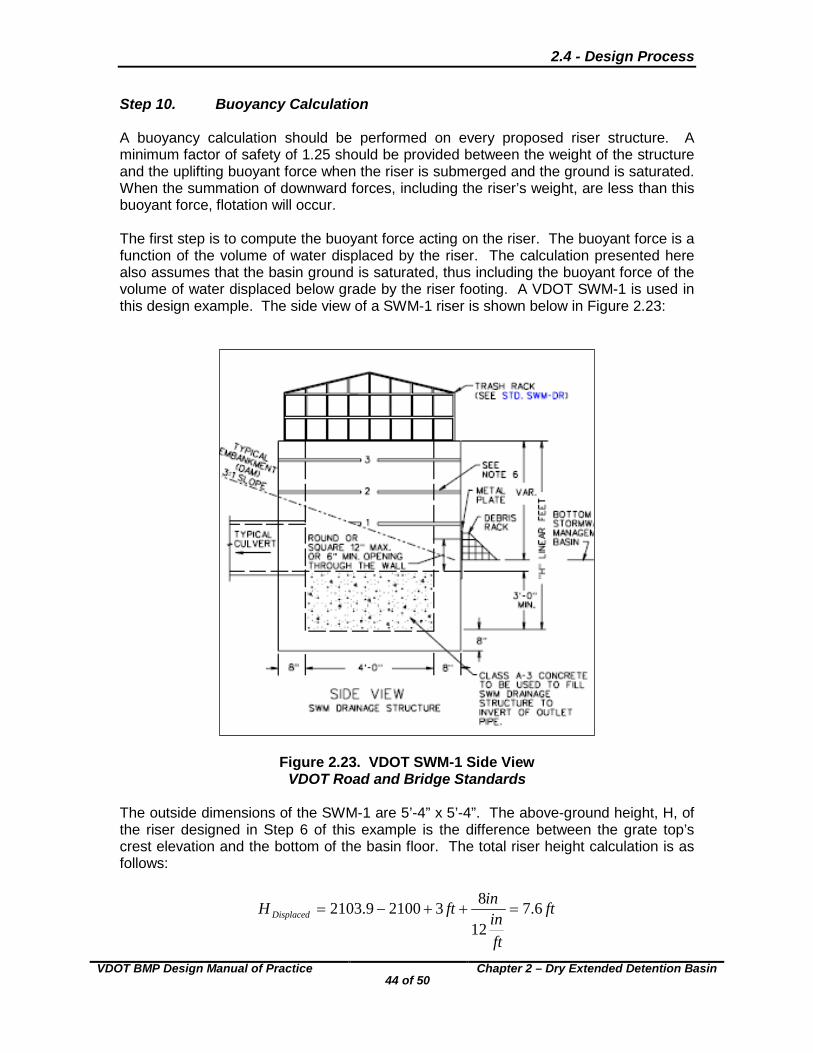
2.4 - Design Process
VDOT BMP Design Manual of Practice
44 of 50
Chapter 2 – Dry Extended Detention Basin
Step 10. Buoyancy Calculation A buoyancy calculation should be performed on every proposed riser structure. A minimum factor of safety of 1.25 should be provided between the weight of the structure and the uplifting buoyant force when the riser is submerged and the ground is saturated. When the summation of downward forces, including the riser’s weight, are less than this buoyant force, flotation will occur. The first step is to compute the buoyant force acting on the riser. The buoyant force is a function of the volume of water displaced by the riser. The calculation presented here also assumes that the basin ground is saturated, thus including the buoyant force of the volume of water displaced below grade by the riser footing. A VDOT SWM-1 is used in this design example. The side view of a SWM-1 riser is shown below in Figure 2.23:
Figure 2.23. VDOT SWM-1 Side View VDOT Road and Bridge Standards
The outside dimensions of the SWM-1 are 5’-4” x 5’-4”. The above-ground height, H, of the riser designed in Step 6 of this example is the difference between the grate top’s crest elevation and the bottom of the basin floor. The total riser height calculation is as follows:
ft
ftin
inftH Displaced 6.712
8321009.2103 =++−=
2.4 - Design Process
VDOT BMP Design Manual of Practice
45 of 50
Chapter 2 – Dry Extended Detention Basin
Therefore, the volume of water displaced is computed as:
3
2
2.2166.712
45 ftft
ftininft =×
+
The unit weight of water is 62.4 lb/ft3, with the buoyant force computed as:
lbftlbftFBuoyant 491,134.622.216 3
3 =×=
Applying the 1.25 factor of safety:
lblb 864,16491,1325.1 =× The sum of all downward forces acting upon the riser must be greater than 16,864 lb. First, consider the weight of the riser walls. The SWM-1 has reinforced concrete walls that are 8 inches thick. The “plan-view” area of the walls is computed as:
( ) 22
2
4.12412
45 ftft
ftin
inftAWall =−
+=
The height of the riser walls was computed previously as 7.6 ft. The volume of concrete represented in the walls of the riser is computed as:
32 2.946.74.12 ftftftVWalls =×= The unit weight of reinforced concrete is 150 lb/ft3, with the weight of the riser walls computed as:
lbftlbftFWalls 130,141502.94 3
3 =×=
We must subtract the weight of concrete lost to the 18 inch diameter 2-year control outlet:
2.4 - Design Process
VDOT BMP Design Manual of Practice 46 of 50
Chapter 2 – Dry Extended Detention Basin
lbft
lb
ft
ininft
FOrifice 17715012
8
2
5.13
2
The weight of the riser bottom (which excludes the wall sections already considered) is computed as follows:
lbft
lb
ft
inin
ftFBottom 600,115012
84
3
2
The weight of the metal “bird cage” trash rack, per Figure 2.13 is 120 lbs. The unit weight of riprap is 165 lb/ft3, with the weight of riprap computed as:
lbft
lbftftFRiprap 980,116543
3
The downward force of the riser weight is computed as:
)864,16(25.1653,17980,1120600,1177130,14 lb Flblblblblblb
FFFFF
Buoyant
RiprapTopBottomOrificeWalls
Step 11. Design of Sediment Forebays A sediment forebay must be provided at any point in the basin that receives concentrated discharge from a pipe, open channel, or other means of stormwater conveyance. The inclusion of a sediment forebay in these locations assists maintenance efforts by isolating the bulk of sediment deposition in well-defined, easily accessible locations. In addition to serving a vital maintenance function, sediment forebays are an integral component of the BMPs water quality improvement performance. The phosphorus removal percentages expressed in the BMP Selection Table for VDOT Projects consider that a sediment forebay is provided at all basin inflow points. The volume of storage provided at each forebay should range between 0.1 and 0.25” of runoff over the outfall’s contributing impervious area, with the sum of all forebay volumes not less than 10% of the total extended detention volume. The storage volume in the sediment forebay is provided by separating the forebay from the rest of the basin. This separation is accomplished by means of an earthen berm, gabion baskets, concrete, or riprap. In a dry facility, the forebay outlet crest should be set at the elevation corresponding to the basin’s water quality extended detention pool.
2.4 - Design Process
VDOT BMP Design Manual of Practice 47 of 50
Chapter 2 – Dry Extended Detention Basin
Depending on the type of material employed to construct the forebay embankment, the flows captured in the forebay may be detained over very long periods, with losses occurring only by means of infiltration and evaporation. Because the volume may be inundated at the onset of a runoff producing event, in a dry extended detention basin the forebay volume should not be considered part of the extended detention water quality volume. The forebay outlet crest should be stabilized and capable of conveying the 10-year inflow event into the basin in a non-erosive manner. The example project site is comprised of a post-development runoff area of 17.4 acres, with 4.75 acres of impervious cover. For the example forebay design, we consider two entrance points into the basin, each exhibiting the following characteristics:
Entrance Point 1
Acreage Impervious Acreage Peak 10-Year Inflow
(cfs) 6.96 2.25 16
Entrance Point 2
Acreage Impervious Acreage Peak 10-Year Inflow
(cfs) 10.44 2.5 21
Table 2.10. Summary of Pond Inflow Points
First, the forebays will be sized to provide storage of 0.1” of runoff from the impervious area contributing runoff to each entrance point:
32
1 81712
1.0560,4325.2 ft
ft
inin
ac
ftacV
32
2 90812
1.0560,435.2 ft
ft
inin
ac
ftacV
The sum of the forebay storage volumes:
333 725,1908817 ftftft The project site water quality volume is 0.20 acre-feet. The sum of all forebay volumes must be at least ten percent of this volume, computed as follows:
332
725,1862560,43
20.010.0 ftVftac
ftftac Forebay
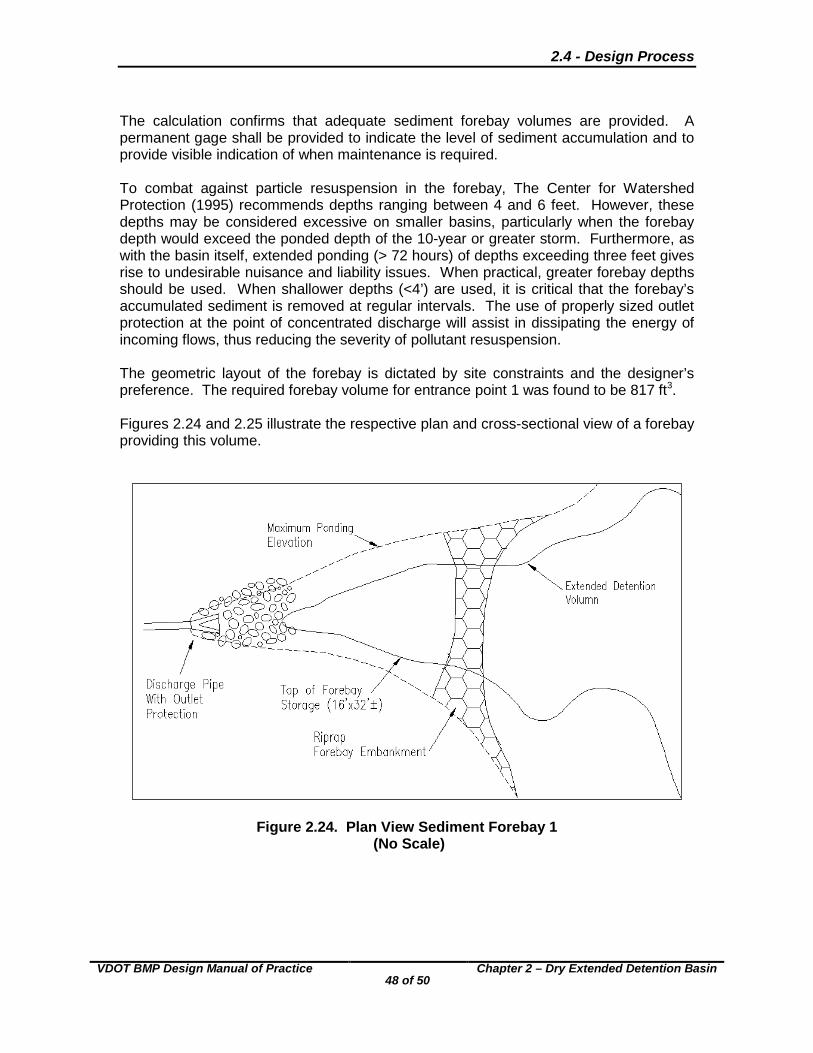
2.4 - Design Process
VDOT BMP Design Manual of Practice
48 of 50
Chapter 2 – Dry Extended Detention Basin
The calculation confirms that adequate sediment forebay volumes are provided. A permanent gage shall be provided to indicate the level of sediment accumulation and to provide visible indication of when maintenance is required. To combat against particle resuspension in the forebay, The Center for Watershed Protection (1995) recommends depths ranging between 4 and 6 feet. However, these depths may be considered excessive on smaller basins, particularly when the forebay depth would exceed the ponded depth of the 10-year or greater storm. Furthermore, as with the basin itself, extended ponding (> 72 hours) of depths exceeding three feet gives rise to undesirable nuisance and liability issues. When practical, greater forebay depths should be used. When shallower depths (<4’) are used, it is critical that the forebay’s accumulated sediment is removed at regular intervals. The use of properly sized outlet protection at the point of concentrated discharge will assist in dissipating the energy of incoming flows, thus reducing the severity of pollutant resuspension. The geometric layout of the forebay is dictated by site constraints and the designer’s preference. The required forebay volume for entrance point 1 was found to be 817 ft3. Figures 2.24 and 2.25 illustrate the respective plan and cross-sectional view of a forebay providing this volume.
Figure 2.24. Plan View Sediment Forebay 1 (No Scale)
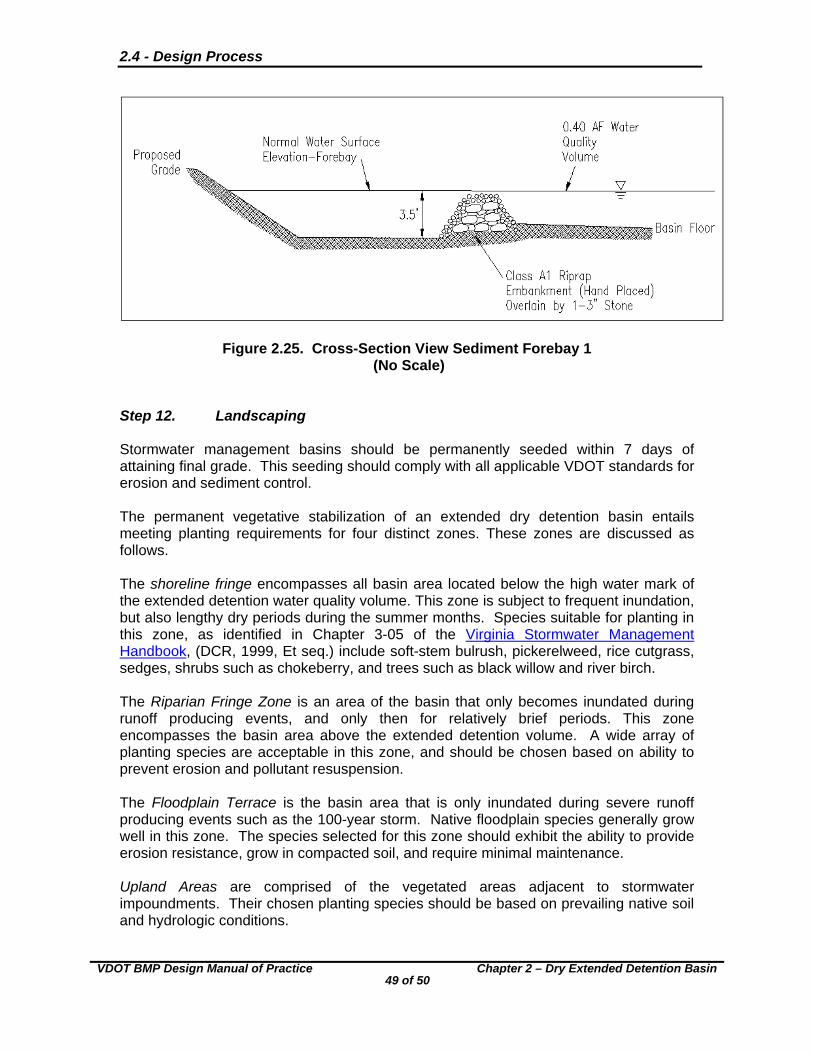
2.4 - Design Process
VDOT BMP Design Manual of Practice 49 of 50
Chapter 2 – Dry Extended Detention Basin
Figure 2.25. Cross-Section View Sediment Forebay 1 (No Scale)
Step 12. Landscaping Stormwater management basins should be permanently seeded within 7 days of attaining final grade. This seeding should comply with all applicable VDOT standards for erosion and sediment control. The permanent vegetative stabilization of an extended dry detention basin entails meeting planting requirements for four distinct zones. These zones are discussed as follows. The shoreline fringe encompasses all basin area located below the high water mark of the extended detention water quality volume. This zone is subject to frequent inundation, but also lengthy dry periods during the summer months. Species suitable for planting in this zone, as identified in Chapter 3-05 of the Virginia Stormwater Management Handbook, (DCR, 1999, Et seq.) include soft-stem bulrush, pickerelweed, rice cutgrass, sedges, shrubs such as chokeberry, and trees such as black willow and river birch. The Riparian Fringe Zone is an area of the basin that only becomes inundated during runoff producing events, and only then for relatively brief periods. This zone encompasses the basin area above the extended detention volume. A wide array of planting species are acceptable in this zone, and should be chosen based on ability to prevent erosion and pollutant resuspension. The Floodplain Terrace is the basin area that is only inundated during severe runoff producing events such as the 100-year storm. Native floodplain species generally grow well in this zone. The species selected for this zone should exhibit the ability to provide erosion resistance, grow in compacted soil, and require minimal maintenance. Upland Areas are comprised of the vegetated areas adjacent to stormwater impoundments. Their chosen planting species should be based on prevailing native soil and hydrologic conditions.
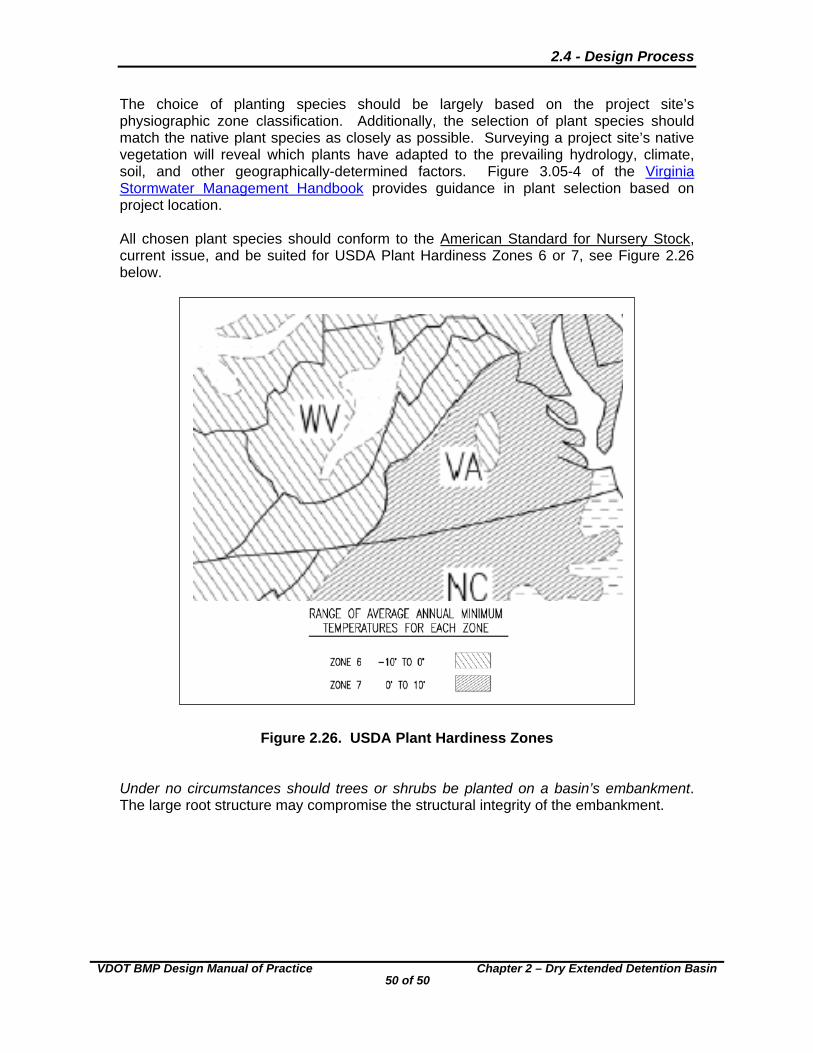
2.4 - Design Process
VDOT BMP Design Manual of Practice 50 of 50
Chapter 2 – Dry Extended Detention Basin
The choice of planting species should be largely based on the project site’s physiographic zone classification. Additionally, the selection of plant species should match the native plant species as closely as possible. Surveying a project site’s native vegetation will reveal which plants have adapted to the prevailing hydrology, climate, soil, and other geographically-determined factors. Figure 3.05-4 of the Virginia Stormwater Management Handbook provides guidance in plant selection based on project location. All chosen plant species should conform to the American Standard for Nursery Stock, current issue, and be suited for USDA Plant Hardiness Zones 6 or 7, see Figure 2.26 below.
Figure 2.26. USDA Plant Hardiness Zones
Under no circumstances should trees or shrubs be planted on a basin’s embankment. The large root structure may compromise the structural integrity of the embankment.