Embed Size (px)
Citation preview
2-1
CHAPTER 2ECONOMIC TRENDSThe prosperity of Fort Worth is linked to domestic and international changes. During the 1970s and 1980s, the local economy was driven primarily by a large and successful aerospace and defense industry. Substantial cutbacks in defense contracts prompted the City to begin working towards diversifying its economy in the 1990s, largely through small business development. The result is an economy that is diversified in many industry sectors such as services, trade, manufacturing, transportation, communication, and construction. This diverse employment base helped Fort Worth weather the 2008 Great Recession and will contribute to Fort Worth’s ability to rebound from economic declines due to the 2020 Coronavirus (COVID-19) pandemic. Fort Worth’s robust economic growth is expected to continue.

2-2
`
COMPREHENSIVE PLAN | ECONOMIC TRENDS
Source: The Perryman Group, Fort Worth-Arlington-Grapevine, MD, 2020.
TOTAL EMPLOYMENT, 2001 – 2045
Source: Texas Workforce Commission, 2020.
UNEMPLOYMENT RATE, 2019
FORT WORTHFORT WORTH3.4%3.4%
DALLAS/FORT WORTHDALLAS/FORT WORTH3.3%3.3%
TEXASTEXAS3.5%3.5%
UNITED STATESUNITED STATES3.7%3.7%
Sources: The Perryman Group, Fort Worth-Arlington-Grapevine MD, 2020; HUD, Income Limits, 2020.
3.4% 2,301,398 $81,500PROJECTED TOTAL
EMPLOYMENT BY 2045MEDIAN FAMILY INCOME,
2020UNEMPLOYMENT RATE,
2019
1.4 Million
2020
TOP 3 EMPLOYMENT SECTORS, 2019
SERVICE 22.4%
MANUFACTURING 17.5%
TRADE 15.6%
QUICK FACTS
2-3
`
COMPREHENSIVE PLAN | ECONOMIC TRENDS
ECONOMIC INDICATOR 2020 LEVEL 2025 LEVEL FIVE YEAR
INCREASEANNUAL
GROWTH
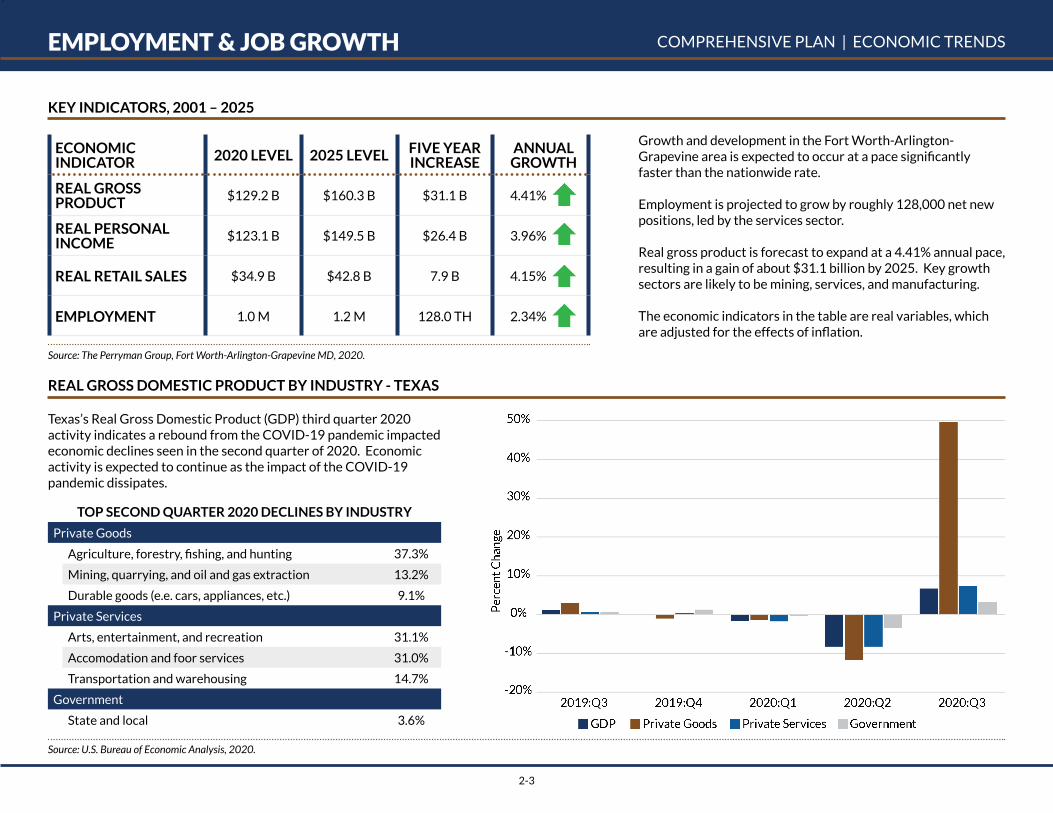
REAL GROSS PRODUCT $129.2 B $160.3 B $31.1 B 4.41%
REAL PERSONAL INCOME $123.1 B $149.5 B $26.4 B 3.96%
REAL RETAIL SALES $34.9 B $42.8 B 7.9 B 4.15%
EMPLOYMENT 1.0 M 1.2 M 128.0 TH 2.34%
KEY INDICATORS, 2001 – 2025
Growth and development in the Fort Worth-Arlington-Grapevine area is expected to occur at a pace significantly faster than the nationwide rate.
Employment is projected to grow by roughly 128,000 net new positions, led by the services sector.
Real gross product is forecast to expand at a 4.41% annual pace, resulting in a gain of about $31.1 billion by 2025. Key growth sectors are likely to be mining, services, and manufacturing.
The economic indicators in the table are real variables, which are adjusted for the effects of inflation.
Source: The Perryman Group, Fort Worth-Arlington-Grapevine MD, 2020.
Texas’s Real Gross Domestic Product (GDP) third quarter 2020 activity indicates a rebound from the COVID-19 pandemic impacted economic declines seen in the second quarter of 2020. Economic activity is expected to continue as the impact of the COVID-19 pandemic dissipates.
REAL GROSS DOMESTIC PRODUCT BY INDUSTRY - TEXAS
Source: U.S. Bureau of Economic Analysis, 2020.
TOP SECOND QUARTER 2020 DECLINES BY INDUSTRY
Private Goods
Agriculture, forestry, fishing, and hunting 37.3%
Mining, quarrying, and oil and gas extraction 13.2%
Durable goods (e.e. cars, appliances, etc.) 9.1%
Private Services
Arts, entertainment, and recreation 31.1%
Accomodation and foor services 31.0%
Transportation and warehousing 14.7%
Government
State and local 3.6%
EMPLOYMENT & JOB GROWTH
2-4
`
COMPREHENSIVE PLAN | ECONOMIC TRENDS
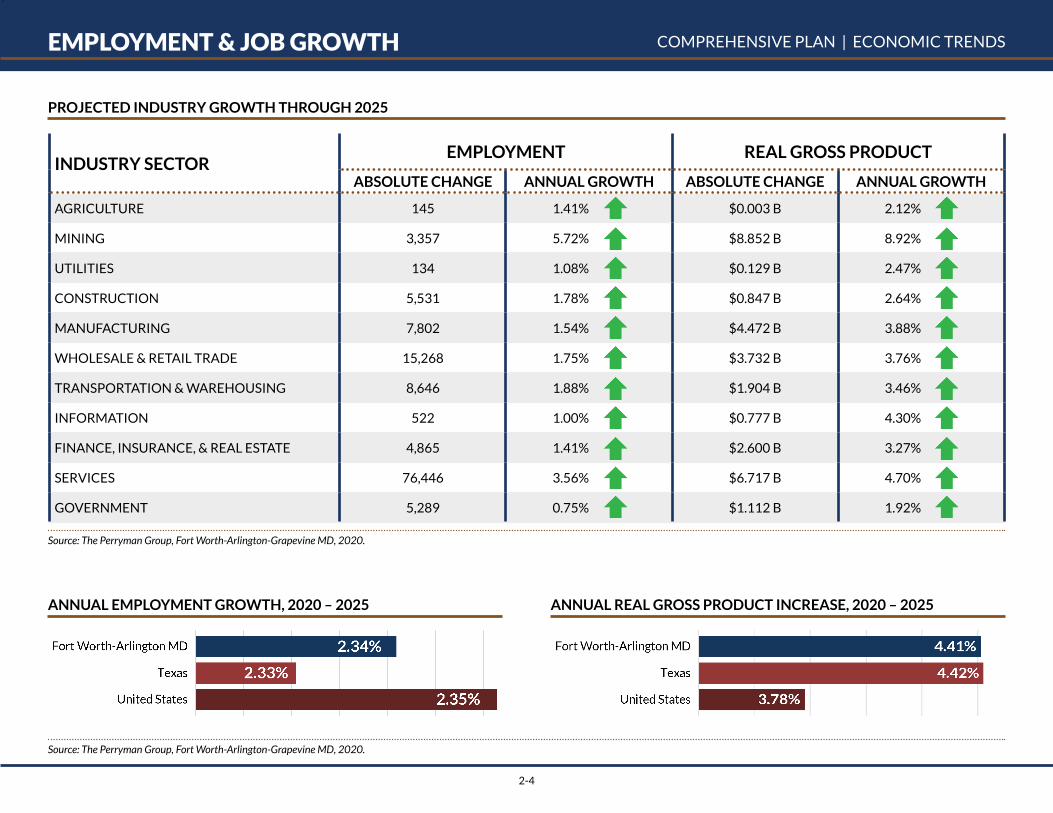
ANNUAL EMPLOYMENT GROWTH, 2020 – 2025 ANNUAL REAL GROSS PRODUCT INCREASE, 2020 – 2025
PROJECTED INDUSTRY GROWTH THROUGH 2025
INDUSTRY SECTOREMPLOYMENT REAL GROSS PRODUCT
ABSOLUTE CHANGE ANNUAL GROWTH ABSOLUTE CHANGE ANNUAL GROWTH
AGRICULTURE 145 1.41% $0.003 B 2.12%
MINING 3,357 5.72% $8.852 B 8.92%
UTILITIES 134 1.08% $0.129 B 2.47%
CONSTRUCTION 5,531 1.78% $0.847 B 2.64%
MANUFACTURING 7,802 1.54% $4.472 B 3.88%
WHOLESALE & RETAIL TRADE 15,268 1.75% $3.732 B 3.76%
TRANSPORTATION & WAREHOUSING 8,646 1.88% $1.904 B 3.46%
INFORMATION 522 1.00% $0.777 B 4.30%
FINANCE, INSURANCE, & REAL ESTATE 4,865 1.41% $2.600 B 3.27%
SERVICES 76,446 3.56% $6.717 B 4.70%
GOVERNMENT 5,289 0.75% $1.112 B 1.92%
Source: The Perryman Group, Fort Worth-Arlington-Grapevine MD, 2020.
Source: The Perryman Group, Fort Worth-Arlington-Grapevine MD, 2020.
EMPLOYMENT & JOB GROWTH

2-5
`
COMPREHENSIVE PLAN | ECONOMIC TRENDS
EMPLOYMENT BY SECTOR, 2020 PROJECTED EMPLOYMENT BY SECTOR, 2045
The Fort Worth-Arlington-Grapevine area continues to experience economic growth. The region’s manufacturing and transportation & logistics businesses form a solid basis for expansion over an extended time horizon. With a long-standing pattern of growth and a number of desirable attributes, the Fort Worth-Arlington-Grapevine area will remain an attractive destination for new business locations and expanded operations.
Source: The Perryman Group, Fort Worth-Arlington-Grapevine MD, 2020.
EMPLOYMENT & JOB GROWTH

2-6
`
COMPREHENSIVE PLAN | ECONOMIC TRENDS
Fort Worth’s building permit data indicate historic and current growth trends. Single-family residential development comprises the majority of the City’s building permit activity, which correlates to Fort Worth’s population growth. Commercial buildig permits have been relatively stable, with modest increases since 2016. Multifamily building permits have fluctuated over the past ten years, with 2016 showing the highest level activity over the last decade.
The value of all permits in 2020 totaled more than $4.3 billion, an increase of 3.6 percent from the 2019 value of $4.2 billion.
FORT WORTH BUILDING PERMITS, 2010 – 2020
Source: City of Fort Worth, Development Services Department, 2020.
Single-family residential development continues to increase in response to Fort Worth’s rising population growth.
GROWTH AND DEVELOPMENT FORT WORTH BUILDING PERMITS VALUE, 2020
Source: City of Fort Worth, Development Services Department, 2020.
GROWTH & DEVELOPMENT
Single-family infill housing in Central City. (Source: City of Fort Worth.)

2-7
`
COMPREHENSIVE PLAN | ECONOMIC TRENDS
MEDIAN FAMILY INCOME, 2000 – 2020
Median household incomes remain highest in the Downtown, Arlington Heights, TCU/Westcliff, Far North, Far Northwest, Far West, Far South, Far Southwest, and parts of the Eastside sectors.
Median family income for the Fort Worth-Arlington HUD Metro Fair Market Rent (FMR) Area increased from $57,400 to $81,500 between 2000 and 2020, an average annual increase of about 1.8% over the 20-year period.
Source: U.S. Census Bureau, American Community Survey 5-Year Estimates, 2015-2019. Source: HUD, Income Limits, Fort Worth-Arlington Metropolitan Fair Market Rent Area, 2020.
MEDIAN HOUSEHOLD INCOME
INCOME

2-8
`
COMPREHENSIVE PLAN | ECONOMIC TRENDS
RETAIL SALES PER PERSON, 2002 – 2019
In 2019, per capita retail sales in Fort Worth totaled $14,828 per person, a 0.22 percent increase from 2018, lower than the Fort Worth-Arlington-Grapevine MD retail sales of $16,625 and the Dallas-Plano-Irving MD, which had a per capita retail sales figure of $17,549.
Source: Texas Comptroller of Public Accounts and U.S. Census Bureau, 2019.
Source: The Perryman Group, Fort Worth-Arlington-Grapevine MD, 2020.
Between 2002 and 2019, the average growth rate of per capita retail sales in Fort Worth remained flat at less than one percent, an indication of stagnant wages.
INFLATION
The Consumer Price Index (CPI) is a measure of the average change over time in the prices paid by urban consumers for a market basket of consumer goods and services. The CPI measures inflation, the escalation of prices of consumer goods.
Source: U.S. Bureau of Labor Statistics, 2020, Texas Comptroller of Public Accounts, and U.S. Census Bureau, 2019.
RETAIL SALES
Per Capita Retail Sales Inflation AdjustedAverage Growth Rate: 0.6%

2-9
`
COMPREHENSIVE PLAN | ECONOMIC TRENDS
EMPLOYMENT CHANGE, 2015 – 2020
EMPLOYMENT CHANGE BY INDUSTRY, YEAR OVER YEAR 2019
EMPLOYMENT
Source: U.S. Bureau of Labor Statistics, 2020.
EMPLOYMENT DECLINE
% Area’s Workforce
# %
Dallas-Plano-Irving MD 72% 84,100 3.1%
Fort Worth-Arlington MD 28% 56,200 5.1%
EMPLOYMENT CHANGE
Since 2015, the employment figures for the Fort Worth-Arlington area generally trended above Texas and the United States. During this same time period, the year over year percent change ranged between 1.4 percent to 2.9 percent until 2020. Beginning in the first quarter of 2020, employment figures at all levels began trending downward, primarily due to the impact of the Coronavirus (COVID-19) pandemic. The employment decline was -4.9 percent for the Fort Worth-Arlington area and Texas. At the national level, the employment decline was -6.9 percent.
According to the U.S. Bureau of Labor Statistics (BLS), the total nonfarm employment in the Dallas-Fort Worth-Arlington Metropolitan Statistical Area (MSA) stood at 3,657,500 in August 2020, down 140,300 from one year earlier, representing a 3.7 percent decline compared to the national decline of 7.0 percent. This was the fifth consecutive month of decline according to the BLS data. Additionally, the Dallas-Fort Worth-Arlington MSA had the second-slowest rate of job loss among the 12 largest metropolitan areas in the country, as 10 of the 12 areas had greater percentage losses according to the BLS.
The Dallas-Fort Worth-Arlington MSA consists of two metropolitan divisions — separately identifiable employment centers within the larger metropolitan area. The employment declines since 2019 for the area’s metropolitan divisions (MD) are listed below.

2-10
`
COMPREHENSIVE PLAN | ECONOMIC TRENDS
UNEMPLOYMENT RATE Fort Worth’s unemployment rate experienced a spike from 2009 to 2010 due to the national recession, but rates began falling in 2011. The State of Texas and the City of Fort Worth experienced lower unemployment rates than the nation as a whole during the recession and subsequent economic recovery.
ANNUAL UNEMPLOYMENT RATE, 2008 – 2019
Source: Texas Workforce Commission, 2020.
UNEMPLOYMENT
Source: U.S. Census Bureau, American Community Survey 5-Year Estimates, 2015-2019.
2-11
`
COMPREHENSIVE PLAN | ECONOMIC TRENDS
The changing economy provides Fort Worth with several challenges and many opportunities. The national, state, and local economies emerged from the 2007-2008 recession and are expected to rebound from the COVID-19 pandemic. Fort Worth’s diverse economy and its close proximity to Alliance and D/FW airports and the Interstate 35 corridor have contributed to its past and current ability to rebound from economic challenges. In addition, the community’s pro-business stance has helped diversify the Fort Worth economy. In late 2017, Fort Worth completed its first economic development strategic plan, aimed at enhancing the city’s status in the region and nation over the next five years and beyond. The plan’s key findings are listed below.
• Fort Worth is the fastest growing among the 20 largest US cities.• Fort Worth has relatively low external visibility among large US cities,
but has unique assets available to raise the city’s profile.• The city has a vast reserve of land to drive growth, but residential uses
dominate the tax base.• The city’s jobs-housing balance is eroding.• Fort Worth residents are increasingly dependent on jobs in other cities.• Dallas-Fort Worth is a talent magnet, drawing new residents from across
the US.• Fort Worth has districts at different stages, which can drive economic
development.• Investment in the urban core (downtown & surrounding areas) benefits
the entire city.• Fort Worth has key occupational strengths:• General: transportation, installation, production• Specific: aerospace & geotechnical engineering
The policies and programs of the City must be continuously examined to ensure that they help mitigate the impacts of economic downturns, while promoting and enhancing Fort Worth’s economic strengths to position Fort Worth to compete successfully on the national and international stage for creative, high growth businesses and the talented individuals who fuel them.
CHALLENGES AND OPPORTUNITIES
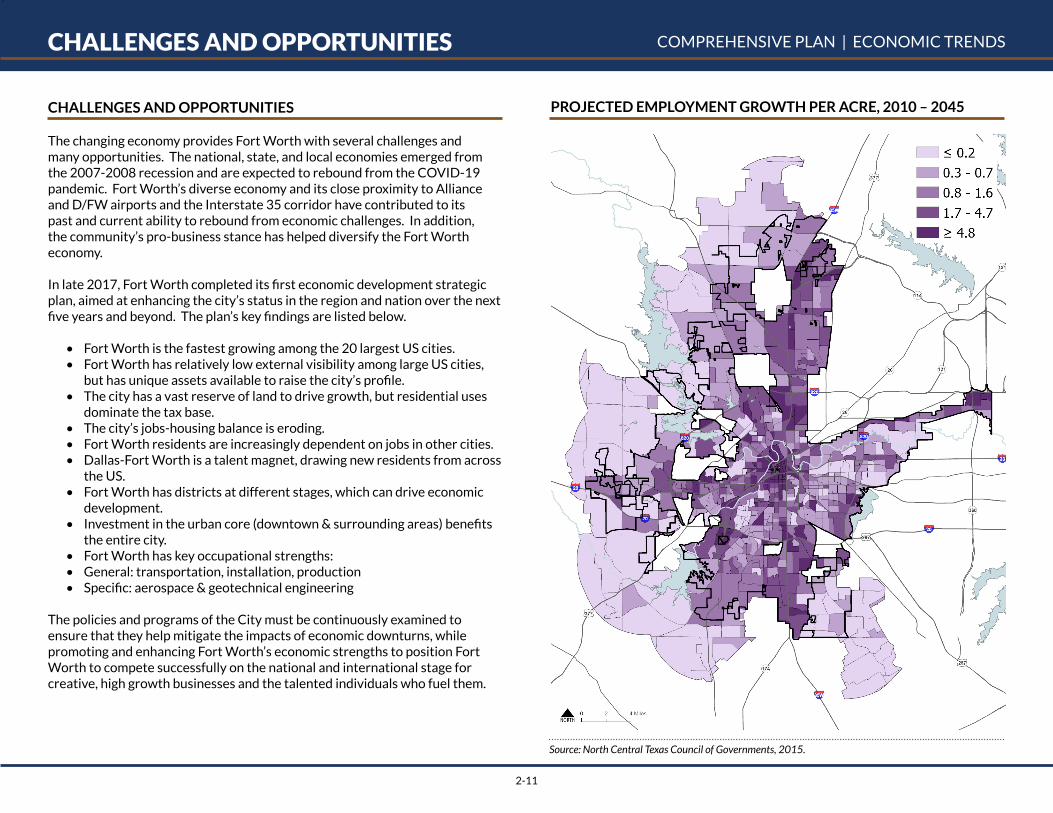
Source: North Central Texas Council of Governments, 2015.
PROJECTED EMPLOYMENT GROWTH PER ACRE, 2010 – 2045
CHALLENGES AND OPPORTUNITIES