Embed Size (px)
Citation preview
10
CHAPTER 2
ELECTRICITY DISTRIBUTION SYSTEM IN SRI LANAKA
2.1 Electricity distribution systems
Electricity generated at the generating stations is conveyed to the end consumers
through transmission and distribution networks. The part of the power system which
distributes electrical energy for local use is termed as the distribution system. It is
the electrical system between the grid substations fed by the transmission network
and the meters of the end consumers.
Depending on the nature of current, electricity distribution systems can be
categorized into AC and DC distribution systems. AC distribution systems are the
most common because; the alternating voltages can be easily changed in magnitude
by using transformers. Distribution systems can also be categorized into two based
on the type of constructions. Those are overhead and underground electricity
distribution systems. However, there are distribution systems where there are both
overhead and underground distribution.
AC distribution systems consist of two main parts; the primary distribution system
and the secondary distribution system. Primary distribution system operates at
voltages higher than the level of general utilization. The voltages used are generally
33 kV, 11 kV, 6.6 kV and 3.3kV. The primary distribution system handles large
amounts of electrical energy compared with the secondary distribution system.
Primary distribution is a 3-phase, 3-wire system due to economic considerations.
Secondary distribution is the part of the AC distribution which operates at voltages
at which the ultimate consumers utilize electrical energy. The voltages are 230 V or
110 V and those are 3-phase, 4-wire systems.
Modern distribution utilities have to operate their systems at stipulated voltage
levels, provide required power demands and maintain high levels of reliability.

11
Whilst doing that, they have to make every effort to minimize all forms of losses in
order to sustain their business in an era of energy crisis.
2.2 Electricity distribution in Sri Lanka
The electricity distribution in Sri Lanka is done by two organizations namely,
Ceylon Electricity Board and Lanka Electricity Company as described under the
section 1.1 in chapter 1. Primary distribution is done mainly at 33 kV level by CEB.
However, in certain areas there is distribution at 11 kV level as well. LECO has its
primary distribution totally at 11 kV level. The configurations of the secondary
distribution systems of both utilities are 400/ 230 V, 3-phase, 4-wire systems. The
transmission licensee of CEB feeds the distribution system of CEB itself at 33 kV
level. LECO is fed at 11 kV level through 33/11 kV primary substations.
In a perspective of distribution loss analysis, it important to look at the components
of the distribution system through which the electrical energy flow occurs. The
electricity distribution systems of the distribution licensees in Sri Lanka consist of
the following major components.
Medium voltage network (11 kV and 33 kV)
Primary substations (33/ 11kV)
Heavy supply consumers metered at 11 kV and 33kV
Distribution transformers supplying to heavy consumers
(11kV/ 400V or 33kV/400V)
Distribution transformers supplying to LV consumers
(11kV/ 400V and 33kV/400V)
Low voltage network
Low voltage consumers
12
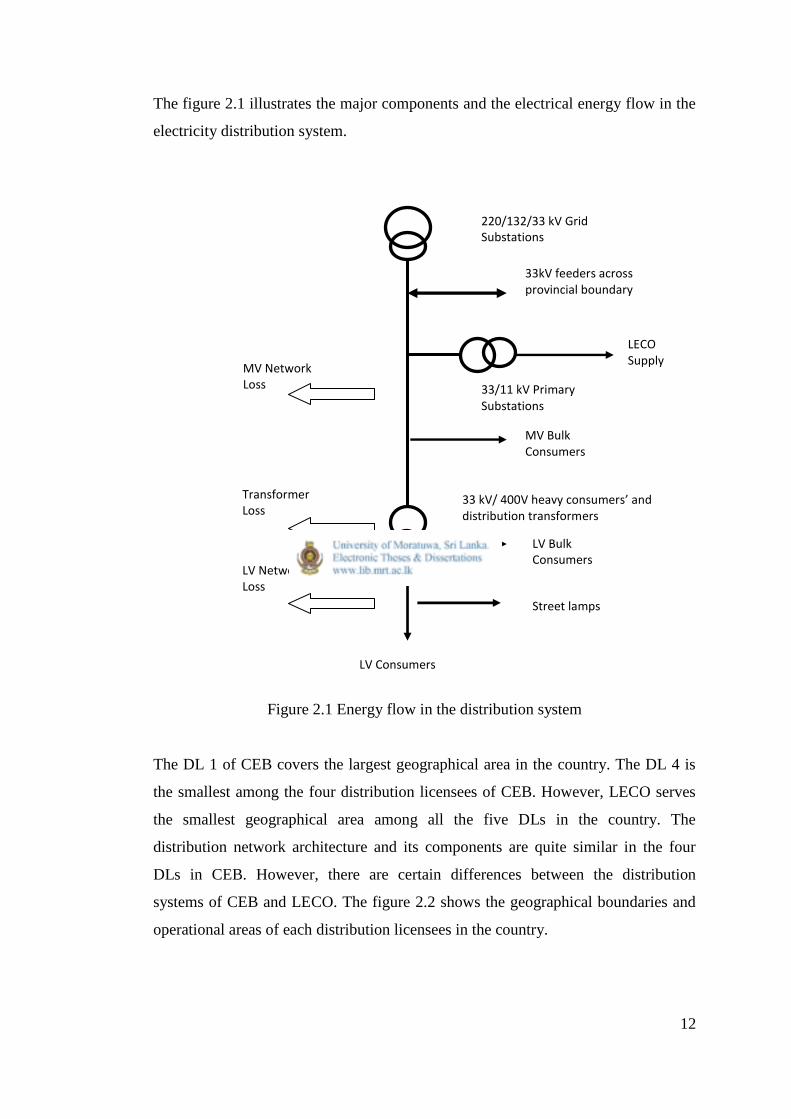
The figure 2.1 illustrates the major components and the electrical energy flow in the
electricity distribution system.
Figure 2.1 Energy flow in the distribution system
The DL 1 of CEB covers the largest geographical area in the country. The DL 4 is
the smallest among the four distribution licensees of CEB. However, LECO serves
the smallest geographical area among all the five DLs in the country. The
distribution network architecture and its components are quite similar in the four
DLs in CEB. However, there are certain differences between the distribution
systems of CEB and LECO. The figure 2.2 shows the geographical boundaries and
operational areas of each distribution licensees in the country.
MV Network Loss
Transformer Loss
LV Network Loss
33/11 kV Primary Substations
220/132/33 kV Grid Substations
33kV feeders across provincial boundary
LECO Supply
MV Bulk Consumers
LV Bulk Consumers
33 kV/ 400V heavy consumers’ and distribution transformers
LV Consumers
Street lamps

13
Figure 2.2 Geographical boundaries & operational areas of distribution licensees [7]
The mix of electricity consumers in the country across operational areas of DLs is an
important aspect in comparing the performance of DLs. The table 2.1 shows the
tariff wise consumer mix in each DL area by the end of the first half of 2012.
Table 2.1 Tariff wise consumer mix among DL areas [8]
DL Domestic Religious Industrial Hotel
General
Purpose Total Percentage
DL1 CEB 1,128,078 9,857 22,609 155 151,427 1,312,126 24.6
DL2 CEB 1,346,355 8,669 12,952 101 157,281 1,525,358 28.6
DL3 CEB 1,026,825 11,350 8,033 78 105,755 1,152,041 21.6
DL4 CEB 778,252 4,159 5,668 93 77,488 865,660 16.2
LECO 411,576 2,371 3,124 43 64,731 481,795 9.0
Total 4,691,086 36,356 52,386 470 556,682 5,336,980 100.0

14
The DL 2 of CEB has the highest number of electricity consumers among all the
DLs which is 28.6% of the total number of electricity consumers in Sri Lanka. The
electricity sales of DLs are also important in comparing the performance of the DLs
in the country. The electricity sales in GWh of each DL for the first half of 2012 are
shown in the table 2.2. DL 2 of CEB had the highest energy sales among all DLs
during the first half of 2012. It was 28.8% of the total electricity sales of all DLs[8].
Table 2.2 Tariff wise energy sales (GWh) mix among DLs [8]
DL Domestic Religious Industrial Hotel
General
Purpose Total Percentage
DL1 CEB 507 10.4 341 40.7 518 1,408 27.6
DL2 CEB 561 7.8 654 17.3 228 1,468 28.8
DL3 CEB 382 4.8 413 3.2 148 952 18.7
DL4 CEB 317 4.1 197 18.4 123 660 12.9
LECO 267 4.1 118 18.6 187 595 12.0
Total 2,034 31 1,723 98 1,205 5,092 100.0
The total energy loss in the electricity distribution system in the country during the
first half of 2012 was 476 GWh. It was 8.5% of total electrical energy input to the
distribution system in the entire country [8]. Distribution energy loss in each DL as a
percentage of energy purchased from the Transmission Licensee (TL) is shown in
the table 2.3 for the first half of 2012 and 2011.
Table 2.3 Energy loss in distribution system [6], [8]
DL Percentage energy loss
2012 first half 2011
DL1 CEB 6.7 7.5
DL2 CEB 9.6 9.0
DL3 CEB 8.2 17.0
DL4 CEB 5.6 10.8
LECO 4.5 6.3
15
The energy losses in DL 3 and DL 4 of CEB show noticeable drop in the first half of
2012 compared to 2011. However, the reasons for such variations were not readily
available.
2.3 Technical losses in distribution system
Technical losses are due to actions internal to the power system. Technical losses in
the system are inherently influenced by components and system designs. The current
flowing in an electrical network results in the following types of losses.
Copper loss or I2R loss due to resistance of conductors
Dielectric losses
Radiation and induction losses due to electromagnetic fields generated
surrounding the conductors
Therefore, technical losses are due to dissipation of power in various electrical
components of the system such as distribution lines, transformers and measurement
systems. A list of such components in the local distribution system where power
dissipation occurs is mentioned below.
MV distribution lines
Transformers supplying to low voltage heavy consumers
Distribution transformers
Low voltage distribution lines
Consumer service lines
Voltage regulators
Capacitors
Electrical burdens in metering equipment
All other electrical devices necessary for the operation of the distribution
system

16
The losses in the transformers are twofold: the fixed losses (core loss) and the
variable losses (copper loss). The losses in the power distribution lines including
service lines are due to conductor loss. In electro-mechanical type metering
equipment, power dissipation occurs in the voltage and current elements. In
modern solid state or electronic meters, losses are due to the power dissipation in
various solid state components in the meter boards.
Technical losses in different parts of the distribution system add up to the total
technical loss in the system. The losses present in each part need to be identified and
quantified in the study. It is widely understood that technical losses in a given
distribution system depends on how it is designed and operated. Some common
practices of utilities which may cause to increase losses are listed below.
Lack of attention to minimization of losses in planning and construction of
medium voltage distribution lines
Presence of over loaded distribution lines and associated delays in
augmentation or capacity enhancement of such lines
Availability of equipment with a lower level of energy efficiency, such as
distribution transformers
Loading of distribution and LV consumer transformers at much lesser level
than their rated capacities
Lengthy LV feeders contributing to high level of technical losses
The presence of single phase LV feeders
Unbalanced loading of 3 phase LV feeders
Poor electrical connections at various joints
Further, increased level of harmonics in a distribution system also increases losses.
Technical losses can be accurately computed provided that the load conditions in the
power system are known. Typically, load flow studies or network simulations are
used to calculate technical losses.

17
2.4 Non-technical losses (NTL)
2.4.1 Overview and Sri Lankan scenario
NTL are due to actions taking place external to the power system or the distribution
system. NTL are often unaccounted by utilities due to unavailability or lack of
information. Hence, it is extremely difficult to have an accurate estimation of NTL
in distribution systems. The general practice is to derive NTL after estimating
technical losses.
NTL represent an avoidable financial loss for the utility. It is the amount of energy
not billed but consumed. NTL also reflect a social issue. The consumers who are
accurately metered and billed are subsidizing those who do not pay for the
electricity consumed. In general, NTL in the electricity distribution is high in
countries where Gross Domestic Production (GDP) per capita is low. However,
there are exceptions such as Thailand and Indonesia who have achieved very low
levels of non-technical losses irrespective of lower GDP per capita. It can be mainly
attributed to the social tariffs provided for the poor at affordable prices in such
countries. NTL is reportedly very high in countries such as India, Bangladesh, Latin
American countries. Developed countries such as Australia, UK and South Korea
have very low levels of NTL, as low as 1% total generation. [9].
In the Sri Lankan context, even though there are no accurate estimates for non-
technical losses, it is believed that non-technical losses in CEB distribution network
is around 5% of energy input to distribution. However, this figure may vary
depending on the area of network. In the Northern and Eastern provinces, NTL is
apparently higher than in the other provinces owing to terrorist activities which
prevailed in those areas until recently. The different forms NTL and their causes are
discussed in detail with more emphasis on the experience in CEB’s distribution
system.

18
2.4.2 Electricity theft
Electricity theft can be defined as a conscious attempt by a person to eliminate or
reduce the amount of money that he or she will owe the utility for electrical energy
consumed. It is generally viewed as the major source of NTL by the electricity
utilities worldwide. Two main forms of electricity theft can be identified; namely,
directly connecting an unmetered load to a power line and tampering with the
electricity meter in order to reduce or stop recording the actual energy consumed.
Direct connections to power lines
Direct connections to power lines are much easier and safer in low voltage
electricity distribution systems. It is even easier when the lines are bare conductors.
However, the possibility of direct connections to high or medium voltage lines
cannot be completely ignored. These illegal connections are done by hooking up
wires to bare conductors. Cases have been reported where wires were hooked up
permanently to line conductors. However, the common form is temporarily hooked
up connections which are kept connected intermittently. The illegal direct
connections are mostly detected in rural and shanty areas. Non-frequent inspections
on the part of utility has arisen avenues for direct connections in rural areas.
However, the scenario is apparently different in urban shanty areas where the
general law and order is not properly implemented. Direct connections and other
means of pilferages are higher in those areas.
Unauthorized direct connections are done by hooking up wires to a phase conductor
and the neutral. Sometimes, it is done by just hooking up a single wire to a phase
conductor and making the earth as the current returning path.
Tampering with meter and metering accessories
This is probably the most common form of electricity theft in Sri Lanka. Once the
security seals of the meters are broken, there is ample access to the inside of the
meter housing, and there are a number of ways and means to fix the meter to stop or
19
slow down recording. However, there are cases reported where meters have been
tampered even without breaking meter seals.
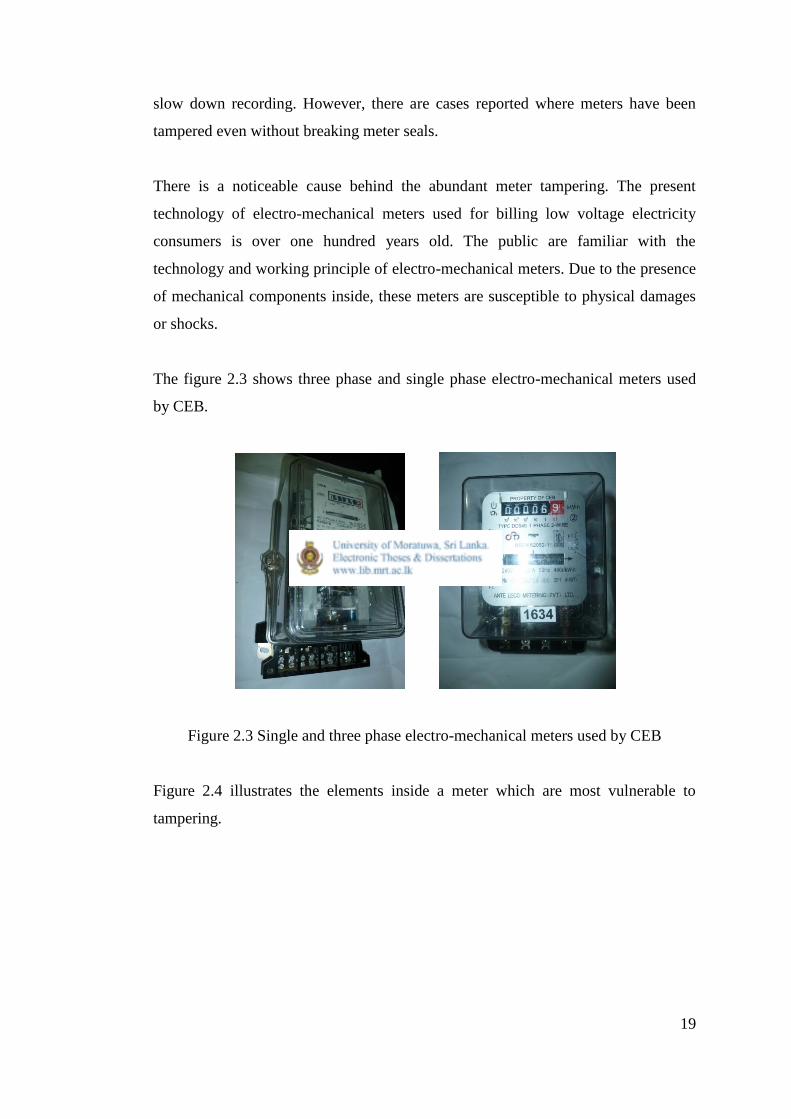
There is a noticeable cause behind the abundant meter tampering. The present
technology of electro-mechanical meters used for billing low voltage electricity
consumers is over one hundred years old. The public are familiar with the
technology and working principle of electro-mechanical meters. Due to the presence
of mechanical components inside, these meters are susceptible to physical damages
or shocks.
The figure 2.3 shows three phase and single phase electro-mechanical meters used
by CEB.
Figure 2.3 Single and three phase electro-mechanical meters used by CEB
Figure 2.4 illustrates the elements inside a meter which are most vulnerable to
tampering.

20
Figure 2.4 Parts of a single phase meter where tampering often occurs [10]
The common physical methods of tampering these electro-mechanical meters are
listed below.
Adjusting brake magnet to slow down disc rotation
Inserting various objects to slow down or stop rotation of disc
Stopping the register by inserting various objects
Miss-alignment of disc by shaking the meter
Changing the position of the meter from vertical axis of mounting
Additionally, there are ways of electrically manipulating with the meter to slow
down, stop or reverse its operation.
Interchanging meter input and output electrical connections
Removal of the link of the voltage coil such that voltage coil is not energized
(Only the current coil is energized)
Removing incoming neutral connections and using another neutral to
continue the supply path.
By-passing the meter
21
Listed below are a few methods of tampering with heavy consumer metering
systems where there are current transformer operated meters.
Short circuiting secondary side of current transformers
Reversal of current transformer polarities on the secondary side
Removal of voltage connections to the meters
Removal CT connections to the meters
2.4.3 Other forms of Non-Technical Losses
Whilst electricity theft is considered as the major form of NTL, the other forms of
NTL are,
Defective energy meters
Un-metered connections
Errors and delays in meter reading
Arranging false meter readings by bribing utility staff
Errors in billing
Assessed meter readings
Errors in estimation of technical losses
2.5 Economic impact of losses
Energy losses represent losses in revenues for utilities. To recover costs involved in
the supply of electricity and to fill the utility viability gap, costs of losses should be
covered by paying users or by Governments via targeted output-based subsidies.
Since one or more generators must produce this lost energy and since these
generators expect to be paid for all the energy they produce, a mechanism must be
devised to take losses and their cost into account in electricity markets. A fair
mechanism is one in which participants that contribute more to losses (e.g. remote
generators and consumers) pay a larger share than the others.
22
On the demand side, loss reduction and improvement on energy efficiency would
partially cover the expected demand rise offsetting the need to increase the installed
capacity. On the supply side, the impact on the utility to finance new generation
capacity can be delayed or avoided if reduction in demand can be achieved by
implementing good demand side management measures. The use of energy efficient
compact fluorescent lamps (CFL) in place of conventional incandescent lamps at
large scale for domestic and other lighting applications is a typical example of such
a demand side management measure. The estimation of losses at the levels of
generation, transmission and distribution is essential for vertically integrated utilities
where there is limited transparency into the overall system.
Even when access to the grid is available, customers in many developing countries
are plagued by unreliable power. Where system inefficiencies and theft create
significant losses, utilities are unable to cover their costs. The result is that the
utilities or companies struggle with solvency and are unable to provide high-quality
service to existing customers, let alone deliver new connections.
2.6 Reduction of distribution losses
The amount of energy loss in a distribution system is a key measure of the
performance of the distribution utility. In the present scenario of ever increasing
demand for energy while conventional sources of generation facing a gradual
depletion, reduction of losses in electrical power systems is vital. It benefits the
consumer, utility and country as a whole.
Since losses represent a considerable amount of operating cost, accurate estimation
of electrical losses enables the utility to determine with greater accuracy the
operating costs for maintaining supply to consumers. In order to implement loss
reduction measures effectively, it is essential to segregate the distribution losses with
sufficient accuracy. It is also critical to know if the expected target of technical
losses is indeed technical, whether it is possible for reduction without changing the
23
components and system design. Lower technical losses will provide for cheaper
electricity and lower production costs.
Increased revenue through reduction of NTL is real financial boost for any utility
since the investments involved in implementing NTL reduction programmes are
much less than implementing technical loss reduction programmes. Further, when
the consumers who consume electricity illegally have to pay for their actual
consumption, they will adjust their consumption to match their capacity to pay. This
reduces the energy demand, which will create the same effect as reducing technical
losses. Listed below are some measures to reduce distribution losses and increase
revenue for the utility.
Prevention of theft
The presence of a strong legal framework to punish culprits of electricity
theft is an important factor in arresting NTL. Increased and improved meter
inspection and testing programmes, full refurbishment of meter installations
to prevent unauthorized access (Proper sealing and seal management
systems)
Social contracts with communities for legal connections
Encourage communities to go for legal connections through awareness
programmes. Reduction of initial costs of obtaining electricity connections
and subsidizing for electricity for the poor
Management of payment risk
Special tariff schemes such as TOU tariffs
TOU tariffs can control peak time demands enabling the utility to avoid
costly generation at critical times
Improvement of commercial process
Arresting lapses in billing systems. Enabling web access for consumers to
check their electricity accounts.
Installation of advanced metering systems and pre-paid meters
Encourage consumers in energy saving by providing consumption related
information. Tamper detection and alarming. Operational benefits to utility
24
through remote meter reading, disconnections and re-connections etc. This is
discussed in detail in chapter 6.
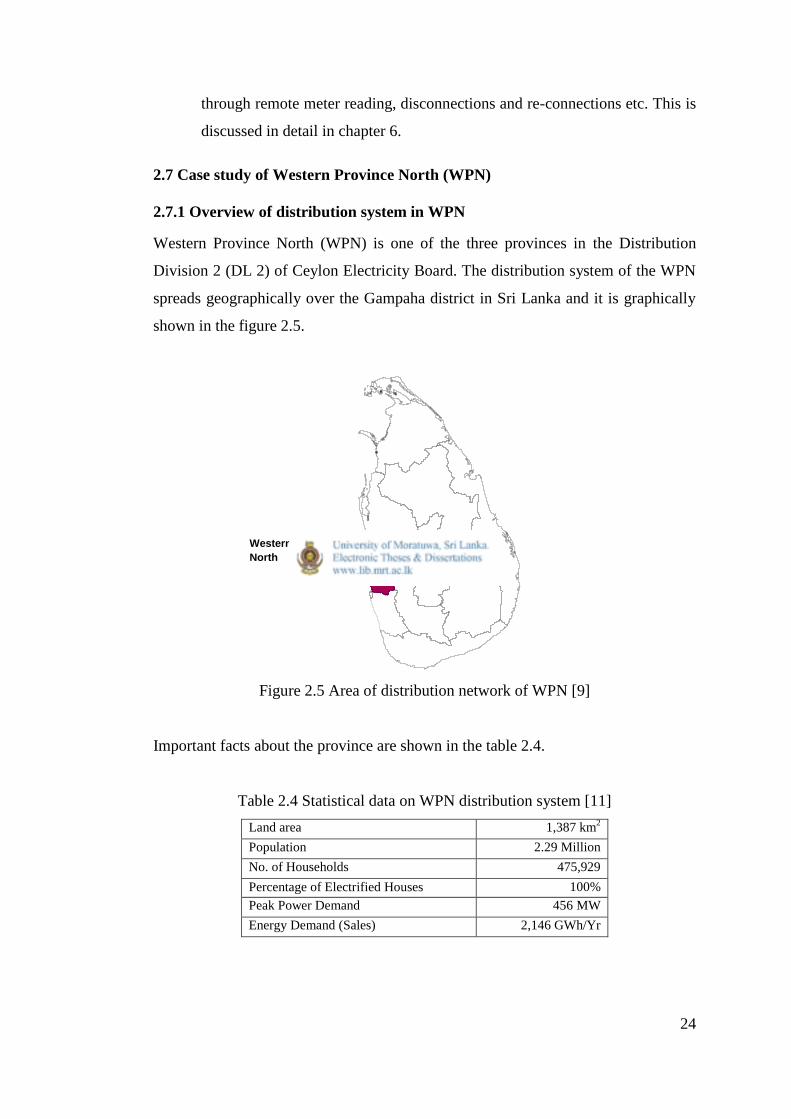
2.7 Case study of Western Province North (WPN)
2.7.1 Overview of distribution system in WPN
Western Province North (WPN) is one of the three provinces in the Distribution
Division 2 (DL 2) of Ceylon Electricity Board. The distribution system of the WPN
spreads geographically over the Gampaha district in Sri Lanka and it is graphically
shown in the figure 2.5.
Figure 2.5 Area of distribution network of WPN [9]
Important facts about the province are shown in the table 2.4.
Table 2.4 Statistical data on WPN distribution system [11]
Land area 1,387 km2
Population 2.29 Million
No. of Households 475,929
Percentage of Electrified Houses 100%
Peak Power Demand 456 MW
Energy Demand (Sales) 2,146 GWh/Yr
Western Province
North
25
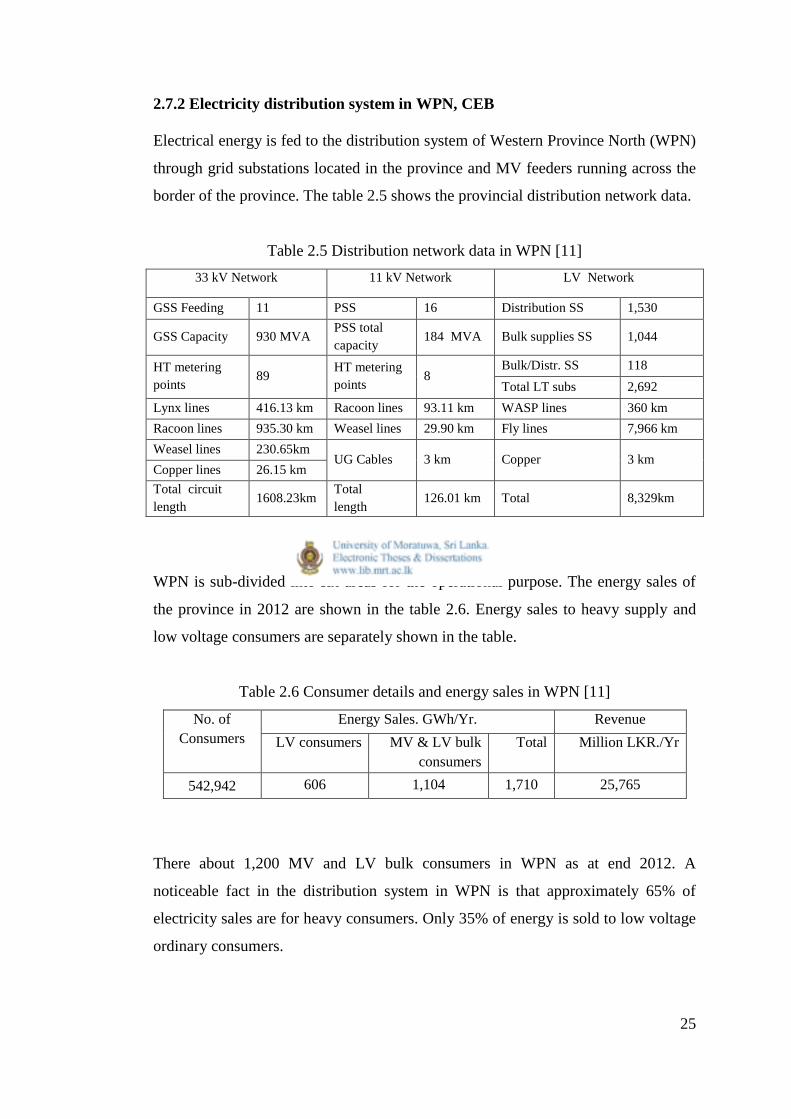
2.7.2 Electricity distribution system in WPN, CEB
Electrical energy is fed to the distribution system of Western Province North (WPN)
through grid substations located in the province and MV feeders running across the
border of the province. The table 2.5 shows the provincial distribution network data.
Table 2.5 Distribution network data in WPN [11]
33 kV Network 11 kV Network LV Network
GSS Feeding 11 PSS 16 Distribution SS 1,530
GSS Capacity 930 MVA PSS total
capacity 184 MVA Bulk supplies SS 1,044
HT metering
points 89
HT metering
points 8
Bulk/Distr. SS 118
Total LT subs 2,692
Lynx lines 416.13 km Racoon lines 93.11 km WASP lines 360 km
Racoon lines 935.30 km Weasel lines 29.90 km Fly lines 7,966 km
Weasel lines 230.65km UG Cables 3 km Copper 3 km
Copper lines 26.15 km
Total circuit
length 1608.23km
Total
length 126.01 km Total 8,329km
WPN is sub-divided into six areas for the operational purpose. The energy sales of
the province in 2012 are shown in the table 2.6. Energy sales to heavy supply and
low voltage consumers are separately shown in the table.
Table 2.6 Consumer details and energy sales in WPN [11]
No. of
Consumers
Energy Sales. GWh/Yr. Revenue
LV consumers MV & LV bulk
consumers
Total Million LKR./Yr
542,942 606 1,104 1,710 25,765
There about 1,200 MV and LV bulk consumers in WPN as at end 2012. A
noticeable fact in the distribution system in WPN is that approximately 65% of
electricity sales are for heavy consumers. Only 35% of energy is sold to low voltage
ordinary consumers.
26
2.7.3 Distribution losses in WPN
The electricity distribution losses in WPN as a percentage of energy input to the
system have been at 7.7%, 7.6% and 7.3% in 2010, 2011 and 2012 respectively
[11][12]. The electrical energy flow in the distribution system of WPN occurs as
stated below.
Energy loss in the medium voltage network and primary substation
transformers
Energy supplied to LECO
Energy supplied to heavy consumers with high voltage metering (HV bulk)
Energy loss in transformers of heavy consumers
Energy supplied to LV bulk consumers
Energy loss in distribution transformers
Energy loss in LV distribution network
Energy consumed by street lamps
Energy supplied to low voltage consumers
Therefore, energy losses occur in four areas; medium voltage network, heavy
consumer transformers, distribution transformers and LV network. The segregation
of these losses in the distribution system of WPN is discussed in chapter 4. Table 2.7
presents results of meter testing programme carried out in the province during the
period from 2010 to 2012.

27
Table 2.7 Results of meter testing in WPN
Number
of meters
Percentage of
meters tested
Tested 53,818 100.0
Accuracy acceptable 48,300 89.7
Accuracy not acceptable (Defective) 3,914 7.3
Physical adjustments done 826 1.5
By-passed 76 0.1
Meters damaged 629 1.2
Direct connections before meter 73 0.1
Total cases for NTL 5,518 10.3
The presence of defective meters is quite significant. More than 10% of the meters
tested contributed to NTL. It provides a clear view of the situation at the ground
level.