Embed Size (px)
Citation preview
22
CHAPTER 2
EVOLUTION OF KERALA'S BANKING SECTOR:
A HISTORICAL REVIEW
In this chapter, we attempt to highlight the essential features of the historical
evolution of Kerala's banking sector from the early 20th century till the nationalisation of
the major commercial banks in 1969. The discussion is organised in two sections. Section
One begins with a brief sketch of the growth trends of indigenous non- banking financial
intermediaries, mainly chitties. This is followed by a description of the historical growth
trends of the commercial banking system and some of its important features. Finally, a brief
note on the historical evolution of the co-operative banking system is also made. Section
Two attempts to identify some of the important socio- economic factors that contributed to
the emergence of the commercial banking system during the period.
The recapturing of the historical aspects attempted here, given the paucity of the
required type of data and the existence of numerous gaps in the information available, is
done by piecing together the fragmented data on the State's financial sector available in
published materials. They include mainly Travancore Banking Enquiry Committee Report,
(Government of Travancore, hereafter GOT, 1930), Report of the Travancore -Cochin
Banking Inquiry Commission, (Government of India, hereafter GOI, 1956)., All India Rural
Credit Survey, (RBI-1954a), Banking and Monetray Statistics ofIndia, (RBI -1954b),
Statistical Tables Relating to Banks in India, (RBI- various years) and Travancore State
Manual by T K Velu Pillai, (1940). We had relied extensively on the pioneering work of
M.A Oommen (1976) namely the "Rise and Growth of Banking in Kerala".
Even though Kerala is more or less a homogeneous unit in the linguistic and ethnic
sense), it constituted three separate political entities till 1947: the Princely States of
Travancore and Cochin and the Malabar District of the erstwhile Madras Presidency of
British India2• After India became independent, as part of the all-India plan for abolishing
princely States, Travancore and Cochin were integrated in 1949 into a single State. Later in
LJ
1956, consequent on the reorganization of States on linguistic basis, Malabar was added on
to it. A few taluks at the south extreme part of the region were taken away from Travancore
Cochin to form the present State of Kerala3. Hence for any historical analysis of Kerala , it
is essential to study, the evolutionary processes in these three regions separately and with
equal importance. A caveat, however, needs to be added here. The sources of information
that is made use of in the discussion, particularly till the formation of the State, are
pertaining largely to Travancore-Cochin region and relatively less to Malabar. This is
mainly due to reasons of data availability. Hence our discussion on historical developments
till 1956 would mainly be set against the background of the Travancore- Cochin region.
Though administratively the Princely States were distinct entities, they were
economically integrated with the rest of the colonial India. The banking system evolved
separately in the region constituted an integral component of the all-India banking system.
After independence, the banking system got further integrated with the national banking
network and the national banking policies and programmes got reflected in the banking
development of the region. In short, the regional character of banking development, gave
way to national character increasingly.
Section 2.1
In the discussion on institutional innovations in the form of modem commercial
banks in India, the significance of institutional antecedents like usurious moneylenders and
indigenous bankers is well recognised. In fact, these institutions antedate, by many hundreds
of years the western type of banking institutions, which were introduced into India with the
second half of 18th century. They constituted the most important group of financial
intermediaries during the pre-independence period (Goldsmith, 1983, P.25). The emergence
of modem banks, to a considerable extent, is perceived to be a continuum of such
institutional legacies. Being so, we shall proceed with our discussion here with a glance at
such antecedents of banking institutions in the State.
2.1.1 MONEY LENDERS
Literature on Kerala's economic history pointedly refers to the fact that unlike in
some other parts of India, all the three units-Travancore, Cochin and Malabar- were devoid
of caste based professional moneylenders in early times. There was no indigenous
commercial caste, which specialized in usury, such as Chettiars and Banias operating in
24
other parts of the country. (Government of Travancore, hereafter GOT, 1930, p.l57 -158;
Prakash Karat, 1973, p.33) In the absence of such a class, the money lending operations in
the Travancore-Cochin region were carried out by a section of landlords and rich peasants4
(Nagam Aiyah, 1906). The Travancore Banking Enquiry Committee (hereafter TBEC)
which made one of the earliest attempts to furnish consolidated statistics regarding the
financial institutions prevalent in the State however found that there were 264 prominent
money lenders functioning in the region, during the late '20s of the last century (GOT,
1930, p.24)
Besides them, the hundi merchants from the neighbouring Tinnevelly district in the
Madras Presidency also engaged in money lending activities. during the period under
consideration (T. K Velu Pillai, 1940. p. 653). They started operations in the State from the
beginning of the 19th century and could be found in all-important trading centers in the State
in the late 19th as well as the early 20th century.
2.1.2 CHIT FUNDS5
The earliest and most popular fonns of money mobilizing and credit providing
enterprise in the State was chitti/kuri--a deposits- advance- lottery combine (GO I, 1956).
The chit funds in these regions arose before communication facilities were developed, when
the villages had to be largely self-supporting (GOI, 1930, vol. 1, para. 481). The antiquity of
these institutions had been referred to by Logan in his "Manual of the Malabar District" and
Sim Cox in his "Primitive Civilizations,,6.
The chit fund system, as it originated, was in the fonn of grain or 'Dhanya Chitti'. It
witnessed significant changes in its fonn, nature of foreman and pattern of subscribers over
the years. Along with increased monetization of the economy, money chits replaced grain
chits. Similarly, the earliest fonn of chit business was based on the system of lot, and this
gave way to auction7, as many members in a group were in need of money at the same time.
The occupation pattern of the clientele of the chitties shows that along with agriculturists,
other categories like traders, and salary earners also turned to the chitties in a big way in
course of time (Nayar CPS, 1973, p.5).
Another noteworthy development is that institutional foremen such as partnership
finns, private limited companies, co-operative societies and joint-stock banks emerged
which reduced the significance of individual foreman. With the advent of institutional

foreman, the chitty lost its local character and became a modem business requiring
entrepreneurial skill and financial acumen. Consequent on this and various other
developments, the chitty business spread by leaps and bounds in the first half of the last
century, particularly since the end of the First World War (ibid, p. 6-7).
25
As can be seen from table 2.1, a total number of 2982 chitties were registered in
Travancore during 1918-1922. The total capital of these chitties was estimated at Rs. 75
lakhs. At the end of 1928-29, there were 9931 live chitties involving a total capital of Rs.
236 lakhs in Travancore; the average number of chitties registered annually in the 1920s was
1300. Besides these registered chitties, there were innumerable small chitties with capital
below Rs. 100 that did not require registration. There were also chitties, which distributed
silver vessels, ornaments, furniture etc as prize in lieu of money (GOT, 1930, P. 160).
Table 2-1 Number of Chitties in Travancore, 1918-22 to 1935-36
Year No. of chitties No. of chitties working Total capital registered each year at the end of each year (Rs. in lakhs)
1918-22 2982 75
1922-23 913 11
1923-24 1037 14
1924-25 1048 15
1925-26 1291 24
1926-27 1445 37
1927-28 1656 45
1928-29 1625 9931 236
1929-30 1388 10735 247
1930-31 524 10289 258
1931-32 294 9254 262
1932-33 284 8418 265
1933-34 339 7667 146
1934-35 272 6944 125
1935-36 35 6228 86
Note: The total amount collected from the subscribers of the chit fund in one installment is the capital of the Chit fund. For years up to 1928-29, the total capital relates to number of Chitties registered annually only.
Source: 1. For years up to 1928-29: TBECR (1930), op. cit, pp 160
2. For years from 1929-30 to 1935-36, Velu Pillai (1940), pp 655
L{)
The chit business in the region witnessed a downswing in the number of
registrations and business turnover during the '30s (Velu Pillai, p. 640). The world
depression might have been one of the reasons. The falling trend of it continued till the early
'40s. Since 1942, the chitty business showed reviving tendency. The trend in Cochin
during the period also was more or less similar to that of Travancore. The decline during
more than one decade since the early '30s was partly due to general economic depression
that prevailed in the area during the period. The entry of other financial institutions in the
form of commercial and co-operative banks, insurance companies, etc., might have played a
role. By 1948-49, the number of registered chitties and kuries functioning in Travancore and
Cochin was estimated to be about 3000 (Nayar CPS, 1973, p 161).
During the more than one and a half decade between the formation of Kerala State
and the late '60s, the number of registration of chitties and kuries showed more or less a
steady increase. The yearly registration increased from 695 in 1957-58 to 1530 in 1968-69.
The number of working chitties rose from 3889 to 6062 during the corresponding years.
Similarly, the capital of working chitties, which was Rs. 171.3 lakhs at the end of 1957-58
rose to Rs. 788.2 lakhs at the end of 1968-69. The annual turnover of all working chitties in
1968-69 in Kerala was about Rs.94.6 crores (ibid p.161-165).
2.1.3 EMERGENCE OF COMMERCIAL BANKS
Having been organised on a small scale in the early days of their emergence, the
chitties and kuries found themselves incapable of meeting the large financial needs of the
community. As a result, in the normal process of social and economic growth, other forms
of financial agencies emerged in the region by the fag end of the 19th century. Some of the
chitties themselves assumed new institutional forms like joint-stock banks. This changeover
is brought out in a brief but telling reference made by the TCBEC, 1956. To quote, " Most
ofthe banks in Travancore-Cochin have grown out of the womb of chit and kuri funds that
have been operating in the State since ancient times. The subscription paid by the members
of these funds are analogous to the deposits that are kept with the banks and the prize
amounts distributed resemble the advances made by the commercial banking institutions.
From such an institution, the transition to a modern form of banking was an easy step as the
latter conferred certain advantages on the person, that is, the foreman who conducted the
business of chitty" (GOI, 1956, p.25). Not only that several banks developed out of chitties,
but also the chitties continued as important means of deposit mobilisation. This is evident

L.t
from the fact that as many as 166 banks were conducting kuries in Travancore-Cochin
during the thirties8• Along with chitties, some of the indigenous banks also assumed modem
institutional forms like joint-stock banks (ibid 1930, p.31)
2.1..3.1. Early Attempts
The Travancore Bank, started in Central Travancore by Eapen, a vakil (pleader) by
profession, of the Kandathil family, in 1893, is recorded to be the earliest organised
commercial bank established in Kerala. It was a partnership firm with a paid-up capital of
Rs. 15000. After about eight years of operation, this banking enterprise got liquidated in
1900 (Dommen, 1976, p.27). In the early 1890s itself, one T.e. Poonen started a bank in
Kottayam, but that too did not prosper (Jeffrey, 1976, p.201).
The Travancore region witnessed the setting up of two banks during the early years
of the 20th century: The Thayyil Bank, a partnership started by K. I. Cherian of the
Kandathil family and a joint-stock bank called Thiruvalla Bank started by M. Paulose of
Chalakuzhyil family9. The Thiruvalla Bank founded in 1900 was the first joint-stock bank
in Travancore and Cochin areas. Having operated successfully for more than a decade, it
was wound up (Jeffrey, p.201). These initial efforts in banking business were subsequently
emulated by other enterprising people. The growth momentum during these years, however,
was very slow. Thus when the new Companies Regulation of 1917 was passed, there were
only 5 banks in existence in Travancore, (GOI, 1930, p.31). Before the end of the decade,
10 more private joint-stock banks were registered in Travancore. In the Cochin State, the
first joint stock commercial bank was started only in 1914. But it too had five joint stock
commercial banks by 1917 on par with Travancore (Sunanda S, 1991).
2.1..3.2 Growth Since The First World War
The growth trend of the formation of new banking companies that was steady and
slow in the initial one and a half decades of the 20th century picked up momentum after the
First World War. As could be seen from Table 2.2, the number of joint-stock banks in
Travancore shot up from 5 in 1917-18 to 275 in 1932-33. The number of banks registered
in Cochin also increased substantially during the corresponding years; from 5 to 167.

Table 2-2 Number of Joint-Stock Banks Registered in Travancore and
Cochin,1917-18 to 1946-47
Number Year
Travancore Cochin
1917-18 5 5 1919-20 35 5 1924-25 36 1925-26 43 1927-28 120 1929-30 256 1930-31 257 1931-32 268 162 1932-33 275 167 1933-34 267 162 1934-35 252 1935-36 245 1936-37 241 155 1937-38 247 144 1938-39 221 122
1939-40 186 111
1941-42 138 90 1942-43 117 84 1943-44 114 84 1944-45 109 84 1946-47 108 82
Source:
1. Oommen, M.A (1976). Table 1, Page 26.
2. Travancore-Cochin Banking Inquiry Commission 1956, PP. 18-19.
Though there had been burgeoning in the number of banks during these years, a
particularly powerful increase in the number of banks could be seen between 1927 and
1930. Even though the forces of World Depression set in by 1930, the growth in the number
of banks still continued and reached the peak in 1932-33. In both the regions, this upward
trend, however, was followed by a decline in the number of banks since then. In the initial
years of this declining phase, the fall was less sharp. As noted by TCBIC, "Even though the
profitability of the existing banking concerns was adversely affected during the period of
World Depression, as that of the other economic activities, their earnings were not crucially
affected so as to result in their liquidation on a large scale" (GOI, 1956).
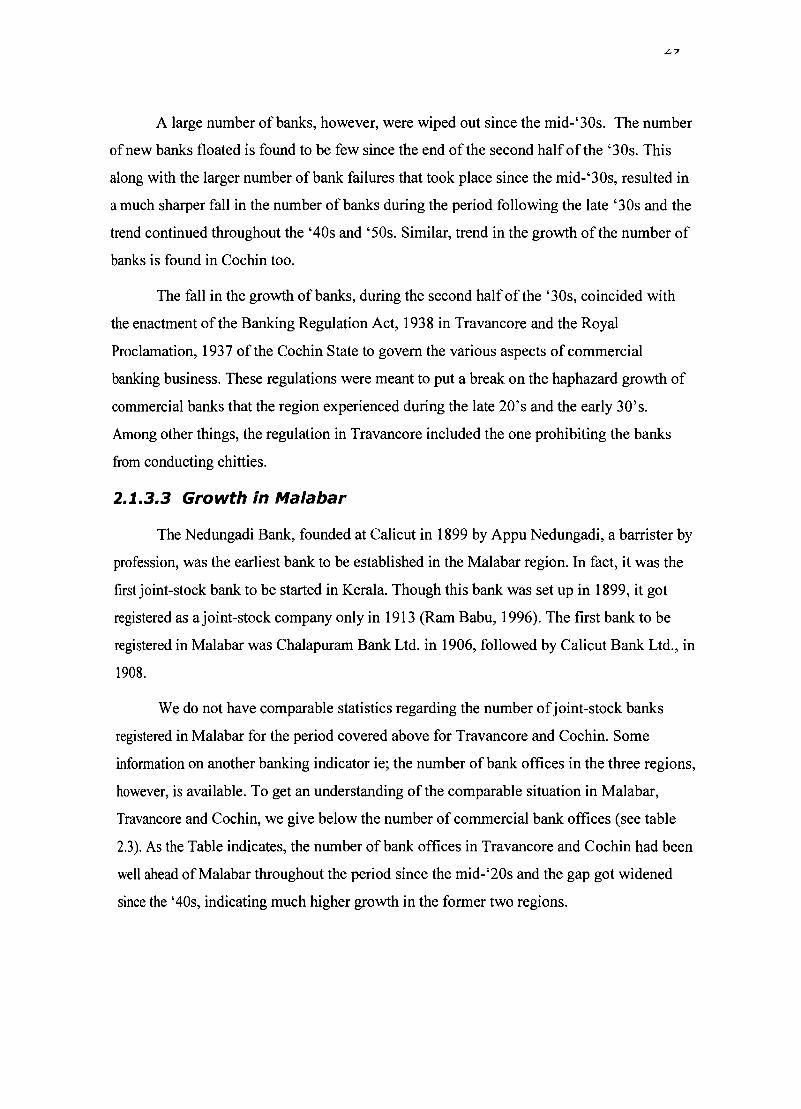
A large number of banks, however, were wiped out since the mid-' 30s. The number
of new banks floated is found to be few since the end of the second half of the '30s. This
along with the larger number of bank failures that took place since the mid-'30s, resulted in
a much sharper fall in the number of banks during the period following the late '30s and the
trend continued throughout the '40s and '50s. Similar, trend in the growth of the number of
banks is found in Cochin too.
The fall in the growth of banks, during the second half of the' 30s, coincided with
the enactment of the Banking Regulation Act, 1938 in Travancore and the Royal
Proclamation, 1937 of the Cochin State to govern the various aspects of commercial
banking business. These regulations were meant to put a break on the haphazard growth of
commercial banks that the region experienced during the late 20's and the early 30's.
Among other things, the regulation in Travancore included the one prohibiting the banks
from conducting chitties.
2.1.3.3 Growth in Malabar
The Nedungadi Bank, founded at Calicut in 1899 by Appu Nedungadi, a barrister by
profession, was the earliest bank to be established in the Malabar region. In fact, it was the
first joint-stock bank to be started in Kerala. Though this bank was set up in 1899, it got
registered as a joint-stock company only in 1913 (Ram Babu, 1996). The first bank to be
registered in Malabar was Chalapuram Bank Ltd. in 1906, followed by Calicut Bank Ltd., in
1908.
We do not have comparable statistics regarding the number of joint-stock banks
registered in Malabar for the period covered above for Travancore and Cochin. Some
information on another banking indicator ie; the number of bank offices in the three regions,
however, is available. To get an understanding of the comparable situation in Malabar,
Travancore and Cochin, we give below the number of commercial bank offices (see table
2.3). As the Table indicates, the number of bank offices in Travancore and Cochin had been
well ahead of Malabar throughout the period since the mid-'20s and the gap got widened
since the '40s, indicating much higher growth in the former two regions.
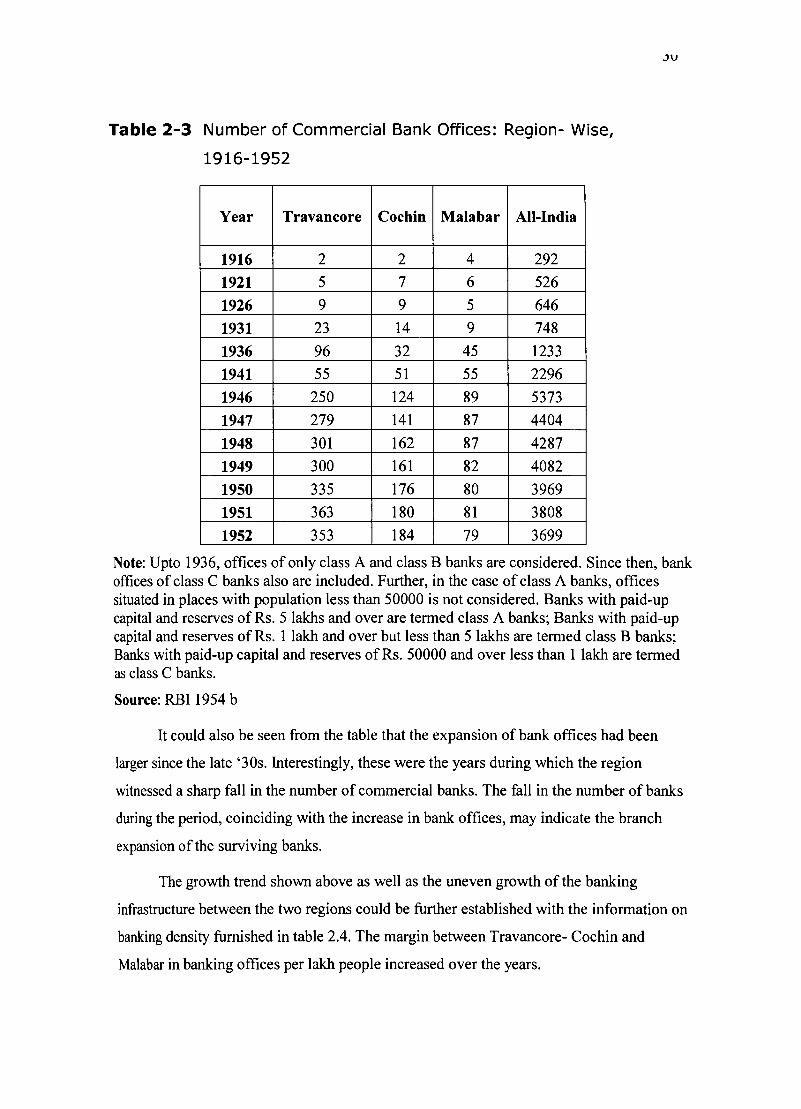
Table 2-3 Number of Commercial Bank Offices: Region- Wise,
1916-1952
Year Travancore Cochin Malabar All-India
1916 2 2 4 292
1921 5 7 6 526
1926 9 9 5 646
1931 23 14 9 748
1936 96 32 45 1233
1941 55 51 55 2296
1946 250 124 89 5373
1947 279 141 87 4404
1948 301 162 87 4287
1949 300 161 82 4082
1950 335 176 80 3969
1951 363 180 81 3808
1952 353 184 79 3699
.)v
Note: Upto 1936, offices of only class A and class B banks are considered. Since then, bank offices of class C banks also are included. Further, in the case of class A banks, offices situated in places with population less than 50000 is not considered. Banks with paid-up capital and reserves of Rs. 5 lakhs and over are termed class A banks; Banks with paid-up capital and reserves of Rs. 1 lakh and over but less than 5 lakhs are termed class B banks; Banks with paid-up capital and reserves of Rs. 50000 and over less than 1 lakh are termed as class C banks.
Source: RBI 1954 b
It could also be seen from the table that the expansion of bank offices had been
larger since the late '30s. Interestingly, these were the years during which the region
witnessed a sharp fall in the number of commercial banks. The fall in the number of banks
during the period, coinciding with the increase in bank offices, may indicate the branch
expansion of the surviving banks.
The growth trend shown above as well as the uneven growth of the banking
infrastructure between the two regions could be further established with the information on
banking density furnished in table 2.4. The margin between Travancore- Cochin and
Malabar in banking offices per lakh people increased over the years.
,)1
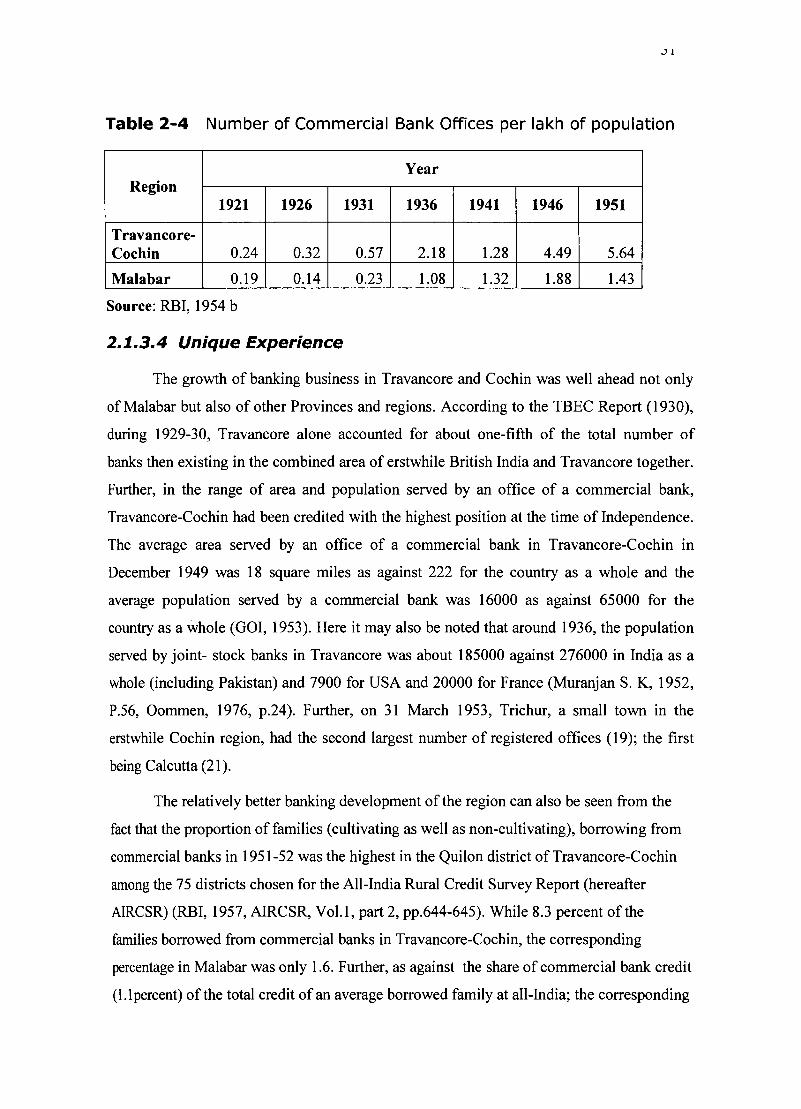
Table 2-4 Number of Commercial Bank Offices per lakh of population
Year Region
1921 1926 1931 1936 1941 1946 1951
Travancore-Cochin 0.24 0.32 0.57 2.18 1.28 4.49 5.64
Malabar 0.19 0.14 0.23 1.08 1.32 1.88 1.43
Source: RBI, 1954 b
2.1.3.4 Unique Experience
The growth of banking business in Travancore and Cochin was well ahead not only
of Malabar but also of other Provinces and regions. According to the TBEC Report (1930),
during 1929-30, Travancore alone accounted for about one-fifth of the total number of
banks then existing in the combined area of erstwhile British India and Travancore together.
Further, in the range of area and population served by an office of a commercial bank,
Travancore-Cochin had been credited with the highest position at the time of Independence.
The average area served by an office of a commercial bank in Travancore-Cochin in
December 1949 was 18 square miles as against 222 for the country as a whole and the
average population served by a commercial bank was 16000 as against 65000 for the
country as a whole (GOI, 1953). Here it may also be noted that around 1936, the population
served by joint- stock banks in Travancore was about 185000 against 276000 in India as a
whole (including Pakistan) and 7900 for USA and 20000 for France (Muranjan S. K, 1952,
P.56, Oommen, 1976, p.24). Further, on 31 March 1953, Trichur, a small town in the
erstwhile Cochin region, had the second largest number of registered offices (19); the first
being Calcutta (21).
The relatively better banking development of the region can also be seen from the
fact that the proportion of families (cultivating as well as non-cultivating), borrowing from
commercial banks in 1951-52 was the highest in the Quilon district of Travancore-Cochin
among the 75 districts chosen for the All-India Rural Credit Survey Report (hereafter
AIRCSR) (RBI, 1957, AIRCSR, Vol.l, part 2, pp.644-645). While 8.3 percent of the
families borrowed from commercial banks in Travancore-Cochin, the corresponding
percentage in Malabar was only 1.6. Further, as against the share of commercial bank credit
(l.lpercent) of the total credit of an average borrowed family at all-India; the corresponding
,)1
Table 2-4 Number of Commercial Bank Offices per lakh of population
Year Region
1921 1926 1931 1936 1941 1946 1951
Travancore-Cochin 0.24 0.32 0.57 2.18 1.28 4.49 5.64
Malabar 0.19 0.14 0.23 1.08 1.32 1.88 1.43
Source: RBI, 1954 b
2.1.3.4 Unique Experience
The growth of banking business in Travancore and Cochin was well ahead not only
of Malabar but also of other Provinces and regions. According to the TBEC Report (1930),
during 1929-30, Travancore alone accounted for about one-fifth of the total number of
banks then existing in the combined area of erstwhile British India and Travancore together.
Further, in the range of area and population served by an office of a commercial bank,
Travancore-Cochin had been credited with the highest position at the time of Independence.
The average area served by an office of a commercial bank in Travancore-Cochin in
December 1949 was 18 square miles as against 222 for the country as a whole and the
average population served by a commercial bank was 16000 as against 65000 for the
country as a whole (GOI, 1953). Here it may also be noted that around 1936, the population
served by joint- stock banks in Travancore was about 185000 against 276000 in India as a
whole (including Pakistan) and 7900 for USA and 20000 for France (Muranjan S. K, 1952,
P.56, Oommen, 1976, p.24). Further, on 31 March 1953, Trichur, a small town in the
erstwhile Cochin region, had the second largest number of registered offices (19); the first
being Calcutta (21).
The relatively better banking development of the region can also be seen from the
fact that the proportion of families (cultivating as well as non-cultivating), borrowing from
commercial banks in 1951-52 was the highest in the Quilon district of Travancore-Cochin
among the 75 districts chosen for the All-India Rural Credit Survey Report (hereafter
AIRCSR) (RBI, 1957, AIRCSR, Vol.l, part 2, pp.644-645). While 8.3 percent of the
families borrowed from commercial banks in Travancore-Cochin, the corresponding
percentage in Malabar was only 1.6. Further, as against the share of commercial bank credit
(l.lpercent) of the total credit of an average borrowed family at all-India; the corresponding
jL.
share was 6.1 percent in Travancore- Cochin. The corresponding share in Malabar, was only
0.6 percent. The average amount of credit from commercial bank per family, too, was
higher in Travancore-Cochin. While it was only Rs.l.8 in All-India, the corresponding
amount in Travancore-Cochin was Rs. 13.
2.1.4 SALIENT FEATURES
2.1.4.1 Unit Banks
The banking system, which developed in the regions of Travancore and Cochin, was
mainly of the unit banking type. Thus in 1933, the two regions had about 400 banks (with
registered offices within the regions), but with less than 100 branches. But since the early
'40s, there took place considerable branch expansion. According to TCBEC (1956), as
many as 235 branches were opened during the period between 1941 and 1947 in
Travancore. Thus what started as unit banking gave way increasingly to branch banking.
However, even in 1955, out of the then existing 571 banking offices in Travancore-Cochin
together, 67 were still unit banks (GOI, 1956).
2.1.4.2 Very Few Big Banks
Majority of the banking institutions emerged during these years were small in size;
only a few of them could be called big. (Oommen, 1976 p.28) Thus out of35 banks in
1919-20 in Travancore, only 2 (i.e., 5.71 percent) had paid up capital above Rs. 100,000.
The paid up capital of 7 banks (i.e., 20 percent) was even below Rs.5000. Their number had
become 69, (ie; 29 percent) in 1933-34, when the number of banks was as high as 452.
There were 11 banks with paid up capital even below Rs. 2000 during these years. Only
seven banks (2.75 percent) had paid up capital above Rs.I00,000. Even though the number
oftiny and small banks came down over the years their presence was quite significant even
in the immediate post-independence period. InI950-51, out of the 116 banks, only 23 ie; 20
percent had invested capital above Rs.l 00,000. The situation in Co chin was not much
different. Out of the total 81 banks, only 22 (27 percent) had invested capital above one
lakh rupees there (ibid p.13).
When the Reserve Bank of India was established in 1933, only two Travancore
banks -the Travancore National Bank and the Quilon Bank -were classified as scheduled
banks 10 in Travancore. These two banks were amalgamated in September 1937, to form the
Travancore National and Quilon Bank Ltd. (TNQBL). This was the biggest locally owned
33
private bank in the State. It reached the first position in having the largest number of branch
offices in India and third in the volume of business. Besides branches in Travancore-
Cochin, the bank had 24 other branches, of which 16 were in British India and 3 in Ceylon.
This giant in the region's banking sector during the pre-independence period, however,
went into liquidation in September 1938, soon after amalgamation (Ko shy, 1975, Mathen
C.P. 1951). The sudden liquidation of this bank also contributed, in its own way, to the
disappearance of a large number of banks during the period. This incident had a ricocheting
effect on the banking business as the general confidence of the depositors in them was
severely shaken. Following this, many small and medium sized banks, had been wound up
or liquidated in Travancore as well as in Cochin (GOI, 1956).
In 1940, five scheduled banks operated in Kerala. They were Nedungadi Bank
(Kozhikode), Palai Central Bank (Kottayam, 1927), South Indian Bank (Trichur, 1929),
Travancore Forward Bank (Kottayam, 1929) and Indo- Mercantile Bank (Cochin, 1937).
There were also a few banks, which were non- scheduled but which had more than Rs.
500000 as share capital. As on 31 51 May 1956, according to TCBEC, out of the total number
of 163 banks operating in Travancore-Cochin, 18 were scheduled banks.
An interesting aspect of the scheduled banks was that the majority (13 out of 18) of
them were incorporated outside the State. Out of the 148 banks incorporated within the
State, the number of scheduled banks was only 5 even in 1955. It is also significant to note
that the Travancore Bank, registered on Ith September 1945, after the disappearance of
TNQB in 1938, emerged as an important bank of local origin within a short time. Its growth
was fairly rapid and its only major competitor in the State during the period was Palai
Central Bank.
2.1.4.3 Sectarian Characteristics
Another noteworthy aspect of the genesis of modem banking in Travancore and
Cochin was that many of the banks were either "personality" banks or "family banks", that
is to say, banks started and built up by a single individual sufficiently enterprising or by a
family. Further, many of the early banks were founded by one community i.e., the
Christians. In fact, they dominated the field for several years. The lead of the Christians
prompted several other communities to enter the field in later years (GOI, 1956). The
community bias of the early banks was evident in the names of the banks themselves .. For
J4
instance there were many banks with nomenclature associated with a particular sect or
religion such as the Catholic Syrian Bank Ltd, The Catholic Oriental Bank Ltd, The Cochin
Nayar Bank Ltd, The Chaldean Syrian Bank Ltd etc. In this context, it may also be noted
that several leading Christian families had comparatively higher stakes in the banking
business 11.
2.1..4.4 Spreading of Banks
Literature on banking development in the nineteenth and early twentieth century
India indicates that the banks at the national level originated first in port towns and that
there had been a heavy concentration of them in major cities and commercial centers like
Bombay, Calcutta and Madras. As against this general pattern, banks in Travancore were
initially started in the agrarian hinterland such as Thiruvalla, Thalavadi, Chengannur,
Kozhencherry, Kottayam, Palai, etc. In fact, there was a spatial concentration of banking at
Thiruvalla in Travancore. But in Cochin, the commercial and industrial areas were the
cradles of earlier banks and it was only later that branches were opened in the rural areas. A
heavy concentration of banking institutions could be found in the towns of Thrisur, Cochin
and Emakulam in Cochin State. In 1947, these 3 towns accounted for two- thirds of the total
number of banks in Cochin (Oommen, 1976 p. 33). Interestingly, as noted before, in 1953,
Trichur had the second highest number of registered offices of commercial banks in India.
In Malabar, the banking activity was virtually confined to urban and semi-urban
areas with very little spreading over to rural areas. The difference in the location pattern of
the banking development among the three regions can further be shown with the following
table.
.).)
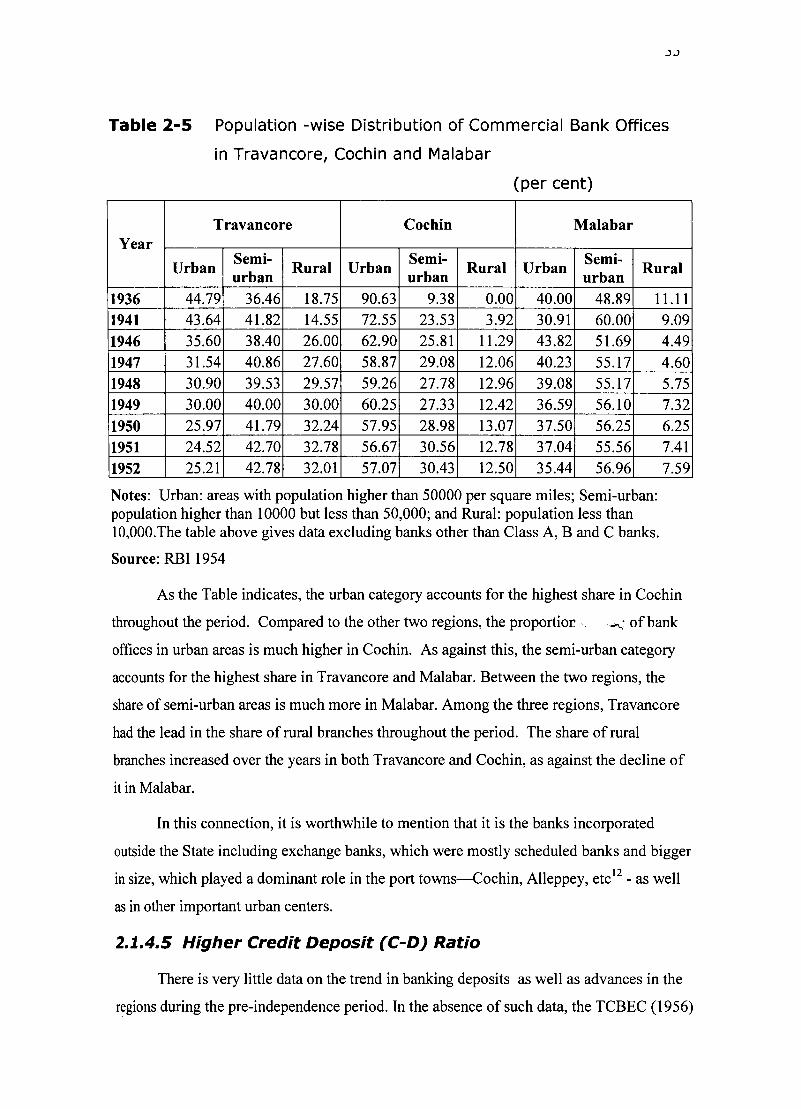
Table 2-5 Population -wise Distribution of Commercial Bank Offices
in Travancore, Cochin and Malabar
(per cent)
Travancore Cochin Malabar Year
Urban Semi-
Rural Urban Semi-
Rural Urban Semi-
Rural urban urban urban
1936 44.79 36.46 18.75 90.63 9.38 0.00 40.00 48.89 11.11 1941 43.64 41.82 14.55 72.55 23.53 3.92 30.91 60.00 1946 35.60 38.40 26.00 62.90 25.81 11.29 43.82 51.69
1947 31.54 40.86 27.60 58.87 29.08 12.06 40.23 55.17
1948 30.90 39.53 29.57 59.26 27.78 12.96 39.08 55.17
1949 30.00 40.00 30.00 60.25 27.33 12.42 36.59 56.10
1950 25.97 41.79 32.24 57.95 28.98 13.07 37.50 56.25
1951 24.52 42.70 32.78 56.67 30.56 12.78 37.04 55.56
1952 25.21 42.78 32.01 57.07 30.43 12.50 35.44 56.96
Notes: Urban: areas with population higher than 50000 per square miles; Semi-urban: population higher than 10000 but less than 50,000; and Rural: population less than 10,000.The table above gives data excluding banks other than Class A, B and C banks.
Source: RBI 1954
9.09 4.49
4.60 5.75 7.32
6.25 7.41 7.59
As the Table indicates, the urban category accounts for the highest share in Cochin
throughout the period. Compared to the other two regions, the proportior . _~. of bank
offices in urban areas is much higher in Cochin. As against this, the semi-urban category
accounts for the highest share in Travancore and Malabar. Between the two regions, the
share of semi-urban areas is much more in Malabar. Among the three regions, Travancore
had the lead in the share of rural branches throughout the period. The share of rural
branches increased over the years in both Travancore and Cochin, as against the decline of
it in Malabar.
In this connection, it is worthwhile to mention that it is the banks incorporated
outside the State including exchange banks, which were mostly scheduled banks and bigger
in size, which played a dominant role in the port towns-Cochin, Alleppey, etc12 - as well
as in other important urban centers.
2.1.4.5 Higher Credit Deposit (C-D) Ratio
There is very little data on the trend in banking deposits as well as advances in the
regions during the pre-independence period. In the absence of such data, the TCBEC (1956)
.).)
Table 2-5 Population -wise Distribution of Commercial Bank Offices
in Travancore, Cochin and Malabar
(per cent)
Travancore Cochin Malabar Year
Urban Semi-
Rural Urban Semi-
Rural Urban Semi-
Rural urban urban urban
1936 44.79 36.46 18.75 90.63 9.38 0.00 40.00 48.89 11.11 1941 43.64 41.82 14.55 72.55 23.53 3.92 30.91 60.00 1946 35.60 38.40 26.00 62.90 25.81 11.29 43.82 51.69
1947 31.54 40.86 27.60 58.87 29.08 12.06 40.23 55.17
1948 30.90 39.53 29.57 59.26 27.78 12.96 39.08 55.17
1949 30.00 40.00 30.00 60.25 27.33 12.42 36.59 56.10
1950 25.97 41.79 32.24 57.95 28.98 13.07 37.50 56.25
1951 24.52 42.70 32.78 56.67 30.56 12.78 37.04 55.56
1952 25.21 42.78 32.01 57.07 30.43 12.50 35.44 56.96
Notes: Urban: areas with population higher than 50000 per square miles; Semi-urban: population higher than 10000 but less than 50,000; and Rural: population less than 10,000.The table above gives data excluding banks other than Class A, B and C banks.
Source: RBI 1954
9.09 4.49
4.60 5.75 7.32
6.25 7.41 7.59
As the Table indicates, the urban category accounts for the highest share in Cochin
throughout the period. Compared to the other two regions, the proportior . _~. of bank
offices in urban areas is much higher in Cochin. As against this, the semi-urban category
accounts for the highest share in Travancore and Malabar. Between the two regions, the
share of semi-urban areas is much more in Malabar. Among the three regions, Travancore
had the lead in the share of rural branches throughout the period. The share of rural
branches increased over the years in both Travancore and Cochin, as against the decline of
it in Malabar.
In this connection, it is worthwhile to mention that it is the banks incorporated
outside the State including exchange banks, which were mostly scheduled banks and bigger
in size, which played a dominant role in the port towns-Cochin, Alleppey, etc12 - as well
as in other important urban centers.
2.1.4.5 Higher Credit Deposit (C-D) Ratio
There is very little data on the trend in banking deposits as well as advances in the
regions during the pre-independence period. In the absence of such data, the TCBEC (1956)

36
utilised banking statistics as on the 31 December 1955 as an indicator, not only for that
particular date, but also for a few years prior to it, of the role that the banks were playing in
the State. According to it, the total deposits of all the banks functioning in the Travancore
Cochin State at their offices within the State were about Rs. 37.3 7 crores. The total
advances stood at Rs. 22.74 crores forming 61 percent of the deposits in the State. This
ratio was marginally higher (61.5) when all the banks incorporated in Travancore-Cochin
were considered. In the case of medium and small banks, within this group, the ratio was
very much above than this i.e., 75.1 and 84.2 respectively. The above ratio was the one after
1949 when the Reserve Bank imposed strict control over the pattern and distribution of
assets. Oommen (1976) finds that in Travancore-Cochin the C-D ratio of scheduled
commercial banks in 1937 was as high as 81 percent as against 58 percent in the country as
a whole. It was still higher (97 percent) for non-scheduled banks.
2.1.4.6 Small-Man's Banks
From the available evidence, it can be inferred that as against the prevailing
standards, the banking institutions in the region received deposits from small savers and
gave credit to small peasants and traders. Even as late as 1955, when a large number of the
minor banks got wiped out, 54 percent of the accounts in the remaining banks were those
below Rs.l 00. If amounts less than Rs.l 000 are included as small, the proportion works out
to 75 percent of the accounts and over 19 percent of the total amount. The total number of
accounts with balances above 1 lakh was only 0.2 percent. With respect to credit, as already
noted, the proportion of families depending on commercial bank credit was the highest in
Travancore-Cochin. The average borrowing from commercial banks per family, however,
had been only Rs.161 (RBI, 1957). A significant percentage of borrowers with a low
average amount borrowed, evidently, is indicative of the banking system reaching a much
lower stratum-mass banking-in the region at an earlier period than elsewhere. Looking
differently, this would also signify that the region did not have large size borrowers during
the period.
2.1.5 COMMERCIAL BANKING DEVELOPMENT: 1956 TO 1969
2.1.5.1 Process of Consolidation and Integration
The process of consolidation of the commercial banking system, which began during
the late '30s and continued progressively thereafter, got further impetus during the decade
,)1
following 1956. Thus the earlier trend of the decline in the number of banks continued
while the number of branches per bank tended to increase. The fall in the number of banks
and branch expansion that Kerala experienced during the' 50s and '60s was largely in
conformity with the all-India trends. During the post-independence period, the RBI
followed a rather conservative policy towards opening of new banks. The emphasis, during
the period, was on consolidation and strengthening of the banking system rather than on
expansion, as bank failures/closures were recurring phenomena prior to independence. The
uncontrolled floatation of banks by private individuals was found to be a major cause for
such large-scale failures. Given the prevalence of a large number of banking institutions in
Kerala, of which majority were small, the impact of the RBI policy, as is to be expected,
could be felt more in the region.
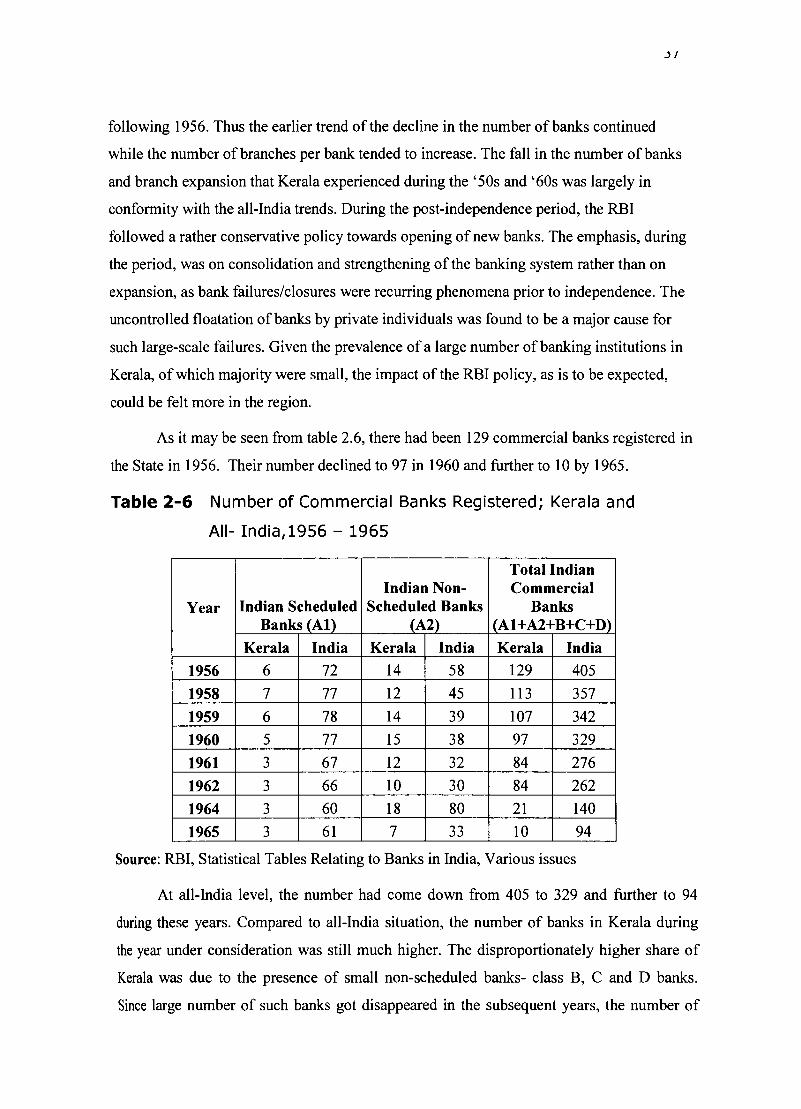
As it may be seen from table 2.6, there had been 129 commercial banks registered in
the State in 1956. Their number declined to 97 in 1960 and further to 10 by 1965.
Table 2-6 Number of Commercial Banks Registered; Kerala and
AII- India,1956 - 1965
Total Indian Indian Non- Commercial
Year Indian Scheduled Scheduled Banks Banks Banks (AI) (A2) (A 1 +A2+B+C+D)
Kerala India Kerala India Kerala India
1956 6 72 14 58 129 405
1958 7 77 12 45 113 357
1959 6 78 14 39 107 342
1960 5 77 15 38 97 329
1961 3 67 12 32 84 276
1962 3 66 10 30 84 262
1964 3 60 18 80 21 140
1965 3 61 7 33 10 94
Source: RBI, Statistical Tables Relating to Banks in India, Various issues
At all-India level, the number had come down from 405 to 329 and further to 94
during these years. Compared to all-India situation, the number of banks in Kerala during
the year under consideration was still much higher. The disproportionately higher share of
Kerala was due to the presence of small non-scheduled banks- class B, C and D banks.
Since large number of such banks got disappeared in the subsequent years, the number of
,)1
following 1956. Thus the earlier trend of the decline in the number of banks continued
while the number of branches per bank tended to increase. The fall in the number of banks
and branch expansion that Kerala experienced during the' 50s and '60s was largely in
conformity with the all-India trends. During the post-independence period, the RBI
followed a rather conservative policy towards opening of new banks. The emphasis, during
the period, was on consolidation and strengthening of the banking system rather than on
expansion, as bank failures/closures were recurring phenomena prior to independence. The
uncontrolled floatation of banks by private individuals was found to be a major cause for
such large-scale failures. Given the prevalence of a large number of banking institutions in
Kerala, of which majority were small, the impact of the RBI policy, as is to be expected,
could be felt more in the region.
As it may be seen from table 2.6, there had been 129 commercial banks registered in
the State in 1956. Their number declined to 97 in 1960 and further to 10 by 1965.
Table 2-6 Number of Commercial Banks Registered; Kerala and
AII- India,1956 - 1965
Total Indian Indian Non- Commercial
Year Indian Scheduled Scheduled Banks Banks Banks (AI) (A2) (A 1 +A2+B+C+D)
Kerala India Kerala India Kerala India
1956 6 72 14 58 129 405
1958 7 77 12 45 113 357
1959 6 78 14 39 107 342
1960 5 77 15 38 97 329
1961 3 67 12 32 84 276
1962 3 66 10 30 84 262
1964 3 60 18 80 21 140
1965 3 61 7 33 10 94
Source: RBI, Statistical Tables Relating to Banks in India, Various issues
At all-India level, the number had come down from 405 to 329 and further to 94
during these years. Compared to all-India situation, the number of banks in Kerala during
the year under consideration was still much higher. The disproportionately higher share of
Kerala was due to the presence of small non-scheduled banks- class B, C and D banks.
Since large number of such banks got disappeared in the subsequent years, the number of

banks registered in Kerala had declined to lOin 1965. However, since banks registered in
other States had also been functioning in the State, and their number increased over the
years, the actual number of banks functioning in the State was much more than this. Thus
out of the total 89 commercial banks in the country as a whole, 28 were operating in Kerala
during 1969 (see Table 2.7).
Table 2-7 Number of Commercial Banks Operating in Kerala,
1966-1969
No. of banks Branches Population per Year operating per Bank office in '000
Kerala Kerala Kerala All-India
1966 30 18 36 76
1967 28 19 37 73
1968 27 21 35 69
1969 28 23 32 60
Source: Same as Table 2.6
Also, the fall in the number of banks coincided with increase in bank offices;
indicative of the furtherance of branch banking. Offices per bank, which were less than 10
during the early '60s, became more than 23 in 1969. Population per commercial bank office,
which was more than 50,000 in 1960 fell to 32,000 in 1969. The corresponding figures for
the country was 60,000.
The decline in the number of banks in the State, as elsewhere in India, was on
account of merger/amalgamation of smaller/weaker banks with larger/stronger ones. The
period was also noted for higher incidence of bank failures/closures. Further there were
instances of compulsory liquidation. Apart from these reasons, the classification of many
banks as non-banking companies by RBI also contributed to the fall in number to a great
extent.
Thus during the year 1962, when 8 banks were amalgamated with other banks (6
with the State Bank of India), 15 had been classified as non-bank finance companies in
Kerala. Not only small banks, but relatively larger ones too had been wound up during these
years. A typical case for the latter can be found with the liquidation of Palai Central Bank 13_
a medium-sized scheduled bank- in December 1960.
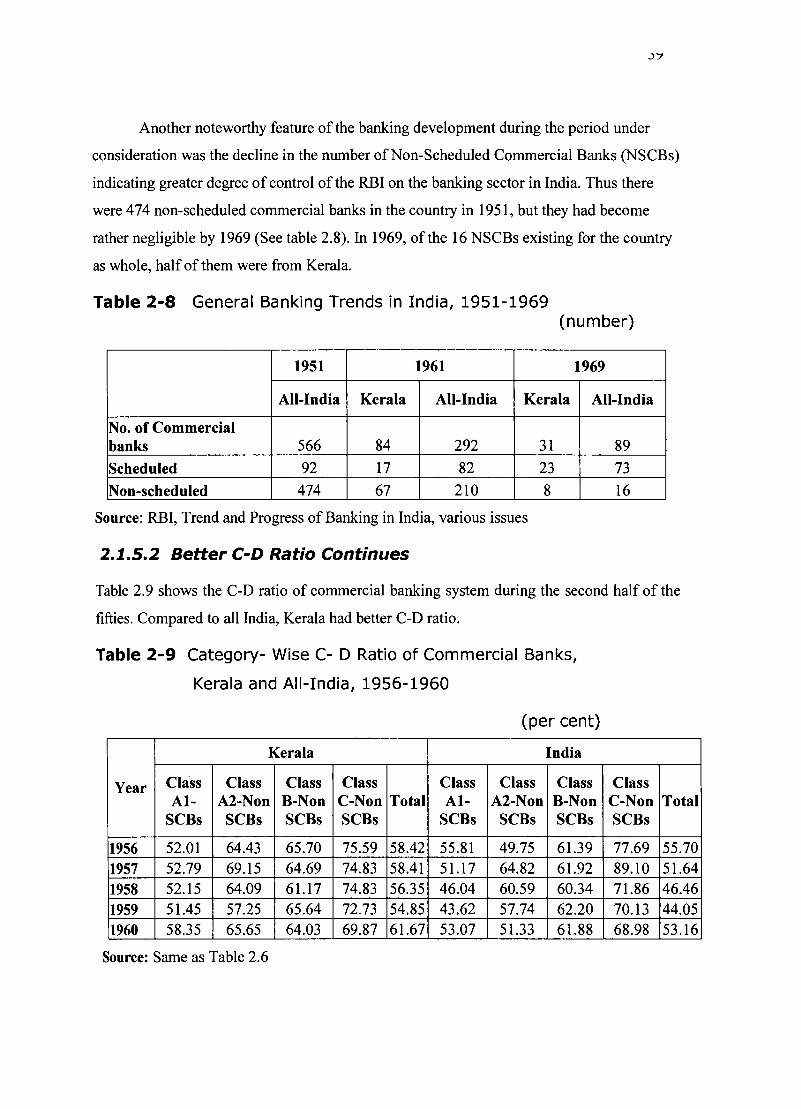
Another noteworthy feature of the banking development during the period under
consideration was the decline in the number of Non-Scheduled Commercial Banks (NSCBs)
indicating greater degree of control of the RBI on the banking sector in India. Thus there
were 474 non-scheduled commercial banks in the country in 1951, but they had become
rather negligible by 1969 (See table 2.8). In 1969, of the 16 NSCBs existing for the country
as whole, half of them were from Kerala.
Table 2-8 General Banking Trends in India, 1951-1969 (number)
1951 1961 1969
All-India Kerala All-India Kerala All-India
No. of Commercial banks 566 84 292 31 89
Scheduled 92 17 82 23 73
Non-scheduled 474 67 210 8 16
Source: RBI, Trend and Progress of Banking in India, various issues
2.1.5.2 Better C-D Ratio Continues
Table 2.9 shows the C-D ratio of commercial banking system during the second half of the
fifties. Compared to all India, Kerala had better C-D ratio.
Table 2-9 Category- Wise C- D Ratio of Commercial Banks,
Kerala and All-India, 1956-1960
(per cent)
Kerala India
Year Class Class Class Class Class Class Class Al- A2-Non B-Non C-Non Total Al- A2-Non B-Non
SCBs SCBs SCBs SCBs SCBs SCBs SCBs
1956 52.01 64.43 65.70 75.59 58.42 55.81 49.75 61.39 1957 52.79 69.15 64.69 74.83 58.41 51.17 64.82 61.92 1958 52.15 64.09 61.17 74.83 56.35 46.04 60.59 60.34 1959 51.45 57.25 65.64 72.73 54.85 43.62 57.74 62.20 1960 58.35 65.65 64.03 69.87 61.67 53.07 51.33 61.88
Source: Same as Table 2.6
Class C-Non Total SCBs
77.69 55.70 89.10 51.64 71.86 46.46 70.13 44.05 68.98 53.16

We do not have comparable data on C-D ratio of the commercial banking system as
a whole for the '60s. But some information on the C-D ratio of SCBs alone is available
which is provided in table 2.10. The table shows increase in C-D ratio in the sixties than in
the fifties for both Kerala and India. The C-D ratio kept on increasing for both Kerala and
India. Compared to the fifties, the value of the ratio in the State is lower than for the
country, but the gap between the two got reduced by 1968 and 1969.
Table 2-10 Scheduled Commercial Bank Deposits, Credit and C- D
Ratio: Kerala and all-India
Kerala Credit- Deposit Ratio
Year (Amount Rs. Lakbs) (Per cent)
Deposits Credit Kerala All India
1964 8046 4934 61.32 68.79 1965 9428 5724 60.71 69.41 1966 11148 6626 59.44 67.97 1967 11862 7107 59.91 69.46 1968 13038 8634 66.22 70.68 1969 15272 10514 68.84 72.19
Source: Same as Table 2.7
Data on pre capita SCB deposits as well as credit given in table 2.11 shows
relatively lower values of both for Kerala. Compared to deposits, SCB credit shows an
increasing tendency in the State.
Table 2-11 Per Capita and Per Office Deposits and Credit of Scheduled
Commercial Banks: Kerala and India
Per Capita Deposits Per Capita Credit Deposits / Office Credit/Office
Year Kerala Percentage
Kerala Percentage
Kerala Percentage
Kerala Percentage
(Rs) of Kerala to
(Rs) of Kerala
(Rs) of Kerala
(Rs) of Kerala
India to India to India to India
1964 45 76 27.31 68.14 21.23 43.02 13.02 38.35 1965 51 79 30.99 69.54 24.36 47.17 14.79 41.26 1966 58 80 34.33 70.11 27.87 49.50 16.57 43.28 1967 60 78 35.91 67.16 29.22 50.33 17.50 43.42 1968 64 76 42.55 70.89 30.61 51.21 20.27 47.98 1969 73 77 50.52 73.01 29.60 50.77 20.38 48.42
Source: Same as Table 2.6

Indeed, Kerala is found to have a relatively higher presence of non- scheduled banks
during these years. Their inclusion, given the earlier trend, may make Kerala' s position
appear better.
From the strands of the above discussion, it can be unambiguously concluded that
the region experienced relatively better commercial banking spread during the pre
nationalisation period. The pace of development in the region's banking sector during the
half a century since the First World War can be divided in to three distinct phases: Phase I
extends through the' 20s and the early '30s, Phase 11 covers the thirties and Phase Ill, the
period thereafter up to nationalisation of major commercial banks. During phase I,
consisting of more than one decade of the post-World War I period, there took place a rapid
growth of Joint Stock Banks as well as chitties. In phase 11, there had been a deceleration in
their growth. But this had been followed by a revival during phase Ill. Significantly, during
phase Ill, the system of banking that started out largely as a unit banking type gave way to
branch banking. Further, it seems that during the years since the late '30s, the financial
market of the region experienced a change- over from an unstructured and chaotic growth
phase to a leaner but more efficient and consolidated one. This phase was also characterised
by the integration of the State's banking system with the all- India banking system. The
period also witnessed the spread of all-India banks in Kerala.
2.1.6 THE CO-OPERATIVE CREDIT SYSTEM
In Kerala, as in other parts oflndia, the phase of Co-operative credit was started
following the Indian Co-operative Credit Societies Act, 1904, the first Act dealing with co
operative societies to be passed in Indial4• Following this Act, the first co-operative society,
an agricultural credit society got registered in Kerala in 1904 at Palakkad in Malabar region
of the erstwhile Madras Presidency. In Cochin, the first credit society was started in 1913. It
was only in November 1915, that the first society was registered in Travancore. Unlikl! the
primary agricultural societies in other regions, it was a secondary organisation, namely the
Trivandrum Central Co-operative Bank Ltd which was started in Travancore. Within a year
after the inauguration of the central bank, twenty-five primary societies were registered.
Eighteen of them were agricultural credit societies, and the rest non-agricultural credit
societies. A few Taluk (co- operative) banks also got registered {Velu Pillai. P.676-677).
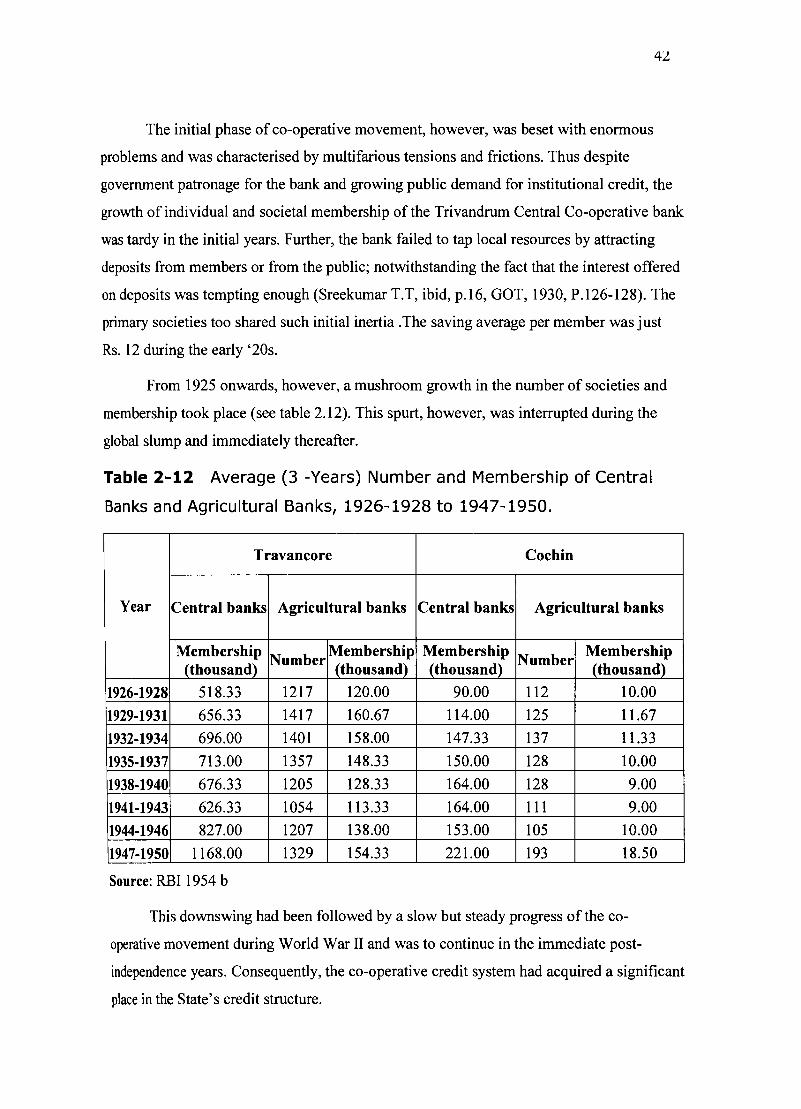
42
The initial phase of co-operative movement, however, was beset with enormous
problems and was characterised by multifarious tensions and frictions. Thus despite
government patronage for the bank and growing public demand for institutional credit, the
growth of individual and societal membership ofthe Trivandrum Central Co-operative bank
was tardy in the initial years. Further, the bank failed to tap local resources by attracting
deposits from members or from the public; notwithstanding the fact that the interest offered
on deposits was tempting enough (Sreekumar T.T, ibid, p.16, GOT, 1930, P.126-128). The
primary societies too shared such initial inertia .The saving average per member was just
Rs. 12 during the early '20s.
From 1925 onwards, however, a mushroom growth in the number of societies and
membership took place (see table 2.12). This spurt, however, was interrupted during the
global slump and immediately thereafter.
Table 2-12 Average (3 -Years) Number and Membership of Central
Banks and Agricultural Banks, 1926-1928 to 1947-1950.
Travancore Cochin
Year Central banks Agricultural banks Central banks Agricultural banks
Membership Number
Membership Membership Number
Membership (thousand) (thousand) (thousand) (thousand)
1926-1928 518.33 1217 120.00 90.00 112 10.00
1929-1931 656.33 1417 160.67 114.00 125 11.67
1932-1934 696.00 1401 158.00 147.33 137 11.33
1935-1937 713.00 1357 148.33 150.00 128 10.00
1938-1940 676.33 1205 128.33 164.00 128 9.00
1941-1943 626.33 1054 113.33 164.00 111 9.00
1944-1946 827.00 1207 138.00 153.00 105 10.00
1947-1950 1168.00 1329 154.33 221.00 193 18.50
Source: RBI 1954 b
This downswing had been followed by a slow but steady progress of the co-
operative movement during World War 11 and was to continue in the immediate post
independence years. Consequently, the co-operative credit system had acquired a significant
place in the State's credit structure.
4J
Having recognised the pivotal role that the co-operative credit institutions can play
in rural development in general and agricultural development in particular, efforts have been
taken during the planning era to strengthen and develop the system so as to make it an
integral part of the rural infrastructure in the country. As a significant step in this regard, an
All India Rural Credit Committee15 was constituted in 1954 to make a detailed review of the
agricultural credit situation in India with particular reference to the co-operative credit
structure. Compared to the then all-India standards the situation in the State was better.
Thus during the early '50s, while the average borrowing by household from co-operatives
was found to be 2.9 percentage of their total borrowing at all-India level, the share was 4.3
percent in the Quilon district of Travancore. Here too the position of Malabar was much
behind that of Travancore-Cochin; the percentage share being 0.6.
The period since the mid-'50s witnessed a reorganization of the co-operative
movement in Kerala on the basis of the recommendation of the all-India Rural Credit
Survey. The State government became partner in the co-operative credit societies by making
contributions to their share capital.
This Period was crucial for the rural credit in the State as there was a withdrawal of
both the non-institutional and commercial banks from the field of rural credit. But because
ofpyramiding (three tier) financing structure established at this time and also due to the
channelising of funds from the Reserve Bank of India, they could maintain their strength
and stability (Sunanda, S, 1991).
2.1.7 SYSTEM OF DIRECT STATE AGRICULTURAL CREDIT
There existed direct involvement, apart from the indirect involvement through the
co-operative system, noted above by the State in the credit system. As a matter of fact, the
practice of distributing advances for agricultural purposes to peasants by the State was
prevalent in the region from early period onwards. Several Cadjan records pertaining to the
18th century administration of Travancore hold testimony to this (Sreekumar T. T, 1995,
p.2). This practice prevailed without any statutory basis but by the promulgation of
necessary orders issued by administration from time to time. Following the British-India
pattern, legal status (in order to make the scheme effective) was given to the practice in
Travancore in 1891 and again in 1919. In1940, the government completely withdrew from
the scheme, after having transferred the work of granting agricultural loans to the
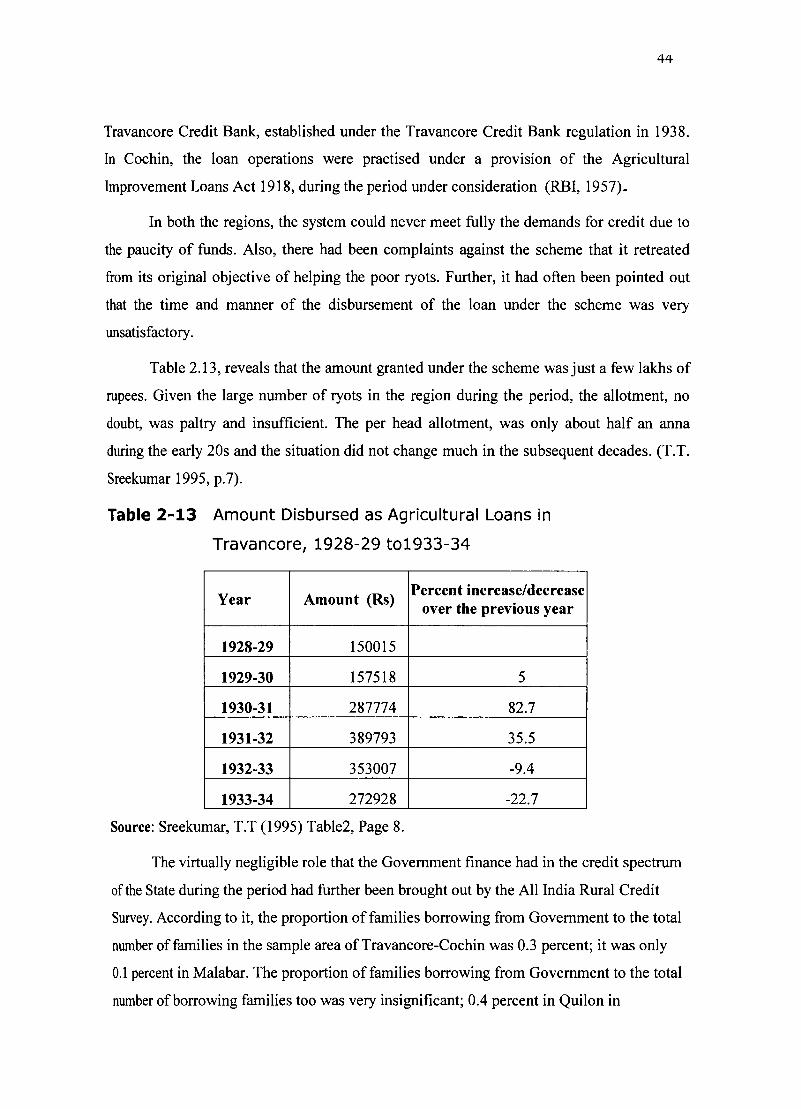
44
Travancore Credit Bank, established under the Travancore Credit Bank regulation in 1938.
In Cochin, the loan operations were practised under a provision of the Agricultural
Improvement Loans Act 1918, during the period under consideration (RBI,1957).
In both the regions, the system could never meet fully the demands for credit due to
the paucity of funds. Also, there had been complaints against the scheme that it retreated
from its original objective of helping the poor ryots. Further, it had often been pointed out
that the time and manner of the disbursement of the loan under the scheme was very
unsatisfactory .
Table 2.13, reveals that the amount granted under the scheme was just a few lakhs of
rupees. Given the large number of ryots in the region during the period, the allotment, no
doubt, was paltry and insufficient. The per head allotment, was only about half an anna
during the early 20s and the situation did not change much in the subsequent decades. (T.T.
Sreekumar 1995, p.7).
Table 2-13 Amount Disbursed as Agricultural Loans in
Travancore, 1928-29 to1933-34
Year Amount (Rs) Percent increase/decrease
over the previous year
1928-29 150015
1929-30 157518 5
1930-31 287774 82.7
1931-32 389793 35.5
1932-33 353007 -9.4
1933-34 272928 -22.7
Source: Sreekumar, T.T (1995) Table2, Page 8.
The virtually negligible role that the Government finance had in the credit spectrum
of the State during the period had further been brought out by the All India Rural Credit
Survey. According to it, the proportion of families borrowing from Government to the total
number of families in the sample area of Travancore-Cochin was 0.3 percent; it was only
0.1 percent in Malabar. The proportion of families borrowing from Government to the total
number of borrowing families too was very insignificant; 0.4 percent in Quilon in
45
Travancore and only 0.2 percent in Malabar. Very strikingly, though the share of families
borrowing from Government in Malabar is only half that of Travancore-Cochin, the average
borrowing from Government per family borrowing from Government in the former was
very much above the latter: Rs. 275 in Malabar as against Rs. 33 in Travancore-Cochin
(RBI, 1957, p.91).
Having identified some of the important features of the historical evolution of the
State's system during the pre-nationalisation period we may now turn to examine the next
logical question: What are the determinants or sources of such an evolution? Examination of
this issue is taken up in the next section.
Section 2.2
Major Sources of Banking Growth
The process of banking and other forms of financial sector development are linked
to the process of economic development. Hence, while discussing the determinants of the
region's banking sector development in this section, it is proposed to delineate the
development trajectory of the State and explore how the processes involved in making of it
facilitated the growth of the banking sector and vice versa. Analytically, this can be done by
exploring how the banking sector evolved to meet the financial needs of the economy and
how its function of collecting and allocating of savings i.e., how transferring the excess of
income over expenditure from surplus units to deficit units facilitated the real sector to
grow. Ideally, this is to be done by examining the evolution of the State's economy as well
as its component regions and sectors. But we do not propose to deal with the analysis of the
sub-regions/sectors in any detail here. What we would do is to portray the general
characteristics of the economy's evolution and explore how they articulated the demands for
financial services and how the resultant nature and pattern of growth of the latter in turn
contributed to the development of the former.
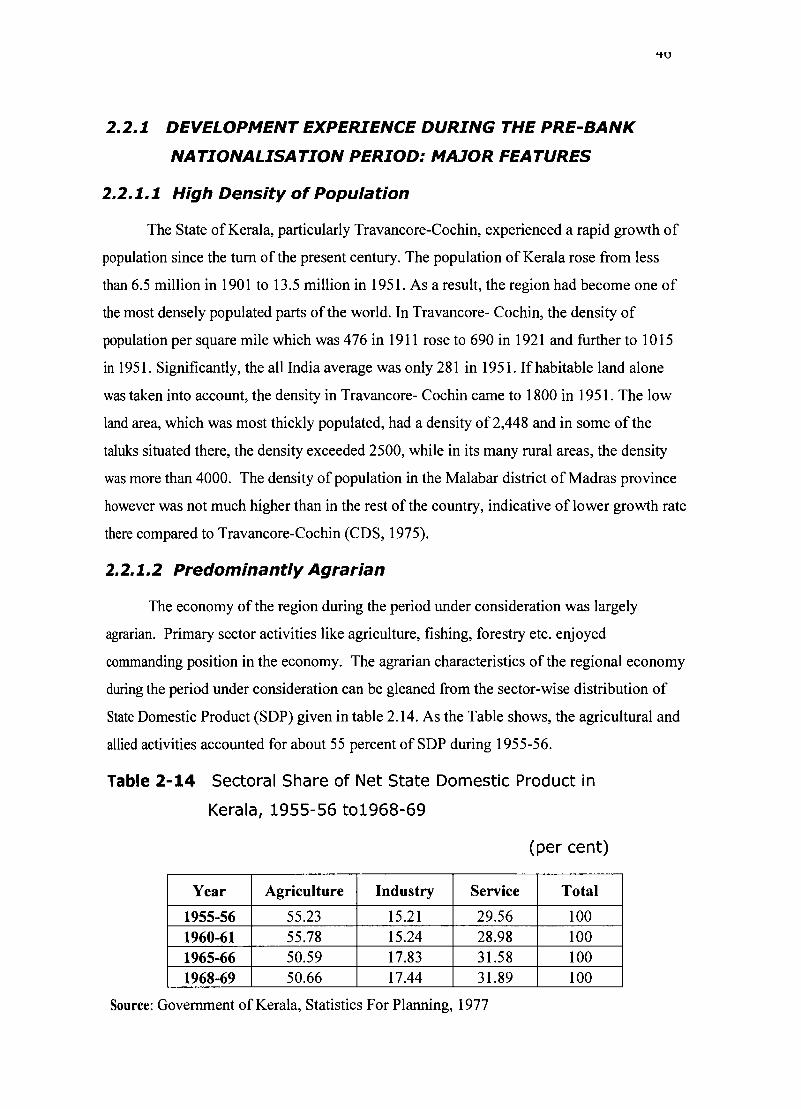
2.2.1 DEVELOPMENT EXPERIENCE DURING THE PRE-BANK
NATIONALISATION PERIOD: MAJOR FEATURES
2.2.1.1 High Density of Population
The State of Kerala, particularly Travancore-Cochin, experienced a rapid growth of
population since the turn of the present century. The population of Kerala rose from less
than 6.5 million in 1901 to 13.5 million in 1951. As a result, the region had become one of
the most densely populated parts of the world. In Travancore- Cochin, the density of
population per square mile which was 476 in 1911 rose to 690 in 1921 and further to 1015
in 1951. Significantly, the all India average was only 281 in 1951. Ifhabitable land alone
was taken into account, the density in Travancore- Cochin came to 1800 in 1951. The low
land area, which was most thickly populated, had a density of 2,448 and in some of the
taluks situated there, the density exceeded 2500, while in its many rural areas, the density
was more than 4000. The density of population in the Malabar district of Madras province
however was not much higher than in the rest of the country, indicative of lower growth rate
there compared to Travancore-Cochin (CDS, 1975).
2.2.1.2 Predominantly Agrarian
The economy of the region during the period under consideration was largely
agrarian. Primary sector activities like agriculture, fishing, forestry etc. enjoyed
commanding position in the economy. The agrarian characteristics of the regional economy
during the period under consideration can be gleaned from the sector-wise distribution of
State Domestic Product (SDP) given in table 2.14. As the Table shows, the agricultural and
allied activities accounted for about 55 percent of SDP during 1955-56.
Table 2-14 Sectoral Share of Net State Domestic Product in
Kerala, 1955-56 to1968-69
(per cent)
Year Agriculture Industry Service Total
1955-56 55.23 15.21 29.56 100 1960-61 55.78 15.24 28.98 100 1965-66 50.59 17.83 31.58 100 1968-69 50.66 17.44 31.89 100
Source: Government of Kerala, Statistics For Planning, 1977

~I
The share of this sector remained more than 50 percent even during the late '60s.
Needless to say, the share of the sector would have been higher for the years prior to the
formation of the State, but we are left with little comparable data on State domestic product
to establish that. The available information on sector-wise distribution of labour force,
however, can be used as a rough indicator of this. The relevant data is furnished in
table 2.15. More than 55 percent of the total work force was engaged in primary sector
activities in 1951.
Table 2-15 Kerala: Sectoral Distribution of the Working
Force, 1911 and1951
(per cent)
Male Workers Female Workers Sector
1911 1951 1911 1951
Primary 65.1 55.9 56.1 56.8
Secondary 14.3 17.5 27.3 27.3
Tertiary 20.6 26.6 16.6 15.9
All Sectors 100 100 100 100
Source: Centre for Development Studies, 1975, Page-79
The share of agriculture, though it declined over the years, still remained at 50
percent in the early '70s (Jose A.V.1980). It is not only that the primary sector dominated
the overall income and employment during the early decades but more significantly it also
determined the mould and orientation of the activities in the non-agricultural sectors, which
remain more agrarian and traditional.
2.2.1.3 Commercialisation and Marketisation of the
Agricultural Sector
As it is well established in the literature on the region's historical development,
though there had been regional variation, within agriculture, there was an increasing trend
towards commercialisation-the specialisation in commercial perennial crops for sale in the
market. Kerala had commercial contacts with foreign countries from very early times
(Sreedhara Menon, 1967, Pandian, 1990). The crops of the Malabar Coast such as spices and
"to
coconut attracted traders, both inland and foreign, and this in turn stimulated the expansion
of the area under such crops and the production thereof. Like most long distance trade of
antiquity, however, these dealings did not have much of an impact on the day-to-day
economic activities of the people of the region who were engaged in the task of the
production of staple food ie. paddy. With the effective domination of the British in the
region towards the middle of the 19th century and the starting of the plantation economy, the
trend towards the cultivation of plantation and other cash crops set in the
region (Kurian C T,1994). Here Travancore had the lead followed by Malabar and Cochin.
State-owned forests, particularly in the highlands, were thrown open to the British in
Travancore to set up plantations growing tea, coffee, rubber etc. meant for the world market
(lsaac and Tharakan, 1986). Emulating the foreign investment in plantations, increasing
area was put to the cultivation of plantation crops by the local people, mainly Syrian
Christians. From a mere three plantation companies incorporated in Travancore in 1905,
their number rose to 89 in 1945 (Varghese T.C, 1970). Side by side with the expansion of
plantations, there was an increase in the cultivation of other crops suited to the soil like
pepper, ginger, lemon grass, coconuts, turmeric etc which fetched attractive prices in the
world market. Interestingly, this was the effort not so much of large landed proprietors, but
of a vigorous peasantry, with smaller holdings of land, eager to improve its lot.
As entrepreneurs were organising plantations in the highlands of Travancore,
tendencies of a similar capitalistic nature were working in the inland areas of Travancore.
Many enterprising cultivators had begun rec1amationl6 through bunding and dewatering of
the swamps near the coast, specifically Vembanad Lake, for the cultivation of paddy
(Pannikar, P.G.K., et aI, 1977). Similar efforts, though on a smaller scale, had also been
made in Trichur District in the 'Kole' lands. However, these efforts were not enough to
offset the increasing allocation of agricultural resources in favour of non-food crops or the
decline in hill cultivation of grains during the late 19th as well as the early 20th centuries.
Though the period of reference is not fully covered, a rough idea of the magnitude of
commercial agriculture in Travancore-Cochin and Malabar during the colonial period can
be obtained from table 2.16. The Table indicates that of the three regions, Travancore had
the highest percentage of area under cash crops during the period between 1910-11 and
1946-47.
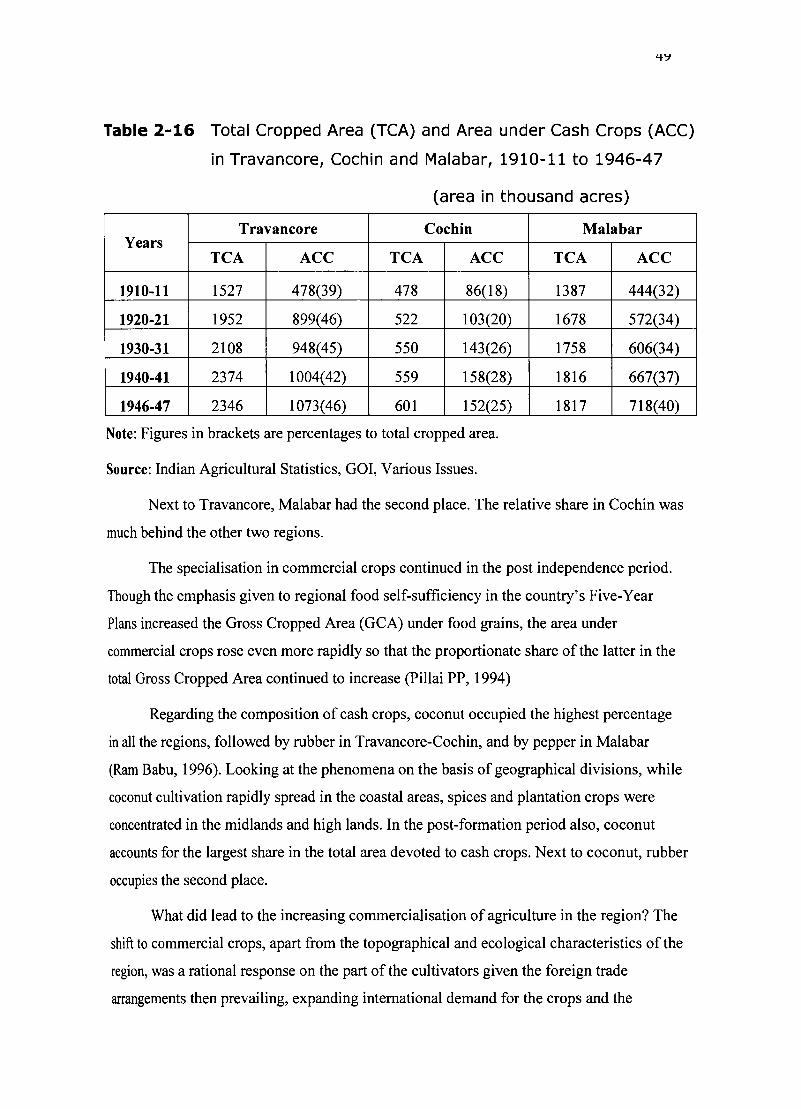
Table 2-16 Total Cropped Area (TCA) and Area under Cash Crops (ACC)
in Travancore, Cochin and Malabar, 1910-11 to 1946-47
(area in thousand acres)
Travancore Cochin Years
TCA ACC TCA ACC
1910-11 1527 478(39) 478 86(18)
1920-21 1952 899(46) 522 103(20)
1930-31 2108 948(45) 550 143(26)
1940-41 2374 1004(42) 559 158(28)
1946-47 2346 1073(46) 601 152(25)
Note: Figures in brackets are percentages to total cropped area.
Source: Indian Agricultural Statistics, GOI, Various Issues.
Malabar
TCA ACC
1387 444(32)
1678 572(34)
1758 606(34)
1816 667(37)
1817 718(40)
Next to Travancore, Malabar had the second place. The relative share in Co chin was
much behind the other two regions.
The specialisation in commercial crops continued in the post independence period.
Though the emphasis given to regional food self-sufficiency in the country's Five-Year
Plans increased the Gross Cropped Area (GCA) under food grains, the area under
commercial crops rose even more rapidly so that the proportionate share of the latter in the
total Gross Cropped Area continued to increase (Pillai PP, 1994)
Regarding the composition of cash crops, coconut occupied the highest percentage
in all the regions, followed by rubber in Travancore-Cochin, and by pepper in Malabar
(Ram Babu, 1996). Looking at the phenomena on the basis of geographical divisions, while
coconut cultivation rapidly spread in the coastal areas, spices and plantation crops were
concentrated in the midlands and high lands. In the post-formation period also, coconut
accounts for the largest share in the total area devoted to cash crops. Next to coconut, rubber
occupies the second place.
What did lead to the increasing commercialisation of agriculture in the region? The
shift to commercial crops, apart from the topographical and ecological characteristics of the
region, was a rational response on the part of the cultivators given the foreign trade
arrangements then prevailing, expanding international demand for the crops and the
)U
possibility of unrestricted imports of food grains at favourable terms of trade (Pannikkar
PGK and Pillai V.K. 1965, Pannikar P.G.K. et aI, 1977). The process was also facilitated by
the agrarian structure that evolved in Travancore and Cochin. Consequent on the tenancy
reforms introduced as well as the emergence of an active land market since the second half
of the 19th century, a wider base of cultivators with land of their own emerged in the region,
particularly in Travancore during the period (Michael Tharakan, 1976) 17.
2.2.1.4 Expansion of Trade and Transport
Concurrent with commercialisation in agriculture, the region experienced a
substantial expansion of its trade-local as well as external- during the post 1850 period18• In
Travancore, Alleppey, the State port of the 18th century, was revived and it acquired the
status of the most important port, next to Bombay in the west coast. Along with this, British
Kochi emerged as an important outlet and inlet for goods. Another commercial trading
centre worth mentioning is Trichur. According to one estimate, between 1850 and 1920,
while world trade increased by around 10-fold, external trade of Travancore expanded by
over 20 times (Ram Mohan, 1997). Another estimate suggests that the total volume of
exports and imports of Travancore increased more than 10-fold during the period between
1870-71 and 1938-39 (Issac and Tharakhan 1986). Significantly, in comparison with
Travancore, the perfomance of Malabar had been far behind. For instance, over the three
decades since 1900, while Travancore registered an annual rate of growth of 6.6 percent in
the volume of trade, Malabar registered a much lower rate of 3.7 percent (Ibrahim, 1976).
Further, though trade began to grow since the mid 19th century, a particularly
powerful impetus to its growth could be observed during the first three decades of the 20th
century, specifically, the interregnum between World War 1 and the Great Depression. This
period witnessed the highest growth in commercial agriculture.
Details on the composition of trade show that the exports consisted of various
agricultural products like coconut, plantation crops like coffee, tea, rubber and various
spices such as ginger, pepper and cardamom. The imports comprised both manufactured
products and food grains. Significantly, rice and paddy constituted 30 to 50 percent of the
import basket during the period (Issac and Tharakhan 1986).
The trend in the ratio of export to import price over the four decades prior to
independence shows that the terms of trade were favourable to Kerala during the period

51
before the First World War. It deteriorated during the war, but started to improve from the
mid- twenties. The trend was maintained till the late thirties, despite global depression. The
Second World War turned the scale again. But, soon after the war, the terms of trade started
looking up (Panikkar, PGK et al. 1977).
Consequent to the expansion of trade, the region witnessed the emergence of a
trading class, hailed mainly from Ezhavas and non-Hindu communities like Christians and
Moplahs. As the European coastal firms virtually monopolized the export and import of all
items of trade through interlocking of directorships and managing agencies, these emerging
trading classes, interestingly, had to be content with the status of middle person traders.
Besides, there was the Western Indian merchants engaged in the import of food materials,
textiles etc. to the region and this further restricted the chance of the domestic traders to
higher levels in trading activity. They were engaged in the collection of plantation crops and
spices for export and selling the manufactured items and food grains internally. The
predominance of small growers of commercial crops and the geographical distance between
the production centers and export centres, gave rise to a long chain of middle person traders.
The exit of foreign traders during the post-independence years was followed by the
emergence of big businessmen in the region (Issac and Tharakan, 1986).
Growth of trade, in turn, led to another significant development in the region; the
expansion of transport and communication (Ibrahim, 1978). From a practically zero-road
situation in 1860, the total length of roads in Travancore increased to about 1000 miles in
1880-81 and to over 2200 miles by 1910-11 (Bright Singh, 1944). Here again, Malabar
lagged behind the Travancore-Cochin region. Estimates of the composite index of transport
development in Kerala during the first three decades of the 20th century reveal that while
Travancore had registered an increase of 52 points over the base year, the increase in
Malabar was only by about 8 points. As for Cochin, the index increased by 19 points over
the period from 1910-11 to 1930-31. Noticeably, while transport and communication
expanded mainly as a concomitant development to trade and other socio-economic
processes in Travancore-Cochin, its development in Malabar was mainly to meet the
military needs (Ibrahim, 1978).
Trade as well as transport experienced further impetus in the post- Independence
years. Thus the share of the two which was l3.4 percent in State SDP in 1960-61 rose to
52
more than 16 percent by the early '70s. Within overall trade, a relatively higher growth of
internal trade had taken place over the period under consideration.
2.2.1.5 Growth of Industrial Activities
The products of various commercial crops such as tea, coffee, cashew and coconut
required certain elementary processing before they could be exported. Hence, there also
emerged agro-processing industries mostly, export oriented in the region. Of these, coconut
based industries like coir making and coconut oil extraction were in the region from a
relatively earlier period and the spurt in commercialisation process during the post-1850s,
in fact, gave a real boost to it. Textiles, fish processing industries, etc. also sprang up. The
overall industrial sector made improvement during the period between 1956 and 1969. But
compared to trade and transport, the growth rate of it was lower (Pillai P.P 1994).
2.2.2 RISING DEMAND FOR FINANCIAL SERVICES
TO BE MET
2.2.2.1 Catering Credit Needs
In the early phase of expanding commercial agriculture and trade, ie; the years
during the turn of the 20th century, the most popular form of money mobilizing and credit
providing enterprise in the State was chitties/kuries. They along with the agricultural as well
as trading moneylenders virtually monopolized the credit market, particularly in the rural
and semi-urban areas. The presence of the moneylenders was more noticeable in wetland
areas like Nanjinad and Kuttanad. Also, in places like Shencotta, where there were no joint
stock banks, their presence was higher. For their agricultural operations as well as
consumption needs, the peasants depended heavily on these moneylenders for finance.
Lending of grain was also a common practice. The small peasants borrowed grain on the
security of the coming crop. The principal and interest rate were repaid in grain at the time
of harvest. Like the specialised moneylenders found elsewhere in the country, the cost of
credit from the agriculturist moneylenders operating in the region also was exorbitantly
high. They followed unscrupulous means to exploit the poor peasants and small traders who
largely depended on them19• The rates of interest varied across localities. The rates were the
highest in southern Travancore (Pandian, 1990, P .156). In Kuttanad, as noted by TBEe, the
agricultural moneylenders charged even upto 70 percent interest annually (GOT, 1930).
)j
Compared to the exploitative nature of the moneylenders, chitty was really a boon to
its clients. The introduction of chitties owes its origin, as established in the literature, to the
desire among people for mutual help and co-operation (Nayar CPS, 1973). During the early
days of its emergence and growth, chitty was organised on a small scale and was mainly
used for consumption purposes and it remained so till the turn of the 20th century. As the
commercialisation of agriculture and the associated activities-trade, in particular- continued
to expand in Travancore-Cochin, these regions experienced rising demand for money and
credit to facilitate the processes. While the cultivators demanded credit for meeting the
expenditure incurred by them for the purchase of land, its development- the reclamation
process which involves bunding, dewatering etc, for instance- as well as meeting the
ordinary expenses of cultivation, the web of tradesmen required funds to give advances to
cultivators/manufactures for cash down purchase of produce and for its transportation to
different market centers. While traders needed credit to meet their payments to the emerging
factory owners the latter in their turn demanded advances to meet their expenditure,
particularly on working capital (Jose A.V, 1980; Gal, 1956). The gestation period of many
of these economic activities being relatively higher, the credit requirement had to be for
comparatively long period also.
Chitties, given the small-scale of their organization, found themselves unable to
meet the rising requirements for financial services that the commercialisation process of
agriculture and its associated developments brought about. Hence, while chitty continued
and even flourished during the early decades of the 20th century, private joint-stock banks,
incorporated in the State, began to make their appearance to cater to the increased financial
needs. They made rapid strides during the interregnum between the First World War and the
Depression when the trade- induced commercialisation process experienced greater
dynamism. As the Great Depression of the 1930s severely affected the prospects of trading
and its concomitant commercial cultivation, naturally, the region's financial sector
witnessed a set back in the post-Depression years. This had been followed by a buoyancy of
the banking sector since the late'30's and it could be directly linked to the boom condition
prevalent in the region during the Second World War and the years immediately succeeding
it.
The Travancore-Cochin region was far ahead of Malabar in these diverse productive
activities and hence in banking development too. Within Travancore, banks sprang up
largely in the midland region-specifically, in areas like Kottayam, Palai, Changanacherry,
Chengannur, Kozhencherry etc,-the centre of cash crop cultivation. They made available
loans mainly to small/middle peasants as well as traders against the security of land and/or
personal security (Ram Mohan 1997). In Cochin they confined their activities largely to
urban areas, financing trade and commerce.
The emergence and growth of these institutions can also be linked to the fact that
there was a general feeling among the Travancore traders as well as agriculturalists that the
outside banks operating in the State were overlooking their interests. Thus in its editorial of
30th of March 1901, the Malayala Manoramarequested the Government to set up
agricultural banks on the metropolitan model. From the next decade, demand was raised for
the setting up of a Government owned bank to assist the development of indigenous trade
and industry. The Keraleeya Vyavasaya Mitra of September 1917, pressing the case, sought
to point out that foreign banks disregarded local interests (Ram Mohan, 1996). To overcome
the resultant problem of the scarcity of capital, the establishment of banks had consistently
been pursued. Also, though there existed the system of government directly engaging in
agricultural credit and indirectly through the cooperative system, they were inadequate on
the one hand and were characterised by multifarious problems on the other as already
noted. Given this, chitties/kuries and the emerging commercial banks were largely resorted
to for meeting the borrowing needs.
The significant contribution of the banks in productive activities, particularly in the
field of agricultural financing, was referred to by TBEC, 1930, on the basis of the mortgage
debt data for 1928-29 (GOT, 1930). The TBEC put the estimate of rural indebtedness in
Travancore at Rs. 25 crores. Based on this estimate and the population estimate of 1931
Census, the per capita debt burden was worked out to be Rs.55 in Travancore. The
Provincial Banking Enquiry Reports of 1930 provide comparable estimates of rural
indebtedness in other States also. Based on the population estimates of 1931 the per capita
debt burden in other provinces of India too are worked out and the same is provided
in table 2.17.
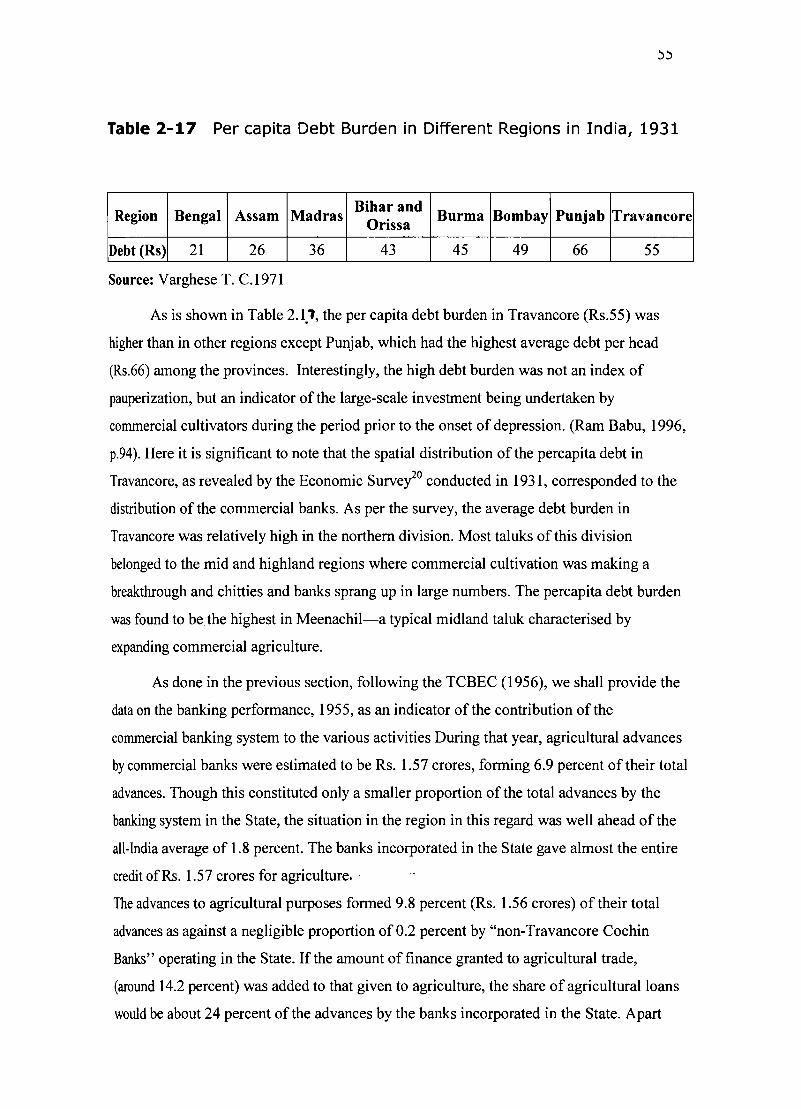
Table 2-17 Per capita Debt Burden in Different Regions in India, 1931
Region Bengal Assam Madras Bihar and
Burma Bombay Punjab Travancore Orissa
Debt (Rs) 21 26 36 43 45 49 66 55
Source: Varghese T. C.l971
As is shown in Table 2.1.1, the per capita debt burden in Travancore (Rs.55) was
higher than in other regions except Punjab, which had the highest average debt per head
(Rs.66) among the provinces. Interestingly, the high debt burden was not an index of
pauperization, but an indicator of the large-scale investment being undertaken by
commercial cultivators during the period prior to the onset of depression. (Ram Babu, 1996,
p.94). Here it is significant to note that the spatial distribution of the percapita debt in
Travancore, as revealed by the Economic Surveyo conducted in 1931, corresponded to the
distribution of the commercial banks. As per the survey, the average debt burden in
Travancore was relatively high in the northern division. Most taluks of this division
belonged to the mid and highland regions where commercial cultivation was making a
breakthrough and chitties and banks sprang up in large numbers. The percapita debt burden
was found to be the highest in Meenachil-a typical midland taluk characterised by
expanding commercial agriculture.
As done in the previous section, following the TCBEC (1956), we shall provide the
data on the banking performance, 1955, as an indicator of the contribution of the
commercial banking system to the various activities During that year, agricultural advances
by commercial banks were estimated to be Rs. 1.57 crores, forming 6.9 percent of their total
advances. Though this constituted only a smaller proportion of the total advances by the
banking system in the State, the situation in the region in this regard was well ahead of the
all-India average of 1.8 percent. The banks incorporated in the State gave almost the entire
credit ofRs. 1.57 crores for agriculture ..
The advances to agricultural purposes formed 9.8 percent (Rs. 1.56 crores) of their total
advances as against a negligible proportion of 0.2 percent by "non-Travancore Cochin
Banks" operating in the State. If the amount of finance granted to agricultural trade,
(around 14.2 percent) was added to that given to agriculture, the share of agricultural loans
would be about 24 percent of the advances by the banks incorporated in the State. Apart
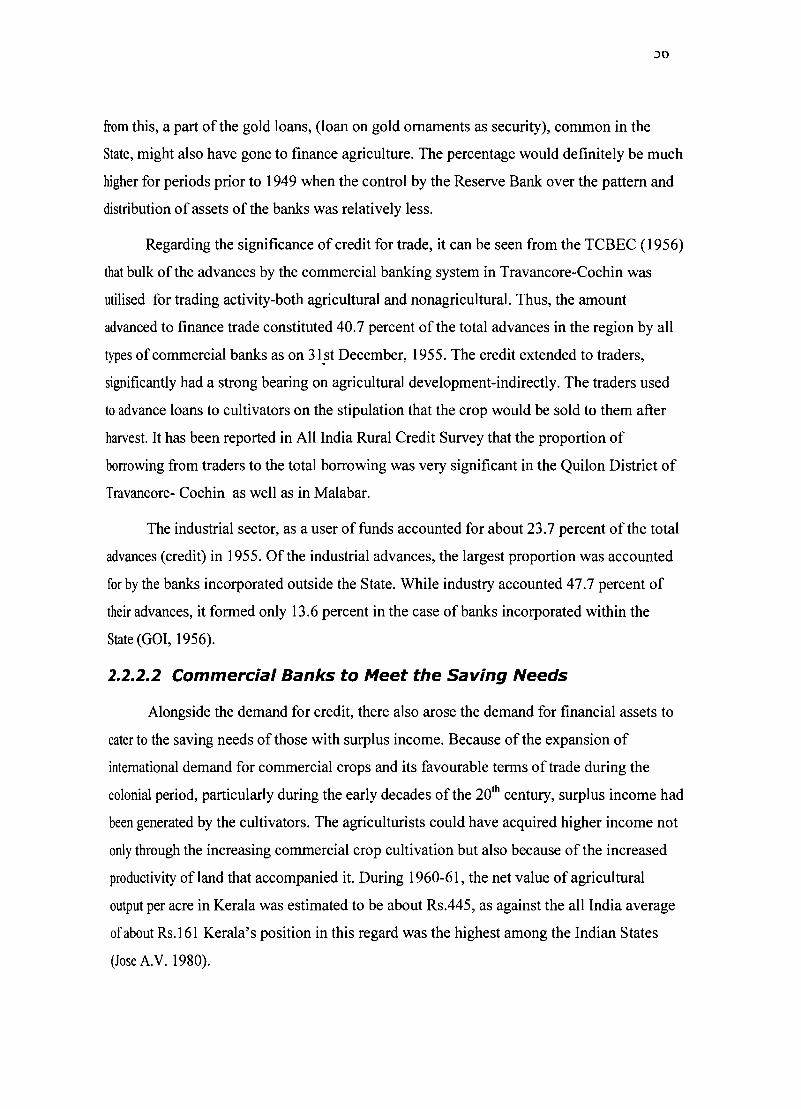
;)0
from this, a part of the gold loans, (loan on gold ornaments as security), common in the
State, might also have gone to finance agriculture. The percentage would definitely be much
higher for periods prior to 1949 when the control by the Reserve Bank over the pattern and
distribution of assets of the banks was relatively less.
Regarding the significance of credit for trade, it can be seen from the TCBEC (1956)
that bulk of the advances by the commercial banking system in Travancore-Cochin was
utilised for trading activity-both agricultural and nonagricultural. Thus, the amount
advanced to finance trade constituted 40.7 percent of the total advances in the region by all
types of commercial banks as on 31.st December, 1955. The credit extended to traders,
significantly had a strong bearing on agricultural development-indirectly. The traders used
to advance loans to cultivators on the stipulation that the crop would be sold to them after
harvest. It has been reported in All India Rural Credit Survey that the proportion of
borrowing from traders to the total borrowing was very significant in the Quilon District of
Travancore- Cochin as well as in Malabar.
The industrial sector, as a user of funds accounted for about 23.7 percent of the total
advances (credit) in 1955. Of the industrial advances, the largest proportion was accounted
for by the banks incorporated outside the State. While industry accounted 47.7 percent of
their advances, it formed only 13.6 percent in the case of banks incorporated within the
State (GOI, 1956).
2.2.2.2 Commercial Banks to Meet the Saving Needs
Alongside the demand for credit, there also arose the demand for financial assets to
cater to the saving needs of those with surplus income. Because of the expansion of
international demand for commercial crops and its favourable terms of trade during the
colonial period, particularly during the early decades of the 20th century, surplus income had
been generated by the cultivators. The agriculturists could have acquired higher income not
only through the increasing commercial crop cultivation but also because of the increased
productivity of land that accompanied it. During 1960-61, the net value of agricultural
output per acre in Kerala was estimated to be about Rs.445, as against the all India average
of about Rs.l6l Kerala's position in this regard was the highest among the Indian States
(Jose A.V. 1980).
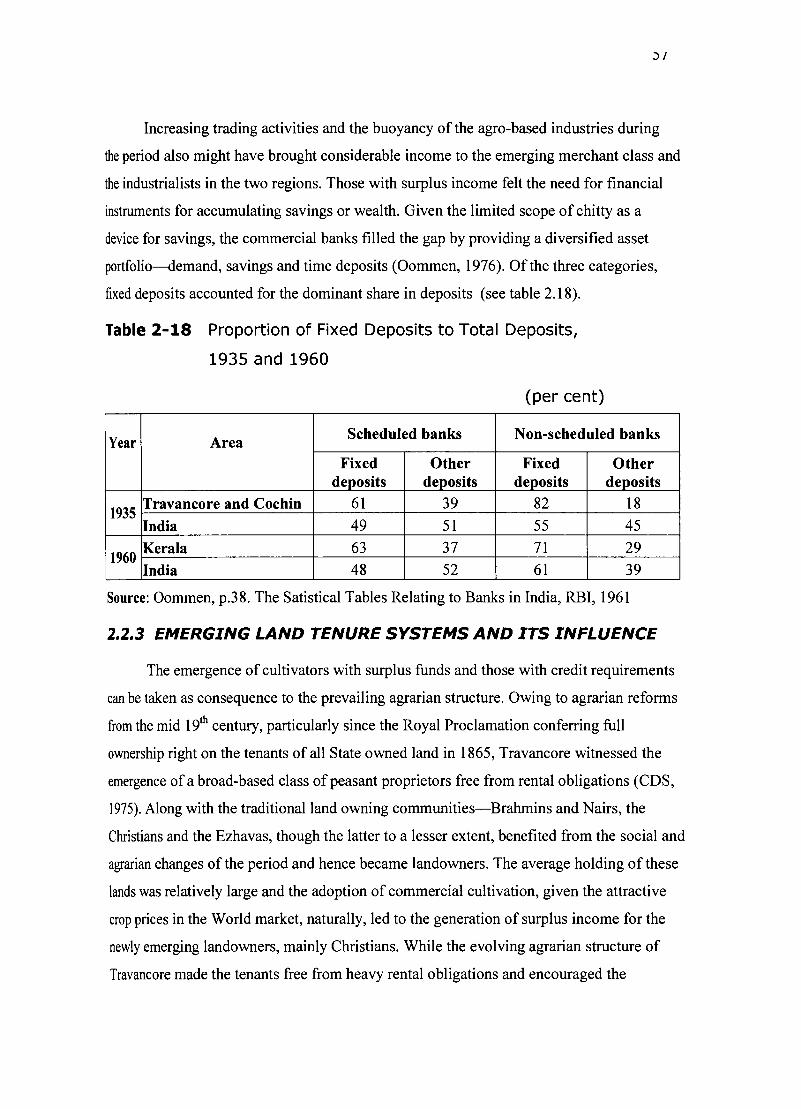
)/
Increasing trading activities and the buoyancy of the agro-based industries during
the period also might have brought considerable income to the emerging merchant class and
the industrialists in the two regions. Those with surplus income felt the need for financial
instruments for accumulating savings or wealth. Given the limited scope of chitty as a
device for savings, the commercial banks filled the gap by providing a diversified asset
portfolio-demand, savings and time deposits (Oommen, 1976). Of the three categories,
fixed deposits accounted for the dominant share in deposits (see table 2.18).
Table 2-18 Proportion of Fixed Deposits to Total Deposits,
1935 and 1960
(per cent)
Year Area Scheduled banks Non-scheduled banks
Fixed Other Fixed Other deposits deposits deposits deposits
1935 Travancore and Cochin 61 39 82 18
India 49 51 55 45
1960 Kerala 63 37 71 29
India 48 52 61 39
Source: Oommen, p.38. The Satistical Tables Relating to Banks in India, RBI, 1961
2.2.3 EMERGING LAND TENURE SYSTEMS AND ITS INFLUENCE
The emergence of cultivators with surplus funds and those with credit requirements
can be taken as consequence to the prevailing agrarian structure. Owing to agrarian reforms
from the mid 19th century, particularly since the Royal Proclamation conferring full
ownership right on the tenants of all State owned land in 1865, Travancore witnessed the
emergence ofa broad-based class of peasant proprietors free from rental obligations (CDS,
1975). Along with the traditional land owning communities-Brahmins and Nairs, the
Christians and the Ezhavas, though the latter to a lesser extent, benefited from the social and
agrarian changes of the period and hence became landowners. The average holding of these
lands was relatively large and the adoption of commercial cultivation, given the attractive
crop prices in the World market, naturally, led to the generation of surplus income for the
newly emerging landowners, mainly Christians. While the evolving agrarian structure of
Travancore made the tenants free from heavy rental obligations and encouraged the

emergence ofa stratum of prosperous farmers in the region, in Malabar and to some extent in
Cochin the period was noted for exploitative land tenure system (see table 2.19)
Table 2-19 Composition of Agricultural Population by
Relationship to Land, 1911 and 1951
(per cent)
Travancore Co chin Malabar Districts
Category
1911 1951 1911 1951 1911 1951
Cultivating land owners 75.3 53.3 15.7 19 7.7 12.7
Tenants 6.8 10.2 44.6 28.1 44.9 39.3
Agricultural Labourers 12.6 34.6 36 48.9 4l.6 44
Rent Receivers 5.3 1.9 3.7 4 5.5 4
Total 100 100 100 100 100 100
Source: CDS, 1975, p 57.
Cochin displayed features similar to Malabar during the early years but there took
place significant improvement over the years.
The emergence of a large number of landowners from the sections of Christians and
Ezhavas was also facilitated by the active land market that emerged in the post -First World
War period. Throughout the period, both the communities steadily bought up land and here
again, the Christians had a critical edge over others (Varghese T C, 1970, P.1 03). The
agrarian reforms and the commercialisation process had strong bearing on the emerging
land market. With the enactment and implementation of tenancy reforms, conferring
absolute ownership right to cultivating tenants on land under their use, land became a
commodity disposable at their will by the end of the 19th century. The commodity aspect of
land had further been established with subsequent reforms affecting inheritance of property,
partition of the joint family property, etc. The surplus generated in commercial agriculture
and trade provided the necessary capital for the transactions in land. The capital
requirements for buying land had also been met from the emerging credit market. Thus the
Agricultural Debt Redemption Committee of Travancore asserts that there can be no doubt
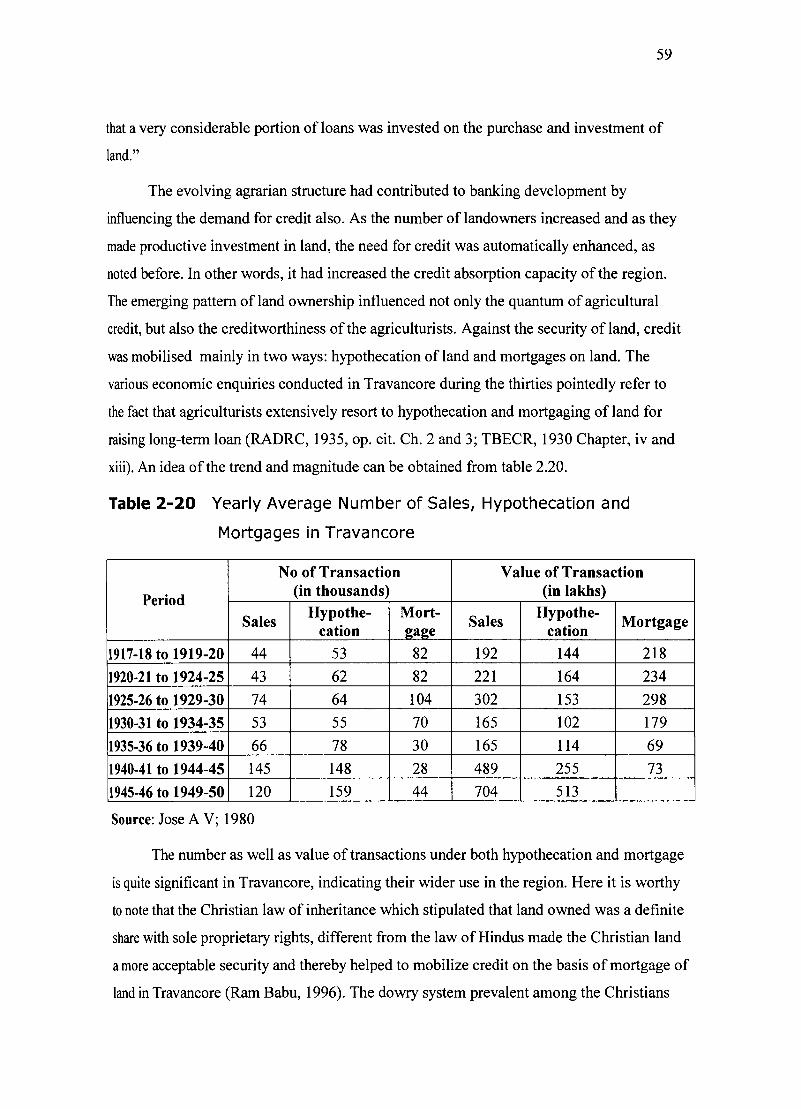
59
that a very considerable portion of loans was invested on the purchase and investment of
land."
The evolving agrarian structure had contributed to banking development by
influencing the demand for credit also. As the number of landowners increased and as they
made productive investment in land, the need for credit was automatically enhanced, as
noted before. In other words, it had increased the credit absorption capacity of the region.
The emerging pattern of land ownership influenced not only the quantum of agricultural
credit, but also the creditworthiness of the agriculturists. Against the security ofland, credit
was mobilised mainly in two ways: hypothecation of land and mortgages on land. The
various economic enquiries conducted in Travancore during the thirties pointedly refer to
the fact that agriculturists extensively resort to hypothecation and mortgaging of land for
raising long-term loan (RADRC, 1935, op. cit. Ch. 2 and 3; TBECR, 1930 Chapter, iv and
xiii). An idea of the trend and magnitude can be obtained from table 2.20.
Table 2-20 Yearly Average Number of Sales, Hypothecation and
Mortgages in Travancore
No of Transaction Value of Transaction
Period (in thousands) (in lakhs)
Sales Hypothe- Mort-
Sales Hypothe-
Mortgage cation . gage cation
1917-18 to 1919-20 44 53 82 192 144 218
1920-21 to 1924-25 43 62 82 221 164 234
1925-26 to 1929-30 74 64 104 302 153 298
1930-31 to 1934-35 53 55 70 165 102 179
1935-36 to 1939-40 66 78 30 165 114 69
1940-41 to 1944-45 145 148 28 489 255 73
1945-46 to 1949-50 120 159 44 704 513
Source: Jose A V; 1980
The number as well as value of transactions under both hypothecation and mortgage
is quite significant in Travancore, indicating their wider use in the region. Here it is worthy
to note that the Christian law of inheritance which stipulated that land owned was a definite
share with sole proprietary rights, different from the law of Hindus made the Christian land
a more acceptable security and thereby helped to mobilize credit on the basis of mortgage of
land in Travancore (Ram Babu, 1996). The dowry system prevalent among the Christians
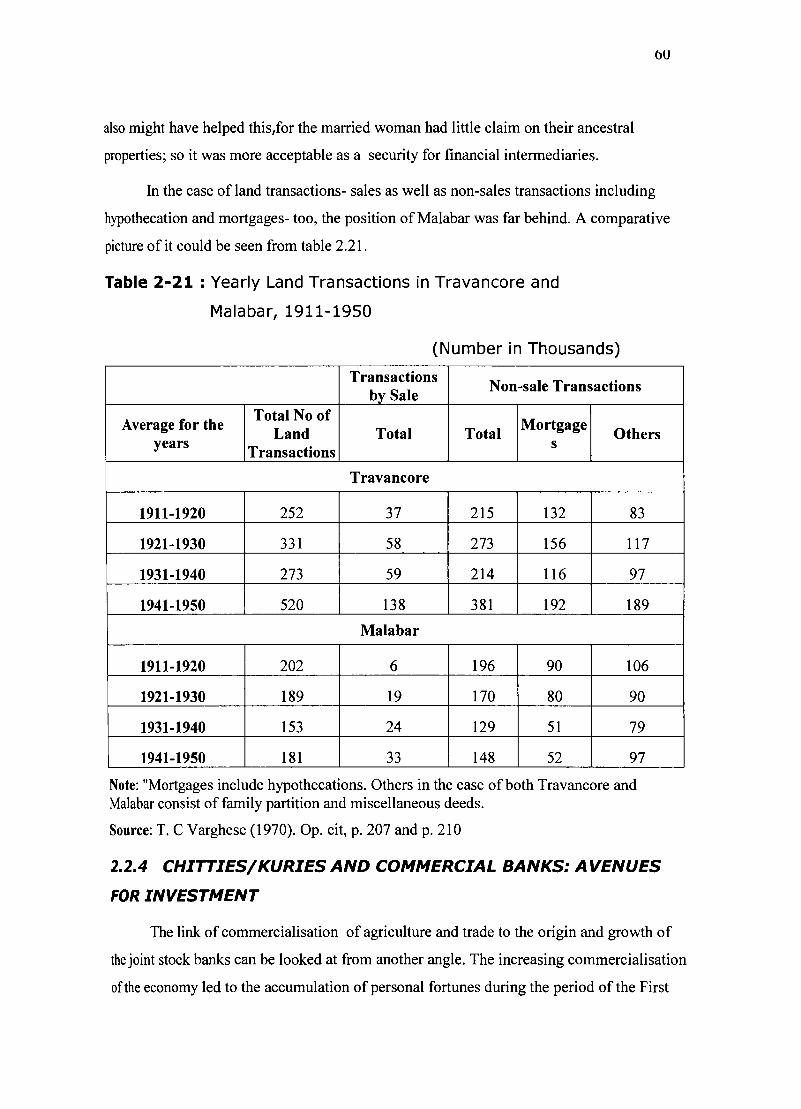
also might have helped this/for the married woman had little claim on their ancestral
properties; so it was more acceptable as a security for financial intermediaries.
oU
In the case of land transactions- sales as well as non-sales transactions including
hypothecation and mortgages- too, the position of Malabar was far behind. A comparative
picture of it could be seen from table 2.21.
Table 2-21 : Yearly Land Transactions in Travancore and
Malabar, 1911-1950
(Number in Thousands)
Transactions Non-sale Transactions
by Sale
Average for the Total No of
Mortgage Land Total Total Others
years Transactions
s
Travancore
1911-1920 252 37 215 132 83
1921-1930 331 58 273 156 117
1931-1940 273 59 214 116 97
1941-1950 520 138 381 192 189
Malabar
1911-1920 202 6 196 90 106
1921-1930 189 19 170 80 90
1931-1940 153 24 129 51 79
1941-1950 181 33 148 52 97
Note: "Mortgages include hypothecations. Others in the case of both Travancore and Malabar consist of family partition and miscellaneous deeds.
Source: T. C Varghese (1970). Op. cit, p. 207 and p. 210
2.2.4 CHITTIES/KURIES AND COMMERCIAL BANKS: AVENUES
FOR INVESTMENT
The link of commercialisation of agriculture and trade to the origin and growth of
the joint stock banks can be looked at from another angle. The increasing commercialisation
of the economy led to the accumulation of personal fortunes during the period of the First

01
World War for those who engaged in the cultivation of commercial crops and trading
activities. In other words, commercialisation of the economy had created one of the
essential conditions-the generation of surplus income-for the rise of a nascent
entrepreneurial class, by the twenties. From the base in plantation and trading, they had
diversified into chitties and commercial banking business and to a limited extent to agro
processing industries, particularly coir and other coconut based industries (Raman
Mahadevan, 1994). The relative significance of the financial enterprises in the overall
corporate profile of Travancore during the period under consideration can be shown with
the data furnished in table 2.22.
Table 2-22 Type-Wise Growth of Joint Stock Companies in
Travancore ,1926 - 1935
Total Number of Joint-stock Companies
Banks and Banks as a
Year With Without insurance as a
percentage of insurance insurance
percentage of total business
business business without total business
insurance
1926 156 156 35.90 35.90
1927 225 225 52.89 52.89
1928 314 314 61.78 61.78
1929 381 380 67.19 66.93
1930 421 408 66.98 63.90
1931 672 411 78.57 39.73
1932 943 434 83.03 29.06
1933 646 407 78.17 41.18
1934 446 400 66.59 56.28
1935 415 389 65.06 58.80
Source: T.K Velu Pillai. Op. Cit.
Banks and insurance companies constituted an overwhelming proportion of the total
number of joint-stock companies registered during the decade following the mid-'20s. The
higher number of insurance firms was due to the setting up of provincial insurance
companies profusively during the first half of the '30s. Significantly, these insurance
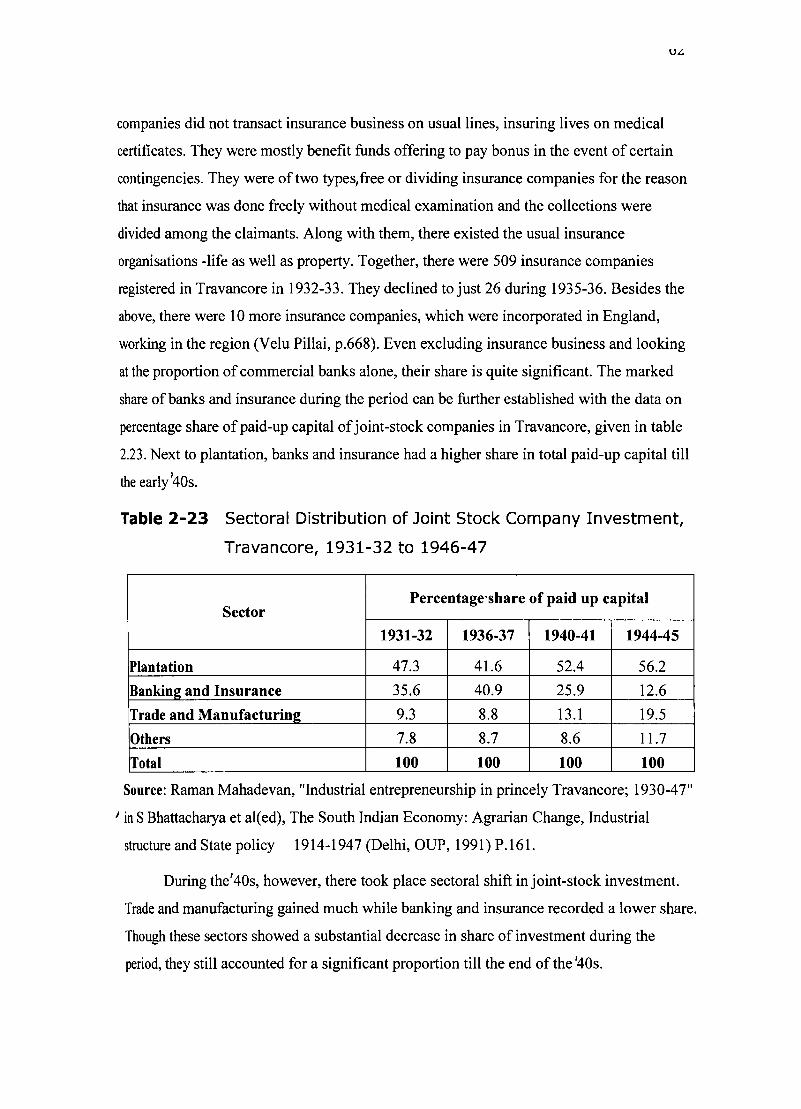
UL.
companies did not transact insurance business on usual lines, insuring lives on medical
certificates. They were mostly benefit funds offering to pay bonus in the event of certain
contingencies. They were of two types/free or dividing insurance companies for the reason
that insurance was done freely without medical examination and the collections were
divided among the claimants. Along with them, there existed the usual insurance
organisations -life as well as property. Together, there were 509 insurance companies
registered in Travancore in 1932-33. They declined to just 26 during 1935-36. Besides the
above, there were 10 more insurance companies, which were incorporated in England,
working in the region (Velu Pillai, p.668). Even excluding insurance business and looking
at the proportion of commercial banks alone, their share is quite significant. The marked
share of banks and insurance during the period can be further established with the data on
percentage share of paid-up capital of joint-stock companies in Travancore, given in table
2.23. Next to plantation, banks and insurance had a higher share in total paid-up capital till I
the early 40s.
Table 2-23 Sectoral Distribution of Joint Stock Company Investment,
Travancore, 1931-32 to 1946-47
Sector Percentage'share of paid up capital
1931-32 1936-37 1940-41 1944-45
Plantation 47.3 41.6 52.4 56.2
Banking and Insurance 35.6 40.9 25.9 12.6
Trade and Manufacturing 9.3 8.8 13.1 19.5
Others 7.8 8.7 8.6 11.7
Total 100 100 100 100
Source: Raman Mahadevan, "Industrial entrepreneurship in princely Travancore; 1930-47"
) in S Bhattacharya et ale ed), The South Indian Economy: Agrarian Change, Industrial
structure and State policy 1914-1947 (Delhi, OUP, 1991) P.161.
During theJ40s, however, there took place sectoral shift in joint-stock investment.
Trade and manufacturing gained much while banking and insurance recorded a lower share.
Though these sectors showed a substantial decrease in share of investment during the
period, they still accounted for a significant proportion till the end of the '40s.
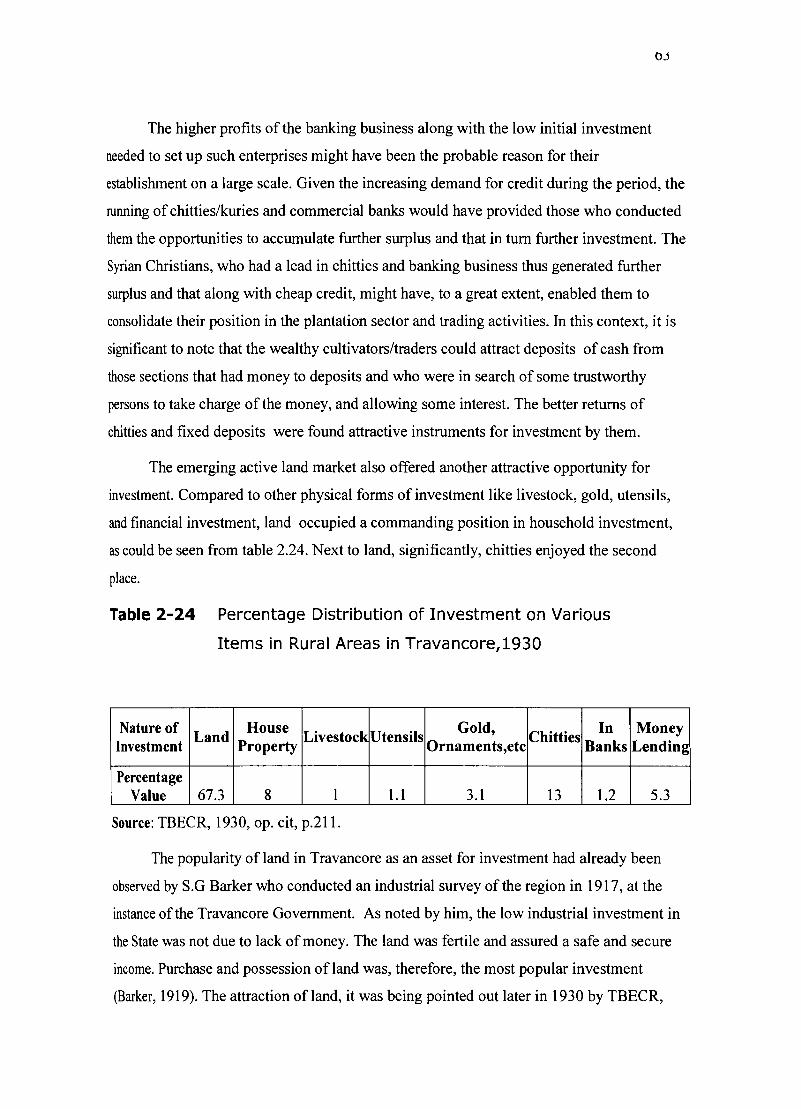
()j
The higher profits of the banking business along with the low initial investment
needed to set up such enterprises might have been the probable reason for their
establishment on a large scale. Given the increasing demand for credit during the period, the
running of chittieslkuries and commercial banks would have provided those who conducted
them the opportunities to accumulate further surplus and that in turn further investment. The
Syrian Christians, who had a lead in chitties and banking business thus generated further
surplus and that along with cheap credit, might have, to a great extent, enabled them to
consolidate their position in the plantation sector and trading activities. In this context, it is
significant to note that the wealthy cultivators/traders could attract deposits of cash from
those sections that had money to deposits and who were in search of some trustworthy
persons to take charge of the money, and allowing some interest. The better returns of
chitties and fixed deposits were found attractive instruments for investment by them.
The emerging active land market also offered another attractive opportunity for
investment. Compared to other physical forms of investment like livestock, gold, utensils,
and financial investment, land occupied a commanding position in household investment,
as could be seen from table 2.24. Next to land, significantly, chitties enjoyed the second
place.
Table 2-24 Percentage Distribution of Investment on Various
Items in Rural Areas in Travancore,1930
Nature of Land
House Livestock Utensils
Gold, Chitties
In Investment Property Ornaments,etc Banks
Percentage Value 67.3 8 I 1.1 3.1 13 1.2
Source: TBECR, 1930, op. cit, p.211.
Money Lending
5.3
The popularity of land in Travancore as an asset for investment had already been
observed by S.G Barker who conducted an industrial survey of the region in 1917, at the
instance ofthe Travancore Government. As noted by him, the low industrial investment in
the State was not due to lack of money. The land was fertile and assured a safe and secure
income. Purchase and possession of land was, therefore, the most popular investment
(Barker, 1919). The attraction ofland, it was being pointed out later in 1930 by TBECR,
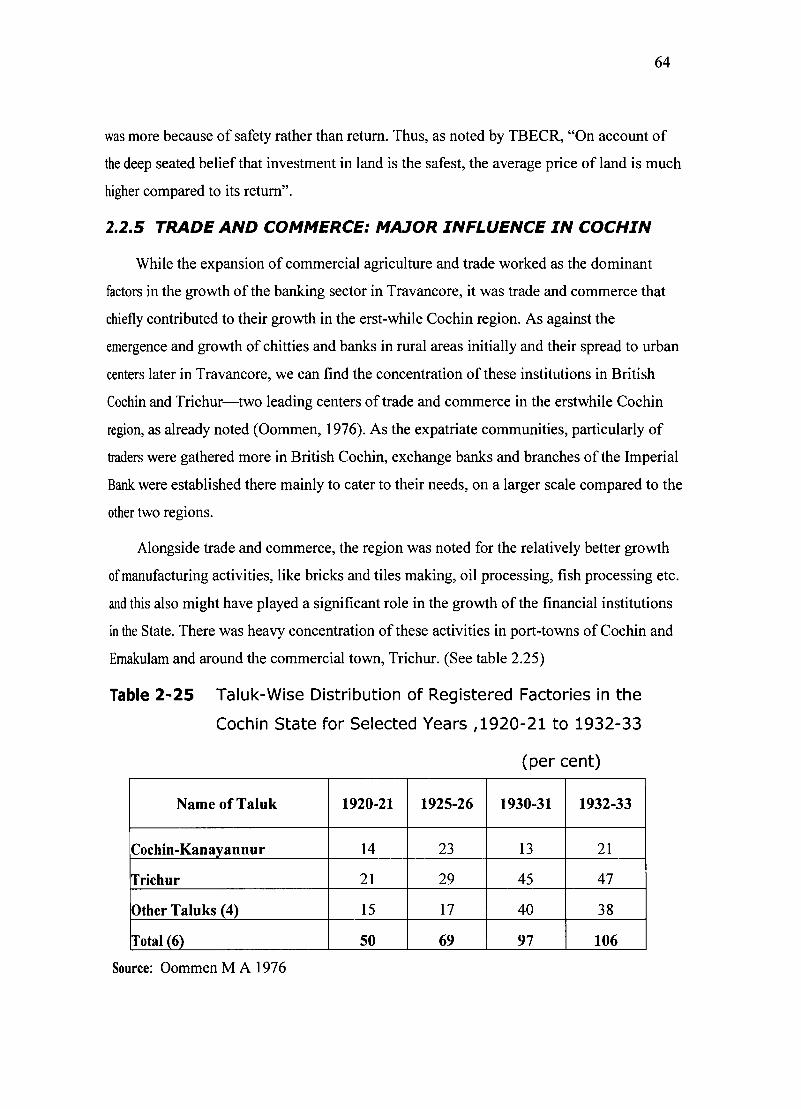
64
was more because of safety rather than return. Thus, as noted by TBECR, "On account of
the deep seated belief that investment in land is the safest, the average price of land is much
higher compared to its return".
2.2.5 TRADE AND COMMERCE: MA.JOR INFLUENCE IN CO CHIN
While the expansion of commercial agriculture and trade worked as the dominant
factors in the growth of the banking sector in Travancore, it was trade and commerce that
chiefly contributed to their growth in the erst-while Cochin region. As against the
emergence and growth of chitties and banks in rural areas initially and their spread to urban
centers later in Travancore, we can find the concentration of these institutions in British
Cochin and Trichur-two leading centers of trade and commerce in the erstwhile Cochin
region, as already noted (Oommen, 1976). As the expatriate communities, particularly of
traders were gathered more in British Cochin, exchange banks and branches of the Imperial
Bank were established there mainly to cater to their needs, on a larger scale compared to the
other two regions.
Alongside trade and commerce, the region was noted for the relatively better growth
of manufacturing activities, like bricks and tiles making, oil processing, fish processing etc.
and this also might have played a significant role in the growth of the financial institutions
in the State. There was heavy concentration of these activities in port-towns of Co chin and
Emakulam and around the commercial town, Trichur. (See table 2.25)
Table 2-25 Taluk-Wise Distribution of Registered Factories in the
Cochin State for Selected Years ,1920-21 to 1932-33
(per cent)
Name of Taluk 1920-21 1925-26 1930-31 1932-33
Cochin-Kanayannur 14 23 13 21
Trichur 21 29 45 47
Other Taluks (4) 15 17 40 38
Total (6) 50 69 97 106
Source: Oommen M A 1976

65
Obviously the persistent demand for financial services from factories led to the
mushrooming of banks in Cochin, and their concentration in the urban areas of the region.
2.2.5.1 Trend of Urbanisation
Concurrent with the growth of modem non-agricultural activities, naturally, there
took place increasing urbanisation in Cochin as revealed by table 2.26 and this further
explains the phenomena of the urban-centered growth of the financial institutions and
markets in Cochin.
Table 2.26 Share of Urban Population in Total Population
(per cent)
Year Travancore Cochin Malabar
1901 6.2 10.8 7.8
1911 6.2 12 8
1921 10 13 7.6
1931 10.8 17.1 7.7
1941 11.4 18.2 NA
Source: Census of India, Various Issues.
In contrast to Malabar and Travancore, the trend of urbanisation was stronger in
Cochin. Regarding industrialisation too, the position of Malabar was much behind. The
important industries that sprang up in the region were textile, tile and timber. The latter two
types of industries were concentrated more in Mangalore and Calicut respectively.
Though relatively less when compared to Cochin, the urbanisation in Travancore too
was progressively increasing over the years and this could be taken as an additional factor
that contributed to the expansion of banking institutions there.
2.2.6 SOCIAL SECTOR DEVELOPMENT
The progress witnessed in the region had yet another significant dimension: the
development of the social sector, particularly, education and health. The achievements that
Kerala made in these sectors prior to independence were well ahead of other princely States
and provinces. The better status of the State in this regard could be seen during the turn of
the last century itself. Thus the data on the literacy rate-the most significant indicator of

00
achievement in education-indicates that the erst-while Travancore-Cochin occupied the
foremost place in the matter ofliteracy of both men and women as early as 1901(Nair
1989). While the number ofliterate persons per thousand populations was about 50 at India,
the corresponding figures in Travancore and Co chin were 124 and 133 respectively.
Over the years since then, the literacy in Kerala had grown at a much higher rate
than that ofIndia. In 1951, the literacy rate in Travancore- Cochin was found to be 41
percent as against 17 percent for all India. Life expectancy at birth was more than 40 years
for the region during that year. For all India, the corresponding indicator was about 10
years less than that of the State. With regard to infant mortality too, the State's position was
much better: 153 per thousand in Travancore- Cochin as against 192 in all India. As in other
indicators of development, in both literacy and health, the position of Travancore and
Cochin was well ahead of Malabar. The better positon that the State had in these indicators
continued in the later years also.
The relatively better position in Kerala with regard to these indicators, to a great
extent, was due to the community development efforts by the Princely State governments
(COS, 1975). The social sector developments that the expanding economy brought with it,
no doubt, had a bearing on the nature and pattern of the historical evolution of the region's
financial factor. Along with trade, commerce, transport and communication, the expansion
of financial activities too created increasing demand for education. Growing demand for
educated persons might have arisen for the running of modem institutional forms like
commercial banks, co-operative banks, insurance business etc. The educational growth in its
turn, might have influenced the attitude of people towards thrift and thereby enhanced the
demand for financial instruments and institutions that facilitated saving. Similarly the
demand for credit and investment activities was facilitated by the spread of education. The
achievement in literacy, no doubt, gives greater awareness regarding the available financial
infrastructure and the services that the various components of the financial system provide.
The relatively higher number and circulation of newspapers, journals and their readership
would have facilitated the spreading of information on innovation in the financial sector and
thereby influenced the demand for accompanied financial services.

0/
2.2.7 INFLUENCE OF SOCIO-RELIGIOUS FACTORS
The social forces had considerable influence on different economic activities of the
State and their influence was more pervasive and pronounced in the financial sector
activities (GOI, 1956). There were numerous instances of chitties as well as banking
institutions emerging on religious and caste basis primarily to cater to the requirements of
their respective members. For instance, by the beginning of the 19th century, several
churches had started kuries, popularly known as pallikuries, in the villages around Trichur
town. It was the popularity as well as the experience with church-managed kuries that
subsequently inspired independent banking ventures in Trichur to some extent. Further, as
seen earlier, many banks used communal or sectarian names like Catholic Syrian Bank Ltd.
the Cochin Nayar Bank Ltd., the Chaldean Syrian Bank Ltd. etc.
Though indirectly, the church organisations in Central Travancore also engaged in
the mobilisation and disbursement of finance (Oommen, 1976). In the initial stages of its
development, there were many instances of chitties being organised as family organisations,
primarily to cater to the financial needs of the family members and the financial functions
being clubbed with other activities of the family. It was at one of the annual meetings of the
Kandathil family (now popularly known as the Malayala Manorama family) that the idea of
forming a joint-stock company was born and it was followed by the recasting of the family
as a new economic entity- the Kandathil Kudumba Y ogam Company (Kandathil Family's
Association Company), established in the 1880s. The Kandathil Company extended
financial support to the family members in their commercial and agricultural activities. The
family involved largely in organizing chitties and lotteries around this time.
Summary and Observations
To sum up, Kerala witnessed historically better banking infrastructure development.
The historical experience of banking growth in the State was better than the then all India
standards. The pattern of its growth was rather unconventional. There was the spread of
banking infrastructure and services to rural and semi-urban areas from the very beginning in
the region particularly in Travancore. A complex set of socio-economic factors determined
the direction, rate and time pattern of the historical evolution of the banking sector in
Kerala. The expanding economy had brought with it the emergence of a large class of new
owner cultivators. Innovations in agriculture and industry, development of transport and
communication infrastructure, growth in trade, population growth, urbanisation,
improvements in education and health etc contributed to banking development. Of the
flurry of economic activities and the resultant development processes, the trade induced
commercialisation process of agriculture stands out as the most significant one, because it
was the prime-mover of the developments experienced in other sectors.
The process of commercialisation led to increase in prices and profits as well as
growing demand for financial services-credit, instruments for saving and investment, etc.
Among the financial needs of the economy, the demand for credit assumed crucial
significance. It is largely in order to meet the financial needs emanating from the trade
driven commercialisation of agriculture that the indigenous financial institutions in the
form of chitties and joint-stock banks emerged and grew in the State. The financial
operations of these institutions strengthened the above process further. The growth trends of
banking and other financial intermediaries, given the leading role that the trading activities,
particularly external trade, played in the economy during the period, were ultimately
determined by the ebb and flow of the trading activities.
The setting up of a large number of financial intermediaries in the form of
chitties/kuries, private joint-stock banks, etc, was essentially an extension of the investment
activities-trade, plantation-etc. that were in vogue. Though the demand for financial
services, particularly credit, provided the necessary support for their wider growth, beneath
such an association, there existed another crucial factor that need to be internalized: the
possibility of making quick disproportional pecuniary gains. The setting up of financial
enterprises offered opportunities for higher returns, even more than that possible from trade
or plantations. The financial institutions lent out progressively to trade and other activities
like commercial agriculture, transport etc, which were essentially trade- driven as well as
trade -inducing.
The economic transformation in the form of the evolution of and trade in the
"commercial crops" led to the integration of the regional economy with the external world
with the national and international economies. The process of integration, in turn, led to
further commercialisation and the two processes facilitated each other in a cumulative
manner. The commercial banking sysem developed as an integral component of these
processes. The developments in the form of banking and other institutions, markets and
instruments, on their part, contributed to strengthening the external orientation of the State
economy further. While Travancore-Cochin experienced expansion of economic activity
and concomitant buoyancy of the banking sector, there was near stagnation, in the Malabar
region, in the growth of both of them. Considering the State as a whole, it implies
unevenness in banking growth historically.

70
End Notes
1. The State is a rather narrow strip of land with the Arabian Sea on the west and the
Western Ghats on the east. The total length is about 590 kilometers and the width
varies from 35 km to 120 km. Even within this small width, the topography and
physical characteristics vary distinctly from east to west. From the Ghats, the land
slopes steeply to western border, where there is an unbroken coastline. According to
the nature of the terrain and other physical features, the State can be divided into
three regions longitudinally, viz. lowlands, midlands and highlands. The area of the
lowland is the smallest; lagoons and backwaters cover a large part of it. The land is
suitedfor the cultivation of coconut, paddy etc. On the sandy coastline are found
valuable mineral deposits - illmenite, rutile, zircon, sillimanite, etc. The midlands
comprise of hills and dales. Besides various food crops like rice and tapioca many
cash crops like pepper, ginger and rubber are grown there. The highlands have the
largest area, and are suited for plantation crops like tea, coffee, rubber and
cardamom. The availability of water everywhere has led to a settlement pattern,
which is rather unique to Kerala. People in the State, unlike elsewhere in the
country, do not live in clusters. The population is widely distributed The settlement
pattern has led to the rural-urban continuum in the State.
2. Malabar came under the British authority in the 1780s. The region was unified by
the British into a single administrative unit and was made a part of the Madras
Presidency in 1800. Though the British paramountcy was established in Travancore
and Cochin during the same period, the two regions were allowed to remain
princely States, to be ruled under strict British guidance and control.
3. When the State ofKerala wasformed on Nov. 1, 1956, on linguistic basis, it
consisted only of9 districts: Trivandrum, Quilon, Alleppey, Kottayam, Ernakulam,
Trichur, Palghat, Kozhikode and Canannore. Consequent on the reorganization of
the districts over the years, now there are 14 districts in the State. Malappuram
district came in to existence on June 16, 1969 by carving out Ernad taluk and
portions ofTirur taluk of Kozhikode district and portions of Perintalmanna and
Ponnani taluks of Palghat district. ldduki was formed on January 26, 1972 by
carving out Devikulam, Peerumade and Udambanchola taluks from Kottayam
district and Thodupuzha talukfrom Ernakulam district. Kozhikode was bifurcated
11
and certain taluks were handed over to Malappuram and Wyanad districts. Wyanad
district was formed on 1 November, 1980 combining taluks from Kozhikode and
Cannanore. When the State of Kerala came in to being in 1956, Wyanad was a part
of Cannanore district. Later South Wyanad was added to Kozhikode district. In
order tofulfil the aspirations of the people ofWyanadfor development, North
Wyanad and South Wyanad were joined once again to form the present district of
Wyanad. The district of Pathanamthitta came into existence on 1 November, 1982.
The district includes portions of the erstwhile Quilon, Alleppey and afew villages of
1dukki district. Pathanamthitta, Adoor, Ranny and Kozhencherry are some of the
important areas taken from Quilon district whereas Tiruvalla and Mallappally are
the major places taken from Alleppey district. Lastly, Kasargod was formed from
Cannanore on May 24, 1984.
Travancore broadly consisted of the present day districts ofTrivandrum, Quilon,
Pathanamthitta, 1dukki, Kottayam, and Alleppey. Cochin, broadly consisted of the
present day districts of Ernakulam and Trichur. The erstwhile Malabar district of
Madras Presidency is today divided into the districts of Palghat, Malappuram,
Calicut, Wyanad and Cannanore.
4. The Banking Enquiry Committee of 1930, noted in the context ofTravancore; "One
remarkable feature is that there is no special class of traditional money lenders like
the Nattukottai Chettiars, Marvaris or Mahajans. The village moneylender is
invariably an agriculturist himself', p.157. Such conditions were observed in the
Malabar region also. To quote, "There was no indigenous commercial caste which
specialized in usury such as Chettiars and Banias. Moneylending was carried on
mainly by certain agrarian classes". Prakash Karat, 'Agrarian Relations in
Malabar, 1925-1946, Social Scientist, Vol. 11, No.2, Sept. 1973.p.33.
5. There are regional variations in the use of the term "chit". In Travancore area, it is
called 'Chitty '; in the Cochin and Malabar areas it is popularly called 'Kuri '. In
the other parts of the country it is called 'Chit' or 'Chit Fund'. We use these terms
interchangeably in our discussion.
The Chitties Regulation (J'ravancore) Act of I 918 defines a chitty as follows, "A
chitty means a transaction by which one or more persons hereinafter called the
foreman or foremen enter into an agreement with a number of persons that every
one of the contracting parties shall subscribe a certain amount of money or quantity
72
of grain by periodical instalments for a certain definite period and that each in his
turn as determined by lot or by auction or in such other manner as may be provided
for in the' Variola' shall be entitled to the 'prize amount. '
'Variola' is the document containing the articles of agreement between the foreman
and each of the subscribers relating to the chitty. The foreman is the person who
under the Variola, is responsible for the conduct of the chitty.
6. Logan who was Collector of the Malabar district in the erstwhile Madras
Presidency writes: "Another curious custom has come down from ancient times and
is stilljlourishing ... . Anyone desirous of raising a considerable sum of money for
some temporary purpose invites his friends to join him in what is called a kuri and
lottery ... " (Logan 1887 Voll, page 173). The book was first published in 1887 as
The Malabar Manual by him. The Government of Madras reprints it as A Collection
of Treaties, Engagements and Other Papers of Importance Relating to the British
Affairs in Malabar in 1951.
Sim Cox records: "The Dravidian kuri or lottery is said to have been handed down
from very ancient times, and it is still commonly resorted to by anyone desiring to
raise a sum of money for some special purpose, such as a daughter's marriage ... A
feast is always given by the recipient of the lump sum .... " (E.JSim Cox, Primitive
Civilizations or Outlines of the History of Ownership in Archaic Communities, Swan
Sonnenschein and Co., London, 1894, VoU, page 568).
7. In the case of 'Lot Chitties', the prized subscriber is decided by casting lots whereas
in the case of 'auction chitties', the person who offers to pay the highest discount for
the prize amount is described as the prize winner.
8. A similar development was found in Maharashtra where banks evolved out of the
'bishis', a mutual credit institution commonly found in Kolhapur district in the early
Bombay State (Krishnan, 1959. p. 170).
9. K. C Mammen Mappillai who later started the Travancore National Bank Ltd. was
the son of K.I Ch.erian. The Quilon Bank was founded later by CP. Mathen, son of
Paulose. About his father's Tiruvalla Bank, CP Mathen said, "Even to its founder,
my father, it was more the experimental verification of an idea much in advance of
/j
his time than the probable means of any substantial monetary returns. (c.p Mathen,
1947, p.34).
10. Banks included in the second schedule to the Reserve Bank of India Act are termed
scheduled banks. Banks which carry on the business of banking in any State in
India, excepting the State of Jammu and Kashmir, and which (a) have paid-up
capital and reserves of an aggregate, real or exchangeable, value of not less than
Rs. 5lakhs, (b) are companies as defined in section 2 (2) of the Indian Companies
Act, 1913, or corporations or companies incorporated by or under any law in force
in any place outside India and (c) satisfy the RBI that their affairs are not being
conducted in a manner detrimental to the interests of their depositors, are eligible
for inclusion in the second schedule to the RBI Act (RBI, 1954b, p.23-24).
11. During the 50 years period (1893-1944), as many as 15 leading banks in
Travancore were started by members of the Kandathilfamily. They were: 1,
Travancore Bank (1898),2. Thayyil Bank (1900),3. Kandathil Kudumba Yogum
Bank (1900), 4. Parur Bank, 5. Travancore National Bank (1912), 6. Alleppey Bank
(1919), 7. Kerala Bank (1920). 8. Vennikulam Bank (1920), 9. National Union Bank
(1920), 10. Alliance Bank, 11. City Bank, 12. Travancore National and Quilon Bank
(1937), 13. Bank of New India (1944), 14. Finance Bank 15. Trivandrum Union
Bank.
12. The first branch of the Bank of Madras, an important financier of export-linked
trade, was established at British Cochi in 1862. Later in the second half of the
1860s, it opened a branch at Alleppey and it was wound up on 15 August 1875 (A.
K Bagchi 1987, p.385)
13. Established in the twenties, Palai Central Bank was one of the leading banks in
Kerala. It had more deposits than any other local banking institutions. The Palai
Bank was served in addition by the branches of two other scheduled banks, namely
the Travancore Forward Bank and the Kottayam Orient Bank. They too had been
established in the twenties. But in Aug 1960, there was a run on the Palai Central
Bank; it failed and later wound up.
14. The Act, however, had a limited scope, and its application was restricted to primary
co-operative credit societies. In 1912, the Government of India, with a view to
enlarging the scope of the Act passed the co-operative Societies Act (Act 11 of
74
1912}. Other than credit societies, it also contained provision Jor the registration oJ
secondary organization such as central banks, supervising unions as well as non
credit societies. The Act was in Jorce in the British India and it has provided the
framework Jor most oJ the State legislation concerning co-operatives. In
Travancore, the Travancore Co-operative Societies Regulation X oJ 1914, Jollowed
this Act. While a three tier co-operative credit system comprising the State Co
operative Banks at the apex level, the central banks or bank unions financing the
primary societies at intermediate level and the primary credit societies as the basic
unit was adopted as the short term credit structure in majority oJ the States,
Travancore and Cochin Jollowed a two tier system without the apex bank. The
central bank assumed the role oJ the apex bank in the two region's co-operative
credit system. However in-between the central bank and the rural primary societies
there existed taluk banks, interlinking the two. The long-term credit structure, as
elsewhere, consisted oJ primary land mortgage banks and central land mortgage
banks.
15. The committee conducted the first All India Rural Credit Survey (AIRCS) in 1954.
According to the Survey, co-operation in the country had Jailed, but co-operation
must succeed. It Jailed because oJ Junctional, structural and administrative deJects,
deJault oJ suitable personnel, lack oJ training, a background oJ illiteracy, the grave
and chronic deficiency in roads, storage and other vital economic requirements. But
the Jundamental reason is socio- economic in character.
16. Kuttanad region had a history oJ backwater reclamation Jor paddy cultivation, but
the scale oJ operation was small until the 1870s. Large scale reclamation began
towards the end oJ the 19th century with generous support and encouragement from
the State. The State support Jor reclamation consisted oJ changing the water course
of main canals, simplifying procedures Jor granting permission, tax concessions,
loans and subsidies. By 1900, around 5500 acres were reported to have been
reclaimed. As a result oJ an objectionfrom the then Government oJ Madras due to
the silting up oJ the Cochin Port, there was an interruption to the process oJ
reclamation during the turn oJ the second decade oJ the 20th century. The situation
was resolved in 1912 and reclamation resumed. The total area brought under
cultivation through the process was estimated to be 11250 hectares ie. a little over
onefifth oJthe area in Kuttanad. (Pillai and Panikkar, 1965, p.14-22)
I)
17. It is suggested that the regional differences in population growth and the
resultant inter-regional migration of population within Kerala, also
contributed to the expansion of commercial cultivation. (Michael Tharakan, 1976).
18. The expansion of trade stimulated the commercialisation process in agriculture but
the former can rightly be considered as a natural sequel to the increasing
commercialisation of agriculture as well. It can also be attributed to several
commercial and administrative reforms implemented in Kerala in the late 19th
century. Studies examining the expansion of trade during the pre-independence
period suggest that the political stability of Travancore as well as Cochinfrom the
latter part of the I1h century, the creation of an extensive canal and road network
and ports by rulers and numerous reforms of trade regulation initiated by the British
from 1856 onwards paved the way for its dynamism.
19. An account of the style of operation of the moneylenders is given by Nagam Aiyah: H
In November (Thulam and Vrischigam) the ryot borrows the paddy on the security
of his coming crop. In April (Kumbham and Meenam) is the harvesting and then the
paddy is measured back to the creditor with 20 percent interest. The creditor comes
to the harvesting field with his own measure and with a canoe to take the paddy due
to him, as did Shylock with his knife and pair of scales. The creditors' measure is 10
percent higher than the one with which he measured out paddy in preceding
November which, added to 20 percent interest, enables the creditor to make
something like 30 percent on interest and the gain thus made, let us say, 130 paras
upon the 100 paras originally lent, is lent again to the poor cultivator under the
same terms in April to be returned to the creditor with another 20 percent in the
following September (Kanni). The year's interest thus accruing is about 60 to 70
percent on the whole n. (Nagam Aiyah, Travancore State Manual, pp. 153-1 54).
20. The Economic Survey ofTravancore conducted in 1931, estimated the total rural
debts outstanding in Travancore at Rs. 17.45 crores (Census of India 1931, vol.
xxviii, Travancore, part I, report appendix iv. P.487).