Embed Size (px)
Citation preview

38
CHAPTER 2
EXPERIMENTAL
2.1 SYNTHESIS OF CATALYSTS
2.1.1 Materials and Glassware
Commercial chromium(III) nitrate nonahydrate, potassium persulphate, sodium
thiosulphate, potassium iodide, silver nitrate and concentrated sulphuric acid were
purchased from R&M Chemicals Ltd. The chromium(III) nitrate salt was kept in dry box to
prevent moisture. Toluene, chloroform, concentrated hydrochloric acid, glacier acetic acid
and chloro-substituted acetic acids were purchased from Merck. All the chemicals and
solvents were analytical grade and were used as received. All the glassware were cleaned
thoroughly before used. Flat bottom flasks and magnetic stirrers were kept in the drying
oven. Figure 2.1 showed the reflux set up for the synthesis of chromium(III) complexes.
Figure 2.1: Apparatus set-up for the synthesis of
chromium(III) complexes
39
2.1.2 Synthesis of Chromium(III) Oxo-Trinuclear Carboxylate Complexes
The complexes of chromium(III) with acetic acids, and substituted acetic acids were
prepared by modifications of known methods1,2.
Chromium(III) oxo-trinuclear carboxylate complexes were synthesized by reacting
chromium(III) salts of nitrate with an excess of carboxylic acids.
(a) Chromium(III) Monocholoroacetate Complex,
[Cr3O(ClCH2COO)6.3H2O]NO3.3H2O
Mixture of chromium(III) nitrate nonahydrate, Cr(NO3)3.9H2O and monochloroacetic acid
(solid, m.p. 62-64°C) at molar ratio of 1:10 was refluxed for 8hours. Brown fume of NO2
of was evolved after an hour. The hot green solution was filtered at once and left to cool to
room temperature. Green powdery product was formed upon cooling. Excess of
monochloroacetic acid was removed by washing with chloroform. The product was dried in
a vacuum oven at 60°C for 1 day. They were then stored in a dessicator.
(b) Chromium(III) Dichloroacetate Complex,
[Cr3O(Cl2CHCOO)6.3H2O]NO3.H2O
Chromium(III) nonahydrate and dichloroacetic acid and in a ratio of 1:13 were heated to
melt and then refluxed for 15 hours. Brown fume was evolved during the reaction. The
green solution obtained was filtered and cooled to room temperature. It was concentrated
by prolong standing for 2 weeks and a green product was obtained. Excess dicholoroacetic

40
acid was removed by washing with chloroform and the complex was dried in vacuum oven
at 60 ºC for 1 day.
(c) Chromium(III) Trichloroacetate Complex,
[Cr3O(Cl3CCOO)6.3H2O]NO3.2H2O
Interaction between chromium(III) nitrate and trichloroacetic acid salt gavetrichloroacetate
chromium(III) complex. The complex was easily obtained by refluxing the reagents in the
ratio of 1:6 for 10 hours. Green product was formed during synthesis.
The complex was filtered and washed with chloroform to remove excess
trichloroacetic acid. The products were dried in the vacuum oven at 60°C for 1 day.
(c) Chromium(III) Acetate Complex,
[Cr3O(CH3COO)6.3H2O]NO3.7H2O
Chromium(III) nitrate salt was refluxed with glacier acetic acid, CH3COOH at a ratio of
1:13 for 13 hours. Brownish fume was evolved during the reaction. Green solution was
obtained after the reaction and it was filtered hot at once. The solution was then allowed to
cool to ambient temperature. Dark green solids formed upon cooling. The product was
filtered and washed with chloroform to remove excess acetic acid. The green complex was
dried in vacuum oven overnight at 60°C.

41
2.1.3 Analysis of Chromium Complexes
(a) Titrimetric method
The chromium content of each complex can be analyzed by a titrimetric method2-3
. About
0.20g complex was first decomposed by treating it with concentrated sulphuric acid,
H2SO4. The chromium content was determined iodometrically after oxidizing Cr3+
to Cr6+
with potassium persulphate, K2S2O8. The solution was treated with 2ml silver nitrate
solution (0.10M) to precipitate the chloride ions in the system before excess potassium
persulphate solution was added to the solution mixture. Next, the solution mixture was
boiled gently for 20 minutes to oxidize Cr3+ to Cr6+ (catalyzed by Ag+) and also destroy the
excess K2S2O8. The orange solution obtained was cooled to room temperature. 10ml
sulphuric acid (10%) and 2ml phosphoric acid (10%) were added to acidify the solution.
10ml concentrated hydrochloric acid (HCl) was then added followed by 1.00g potassium
iodide, KI and the mixture was titrated against standardized sodium thiosulphate solution
(0.05M). From the molar concentration of chromium solution obtained by titration, the
chromium content in the complex can then be calculated.
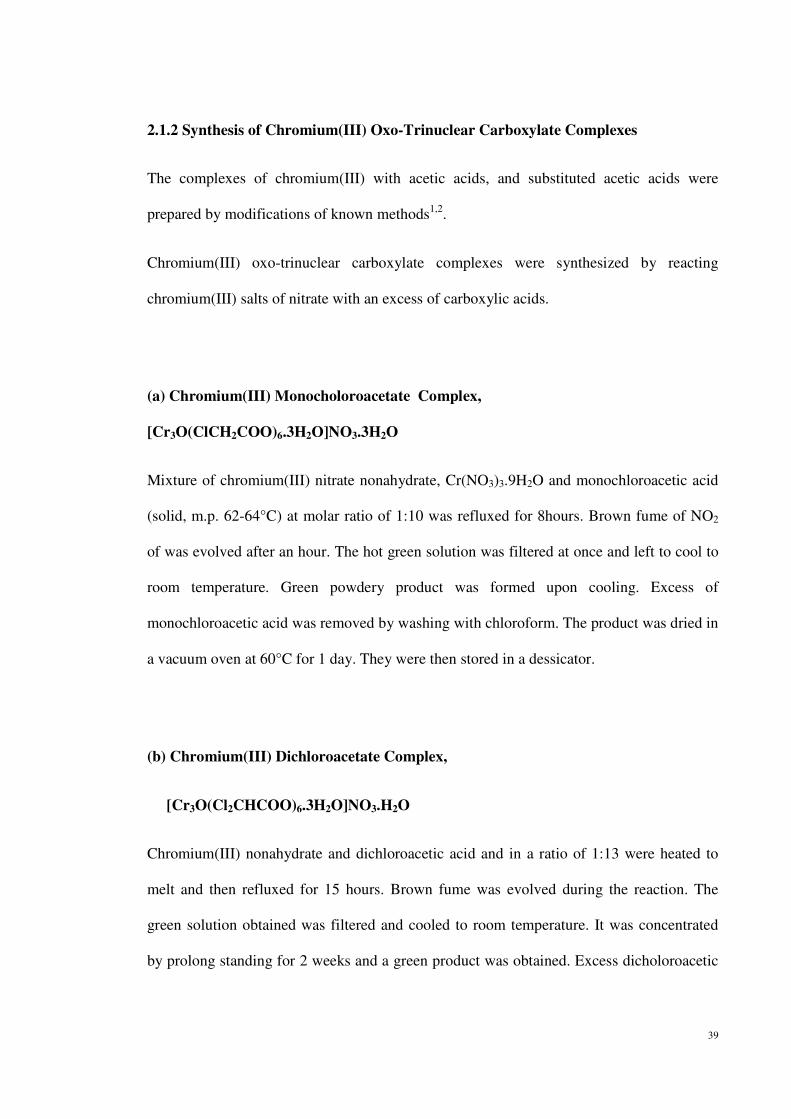
(b) FT-IR Spectroscopy
FT-IR spectra were recorded on a Perkin Elmer Spectrometer model 1600. The chromium
complex was first mixed with KBr powder at approximately 1:100 and pressed into disc.
The spectra were scanned in the range of 4000-400cm-1
.
42
Figure 2.2: Perkin Elmer Fourier Transform Infrared (FT-IR)
Spectrometer model 1600
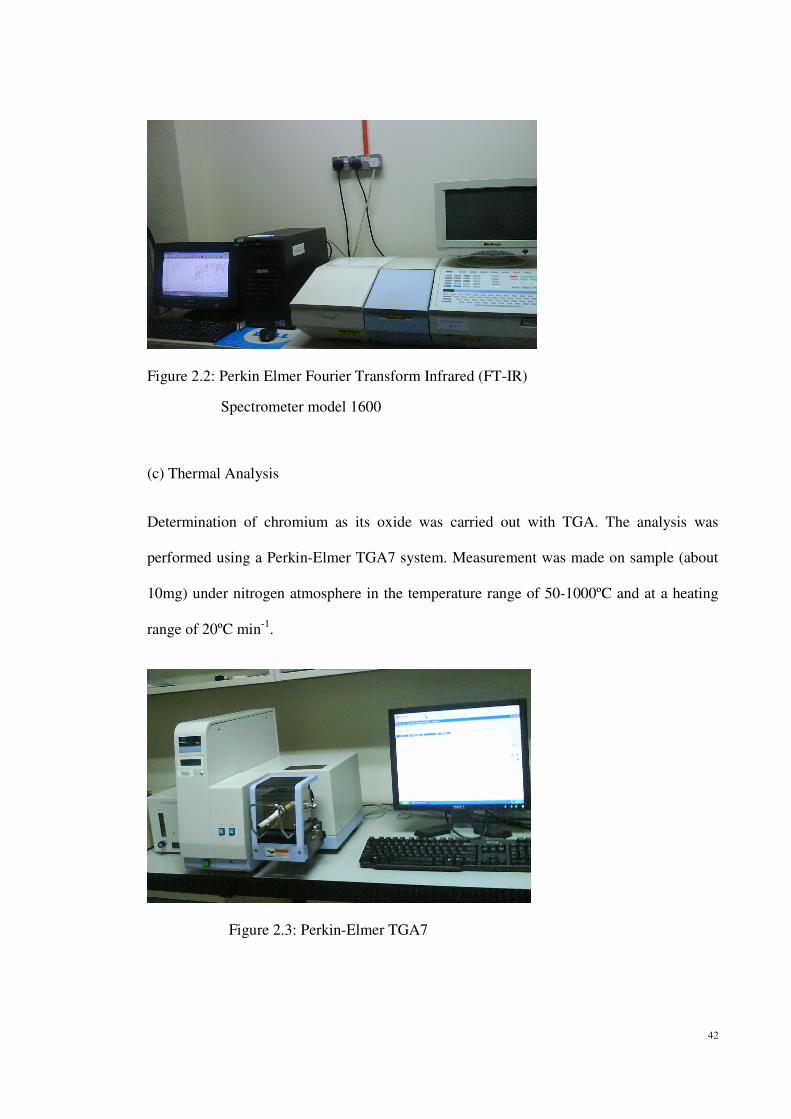
(c) Thermal Analysis
Determination of chromium as its oxide was carried out with TGA. The analysis was
performed using a Perkin-Elmer TGA7 system. Measurement was made on sample (about
10mg) under nitrogen atmosphere in the temperature range of 50-1000ºC and at a heating
range of 20ºC min-1
.
Figure 2.3: Perkin-Elmer TGA7

43
2.2 POLYMERIZATION AND COPOLYMERIZATION
2.2.1 Materials and glassware
High purity ethylene and propylene (99.9%) were purchased from Malaysian Oxygen Ltd
Company. They were dried by passing through successive columns containing activated 3A
molecular sieve and sodium hydroxide pellets. Toluene was purified by distilling over
sodium metal under N2 atmosphere. The distilled toluene was kept dry in a stoppered bottle
over activated molecular sieves (3A).
The synthesized chromium complexes were ground and kept in desiccators. AlEt2Cl
obtained from Aldrich Chemical Company was used as cocatalyst. 0.1546M of the
cocatalyst was prepared in the nitrogen filled dried box using distilled and dried nitrogen as
solvent.
Due to sensitivity of cocatalyst to trace impurities, therefore all glassware, syringes
and needles were cleaned thoroughly in an ultrasonic bath (Sonorex, model no.RK100) for
at least 15 minutes. They were dried in oven at 120°C after washing and rinsing with
distilled water. The gas line was evacuated and flushed with ethylene gas prior to
polymerization.
44
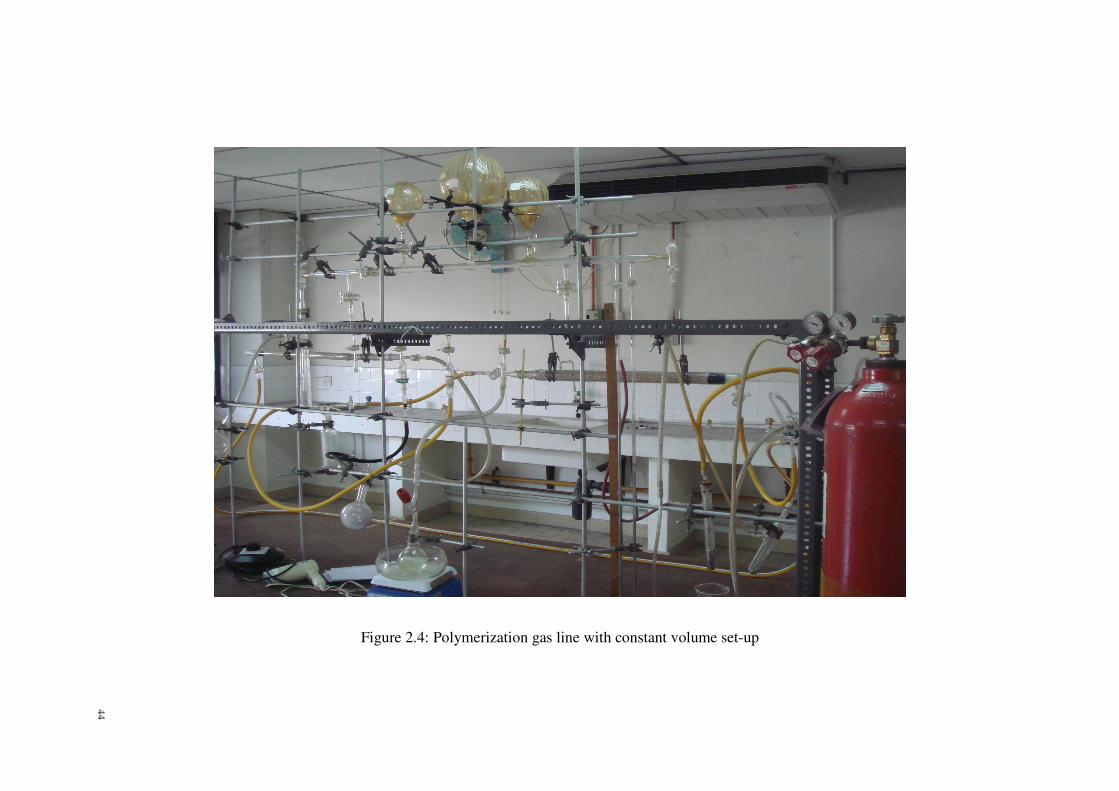
Figure 2.4: Polymerization gas line with constant volume set-up
44
45
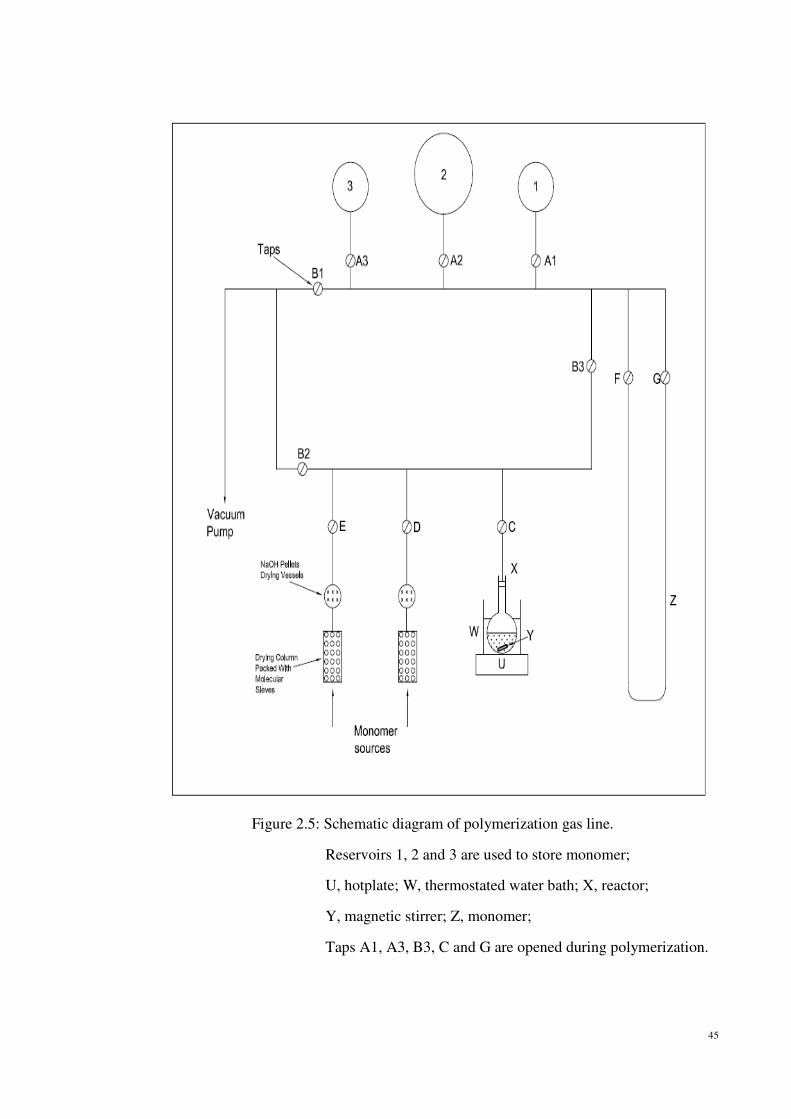
Figure 2.5: Schematic diagram of polymerization gas line.
Reservoirs 1, 2 and 3 are used to store monomer;
U, hotplate; W, thermostated water bath; X, reactor;
Y, magnetic stirrer; Z, monomer;
Taps A1, A3, B3, C and G are opened during polymerization.

46
2.2.2 Constant Volume Setup
Diagram of the polymerization gas line is presented in Figure 2.4 and Figure 2.5. Before the
reservoir flasks were joined onto the line, the volumes have been calibrated by filling water
into the reservoirs2. The volumes of reservoirs 1, 2 and 3 were 1094ml, 4257ml and 1104ml
respectively.
Ideal Gas Law PV=nRT was used to determine the dead volume of the
polymerization line. Firstly, tap A1 for reservoir flask 1 was closed and the gas line was
evacuated to remove air. Then, gas line from tap C up to A1 was allowed to fill with air and
initial pressure, P1 was noted. Tap A1 was then opened to let the air fill in reservoir 1 and
final pressure, P2 was recorded. The procedure was repeated with reservoir flasks 2 and 3.
Assuming P1V1 = P2V2 at constant temperature and V2 = v + V1, where v is the
volume of reservoir flask and V1 is the ‘dead volume’ of the gas line.
Table 2.1: Determination of ‘dead volume’ of the gas line
Reservoir
flask
Volume of flask,
v/ml
Initial pressure,
P1/cmHg
Final pressure,
P2/cmHg
Dead volume,
V1/ml
1 1094 76.00 25.60 556
2 4257 76.00 8.90 565
3 1104 76.00 25.50 557
P1V1 = P2 ( V1 + v )
V1 ( P1 – P2 ) = P2v
V1 = P2v
( P1 – P2 )

47
Table 2.1 shows the ‘dead volume’ determined using different reservoir flasks and
the average ‘dead volume’ of the gas line is 559 ml ± 6ml. In a typical experiment,
normally only reservoirs 1 and 3 were used, hence the total volume of the reservoir flasks
was 2198 ml. The volume of reactor used was 340 ml and the quantity of toluene solvent
was 100 ml. Therefore the total volume occupied by monomer gas for polymerization was
2997 ml.
2.2.3 Ethylene Polymerization
Ethylene polymerization was carried out at room temperature using a gas line with a
constant volume setup. Before the experiment starts, the gas line was evacuated and the
system was flushed with monomer gas to remove any impurities. Monomer gas filled in the
gas line through tap D.
About 0.02g catalyst was weighed and was transferred into a 250ml round bottom
flask. The reaction flask was then loaded with toluene (solvent) followed by the required
amount of AlEt2Cl (cocatalyst). The cocatalyst was being diluted to the concentration of
0.1546M before it was added into the flask by means of graduated syringe. The total
volume of the solvent and cocatalyst was maintained at 100ml. The mixture was left to
‘age’ for 15 minutes before introducing the monomer gas. Due to the mixture order of
catalyst and cocatalyst affects the polymerization result4-5
, the polymerization mixtures
were added in same order to obtain reproducible results. The reaction vessel was stoppered,
removed from the dry box and connected to the gas line at C as shown in Figure 2.5.
During ethylene polymerization process, only reservoir flasks 1 and 3 were used.
Both the reservoirs were filled with monomer gas through taps A1 and A3 while taps A2 ,
B1 and B2 were closed. After that, tap C was opened to introduce ethylene gas into the

48
reaction vessel. The stirrer was turned on and maintained at a constant stirring speed
throughout the reaction. The rate of polymerization was monitored by reading the monomer
pressure drop using mercury manometer in units of cmHg. The polymerization reaction was
carried out for 1 hour unless stated otherwise.
At the end of the polymerization run, tap C was closed and the reaction vessel was
disconnected from the gas line. The line was evacuated in order to remove remaining
monomer gas. The content was poured into 400ml methanol acidified with 5ml
concentrated hydrochloric acid in order to quench the reaction. The mixture was left to stir
for a few hours. Later, the polymer precipitate was filtered with a sintered glass and was
thoroughly washed with methanol. The product was then dried overnight in vacuum oven at
60°C. The yield was noted.
2.2.4 Propylene Polymerization
Polymerization run was carried out under the same conditions as described earlier in
Section 2.2.3 except the monomer gas was changed to propylene gas. The gas line was
filled with propylene gas through tap E.
After the polymerization, the reaction flask was disconnected from the gas line. The
products were poured into a beaker containing 400ml methanol acidified with 5ml
concentrated HCl. The mixture was stirred for a few hours at room temperature. Very little
white precipitation was observed after the stirring. The solution was left to evaporate in the
fume cupboard.
49
2.2.5 Stirring Speed
Earlier works had shown that stirring speed could affect the rate of reaction6-7,9
. Therefore,
it is essential to take precaution step to ensure constant stirring speed by setting the stirrer at
the same marking for all the polymerization run. For heterogeneous catalysts presumably
the rate of monomer gas to reach the solid active sites of the catalysts was diffusion
controlled.
2.2.6 Grinding The Catalyst
In heterogeneous catalyst, the efficiency of a catalyst is dependent on its physical state.
Grinding the catalyst could increase the activity of the heterogeneous catalyst10
presumably
smaller particle size lead to higher surface area thus provide more active centres for
reaction. Catalysts used in this project were ground finely and were kept in dessicator.
2.2.8 Characterization of Polymers
In the synthesis of polymers, relationship between the properties of polymers and their
chemical structure must not be neglected. Thus, polymer characterization has a goal to
improve the performance of the product. Since the development of Ziegler-Natta
catalysts11-15
, polyolefins such as polyethylene and polypropylene with desirable properties
and structures have been successfully made. Techniques used to characterized polymers
include infrared spectroscopy, differential scanning calorimetry (DSC), nuclear magnetic
resonance (NMR), gas chromatography, X-ray diffraction and scanning electron
microscopy (SEM).

50
In this study, polyethylene and polypropylene obtained were characterized using
Fourier Transform Infrared (FT-IR) spectroscopy, attenuated total reflection infrared (ATR)
spectroscopy and differential scanning calorimetry (DSC).
Absorption spectroscopy16 has been utilized to characterize the chemical structure of
polymers such as determination of the various olefinic groups, crystallinity measurements
and polyethylene branching studies. Infrared spectroscopy8-9,17
is the most common
technique of absorption spectroscopy being used in the characterization of polymers. It
detects the vibration characteristics of chemical functional groups in a sample. A Fourier
Transform Infrared (FT-IR) Spectrometer18-19
detects IR radiation when it passes through a
polymer sample. The resulting spectrum provides information on the molecular absorption
and transmission. FT-IR can be used to determine the amounts of component in a polymer
and identify unknown compounds.
Another common type of the infrared spectroscopy used is attenuated total
reflection infrared (ATR-IR) spectroscopy20-21
. The first applications of attenuated total
reflection (ATR) were reported independently by Fahrenfort and HarrickIt. ATR
spectroscopy analyses the surface of materials. The benefit of ATR-IR spectroscopy over
FT-IR spectroscopy is the ability to characterize materials which are too thick.
Differential scanning calorimetry, DSC22
is a thermoanalytical technique to study
the properties of polymers such as melting, crystallization, glass transitions and degree of
crystallinity. DSC is one of the easiest analytical techniques to use as it only requires
minimal sample preparation and quantitative information can be obtained from only a few
milligrams of materials.
51
(a) Infrared Spectroscopy
(i) FT-IR Spectroscopy
Polymer samples were pressed into thin film by Carver hot press at temperature between
100°C and 130°C for 20-30 seconds. The samples were placed between aluminium foil
before pressing. The pressure applied was 8-9 tons. The thin layer obtained was cooled to
room temperature. The samples were mounted onto a cardboard holder and their spectra
were recorded by Perkin-Elmer Spectrum RX1 FT-IR spectrophotometer within the range
500-4000cm-1. The recorded spectra were then analyzed by Perkin-Elmer FT-IR software.
(ii) ATR-IR Spectroscopy
Firstly, infrared transmitting crystal on the Perkin-Elmer Spotlight 400 ATR-IR
spectrometer was cleaned thoroughly. Polymer samples were then placed on the crystal and
force was applied onto the samples. The samples were scanned through the spectrometer at
mid-infrared region (650-1000cm-1
). The spectra obtained were analyzed using Perkin-
Elmer ATR-IR software.
(b) Differential Scanning Calorimetry (DSC)
2-3 mg of polymer samples were encapsulated in an aluminium sample pan and their
weight was recorded. Calorimetric measurements for the samples were obtained using a
Perkin-Elmer Differential Scanning Calorimeter, DSC 7. Polymer samples were heated to
150°C at the rate of 10ºC/min. They were held isothermally for 10 minutes before cooling
back to initial temperature (35°C) at the rate of 5°C/min. The samples were annealed for 5
minutes at 35ºC and were then heated to 150ºC at 10ºC for the second time.

52
Referring to the DSC curve, the enthalpy change (∆H) of the polymers can be
calculated from the area under each peak. The endothermic peak shows melting
temperature (Tm) of the samples while crystallization temperature (Tc) can be obtained from
the exothermic peak.
Figure 2.6: Perkin-Elmer Differential Scanning Calorimeter, DSC 7
2.2.9 Ethylene and Propylene Copolymerization
The constant volume setup for copolymerization of ethylene and propylene was the same as
homopolymerization of ethylene and propylene. The polymerization gas line was shown in
Figure 2.5.
Firstly, the polymerization gas line was evacuated. Known volume of ethylene and
propylene monomers were then separately introduced into reservoirs 1 and 3 respectively.
Initial pressures of the two monomers were noted. The reservoir taps were opened to allow

53
the monomer gases to mix for 1 hour. The total initial pressure was obtained from the
manometer reading.
Ethylene-propylene copolymerization was carried out in a 250ml round bottom
flask at room temperature. About 0.02g catalyst and toluene were transferred into the
reaction flask. Required amount of AlEt2Cl (cocatalyst) was then added to made up to
100ml . The reaction vessel was stoppered, removed from the dry box and connected to the
gas line. The mixture was left to ‘age’ for 1 hour before introducing the monomer gas.
After 1 hour, tap C which connected to the reaction flask was opened to introduce
the mixture of ethylene and propylene monomers into the flask. The magnetic stirrer was
turned on and copolymerization reaction was carried out for 1 hour. Pressure drop during
the reaction was recorded. Copolymerization was terminated by adding acidified methanol.
The product was washed with methanol and was dried overnight in vacuum oven at 60°C.
2.2.10 Characterization of Copolymer
Ethylene-propylene copolymers obtained were characterized using FT-IR spectroscopy and
DSC. The analysis procedures were described in Section 2.2.8.

54
References:
1. Ooi, C. P. ‘The Use of Trinuclear Chromium(III) Complexes as Ziegler-Natta
Catalysts for the Polymerization of Ethylene’, University of Malaya, Kuala Lumpur,
1996
2. Aishah, M. J. ‘Synthesis of Some Chromium (III) Carboxylates and The Use of
These Complexes as Ziegler-Natta Catalysts for the Polymerization of Ethylene’,
Universiti Malaya, Kuala Lumpur, 1995
3. Vogel, A.I. ‘A Textbook of Quantitative Inorganic Analysis’, 3th edn. Longman,
London, 1971
4. Keii, T. ‘Kinetics of Ziegler-Natta Polymerization’, Kodansha-Chapman-Hall co-
pub., London-Tokyo, 1972
5. Burfield, D. R. and Tait, P. J. Polymer 1974, 15, 88
6. Bohm, L. L. Polymer, 1978, 19, 553
7. Liang, C. Y., Krimm, S. and Sutherland, G. B. B. M. The J. Chem. Phys. 1956,
25(3), 543-548
8. Krimm, S., Liang, C. Y. and Shutherland, G. B. B. M. The J. Chem. Phys. 1956,
25(3), 549-562
9. Munoz-Escalona, A. and Parada, A. Polymer, 1979, 20, 474-482
10. Miyazawa, T. ‘The Stereochemistry of Macromolecules’, Ketley, A. D. (ed),
Markel Dekker, New York, 1967, 147-180
11. Ziegler, K., Holzkamp, E., Breil, H. and Martin, H. Angew. Chem. 1995, 67, 541
55
12. Natta, G. J. Poly. Sci. 1995, 16, 143
13. Natta, G. Angrew. Chem. 1956, 68, 393
14. Boor, J. Macromol. Rev. 1967, 2, 115
15. Mandelkern, L. ‘Crystallization of Polymers’, McGraw-Hill, New York – San
Francisco – Toronto – London, 1964
16. Luongo, J. P. Analy. Chem. 1961, 33(13), 1816-1823
17. Bellamy, L. J. ‘Advances in Infrared Group Frequencies’, Methuen & Co Ltd.,
London, 1968
18. Stuart, B. H. ‘Polymer Analysis’, John Wiley & Sons, UK, 2002
19. Arivazhagan, M., Krishnakumar, V., John Xavier, R., Ilango, G. and
Balachandran, V. Spectrochimica Acta Part A: Molecular and Biomolecular
Spectroscopy, 2009, 72(5), 941-946
20. John. Mitchell and Jen. Chiu Anal. Chem. 1975, 47 (5), 289–327
21. Yuji Nishikawa, Tatsuhiko Nakano and Isao Noda Vibrational Spectroscopy, 2009,
49(2) 219-228
22. Mathot, Vincent B. F. ‘Calorimetry and thermal analysis of polymers’, Hanser
Publishers, Munich, 1994