Embed Size (px)
Citation preview
Financial Statements and Cash Flow
In February 2006, CBS Records joined other companies in announcing operating results for the latest quarter. For CBS, the news was not good: Earnings amounted to a loss of $6 per share. Included in the earnings figure was a charge of about $9.4 billion to write down the value of the company’s radio and television businesses. The write-off was nothing new to CBS. The company lost over $18 billion (or about $11 per share) in the same quarter of the previous year, due mostly to write-offs in its radio station and outdoor advertising businesses. The write-offs by CBS were large, but they pale in comparison to those taken by Time Warner, which were
probably the largest in history. The media giant took a charge of $45.5 billion in the fourth quarter of 2002. This enormous write-off followed an earlier, even larger charge of $54 billion earlier in the year. So did stockholders in CBS Records lose $9.4 billion in one quarter as the result of the write-off? Fortunately for them, the answer is probably not. Understanding why leads us to the main subject of this chapter: that all-important substance known as cash flow.
C H A P T E R
2
21
2.1 The Balance SheetThe balance sheet is an accountant’s snapshot of a firm’s accounting value on a particular date, as though the firm stood momentarily still. The balance sheet has two sides: On the left are the assets and on the right are the liabilities and stockholders’ equity. The balance sheet states what the firm owns and how it is financed. The accounting definition that un-derlies the balance sheet and describes the balance is:
Assets � Liabilities � Stockholders’ equity
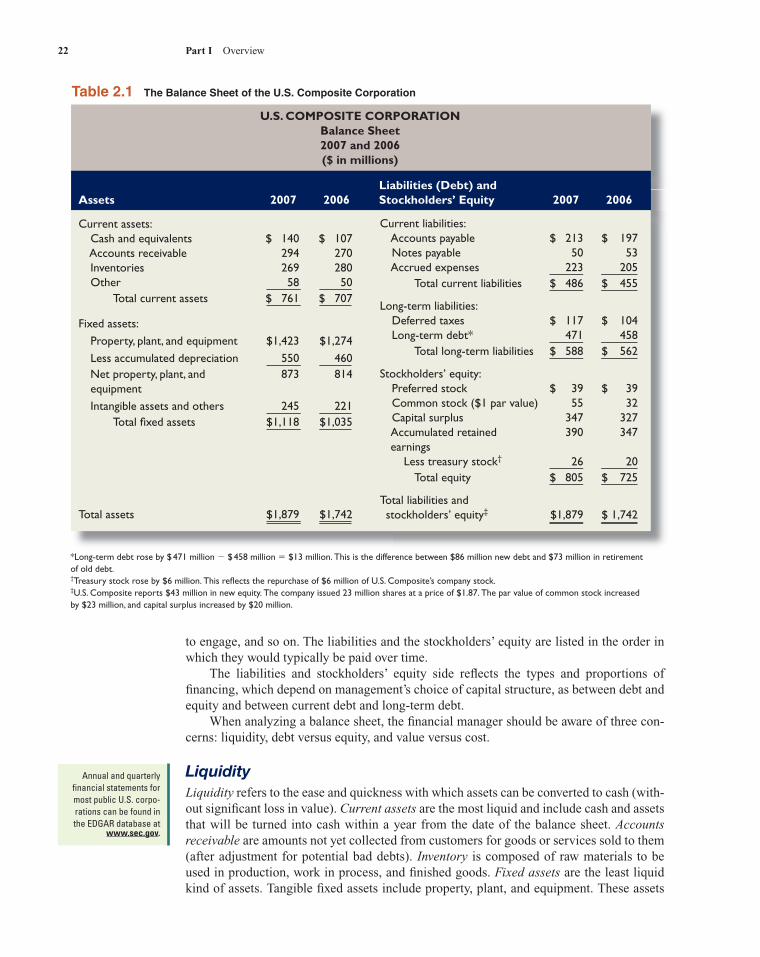
We have put a three-line equality in the balance equation to indicate that it must always hold, by definition. In fact, the stockholders’ equity is defined to be the difference between the assets and the liabilities of the firm. In principle, equity is what the stockholders would have remaining after the firm discharged its obligations. Table 2.1 gives the 2007 and 2006 balance sheet for the fictitious U.S. Composite Cor-poration. The assets in the balance sheet are listed in order by the length of time it normally would take an ongoing firm to convert them into cash. The asset side depends on the nature of the business and how management chooses to conduct it. Management must make deci-sions about cash versus marketable securities, credit versus cash sales, whether to make or buy commodities, whether to lease or purchase items, the types of business in which
Two excellent sources for company financial
information are finance.yahoo.com
and money.cnn.com.
ros05902_ch02.indd 21ros05902_ch02.indd 21 9/25/06 9:28:27 AM9/25/06 9:28:27 AM
22 Part I Overview
to engage, and so on. The liabilities and the stockholders’ equity are listed in the order in which they would typically be paid over time. The liabilities and stockholders’ equity side reflects the types and proportions of financing, which depend on management’s choice of capital structure, as between debt and equity and between current debt and long-term debt. When analyzing a balance sheet, the financial manager should be aware of three con-cerns: liquidity, debt versus equity, and value versus cost.
LiquidityLiquidity refers to the ease and quickness with which assets can be converted to cash (with-out significant loss in value). Current assets are the most liquid and include cash and assets that will be turned into cash within a year from the date of the balance sheet. Accounts receivable are amounts not yet collected from customers for goods or services sold to them (after adjustment for potential bad debts). Inventory is composed of raw materials to be used in production, work in process, and finished goods. Fixed assets are the least liquid kind of assets. Tangible fixed assets include property, plant, and equipment. These assets
Annual and quarterly financial statements for most public U.S. corpo-rations can be found in the EDGAR database at
www.sec.gov.
*Long-term debt rose by $ 471 million � $ 458 million � $13 million. This is the difference between $86 million new debt and $73 million in retirement of old debt.†Treasury stock rose by $6 million. This reflects the repurchase of $6 million of U.S. Composite’s company stock. ‡U.S. Composite reports $43 million in new equity. The company issued 23 million shares at a price of $1.87. The par value of common stock increased by $23 million, and capital surplus increased by $20 million.
Table 2.1 The Balance Sheet of the U.S. Composite Corporation
U.S. COMPOSITE CORPORATION Balance Sheet 2007 and 2006 ($ in millions)
Liabilities (Debt) and Assets 2007 2006 Stockholders’ Equity 2007 2006
Current assets: Cash and equivalents $ 140 $ 107 Accounts receivable 294 270 Inventories 269 280 Other 58 50 Total current assets $ 761 $ 707
Fixed assets: Property, plant, and equipment $1,423 $1,274 Less accumulated depreciation 550 460 Net property, plant, and 873 814
equipment Intangible assets and others 245 221 Total fixed assets $1,118 $1,035
Total assets $1,879 $1,742
Current liabilities: Accounts payable $ 213 $ 197 Notes payable 50 53 Accrued expenses 223 205 Total current liabilities $ 486 $ 455
Long-term liabilities: Deferred taxes $ 117 $ 104 Long-term debt* 471 458 Total long-term liabilities $ 588 $ 562
Stockholders’ equity: Preferred stock $ 39 $ 39 Common stock ($1 par value) 55 32 Capital surplus 347 327 Accumulated retained 390 347
earnings Less treasury stock† 26 20 Total equity $ 805 $ 725
Total liabilities and stockholders’ equity‡ $1,879 $ 1,742
ros05902_ch02.indd 22ros05902_ch02.indd 22 9/25/06 9:28:29 AM9/25/06 9:28:29 AM
Chapter 2 Financial Statements and Cash Flow 23
do not convert to cash from normal business activity, and they are not usually used to pay expenses such as payroll. Some fixed assets are not tangible. Intangible assets have no physical existence but can be very valuable. Examples of intangible assets are the value of a trademark or the value of a patent. The more liquid a firm’s assets, the less likely the firm is to experience problems meeting short-term obligations. Thus, the probability that a firm will avoid financial dis-tress can be linked to the firm’s liquidity. Unfortunately, liquid assets frequently have lower rates of return than fixed assets; for example, cash generates no investment income. To the extent a firm invests in liquid assets, it sacrifices an opportunity to invest in more profitable investment vehicles.
Debt versus EquityLiabilities are obligations of the firm that require a payout of cash within a stipulated pe-riod. Many liabilities involve contractual obligations to repay a stated amount and interest over a period. Thus, liabilities are debts and are frequently associated with nominally fixed cash burdens, called debt service, that put the firm in default of a contract if they are not paid. Stockholders’ equity is a claim against the firm’s assets that is residual and not fixed. In general terms, when the firm borrows, it gives the bondholders first claim on the firm’s cash flow.1 Bondholders can sue the firm if the firm defaults on its bond contracts. This may lead the firm to declare itself bankrupt. Stockholders’ equity is the residual difference between assets and liabilities:
Assets � Liabilities � Stockholders’ equity
This is the stockholders’ share in the firm stated in accounting terms. The accounting value of stockholders’ equity increases when retained earnings are added. This occurs when the firm retains part of its earnings instead of paying them out as dividends.
Value versus CostThe accounting value of a firm’s assets is frequently referred to as the carrying value or the book value of the assets.2 Under generally accepted accounting principles (GAAP), audited financial statements of firms in the United States carry the assets at cost.3 Thus the terms carrying value and book value are unfortunate. They specifically say “value,” when in fact the accounting numbers are based on cost. This misleads many readers of financial statements to think that the firm’s assets are recorded at true market values. Market value is the price at which willing buyers and sellers would trade the assets. It would be only a coincidence if accounting value and market value were the same. In fact, management’s job is to create value for the firm that exceeds its cost. Many people use the balance sheet, but the information each may wish to extract is not the same. A banker may look at a balance sheet for evidence of accounting liquidity and working capital. A supplier may also note the size of accounts payable and therefore the general promptness of payments. Many users of financial statements, including managers and investors, want to know the value of the firm, not its cost. This information is not found
1Bondholders are investors in the firm’s debt. They are creditors of the firm. In this discussion, the term bond-holder means the same thing as creditor.2Confusion often arises because many financial accounting terms have the same meaning. This presents a problem with jargon for the reader of financial statements. For example, the following terms usually refer to the same thing: assets minus liabilities, net worth, stockholders’ equity, owners’ equity, book equity, and equity capitalization.3Generally, GAAP requires assets to be carried at the lower of cost or market value. In most instances, cost is lower than market value. However, in some cases when a fair market value can be readily determined, the assets have their value adjusted to the fair market value.
The home page for the Financial Accounting
Standards Board (FASB) is www.fasb.org.
ros05902_ch02.indd 23ros05902_ch02.indd 23 9/25/06 9:28:31 AM9/25/06 9:28:31 AM
24 Part I Overview
on the balance sheet. In fact, many of the true resources of the firm do not appear on the balance sheet: good management, proprietary assets, favorable economic conditions, and so on. Henceforth, whenever we speak of the value of an asset or the value of the firm, we will normally mean its market value. So, for example, when we say the goal of the financial manager is to increase the value of the stock, we mean the market value of the stock.
2.2 The Income StatementThe income statement measures performance over a specific period—say a year. The ac-counting definition of income is:
Revenue � Expenses � Income
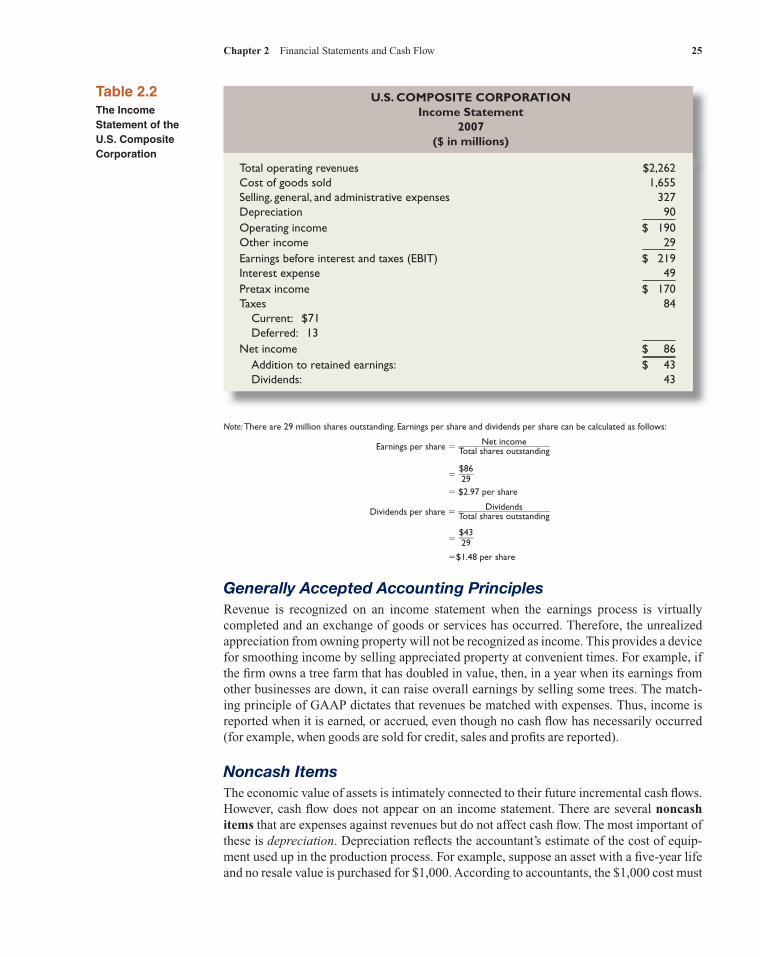
If the balance sheet is like a snapshot, the income statement is like a video recording of what the people did between two snapshots. Table 2.2 gives the income statement for the U.S. Composite Corporation for 2007. The income statement usually includes several sections. The operations section reports the firm’s revenues and expenses from principal operations. One number of particular im-portance is earnings before interest and taxes (EBIT), which summarizes earnings before taxes and financing costs. Among other things, the nonoperating section of the income statement includes all financing costs, such as interest expense. Usually a second section reports as a separate item the amount of taxes levied on income. The last item on the income statement is the bottom line, or net income. Net income is frequently expressed per share of common stock—that is, earnings per share. When analyzing an income statement, the financial manager should keep in mind GAAP, noncash items, time, and costs.
In this example, shareholders’ equity is actually worth almost twice as much as what is shown on the books. The distinction between book and market values is important precisely because book values can be so different from true economic value.
Market Value versus Book Value The Cooney Corporation has fixed assets with a book value of $700 and an appraised market value of about $1,000. Net working capital is $400 on the books, but approximately $600 would be realized if all the current accounts were liquidated. Cooney has $500 in long-term debt, both book value and market value. What is the book value of the equity? What is the market value? We can construct two simplified balance sheets, one in accounting (book value) terms and one in economic (market value) terms:E
XA
MP
LE
2.1
COONEY CORPORATION Balance Sheets
Market Value versus Book Value
Assets Liabilities and Shareholders’ Equity
Book Market Book Market
Net working capital $ 400 $ 600 Long-term debt $ 500 $ 500Net fixed assets 700 1,000 Shareholders’ equity 600 1,100 $1,100 $1,600 $1,100 $1,600
ros05902_ch02.indd 24ros05902_ch02.indd 24 9/25/06 9:28:32 AM9/25/06 9:28:32 AM
Chapter 2 Financial Statements and Cash Flow 25
Generally Accepted Accounting PrinciplesRevenue is recognized on an income statement when the earnings process is virtually completed and an exchange of goods or services has occurred. Therefore, the unrealized appreciation from owning property will not be recognized as income. This provides a device for smoothing income by selling appreciated property at convenient times. For example, if the firm owns a tree farm that has doubled in value, then, in a year when its earnings from other businesses are down, it can raise overall earnings by selling some trees. The match-ing principle of GAAP dictates that revenues be matched with expenses. Thus, income is reported when it is earned, or accrued, even though no cash flow has necessarily occurred (for example, when goods are sold for credit, sales and profits are reported).
Noncash ItemsThe economic value of assets is intimately connected to their future incremental cash flows. However, cash flow does not appear on an income statement. There are several noncash items that are expenses against revenues but do not affect cash flow. The most important of these is depreciation. Depreciation reflects the accountant’s estimate of the cost of equip-ment used up in the production process. For example, suppose an asset with a five-year life and no resale value is purchased for $1,000. According to accountants, the $1,000 cost must
U.S. COMPOSITE CORPORATION Income Statement
2007 ($ in millions)
Total operating revenues $2,262Cost of goods sold 1,655Selling, general, and administrative expenses 327Depreciation 90Operating income $ 190Other income 29Earnings before interest and taxes (EBIT) $ 219Interest expense 49Pretax income $ 170Taxes 84 Current: $71 Deferred: 13Net income $ 86 Addition to retained earnings: $ 43 Dividends: 43
Table 2.2The Income Statement of the U.S. Composite Corporation
Note: There are 29 million shares outstanding. Earnings per share and dividends per share can be calculated as follows:
Earnings per share � Net income ____________________ Total shares outstanding
� $86
____ 29
� $2.97 per share
Dividends per share � Dividends ____________________ Total shares outstanding
� $43
____ 29
�$1.48 per share
ros05902_ch02.indd 25ros05902_ch02.indd 25 9/25/06 9:28:33 AM9/25/06 9:28:33 AM
26 Part I Overview
be expensed over the useful life of the asset. If straight-line depreciation is used, there will be five equal installments, and $200 of depreciation expense will be incurred each year. From a finance perspective, the cost of the asset is the actual negative cash flow incurred when the asset is acquired (that is, $1,000, not the accountant’s smoothed $200-per-year depreciation expense). Another noncash expense is deferred taxes. Deferred taxes result from differences be-tween accounting income and true taxable income.4 Notice that the accounting tax shown on the income statement for the U.S. Composite Corporation is $84 million. It can be bro-ken down as current taxes and deferred taxes. The current tax portion is actually sent to the tax authorities (for example, the Internal Revenue Service). The deferred tax portion is not. However, the theory is that if taxable income is less than accounting income in the current year, it will be more than accounting income later on. Consequently, the taxes that are not paid today will have to be paid in the future, and they represent a liability of the firm. This shows up on the balance sheet as deferred tax liability. From the cash flow perspective, though, deferred tax is not a cash outflow. In practice, the difference between cash flows and accounting income can be quite dramatic, so it is important to understand the difference. For example, through the first nine months of 2005, automobile interior supplier Lear Corporation had a total loss of almost $779 million. That sounds bad, but Lear also reported a positive cash flow of about $229 million for the same period.
Time and CostsIt is often useful to visualize all of future time as having two distinct parts, the short run and the long run. The short run is the period in which certain equipment, resources, and com-mitments of the firm are fixed; but the time is long enough for the firm to vary its output by using more labor and raw materials. The short run is not a precise period that will be the same for all industries. However, all firms making decisions in the short run have some fixed costs—that is, costs that will not change because of fixed commitments. In real busi-ness activity, examples of fixed costs are bond interest, overhead, and property taxes. Costs that are not fixed are variable. Variable costs change as the output of the firm changes; some examples are raw materials and wages for laborers on the production line. In the long run, all costs are variable. Financial accountants do not distinguish between variable costs and fixed costs. Instead, accounting costs usually fit into a classification that distinguishes product costs from period costs. Product costs are the total production costs incurred during a period—raw materials, direct labor, and manufacturing overhead—and are reported on the income statement as cost of goods sold. Both variable and fixed costs are included in product costs. Period costs are costs that are allocated to a time period; they are called selling, general, and administrative expenses. One period cost would be the company president’s salary.
2.3 TaxesTaxes can be one of the largest cash outflows a firm experiences. For example, for the fiscal year 2005, ExxonMobil’s earnings before taxes were about $59.9 billion. Its tax bill, including all taxes paid worldwide, was a whopping $23.3 billion, or about 38.9 percent
4One situation in which taxable income may be lower than accounting income is when the firm uses accelerated depreciation expense procedures for the IRS but uses straight-line procedures allowed by GAAP for reporting purposes.
ros05902_ch02.indd 26ros05902_ch02.indd 26 9/25/06 9:28:35 AM9/25/06 9:28:35 AM
Chapter 2 Financial Statements and Cash Flow 27
of its pretax earnings. The size of the tax bill is determined by the tax code, an often amended set of rules. In this section, we examine corporate tax rates and how taxes are calculated. If the various rules of taxation seem a little bizarre or convoluted to you, keep in mind that the tax code is the result of political, not economic, forces. As a result, there is no reason why it has to make economic sense. To put the complexity of corporate taxation into perspective, General Electric’s (GE’s) 2006 tax return required 24,000 pages, far too much to print. The electronically fi led return ran 237 megabytes.
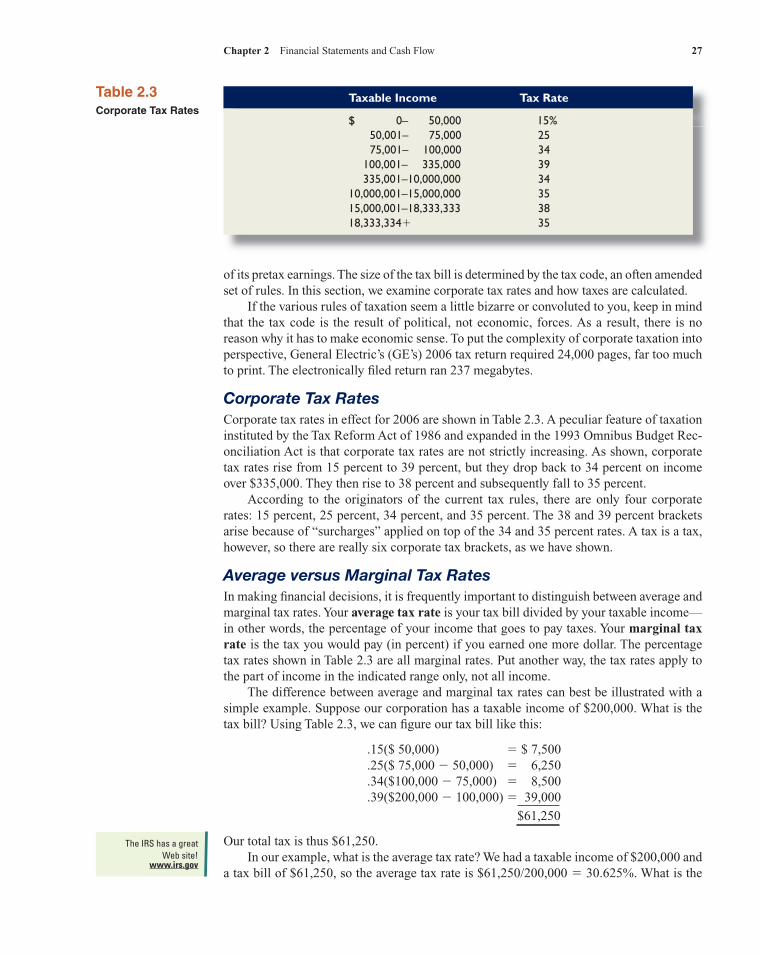
Corporate Tax RatesCorporate tax rates in effect for 2006 are shown in Table 2.3. A peculiar feature of taxation instituted by the Tax Reform Act of 1986 and expanded in the 1993 Omnibus Budget Rec-onciliation Act is that corporate tax rates are not strictly increasing. As shown, corporate tax rates rise from 15 percent to 39 percent, but they drop back to 34 percent on income over $335,000. They then rise to 38 percent and subsequently fall to 35 percent. According to the originators of the current tax rules, there are only four corporate rates: 15 percent, 25 percent, 34 percent, and 35 percent. The 38 and 39 percent brackets arise because of “surcharges” applied on top of the 34 and 35 percent rates. A tax is a tax, however, so there are really six corporate tax brackets, as we have shown.
Average versus Marginal Tax RatesIn making financial decisions, it is frequently important to distinguish between average and marginal tax rates. Your average tax rate is your tax bill divided by your taxable income—in other words, the percentage of your income that goes to pay taxes. Your marginal tax rate is the tax you would pay (in percent) if you earned one more dollar. The percentage tax rates shown in Table 2.3 are all marginal rates. Put another way, the tax rates apply to the part of income in the indicated range only, not all income. The difference between average and marginal tax rates can best be illustrated with a simple example. Suppose our corporation has a taxable income of $200,000. What is the tax bill? Using Table 2.3, we can figure our tax bill like this:
.15($ 50,000) � $ 7,500
.25($ 75,000 � 50,000) � 6,250
.34($100,000 � 75,000) � 8,500
.39($200,000 � 100,000) � 39,000
$61,250
Our total tax is thus $61,250. In our example, what is the average tax rate? We had a taxable income of $200,000 and a tax bill of $61,250, so the average tax rate is $61,250/200,000 � 30.625%. What is the
Table 2.3Corporate Tax Rates
Taxable Income Tax Rate
$ 0– 50,000 15% 50,001– 75,000 25 75,001– 100,000 34 100,001– 335,000 39 335,001–10,000,000 34 10,000,001–15,000,000 35 15,000,001–18,333,333 38 18,333,334� 35
The IRS has a great Web site!
www.irs.gov
ros05902_ch02.indd 27ros05902_ch02.indd 27 9/25/06 9:28:36 AM9/25/06 9:28:36 AM
28 Part I Overview
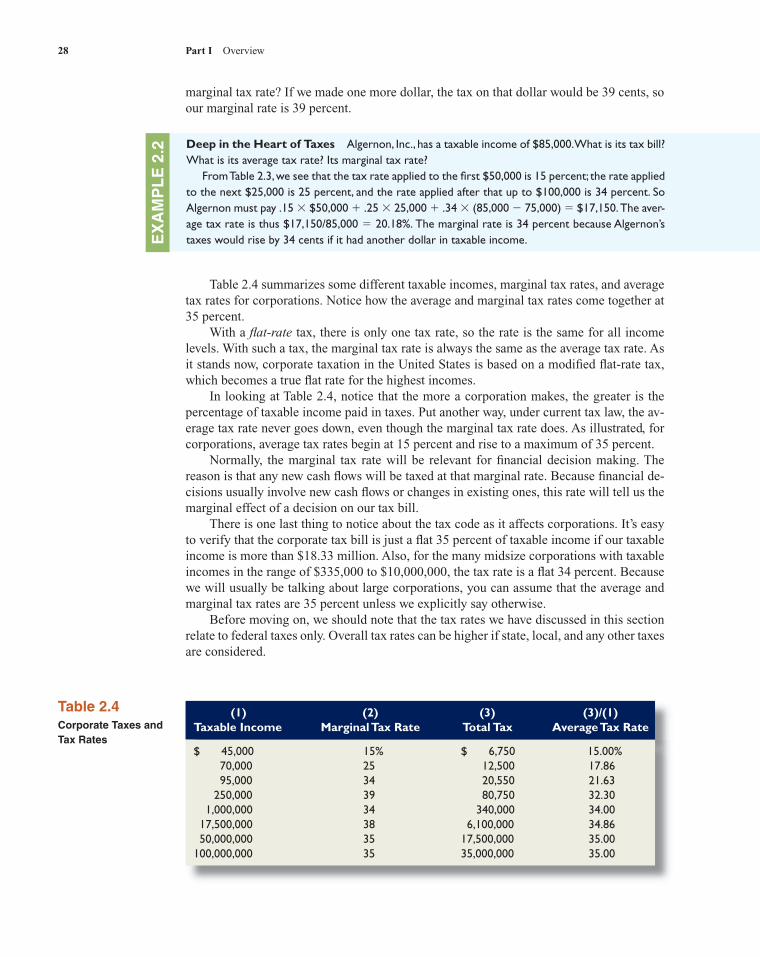
Table 2.4 summarizes some different taxable incomes, marginal tax rates, and average tax rates for corporations. Notice how the average and marginal tax rates come together at 35 percent. With a flat-rate tax, there is only one tax rate, so the rate is the same for all income levels. With such a tax, the marginal tax rate is always the same as the average tax rate. As it stands now, corporate taxation in the United States is based on a modified flat-rate tax, which becomes a true flat rate for the highest incomes. In looking at Table 2.4, notice that the more a corporation makes, the greater is the percentage of taxable income paid in taxes. Put another way, under current tax law, the av-erage tax rate never goes down, even though the marginal tax rate does. As illustrated, for corporations, average tax rates begin at 15 percent and rise to a maximum of 35 percent. Normally, the marginal tax rate will be relevant for financial decision making. The reason is that any new cash flows will be taxed at that marginal rate. Because financial de-cisions usually involve new cash flows or changes in existing ones, this rate will tell us the marginal effect of a decision on our tax bill. There is one last thing to notice about the tax code as it affects corporations. It’s easy to verify that the corporate tax bill is just a flat 35 percent of taxable income if our taxable income is more than $18.33 million. Also, for the many midsize corporations with taxable incomes in the range of $335,000 to $10,000,000, the tax rate is a flat 34 percent. Because we will usually be talking about large corporations, you can assume that the average and marginal tax rates are 35 percent unless we explicitly say otherwise. Before moving on, we should note that the tax rates we have discussed in this section relate to federal taxes only. Overall tax rates can be higher if state, local, and any other taxes are considered.
Deep in the Heart of Taxes Algernon, Inc., has a taxable income of $85,000. What is its tax bill? What is its average tax rate? Its marginal tax rate? From Table 2.3, we see that the tax rate applied to the first $50,000 is 15 percent; the rate applied to the next $25,000 is 25 percent, and the rate applied after that up to $100,000 is 34 percent. So Algernon must pay .15 � $50,000 � .25 � 25,000 � .34 � (85,000 � 75,000) � $17,150. The aver-age tax rate is thus $17,150/85,000 � 20.18%. The marginal rate is 34 percent because Algernon’s taxes would rise by 34 cents if it had another dollar in taxable income.E
XA
MP
LE
2.2
(1) (2) (3) (3)/(1)Taxable Income Marginal Tax Rate Total Tax Average Tax Rate
$ 45,000 15% $ 6,750 15.00% 70,000 25 12,500 17.86 95,000 34 20,550 21.63 250,000 39 80,750 32.30 1,000,000 34 340,000 34.00 17,500,000 38 6,100,000 34.86 50,000,000 35 17,500,000 35.00100,000,000 35 35,000,000 35.00
Table 2.4Corporate Taxes and Tax Rates
marginal tax rate? If we made one more dollar, the tax on that dollar would be 39 cents, so our marginal rate is 39 percent.
ros05902_ch02.indd 28ros05902_ch02.indd 28 9/25/06 9:28:37 AM9/25/06 9:28:37 AM
Chapter 2 Financial Statements and Cash Flow 29
2.4 Net Working CapitalNet working capital is current assets minus current liabilities. Net working capital is posi-tive when current assets are greater than current liabilities. This means the cash that will become available over the next 12 months will be greater than the cash that must be paid out. The net working capital of the U.S. Composite Corporation is $275 million in 2007 and $252 million in 2006:
Current assets Current liabilities Net working capital ($ millions) �
($ millions) � ($ millions)2007 $761 � $486 � $2752006 707 � 455 � 252
In addition to investing in fixed assets (i.e., capital spending), a firm can invest in net work-ing capital. This is called the change in net working capital. The change in net working capital in 2007 is the difference between the net working capital in 2007 and 2006—that is, $275 million � $252 million � $23 million. The change in net working capital is usually positive in a growing firm.
2.5 Financial Cash FlowPerhaps the most important item that can be extracted from financial statements is the actual cash flow of the firm. An official accounting statement called the statement of cash flows helps to explain the change in accounting cash and equivalents, which for U.S. Composite is $33 million in 2007. (See Section 2.6.) Notice in Table 2.1 that cash and equivalents increase from $107 million in 2006 to $140 million in 2007. However, we will look at cash flow from a different perspective: the perspective of finance. In finance, the value of the firm is its ability to generate financial cash flow. (We will talk more about financial cash flow in a later chapter.) The first point we should mention is that cash flow is not the same as net working capi-tal. For example, increasing inventory requires using cash. Because both inventories and cash are current assets, this does not affect net working capital. In this case, an increase in inventory is associated with decreasing cash flow. Just as we established that the value of a firm’s assets is always equal to the combined value of the liabilities and the value of the equity, the cash flows received from the firm’s assets (that is, its operating activities), CF(A), must equal the cash flows to the firm’s credi-tors, CF(B), and equity investors, CF(S):
CF(A) � CF(B) � CF(S )
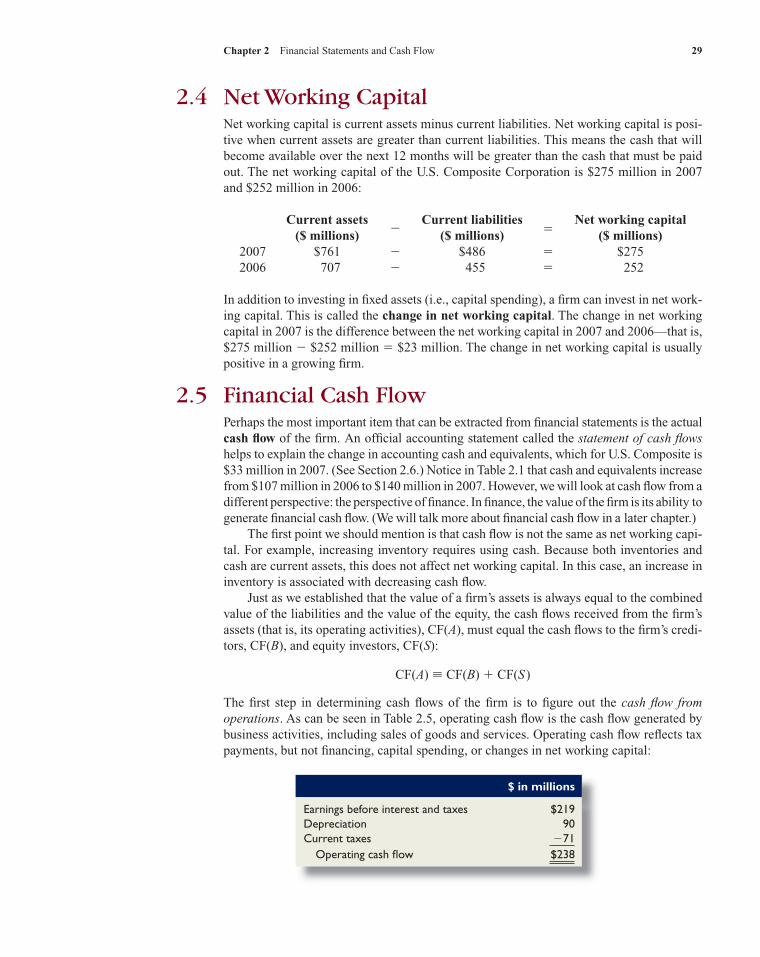
The first step in determining cash flows of the firm is to figure out the cash flow from operations. As can be seen in Table 2.5, operating cash flow is the cash flow generated by business activities, including sales of goods and services. Operating cash flow reflects tax payments, but not financing, capital spending, or changes in net working capital:
$ in millions
Earnings before interest and taxes $219Depreciation 90Current taxes �71 Operating cash flow $238
ros05902_ch02.indd 29ros05902_ch02.indd 29 9/25/06 9:28:38 AM9/25/06 9:28:38 AM
30 Part I Overview
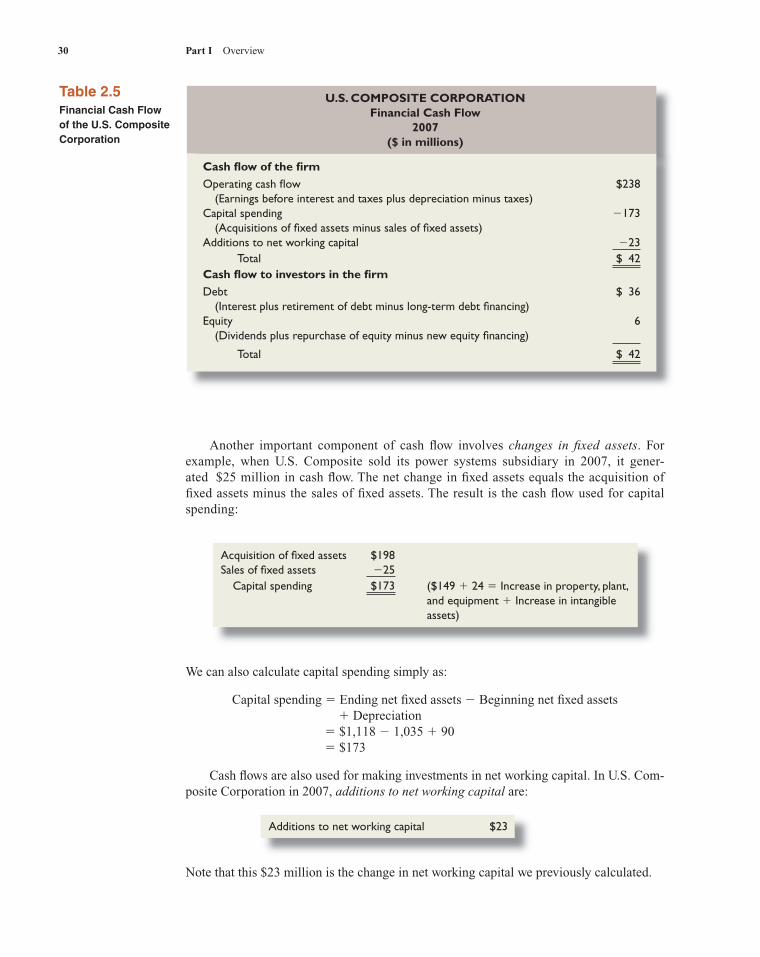
Another important component of cash flow involves changes in fixed assets. For example, when U.S. Composite sold its power systems subsidiary in 2007, it gener-ated $25 million in cash flow. The net change in fixed assets equals the acquisition of fixed assets minus the sales of fixed assets. The result is the cash flow used for capital spending:
U.S. COMPOSITE CORPORATION Financial Cash Flow
2007 ($ in millions)
Cash flow of the firmOperating cash flow $238 (Earnings before interest and taxes plus depreciation minus taxes)Capital spending �173 (Acquisitions of fixed assets minus sales of fixed assets)Additions to net working capital �23 Total $ 42Cash flow to investors in the firmDebt $ 36 (Interest plus retirement of debt minus long-term debt financing)Equity 6 (Dividends plus repurchase of equity minus new equity financing)
Total $ 42
Table 2.5Financial Cash Flow of the U.S. Composite Corporation
Additions to net working capital $23
We can also calculate capital spending simply as:
Capital spending � Ending net fi xed assets � Beginning net fi xed assets � Depreciation � $1,118 � 1,035 � 90 � $173
Cash flows are also used for making investments in net working capital. In U.S. Com-posite Corporation in 2007, additions to net working capital are:
Note that this $23 million is the change in net working capital we previously calculated.
Acquisition of fixed assets $198Sales of fixed assets �25 Capital spending $173 ($149 � 24 � Increase in property, plant,
and equipment � Increase in intangible assets)
ros05902_ch02.indd 30ros05902_ch02.indd 30 9/26/06 10:25:16 AM9/26/06 10:25:16 AM
Chapter 2 Financial Statements and Cash Flow 31
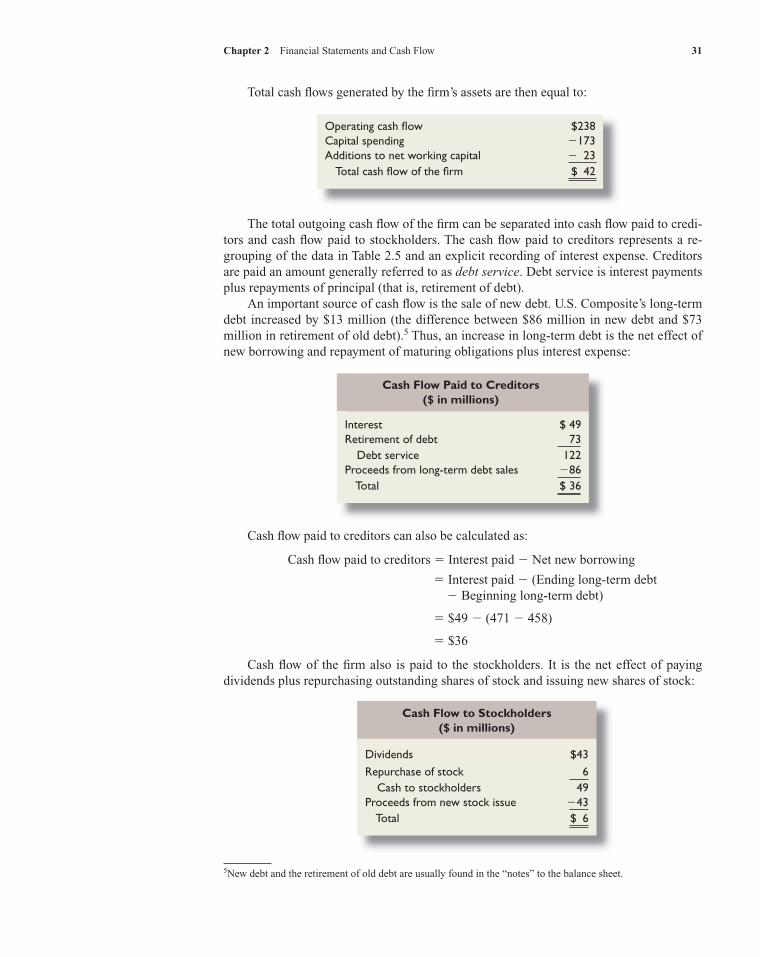
Total cash flows generated by the firm’s assets are then equal to:
Operating cash flow $238Capital spending �173Additions to net working capital � 23 Total cash flow of the firm $ 42
The total outgoing cash flow of the firm can be separated into cash flow paid to credi-tors and cash flow paid to stockholders. The cash flow paid to creditors represents a re-grouping of the data in Table 2.5 and an explicit recording of interest expense. Creditors are paid an amount generally referred to as debt service. Debt service is interest payments plus repayments of principal (that is, retirement of debt). An important source of cash flow is the sale of new debt. U.S. Composite’s long-term debt increased by $13 million (the difference between $86 million in new debt and $73 million in retirement of old debt).5 Thus, an increase in long-term debt is the net effect of new borrowing and repayment of maturing obligations plus interest expense:
Cash Flow Paid to Creditors ($ in millions)
Interest $ 49Retirement of debt 73 Debt service 122Proceeds from long-term debt sales �86 Total $ 36
Cash flow paid to creditors can also be calculated as:
Cash fl ow paid to creditors � Interest paid � Net new borrowing
� Interest paid � (Ending long-term debt� Beginning long-term debt)
� $49 � (471 � 458)
� $36
Cash flow of the firm also is paid to the stockholders. It is the net effect of paying dividends plus repurchasing outstanding shares of stock and issuing new shares of stock:
5New debt and the retirement of old debt are usually found in the “notes” to the balance sheet.
Cash Flow to Stockholders ($ in millions)
Dividends $43Repurchase of stock 6 Cash to stockholders 49Proceeds from new stock issue �43 Total $ 6
ros05902_ch02.indd 31ros05902_ch02.indd 31 9/25/06 9:28:41 AM9/25/06 9:28:41 AM
32 Part I Overview
In general, cash flow to stockholders can be determined as:
Cash fl ow to stockholders � Dividends paid � Net new equity raised
� Dividends paid � (Stock sold � Stock repurchased)
To determine stock sold, notice that the common stock and capital surplus accounts went up by a combined $23 � 20 � $43, which implies that the company sold $43 million worth of stock. Second, treasury stock went up by $6, indicating that the company bought back $6 million worth of stock. Net new equity is thus $43 � 6 � $37. Dividends paid were $43 million, so the cash flow to stockholders was:
Cash fl ow to stockholders � $43 � (43 � 6) � $6,
which is what we previously calculated. Some important observations can be drawn from our discussion of cash flow:
1. Several types of cash flow are relevant to understanding the financial situation of the firm. Operating cash flow, defined as earnings before interest plus deprecia-tion minus taxes, measures the cash generated from operations not counting capital spending or working capital requirements. It is usually positive; a firm is in trouble if operating cash flow is negative for a long time because the firm is not generating enough cash to pay operating costs. Total cash flow of the firm includes adjustments for capital spending and additions to net working capital. It will frequently be nega-tive. When a firm is growing at a rapid rate, spending on inventory and fixed assets can be higher than operating cash fl ow.
2. Net income is not cash flow. The net income of the U.S. Composite Corporation in 2007 was $86 million, whereas cash flow was $42 million. The two numbers are not usually the same. In determining the economic and financial condition of a firm, cash flow is more revealing.
A firm’s total cash flow sometimes goes by a different name, free cash flow. Of course, there is no such thing as “free” cash (we wish!). Instead, the name refers to cash that the firm is free to distribute to creditors and stockholders because it is not needed for working capital or fixed asset investments. We will stick with “total cash flow of the firm” as our label for this important concept because, in practice, there is some variation in exactly how free cash flow is computed. Nonetheless, whenever you hear the phrase “free cash flow,” you should understand that what is being discussed is cash flow from assets or something quite similar.
2.6 The Accounting Statement of Cash FlowsAs previously mentioned, there is an official accounting statement called the statement of cash flows. This statement helps explain the change in accounting cash, which forU.S. Composite is $33 million in 2007. It is very useful in understanding financial cash flow. The first step in determining the change in cash is to figure out cash flow from operat-ing activities. This is the cash flow that results from the firm’s normal activities in producing and selling goods and services. The second step is to make an adjustment for cash flow from investing activities. The final step is to make an adjustment for cash flow from financing
ros05902_ch02.indd 32ros05902_ch02.indd 32 9/25/06 9:28:42 AM9/25/06 9:28:42 AM
Chapter 2 Financial Statements and Cash Flow 33
activities. Financing activities are the net payments to creditors and owners (excluding inter-est expense) made during the year. The three components of the statement of cash flows are determined next.
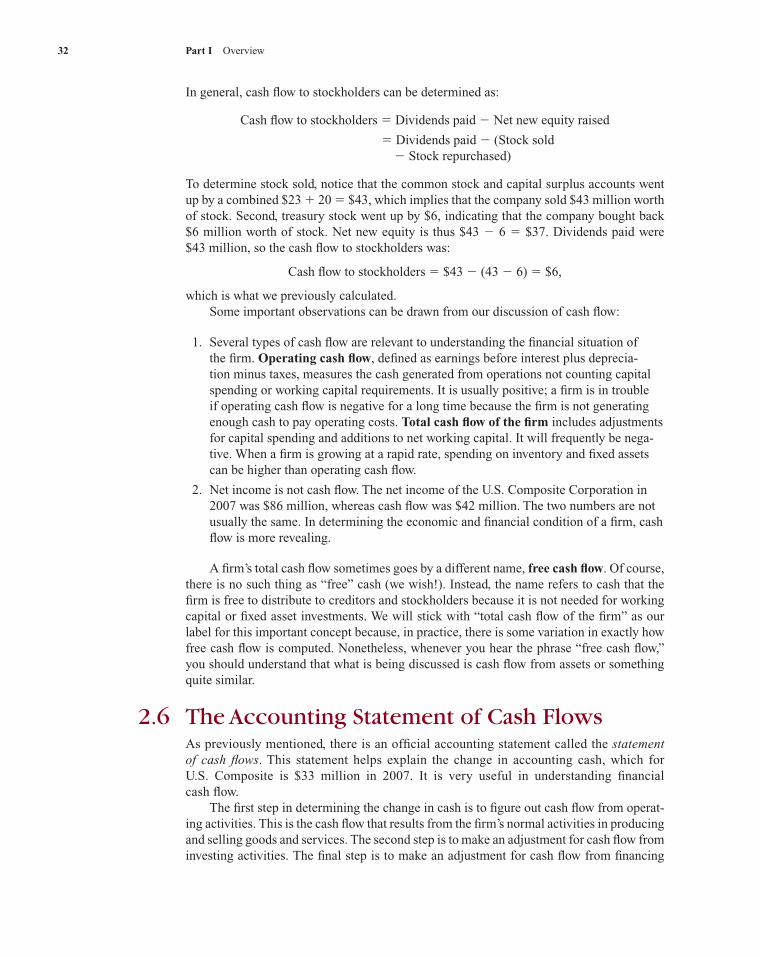
Cash Flow from Operating ActivitiesTo calculate cash flow from operating activities we start with net income. Net income can be found on the income statement and is equal to $86 million. We now need to add back noncash expenses and adjust for changes in current assets and liabilities (other than cash and notes payable). The result is cash flow from operating activities. Notes payable will be included in the financing activities section.
U.S. COMPOSITE CORPORATION Cash Flow from Operating Activities
2007 ($ in millions)
Net income $ 86 Depreciation 90 Deferred taxes 13 Change in assets and liabilities Accounts receivable �24 Inventories 11 Accounts payable 16 Accrued expense 18 Other �8 Cash flow from operating activities $202
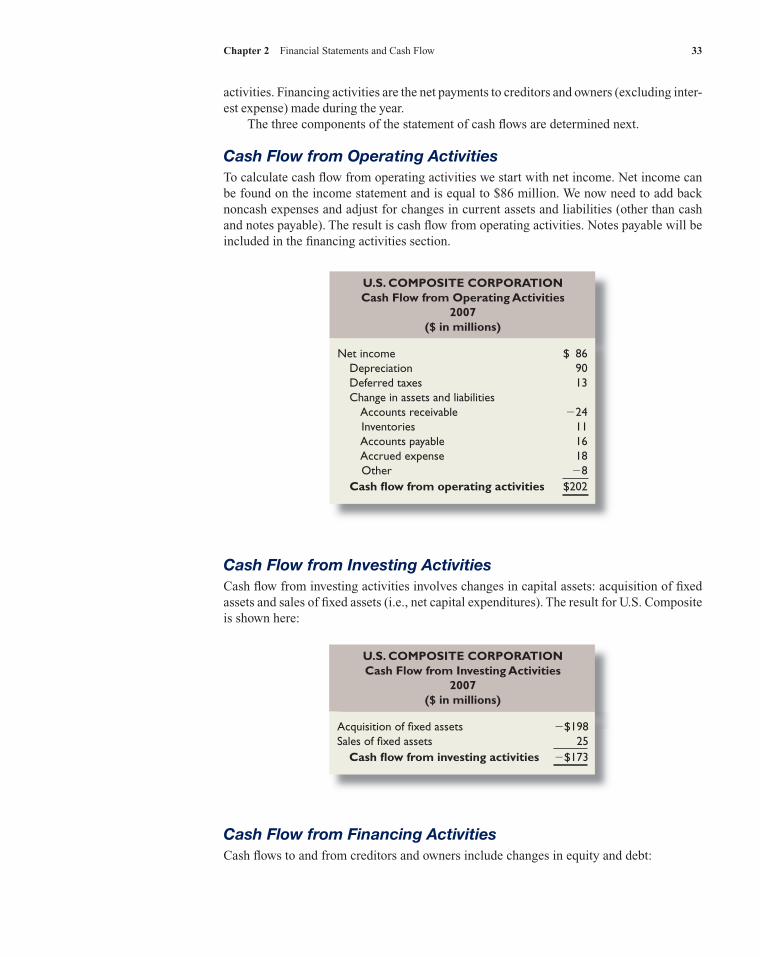
Cash Flow from Investing ActivitiesCash flow from investing activities involves changes in capital assets: acquisition of fixed assets and sales of fixed assets (i.e., net capital expenditures). The result for U.S. Composite is shown here:
U.S. COMPOSITE CORPORATION Cash Flow from Investing Activities
2007($ in millions)
Acquisition of fixed assets �$198Sales of fixed assets 25 Cash flow from investing activities �$173
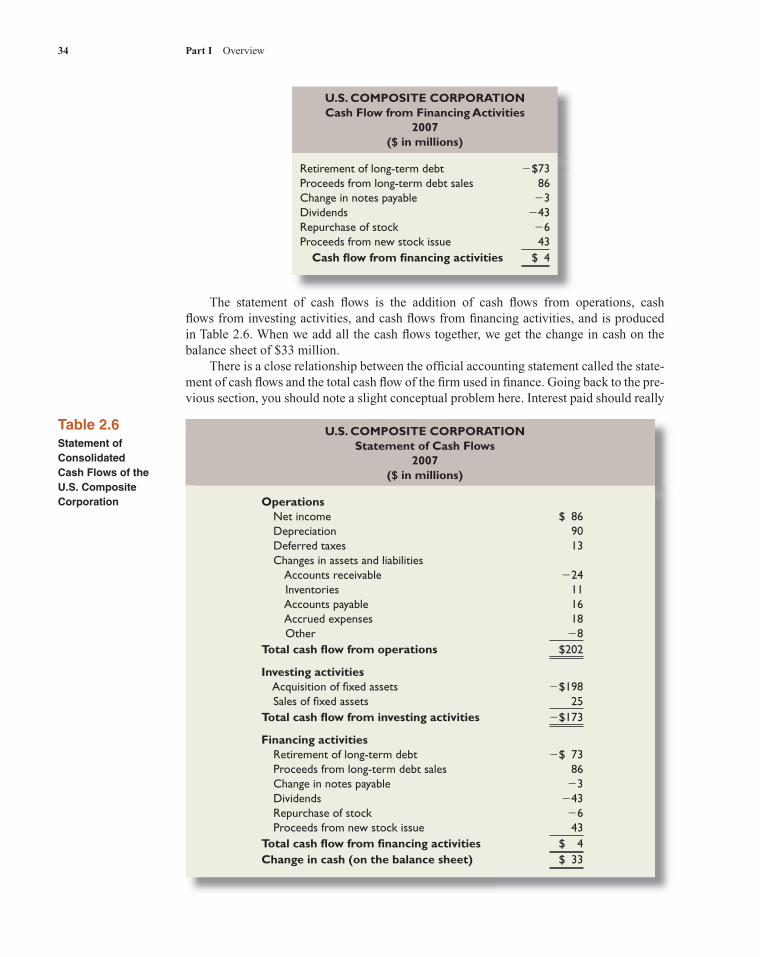
Cash Flow from Financing ActivitiesCash flows to and from creditors and owners include changes in equity and debt:
ros05902_ch02.indd 33ros05902_ch02.indd 33 9/25/06 9:28:42 AM9/25/06 9:28:42 AM
U.S. COMPOSITE CORPORATION Cash Flow from Financing Activities
2007($ in millions)
Retirement of long-term debt �$73Proceeds from long-term debt sales 86Change in notes payable �3Dividends �43Repurchase of stock �6Proceeds from new stock issue 43 Cash flow from financing activities $ 4
U.S. COMPOSITE CORPORATIONStatement of Cash Flows
2007($ in millions)
Operations Net income $ 86 Depreciation 90 Deferred taxes 13 Changes in assets and liabilities Accounts receivable �24 Inventories 11 Accounts payable 16 Accrued expenses 18 Other �8Total cash flow from operations $202
Investing activities Acquisition of fixed assets �$198 Sales of fixed assets 25Total cash flow from investing activities �$173
Financing activities Retirement of long-term debt �$ 73 Proceeds from long-term debt sales 86 Change in notes payable �3 Dividends �43 Repurchase of stock �6 Proceeds from new stock issue 43Total cash flow from financing activities $ 4Change in cash (on the balance sheet) $ 33
Table 2.6Statement of Consolidated Cash Flows of the U.S. Composite Corporation
34 Part I Overview
The statement of cash flows is the addition of cash flows from operations, cash flows from investing activities, and cash flows from financing activities, and is produced in Table 2.6. When we add all the cash flows together, we get the change in cash on the balance sheet of $33 million. There is a close relationship between the official accounting statement called the state-ment of cash flows and the total cash flow of the firm used in finance. Going back to the pre-vious section, you should note a slight conceptual problem here. Interest paid should really
ros05902_ch02.indd 34ros05902_ch02.indd 34 9/25/06 9:28:44 AM9/25/06 9:28:44 AM
Chapter 2 Financial Statements and Cash Flow 35
go under financing activities, but unfortunately that is not how the accounting is handled. The reason is that interest is deducted as an expense when net income is computed. As a consequence, a primary difference between the accounting cash flow and the financial cash flow of the firm (see Table 2.5) is interest expense.
Chapter 2 Financial Statements and Cash Flow 35
Besides introducing you to corporate accounting, the purpose of this chapter has been to teach you how to determine cash flow from the accounting statements of a typical company.
1. Cash flow is generated by the firm and paid to creditors and shareholders. It can be classified as: a. Cash flow from operations. b. Cash flow from changes in fixed assets. c. Cash flow from changes in working capital.
2. Calculations of cash flow are not difficult, but they require care and particular attention to detail in properly accounting for noncash expenses such as depreciation and deferred taxes. It is especially important that you do not confuse cash flow with changes in net working capital and net income.
Summary and Conclusions
Concept Questions
1. Liquidity True or false: All assets are liquid at some price. Explain.
2. Accounting and Cash Flows Why might the revenue and cost figures shown on a standard income statement not represent the actual cash inflows and outflows that occurred during a period?
3. Accounting Statement of Cash Flows Looking at the accounting statement of cash flows, what does the bottom line number mean? How useful is this number for analyzing a company?
4. Cash Flows How do financial cash flows and the accounting statement of cash flows differ? Which is more useful for analyzing a company?
5. Book Values versus Market Values Under standard accounting rules, it is possible for a company’s liabilities to exceed its assets. When this occurs, the owners’ equity is negative. Can this happen with market values? Why or why not?
6. Cash Flow from Assets Why is it not necessarily bad for the cash flow from assets to be negative for a particular period?
7. Operating Cash Flow Why is it not necessarily bad for the operating cash flow to be nega-tive for a particular period?
8. Net Working Capital and Capital Spending Could a company’s change in net working capital be negative in a given year? (Hint: Yes.) Explain how this might come about. What about net capital spending?
9. Cash Flow to Stockholders and Creditors Could a company’s cash flow to stockholders be negative in a given year? (Hint: Yes.) Explain how this might come about. What about cash flow to creditors?
10. Firm Values Referring back to the CBS Records example at the beginning of the chapter, note that we suggested that CBS Records’ stockholders probably didn’t suffer as a result of the reported loss. What do you think was the basis for our conclusion?
Questions and Problems
1. Building a Balance Sheet Culligan, Inc., has current assets of $5,000, net fixed assets of $23,000, current liabilities of $4,300, and long-term debt of $13,000. What is the value of the shareholders’ equity account for this firm? How much is net working capital?
2. Building an Income Statement Ragsdale, Inc., has sales of $527,000, costs of $280,000, depreciation expense of $38,000, interest expense of $15,000, and a tax rate of 35 percent.
ww
w.m
hhe.
com
/rw
j
BASIC(Questions 1–10)
ros05902_ch02.indd 35ros05902_ch02.indd 35 9/25/06 9:28:45 AM9/25/06 9:28:45 AM
36 Part I Overview
What is the net income for the firm? Suppose the company paid out $48,000 in cash dividends. What is the addition to retained earnings?
3. Market Values and Book Values Klingon Cruisers, Inc., purchased new cloaking machin-ery three years ago for $7 million. The machinery can be sold to the Romulans today for $3.2 million. Klingon’s current balance sheet shows net fixed assets of $4,000,000, current liabilities of $2,200,000, and net working capital of $900,000. If all the current assets were liquidated today, the company would receive $2.8 million cash. What is the book value of Klingon’s assets today? What is the market value?
4. Calculating Taxes The Herrera Co. had $273,000 in taxable income. Using the rates from Table 2.3 in the chapter, calculate the company’s income taxes. What is the average tax rate? What is the marginal tax rate?
5. Calculating OCF Ranney, Inc., has sales of $13,500, costs of $5,400, depreciation expense of $1,200, and interest expense of $680. If the tax rate is 35 percent, what is the operating cash flow, or OCF?
6. Calculating Net Capital Spending Gordon Driving School’s 2006 balance sheet showed net fixed assets of $4.2 million, and the 2007 balance sheet showed net fixed assets of $4.7 million. The company’s 2007 income statement showed a depreciation expense of $925,000. What was Gordon’s net capital spending for 2007?
7. Building a Balance Sheet The following table presents the long-term liabilities and stock-holders’ equity of Information Control Corp. one year ago:
Long-term debt $60,000,000Preferred stock 18,000,000Common stock ($1 par value) 25,000,000Capital surplus 49,000,000Accumulated retained earnings 89,000,000
During the past year, Information Control issued 10 million shares of new stock at a total price of $26 million, and issued $8 million in new long-term debt. The company generated $7 million in net income and paid $4 million in dividends. Construct the current balance sheet reflecting the changes that occurred at Information Control Corp. during the year.
8. Cash Flow to Creditors The 2006 balance sheet of Anna’s Tennis Shop, Inc., showed long-term debt of $2.8 million, and the 2007 balance sheet showed long-term debt of $3.1 million. The 2007 income statement showed an interest expense of $340,000. What was the firm’s cash flow to creditors during 2007?
9. Cash Flow to Stockholders The 2006 balance sheet of Anna’s Tennis Shop, Inc., showed $820,000 in the common stock account and $6.8 million in the additional paid-in surplus ac-count. The 2007 balance sheet showed $855,000 and $7.6 million in the same two accounts, respectively. If the company paid out $600,000 in cash dividends during 2007, what was the cash flow to stockholders for the year?
10. Calculating Cash Flows Given the information for Anna’s Tennis Shop, Inc., in the previ-ous two problems, suppose you also know that the firm’s net capital spending for 2007 was $760,000 and that the firm reduced its net working capital investment by $165,000. What was the firm’s 2007 operating cash flow, or OCF?
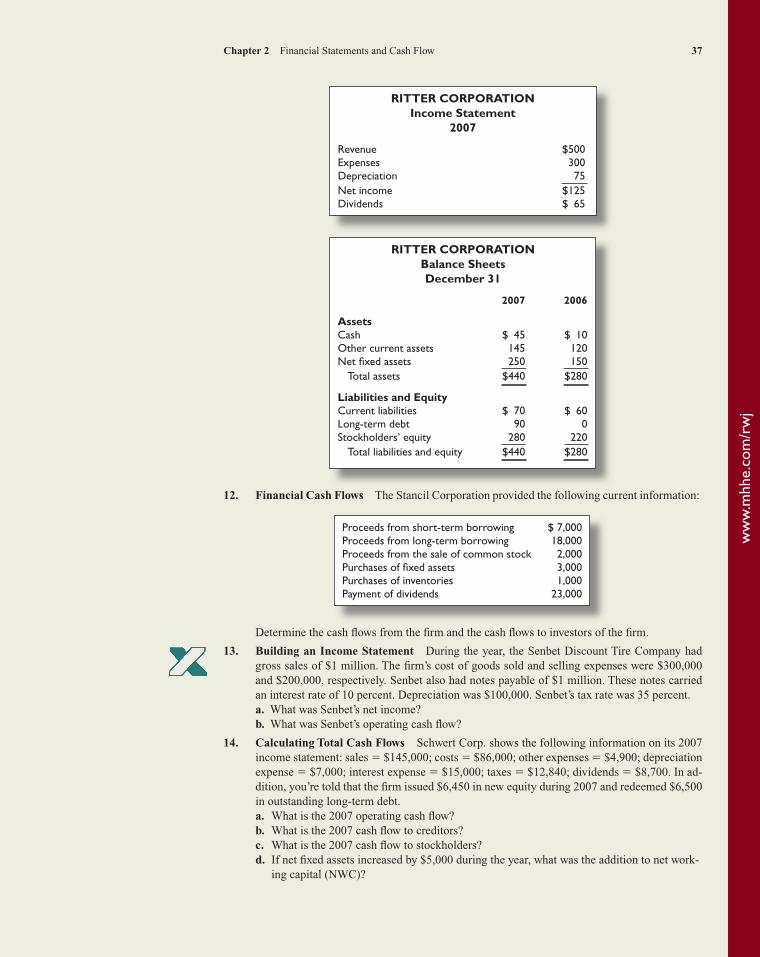
11. Cash Flows Ritter Corporation’s accountants prepared the following financial statements for year-end 2007:a. Explain the change in cash during 2007.b. Determine the change in net working capital in 2007.c. Determine the cash flow generated by the firm’s assets during 2007.
INTERMEDIATE(Questions 11–24)
ww
w.m
hhe.
com
/rw
j
ros05902_ch02.indd 36ros05902_ch02.indd 36 9/25/06 9:28:46 AM9/25/06 9:28:46 AM
Chapter 2 Financial Statements and Cash Flow 37
12. Financial Cash Flows The Stancil Corporation provided the following current information:
RITTER CORPORATION Balance Sheets December 31
2007 2006
Assets Cash $ 45 $ 10Other current assets 145 120Net fixed assets 250 150 Total assets $440 $280
Liabilities and Equity Current liabilities $ 70 $ 60Long-term debt 90 0Stockholders’ equity 280 220 Total liabilities and equity $440 $280
RITTER CORPORATION Income Statement
2007
Revenue $500Expenses 300Depreciation 75Net income $125Dividends $ 65
Proceeds from short-term borrowing $ 7,000Proceeds from long-term borrowing 18,000Proceeds from the sale of common stock 2,000Purchases of fixed assets 3,000Purchases of inventories 1,000Payment of dividends 23,000
Determine the cash flows from the firm and the cash flows to investors of the firm.
13. Building an Income Statement During the year, the Senbet Discount Tire Company had gross sales of $1 million. The firm’s cost of goods sold and selling expenses were $300,000 and $200,000, respectively. Senbet also had notes payable of $1 million. These notes carried an interest rate of 10 percent. Depreciation was $100,000. Senbet’s tax rate was 35 percent.a. What was Senbet’s net income?b. What was Senbet’s operating cash flow?
14. Calculating Total Cash Flows Schwert Corp. shows the following information on its 2007 income statement: sales � $145,000; costs � $86,000; other expenses � $4,900; depreciation expense � $7,000; interest expense � $15,000; taxes � $12,840; dividends � $8,700. In ad-dition, you’re told that the firm issued $6,450 in new equity during 2007 and redeemed $6,500 in outstanding long-term debt.a. What is the 2007 operating cash flow?b. What is the 2007 cash flow to creditors?c. What is the 2007 cash flow to stockholders?d. If net fixed assets increased by $5,000 during the year, what was the addition to net work-
ing capital (NWC)?
ww
w.m
hhe.
com
/rw
j
ros05902_ch02.indd 37ros05902_ch02.indd 37 9/25/06 9:28:47 AM9/25/06 9:28:47 AM
38 Part I Overview38 Part I Overview
15. Using Income Statements Given the following information for O’Hara Marine Co., calcu-late the depreciation expense: sales � $29,000; costs � $13,000; addition to retained earnings � $4,500; dividends paid � $900; interest expense � $1,600; tax rate � 35 percent.
16. Preparing a Balance Sheet Prepare a 2007 balance sheet for Jarrow Corp. based on the following information: cash � $175,000; patents and copyrights � $720,000; accounts payable � $430,000; accounts receivable � $140,000; tangible net fixed assets � $2,900,000; inventory � $265,000; notes payable � $180,000; accumulated retained earnings � $1,240,000; long-term debt � $1,430,000.
17. Residual Claims Huang, Inc., is obligated to pay its creditors $3,500 very soon.a. What is the market value of the shareholders’ equity if assets have a market value of
$4,300?b. What if assets equal $3,200?
18. Marginal versus Average Tax Rates (Refer to Table 2.3.) Corporation Growth has $85,000 in taxable income, and Corporation Income has $8,500,000 in taxable income.a. What is the tax bill for each firm?b. Suppose both firms have identified a new project that will increase taxable income by
$10,000. How much in additional taxes will each firm pay? Why is this amount the same?
19. Net Income and OCF During 2007, Raines Umbrella Corp. had sales of $850,000. Cost of goods sold, administrative and selling expenses, and depreciation expenses were $630,000, $120,000, and $130,000, respectively. In addition, the company had an interest expense of $85,000 and a tax rate of 35 percent. (Ignore any tax loss carryback or carryforward provisions.)a. What is Raines’s net income for 2007?b. What is its operating cash flow?c. Explain your results in (a) and (b).
20. Accounting Values versus Cash Flows In Problem 19, suppose Raines Umbrella Corp. paid out $30,000 in cash dividends. Is this possible? If spending on net fixed assets and net working capital was zero, and if no new stock was issued during the year, what was the change in the firm’s long-term debt account?
21. Calculating Cash Flows Cusic Industries had the following operating results for 2007: sales � $12,800; cost of goods sold � $10,400; depreciation expense � $1,900; interest expense � $450; dividends paid � $500. At the beginning of the year, net fixed assets were $9,100, cur-rent assets were $3,200, and current liabilities were $1,800. At the end of the year, net fixed assets were $9,700, current assets were $3,850, and current liabilities were $2,100. The tax rate for 2007 was 34 percent.a. What is net income for 2007?b. What is the operating cash flow for 2007?c. What is the cash flow from assets for 2007? Is this possible? Explain.d. If no new debt was issued during the year, what is the cash flow to creditors? What is the
cash flow to stockholders? Explain and interpret the positive and negative signs of your answers in (a) through (d).
22. Calculating Cash Flows Consider the following abbreviated financial statements for Weston Enterprises:
WESTON ENTERPRISES 2007 Income Statement
Sales $8,600Costs 4,150Depreciation 800Interest paid 216
WESTON ENTERPRISES 2006 and 2007 Partial Balance Sheets
Assets Liabilities and Owners’ Equity
2006 2007 2006 2007Current assets $ 650 $ 705 Current liabilities $ 265 $ 290Net fixed assets 2,900 3,400 Long-term debt 1,500 1,720
ww
w.m
hhe.
com
/rw
j
ros05902_ch02.indd 38ros05902_ch02.indd 38 9/25/06 9:28:49 AM9/25/06 9:28:49 AM
Chapter 2 Financial Statements and Cash Flow 39 Chapter 2 Financial Statements and Cash Flow 39
a. What is owners’ equity for 2006 and 2007?b. What is the change in net working capital for 2007?c. In 2007, Weston Enterprises purchased $1,500 in new fixed assets. How much in fixed as-
sets did Weston Enterprises sell? What is the cash flow from assets for the year? (The tax rate is 35 percent.)
d. During 2007, Weston Enterprises raised $300 in new long-term debt. How much long-term debt must Weston Enterprises have paid off during the year? What is the cash flow to creditors?
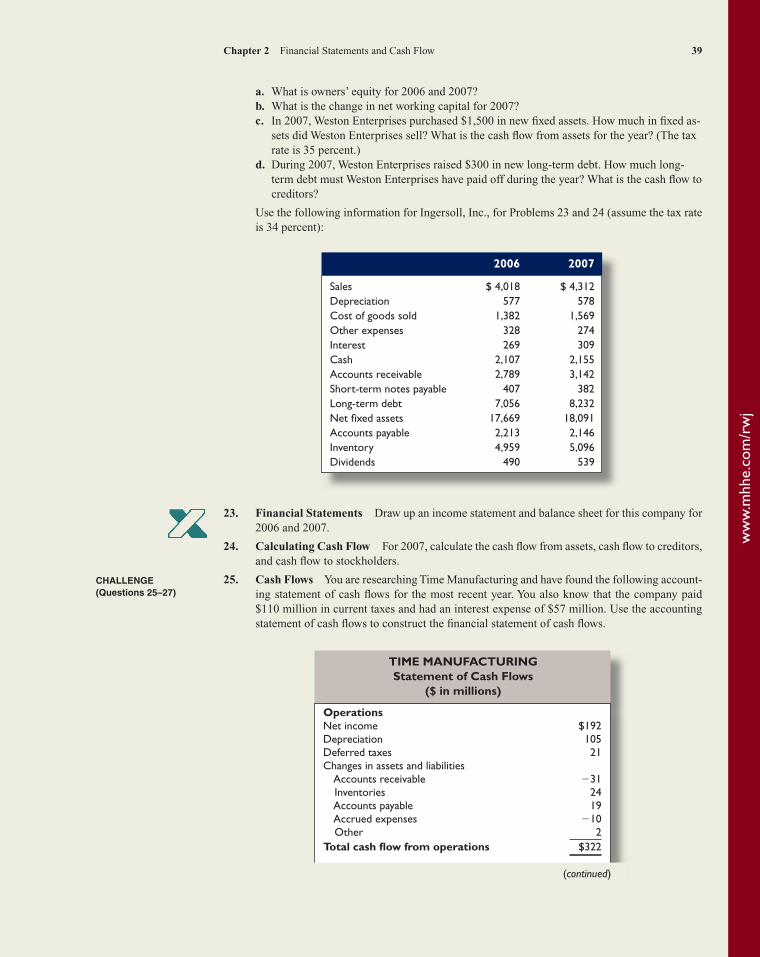
Use the following information for Ingersoll, Inc., for Problems 23 and 24 (assume the tax rate is 34 percent):
2006 2007
Sales $ 4,018 $ 4,312Depreciation 577 578Cost of goods sold 1,382 1,569Other expenses 328 274Interest 269 309Cash 2,107 2,155Accounts receivable 2,789 3,142Short-term notes payable 407 382Long-term debt 7,056 8,232Net fixed assets 17,669 18,091Accounts payable 2,213 2,146Inventory 4,959 5,096Dividends 490 539
23. Financial Statements Draw up an income statement and balance sheet for this company for 2006 and 2007.
24. Calculating Cash Flow For 2007, calculate the cash flow from assets, cash flow to creditors, and cash flow to stockholders.
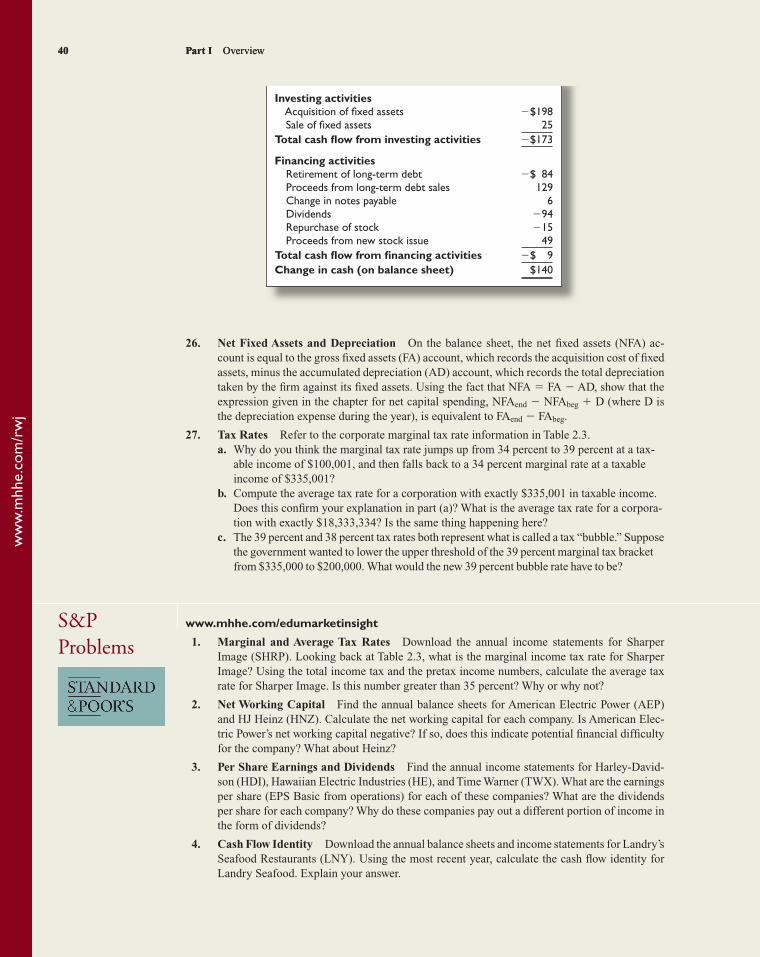
25. Cash Flows You are researching Time Manufacturing and have found the following account-ing statement of cash flows for the most recent year. You also know that the company paid $110 million in current taxes and had an interest expense of $57 million. Use the accounting statement of cash flows to construct the financial statement of cash flows.
CHALLENGE(Questions 25–27)
ww
w.m
hhe.
com
/rw
j
TIME MANUFACTURING Statement of Cash Flows
($ in millions)
Operations Net income $192Depreciation 105Deferred taxes 21Changes in assets and liabilities Accounts receivable �31 Inventories 24 Accounts payable 19 Accrued expenses �10 Other 2Total cash flow from operations $322
(continued)
ros05902_ch02.indd 39ros05902_ch02.indd 39 9/25/06 9:28:50 AM9/25/06 9:28:50 AM
40 Part I Overview40 Part I Overview
26. Net Fixed Assets and Depreciation On the balance sheet, the net fixed assets (NFA) ac-count is equal to the gross fixed assets (FA) account, which records the acquisition cost of fixed assets, minus the accumulated depreciation (AD) account, which records the total depreciation taken by the firm against its fixed assets. Using the fact that NFA � FA � AD, show that the expression given in the chapter for net capital spending, NFAend � NFAbeg � D (where D is the depreciation expense during the year), is equivalent to FAend � FAbeg.
27. Tax Rates Refer to the corporate marginal tax rate information in Table 2.3.a. Why do you think the marginal tax rate jumps up from 34 percent to 39 percent at a tax-
able income of $100,001, and then falls back to a 34 percent marginal rate at a taxable income of $335,001?
b. Compute the average tax rate for a corporation with exactly $335,001 in taxable income. Does this confirm your explanation in part (a)? What is the average tax rate for a corpora-tion with exactly $18,333,334? Is the same thing happening here?
c. The 39 percent and 38 percent tax rates both represent what is called a tax “bubble.” Suppose the government wanted to lower the upper threshold of the 39 percent marginal tax bracket from $335,000 to $200,000. What would the new 39 percent bubble rate have to be?
www.mhhe.com/edumarketinsight
1. Marginal and Average Tax Rates Download the annual income statements for Sharper Image (SHRP). Looking back at Table 2.3, what is the marginal income tax rate for Sharper Image? Using the total income tax and the pretax income numbers, calculate the average tax rate for Sharper Image. Is this number greater than 35 percent? Why or why not?
2. Net Working Capital Find the annual balance sheets for American Electric Power (AEP) and HJ Heinz (HNZ). Calculate the net working capital for each company. Is American Elec-tric Power’s net working capital negative? If so, does this indicate potential financial difficulty for the company? What about Heinz?
3. Per Share Earnings and Dividends Find the annual income statements for Harley-David-son (HDI), Hawaiian Electric Industries (HE), and Time Warner (TWX). What are the earnings per share (EPS Basic from operations) for each of these companies? What are the dividends per share for each company? Why do these companies pay out a different portion of income in the form of dividends?
4. Cash Flow Identity Download the annual balance sheets and income statements for Landry’s Seafood Restaurants (LNY). Using the most recent year, calculate the cash flow identity for Landry Seafood. Explain your answer.
S&P Problems
Investing activities Acquisition of fixed assets �$198 Sale of fixed assets 25Total cash flow from investing activities �$173
Financing activities Retirement of long-term debt �$ 84 Proceeds from long-term debt sales 129 Change in notes payable 6 Dividends �94 Repurchase of stock �15 Proceeds from new stock issue 49Total cash flow from financing activities �$ 9Change in cash (on balance sheet) $140
ww
w.m
hhe.
com
/rw
j
ros05902_ch02.indd 40ros05902_ch02.indd 40 9/26/06 10:25:53 AM9/26/06 10:25:53 AM
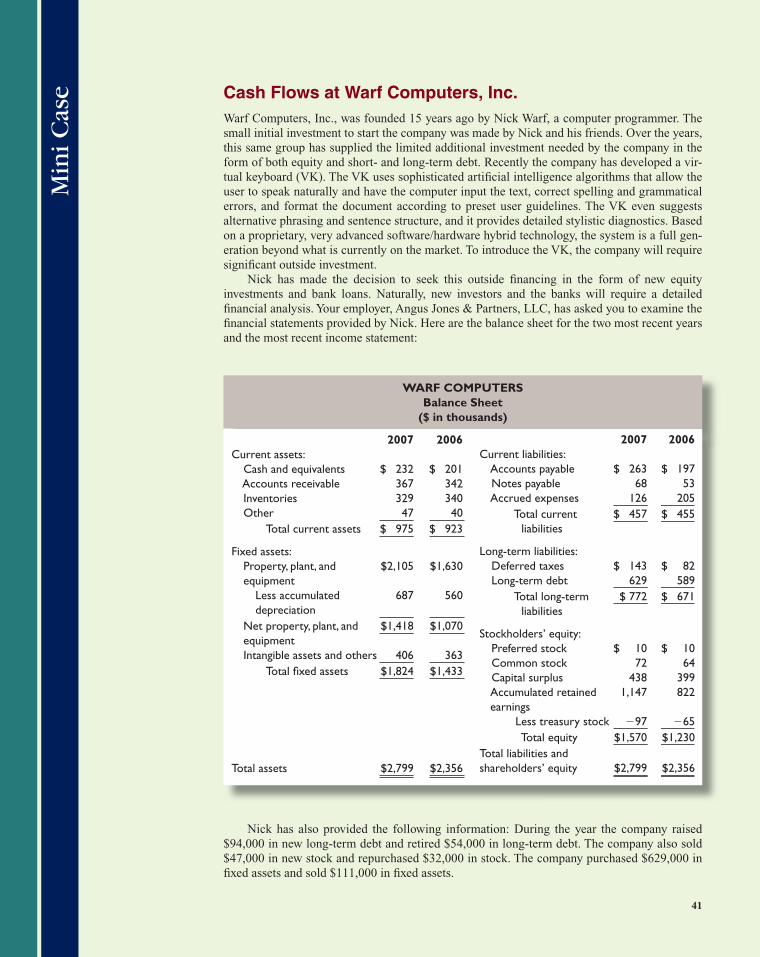
Cash Flows at Warf Computers, Inc.Warf Computers, Inc., was founded 15 years ago by Nick Warf, a computer programmer. The small initial investment to start the company was made by Nick and his friends. Over the years, this same group has supplied the limited additional investment needed by the company in the form of both equity and short- and long-term debt. Recently the company has developed a vir-tual keyboard (VK). The VK uses sophisticated artificial intelligence algorithms that allow the user to speak naturally and have the computer input the text, correct spelling and grammatical errors, and format the document according to preset user guidelines. The VK even suggests alternative phrasing and sentence structure, and it provides detailed stylistic diagnostics. Based on a proprietary, very advanced software/hardware hybrid technology, the system is a full gen-eration beyond what is currently on the market. To introduce the VK, the company will require significant outside investment. Nick has made the decision to seek this outside financing in the form of new equity investments and bank loans. Naturally, new investors and the banks will require a detailed financial analysis. Your employer, Angus Jones & Partners, LLC, has asked you to examine the financial statements provided by Nick. Here are the balance sheet for the two most recent years and the most recent income statement:
WARF COMPUTERS Balance Sheet
($ in thousands)
2007 2006Current assets: Cash and equivalents $ 232 $ 201 Accounts receivable 367 342 Inventories 329 340 Other 47 40 Total current assets $ 975 $ 923
Fixed assets: Property, plant, and $2,105 $1,630
equipment Less accumulated 687 560
depreciation Net property, plant, and $1,418 $1,070 equipment Intangible assets and others 406 363 Total fixed assets $1,824 $1,433
Total assets $2,799 $2,356
2007 2006Current liabilities: Accounts payable $ 263 $ 197 Notes payable 68 53 Accrued expenses 126 205 Total current $ 457 $ 455 liabilities
Long-term liabilities: Deferred taxes $ 143 $ 82 Long-term debt 629 589 Total long-term $ 772 $ 671 liabilities
Stockholders’ equity: Preferred stock $ 10 $ 10 Common stock 72 64 Capital surplus 438 399 Accumulated retained 1,147 822
earnings Less treasury stock �97 �65 Total equity $1,570 $1,230Total liabilities and shareholders’ equity $2,799 $2,356
Nick has also provided the following information: During the year the company raised $94,000 in new long-term debt and retired $54,000 in long-term debt. The company also sold $47,000 in new stock and repurchased $32,000 in stock. The company purchased $629,000 in fixed assets and sold $111,000 in fixed assets.
41
Min
i Cas
e
ros05902_ch02.indd 41ros05902_ch02.indd 41 10/6/06 1:09:15 PM10/6/06 1:09:15 PM
42 Part I Overview
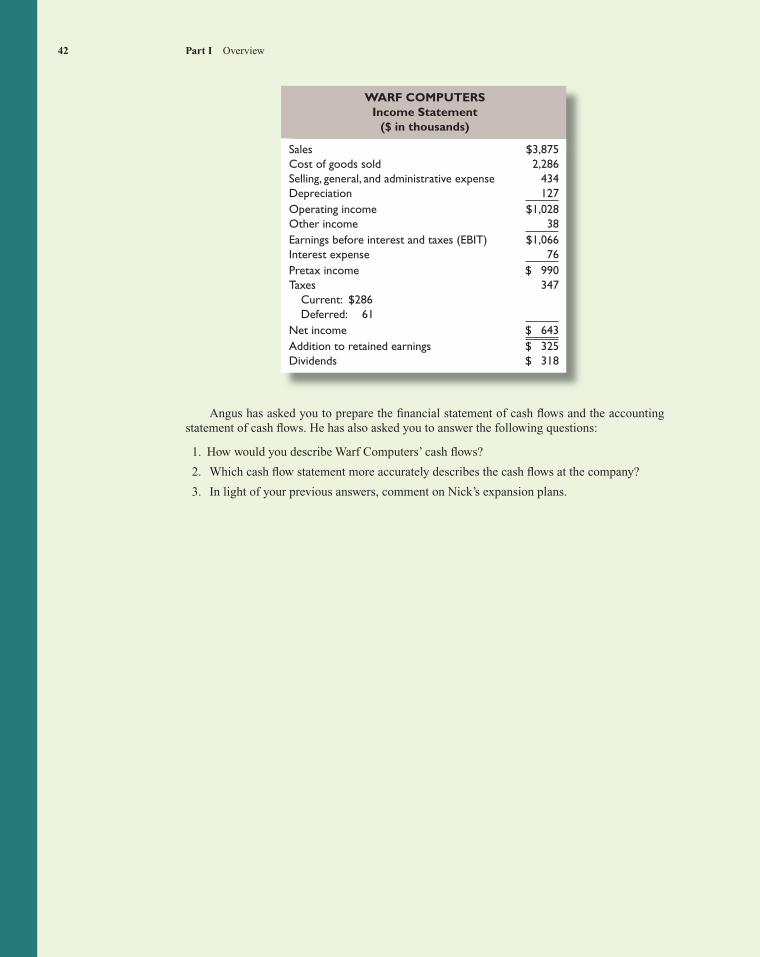
Angus has asked you to prepare the financial statement of cash flows and the accounting statement of cash flows. He has also asked you to answer the following questions:
1. How would you describe Warf Computers’ cash flows?
2. Which cash flow statement more accurately describes the cash flows at the company?
3. In light of your previous answers, comment on Nick’s expansion plans.
WARF COMPUTERS Income Statement
($ in thousands)
Sales $3,875Cost of goods sold 2,286Selling, general, and administrative expense 434Depreciation 127Operating income $1,028Other income 38Earnings before interest and taxes (EBIT) $1,066Interest expense 76Pretax income $ 990Taxes 347 Current: $286 Deferred: 61Net income $ 643Addition to retained earnings $ 325Dividends $ 318
ros05902_ch02.indd 42ros05902_ch02.indd 42 10/6/06 1:18:57 PM10/6/06 1:18:57 PM