Embed Size (px)
Citation preview
6
CHAPTER 2
Generic guidelines and tools to improve water efficiency
MOTIVATE FOR CHANGE
Water efficiency is a cost-effective component of good facility management. Studies have shown that water savings can result in additional resource and cost savings in areas that include wastewater treatment, energy use, and chemical consumption. 1 However, a comprehensive water efficiency program requires managerial and financial backing from top management. Without senior management support, it is often difficult to mobilize the necessary resources needed to kick start a water efficiency program and make initial investments.
A convincing case for top management support requires clear presentation of context-specific risks and opportunities associated with water use. The drivers for these risks and opportunities can vary from one country to another; however, they tend to group around regulatory conditions for water and waste regime, supply security and costs, competing demands, consumer awareness, and competitive pressures. Understanding the following drivers and elaborating them can elicit and motivate top management support:
1. Cost Savings
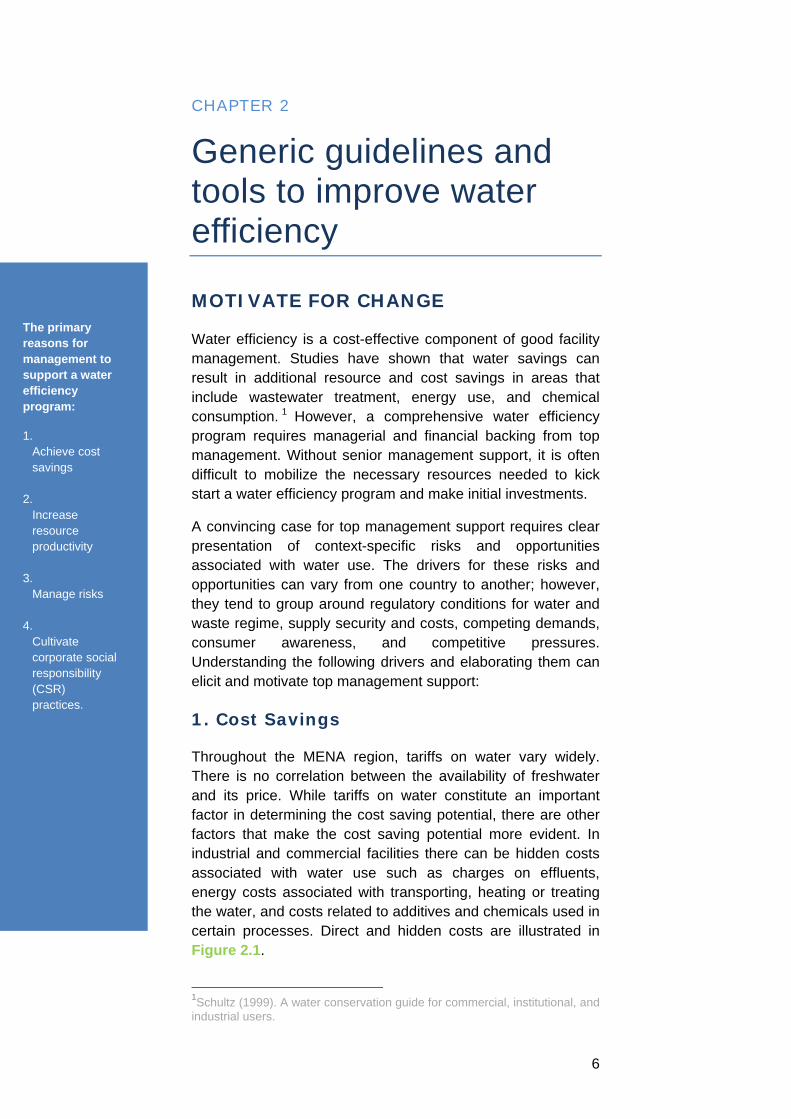
Throughout the MENA region, tariffs on water vary widely. There is no correlation between the availability of freshwater and its price. While tariffs on water constitute an important factor in determining the cost saving potential, there are other factors that make the cost saving potential more evident. In industrial and commercial facilities there can be hidden costs associated with water use such as charges on effluents, energy costs associated with transporting, heating or treating the water, and costs related to additives and chemicals used in certain processes. Direct and hidden costs are illustrated in Figure 2.1.
1Schultz (1999). A water conservation guide for commercial, institutional, and industrial users.
The primary reasons for management to support a water efficiency program:
1. Achieve cost savings
2.
Increase resource productivity
3.
Manage risks 4.
Cultivate corporate social responsibility (CSR) practices.
7
Figure 2.1: Direct and hidden costs of water use
2. Production Efficiency
Water efficient facilities are generally recognized for their higher resource productivity. A water efficiency program, through the facility audit and review process, can trigger attention to improvements in other areas of production such as waste minimization and energy efficiency. In industrial facilities, the additional water available from efficiency programs may enable increased production without necessitating the purchase of additional water.
3. Risk Management
Water related risks are becoming an emerging area of strategic importance for businesses and their financial supporters around the world. The drivers for these risks include: drought and drought cycles, water quality concerns, competing demand on water resources, institutional and managerial capacity for water governance, political and regulatory conditions, cross- boundary water and the risk of conflict, and local community and stakeholders concerns. For intensive water users, these risks can pose considerable and different types of legal and financial burden.2 Therefore, the business case for strategically addressing water challenges is becoming more compelling.
2 For a comprehensive review of water scarcity risk on business and their financial backers see: UNEP-FI (2007). Challenges of water scarcity: a business case for financial institutions.
8
4. Corporate Social Responsibility (CSR)
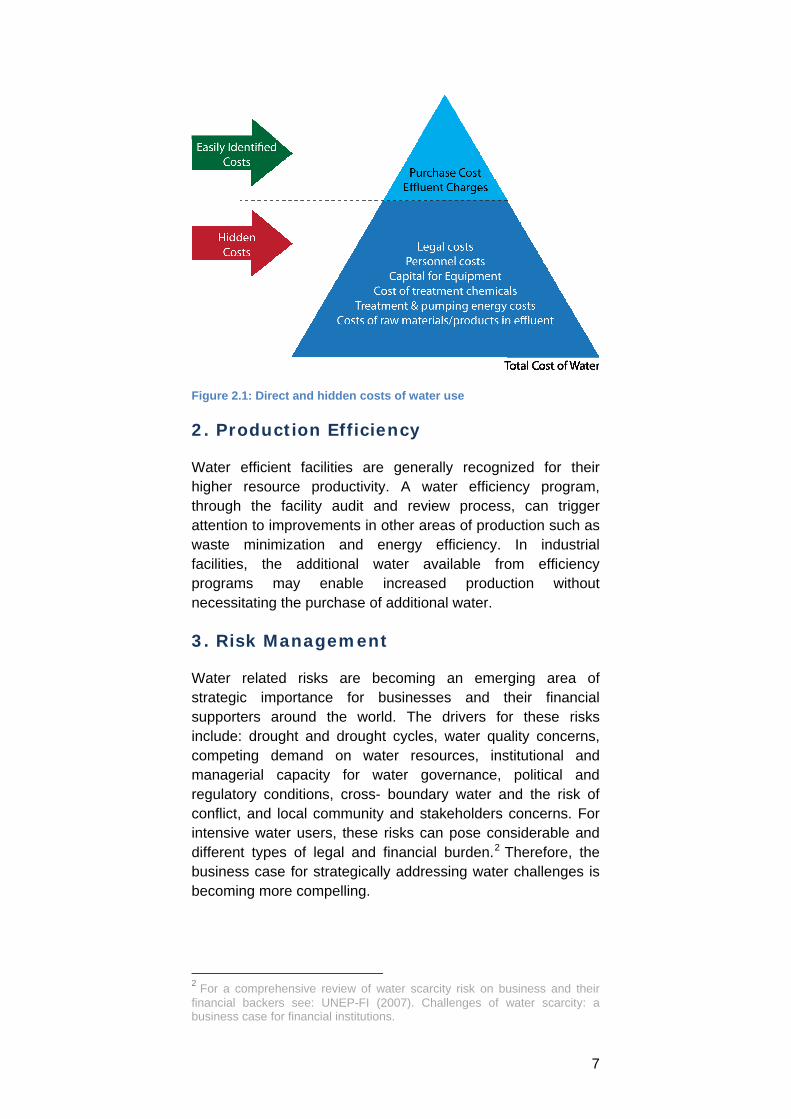
Internationally recognized voluntary initiatives and standards related to corporate environmental responsibility emphasize water and resource conservation as a key dimension of responsible corporate practices. For instance, regional companies attempting to apply the Global Reporting Initiative (GRI) guidelines for annual reporting will need to provide a comprehensive accounting of water use and management in their facilities. A water efficiency program enables the development of relevant key performance indicators (KPIs) that are useful for corporate responsibility communications.
ADOPTING A SYSTEMATIC APPROACH
There are many options and ways to improve water efficiency in commercial and industrial facilities. However, unorganized, ad-hoc approaches can lead to sub-optimal results. Therefore, a systematic approach is necessary in order to ensure the success of the water efficiency initiative and to achieve maximum return on investments.
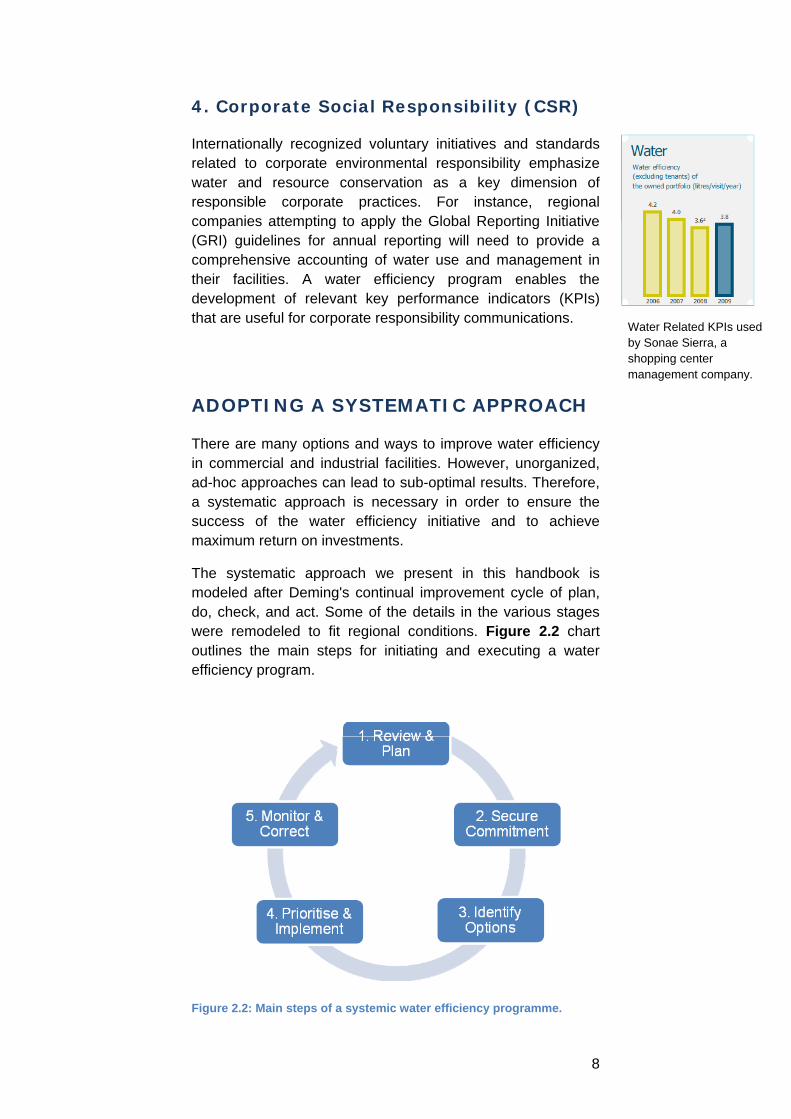
The systematic approach we present in this handbook is modeled after Deming's continual improvement cycle of plan, do, check, and act. Some of the details in the various stages were remodeled to fit regional conditions. Figure 2.2 chart outlines the main steps for initiating and executing a water efficiency program.
Figure 2.2: Main steps of a systemic water efficiency programme.
Water Related KPIs used by Sonae Sierra, a shopping center management company.
9
STEP 1
SITE REVIEW AND PLANNING
The main purpose of the site review and planning is to develop a base-line understanding of water use and to draft a plan for program implementation. The findings from this stage often serve as a roadmap for subsequent stages, allowing, for example, effective communication of benefits and costs of water efficiency programs in the organization or facility, which are necessary to secure the essential support and commitment of top management and employees. Activities that are included in the site review vary depending on the size and complexity of the site and available resources. In the following we present generic activities for the initial review, while recognizing that the resources invested into these activities must be considered in light of the size and type of facility.
Data inventory
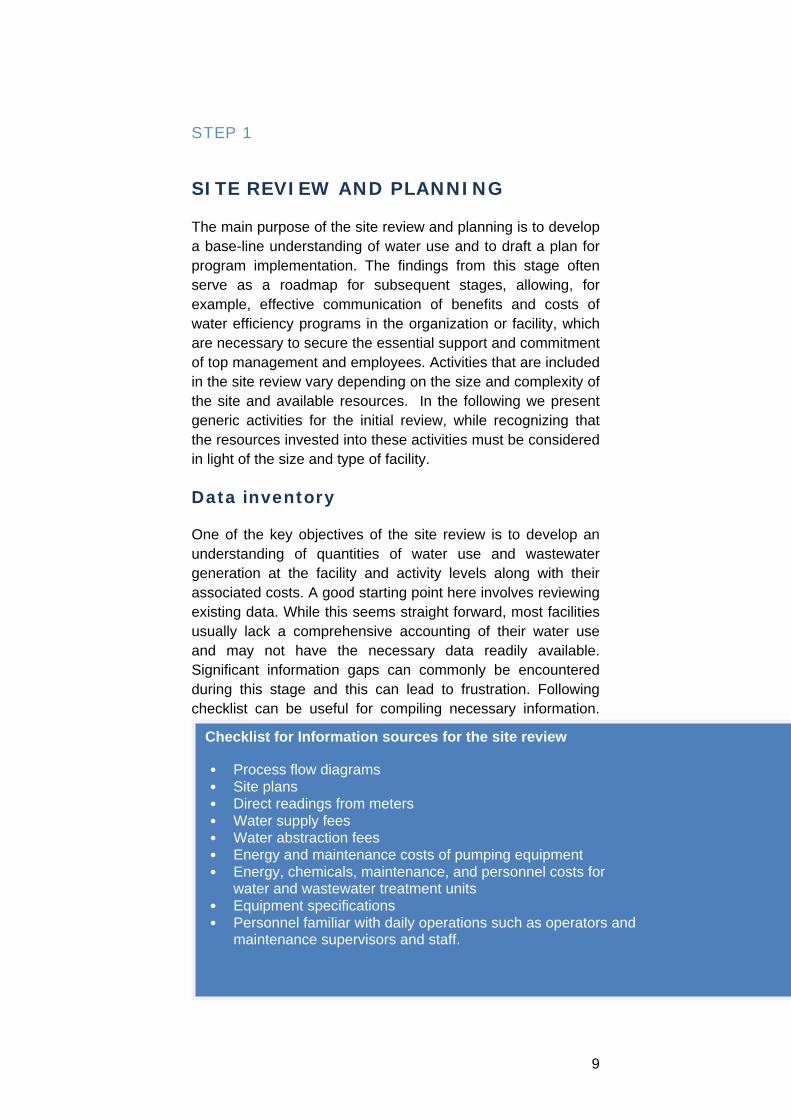
One of the key objectives of the site review is to develop an understanding of quantities of water use and wastewater generation at the facility and activity levels along with their associated costs. A good starting point here involves reviewing existing data. While this seems straight forward, most facilities usually lack a comprehensive accounting of their water use and may not have the necessary data readily available. Significant information gaps can commonly be encountered during this stage and this can lead to frustration. Following checklist can be useful for compiling necessary information.
Checklist for Information sources for the site review
• Process flow diagrams • Site plans • Direct readings from meters • Water supply fees • Water abstraction fees • Energy and maintenance costs of pumping equipment • Energy, chemicals, maintenance, and personnel costs for
water and wastewater treatment units • Equipment specifications • Personnel familiar with daily operations such as operators and
maintenance supervisors and staff.
10
Site survey
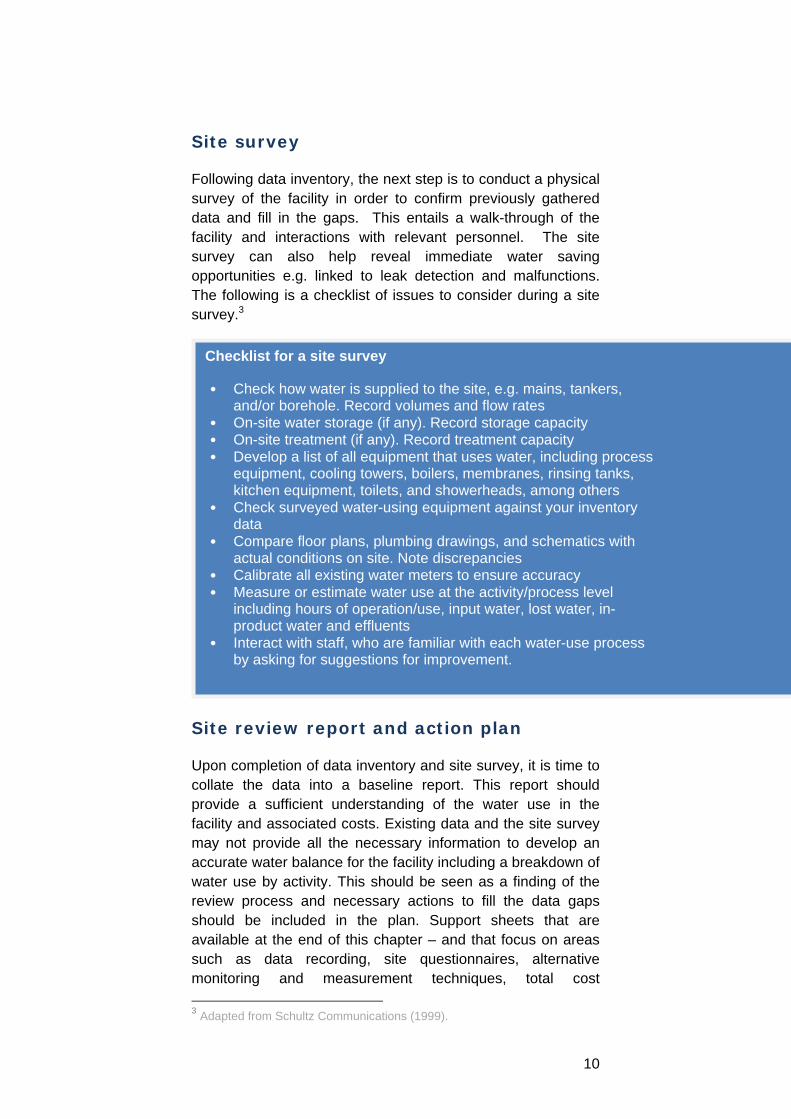
Following data inventory, the next step is to conduct a physical survey of the facility in order to confirm previously gathered data and fill in the gaps. This entails a walk-through of the facility and interactions with relevant personnel. The site survey can also help reveal immediate water saving opportunities e.g. linked to leak detection and malfunctions. The following is a checklist of issues to consider during a site survey.3
Site review report and action plan
Upon completion of data inventory and site survey, it is time to collate the data into a baseline report. This report should provide a sufficient understanding of the water use in the facility and associated costs. Existing data and the site survey may not provide all the necessary information to develop an accurate water balance for the facility including a breakdown of water use by activity. This should be seen as a finding of the review process and necessary actions to fill the data gaps should be included in the plan. Support sheets that are available at the end of this chapter – and that focus on areas such as data recording, site questionnaires, alternative monitoring and measurement techniques, total cost 3 Adapted from Schultz Communications (1999).
Checklist for a site survey
• Check how water is supplied to the site, e.g. mains, tankers, and/or borehole. Record volumes and flow rates
• On-site water storage (if any). Record storage capacity • On-site treatment (if any). Record treatment capacity • Develop a list of all equipment that uses water, including process
equipment, cooling towers, boilers, membranes, rinsing tanks, kitchen equipment, toilets, and showerheads, among others
• Check surveyed water-using equipment against your inventory data
• Compare floor plans, plumbing drawings, and schematics with actual conditions on site. Note discrepancies
• Calibrate all existing water meters to ensure accuracy • Measure or estimate water use at the activity/process level
including hours of operation/use, input water, lost water, in-product water and effluents
• Interact with staff, who are familiar with each water-use process by asking for suggestions for improvement.

11
accounting, visual presentation of data, and water quality assessment – can provide useful input for the planning phase.
Typically, a good baseline report should include the following:
Description of the facility, number of staff, production volumes or users (for a building), process flow diagrams for industrial facilities and functional maps for buildings.
A water flowchart that depicts the flow of water from the facility entry point to the point of discharge, including any reuse and recycle flows (see Support Sheet D for visual representation of data).
Water use figures (total facility as well as a breakdown by operating areas or processes) and temporal variations (see Support Sheet A for filling gaps in data).
Qualitative aspects of water flow in various areas (tap water, treated, greywater).
Total cost accounting of water use in the facility (see Support Sheet B on how to calculate total costs).
Summary of high volume/high cost water use activities or processes.
Any additional water use observations revealed by the site survey, operations, or maintenance staff.
Additionally, an action plan for harvesting water efficiency improvements should be developed. Ideally, this plan should cover the following:
Additional monitoring needs and time frames Preliminary efficiency targets (S.M.A.R.T tarets) Key performance indicators (KPIs) Allocation of responsibilities Time frame and milestones Resource requirements.
It is important that the targets set are S.M.A.R.T, that is they are:
• Simple • Measurable • Achievable • Recordable • Timed
12
STEP 2
SECURE COMMITEMENT & ENGAGEMENT
Achieving water efficiency requires a collective effort and demands support from within the organization. Top management, building owners, functional managers, and employees are particularly important parties.
Particularly in industrial facilities, getting TOP MANAGEMENT to have a good understanding of the objectives of water efficiency programs is key to securing high-level commitment. Top management should demonstrate support for the implementation plan by explicitly communicating its commitment to the program − by issuing a water productivity policy or including water use among the key performance indicators − and assigning direct responsibilities for the implementation of the plan.
Water efficiency work may have implications on other functions − production, maintenance, research and development (R&D), purchasing, and even marketing − and will demand their cooperation. Thus, it is also important to inform and engage LINE MANAGERS in water productivity work.
Finally, EMPLOYEES AND MAINTAINCE STAFF are a crucial group whose involvement in the program is crucial. For one, employees will be counted on to incorporate and implement water efficiency measures in their daily routines. Equally important, however, is the fact that employees often act as an important source of useful ideas for efficiency gains. Therefore, starting from the early stages of conception, employees should be tightly involved in the program. Incentive schemes that reward employees for their contributions to water-saving measures are often highly effective in keeping their engagement level high.
13
STEP 3
IDENTIFY IMPROVEMENT OPTIONS
In order to make a healthy identification of improvement potentials, it would be necessary to have a representative understanding of water use related aspects on the site, and therefore generation or collection of additional data could be needed. Once the quantitative and qualitative aspects of water use in the organization are identified, the focus should be turned into efficiency improvements. The following generic approaches are usually helpful for identifying and ranking improvement options.
Waste minimization hierarchy
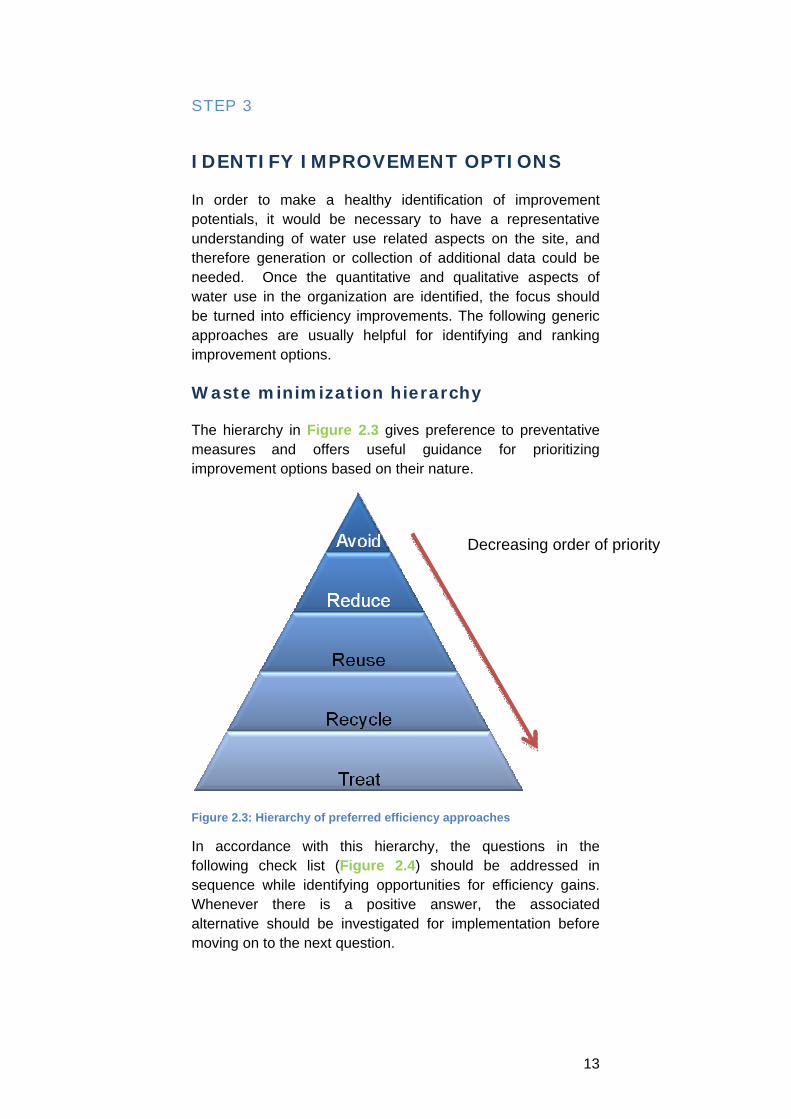
The hierarchy in Figure 2.3 gives preference to preventative measures and offers useful guidance for prioritizing improvement options based on their nature.
Figure 2.3: Hierarchy of preferred efficiency approaches
In accordance with this hierarchy, the questions in the following check list (Figure 2.4) should be addressed in sequence while identifying opportunities for efficiency gains. Whenever there is a positive answer, the associated alternative should be investigated for implementation before moving on to the next question.
Decreasing order of priority

14
Figure 2.4: Checklist for identifying improvement options
Knowledge of best practices
In identifying the improvement options, reviewing best practices applicable to water intensive areas in the early stages can be very useful. A resource list is available at the end of the handbook and examples of good practices are presented in chapters 3, 4, and 5, and in Appendix A.
Inventory of improvement options
As companies usually have limited resources, some of the identified options may not be possible to implement in the near future. It is, however, important to properly document these options so that they can be revisited in the future. Table 2.1 illustrates how to document improvement options.
Area of application
Suggested solution
Anticipated savings Implementation needs & Notes
Reactor cleaning
Use low-volume, high pressure jet cleaners
> 5,000 m3/year > US$10,500 /year
US$2,000 Investigate suppliers in market
Cooling towers
Recycle cooling tower blow-down
> 160,000 m3/year > US$200,000 /year
New treatment plant needed > US$300,000 investment Conduct detail feasibility assessment
... … … …
Table 2.1: Documenting an inventory of improvement opportunities
IMPLEMENT
No
No
No
No
No
Yes
Yes
Yes
Yes
Yes
Yes
15
STEP 4
PRIORITIZE AND IMPLEMENT
More often, the resources available for efficiency improvements are limited and therefore not all the identified options can be implemented. Therefore, the best cost to benefit ratio needs to be identified prior to implementation of measures.
In such assessments, financial outlook of the options tend to be the overriding factor. There are different ways of assessing the financial performance of investments, and different firms prefer different approaches. While additional information on some of the common methods – such as Return on Investment and Net Present Value – is given in Support Sheet C, the users are encouraged to make their financial calculations in accordance with the preferences of their company/site.
It should also be noted that some other aspects can significantly affect the costs and benefits linked to water efficiency investments and need to be taken into consideration with care. Examples of these include:
Product quality, safety, and process stability Proposed improvement options may have a positive or negative impact on product quality, process stability, and workplace or user safety. While positive influences can result in additional benefits, negative ones may be linked to prohibitively large risks. After all, as important as water saving might be, it should not override product quality or safety concerns.
Effect on long-term risks In some cases identified improvements can be highly important for avoiding future risks − linked to, for example, anticipated regulations or conflicts with business partners or customers. These are important to take into consideration and can tilt the decision in their favor, particularly if their benefits can be expressed in monetary terms.
Internal Competencies The implementation of efficiency improvement projects adds to the learning capabilities of organizations. These projects provide opportunities for employees to acquire new competencies and develop new skills. In this sense, disruption to work flow should be welcomed as an avenue for professional development and employee retention.
16
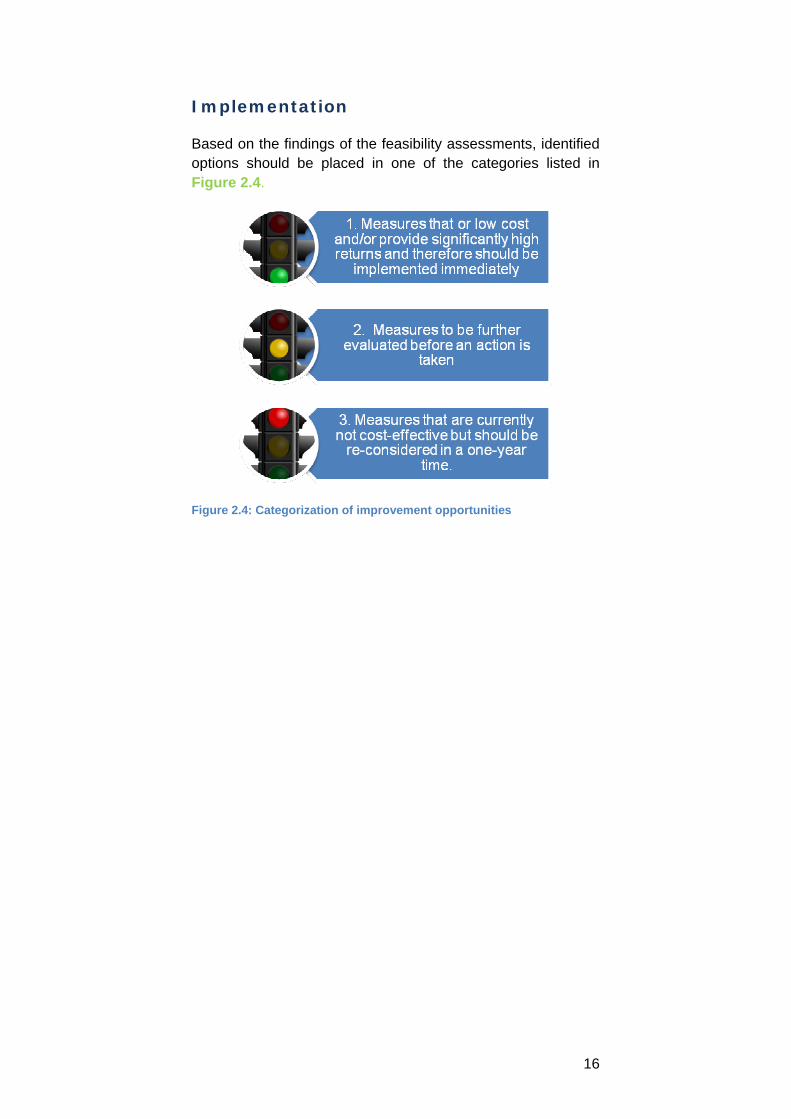
Implementation
Based on the findings of the feasibility assessments, identified options should be placed in one of the categories listed in Figure 2.4.
Figure 2.4: Categorization of improvement opportunities
17
STEP 5
MONITOR AND IMPORVE
Once efficiency measures are implemented, these should be closely monitored in order to assess whether the planned performance targets are met. If the observed performance is below target, reasons of under performance should be investigated and corrective measures should be identified and implemented. If necessary, monitoring, reasoning and corrective action cycle should be continued until the desired performance level is reached.
It is important to point out that water efficiency programs should not be treated as a one-time product or event. Rather efficiency should become an integral part of the organizational culture. After the first set of measures are implemented and fine-tuned, the program should move to its next stage by starting with a new review and planning step and continuing subsequent steps. Cultivating and nurturing this mindset in operations takes time. Communicating the results of the first set of improvement measures can create a leverage to initiate the next set of measures, which will slowly and surely put the organization on the path to becoming a water efficient entity.
WIDER ADOPTION OF THE SYSTEMIC APPROACH
Although some individual companies, motivated by economic incentives, apply a systemic approach to water efficiency, a large-scale adoption usually needs to be stimulated. Some factors that have proven to be effective in stimulating water efficiency in Western countries include:
Stricter effluent discharge standards Demands from clients and business partners Informational and educational programs by
governments Mandated water efficiency audits for facility and
operational permits.
18
SUPPORT SHEET A
DATA COMPILATION
It is of utmost importance that the data is collected in a systemic way. Following provide examples of templates that can be used for compiling relevant information that are needed in improvement programs.
Whereas manual collection and handling of data is common practice and often provides sufficient results, there is an increasing trend towards automated, electronic data logging. Particularly suited for larger and more complex sites, such data logging approaches offer a number of benefits in terms of providing timely monitoring and detailed analyses.
19
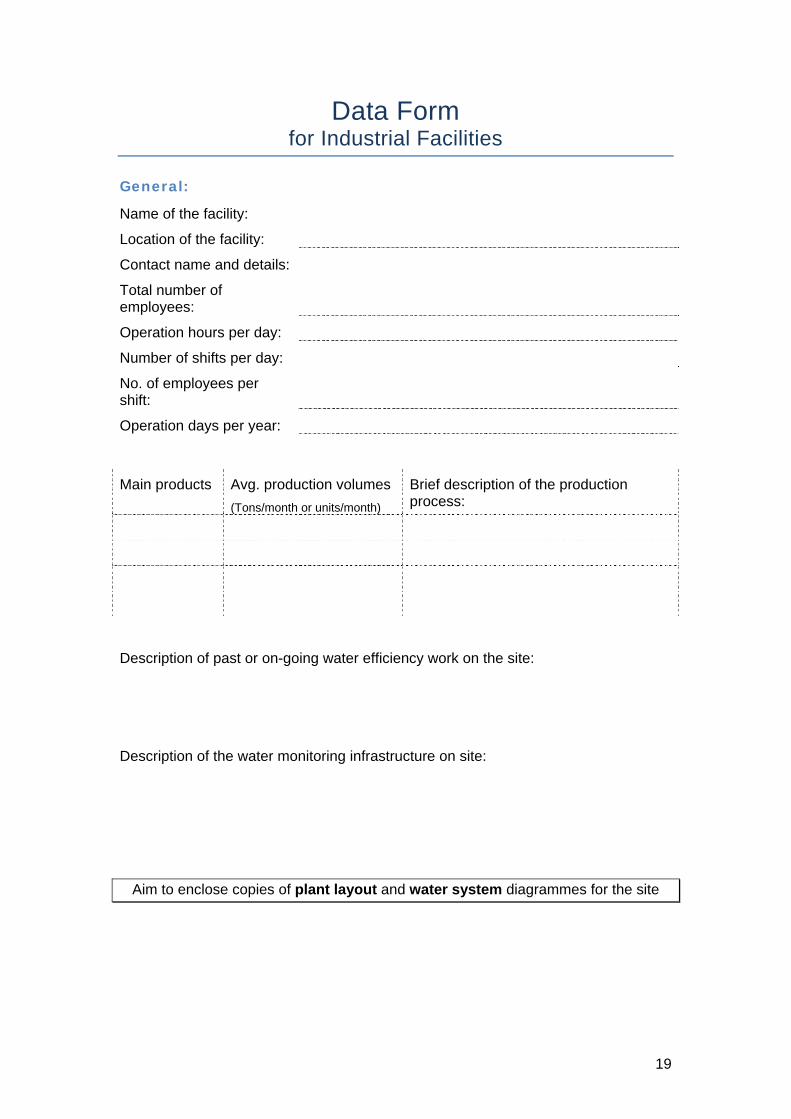
Data Form for Industrial Facilities
General:
Name of the facility:
Location of the facility:
Contact name and details:
Total number of employees:
Operation hours per day:
Number of shifts per day:
No. of employees per shift:
Operation days per year:
Main products Avg. production volumes (Tons/month or units/month)
Brief description of the production process:
Description of past or on-going water efficiency work on the site:
Description of the water monitoring infrastructure on site:
Aim to enclose copies of plant layout and water system diagrammes for the site
20
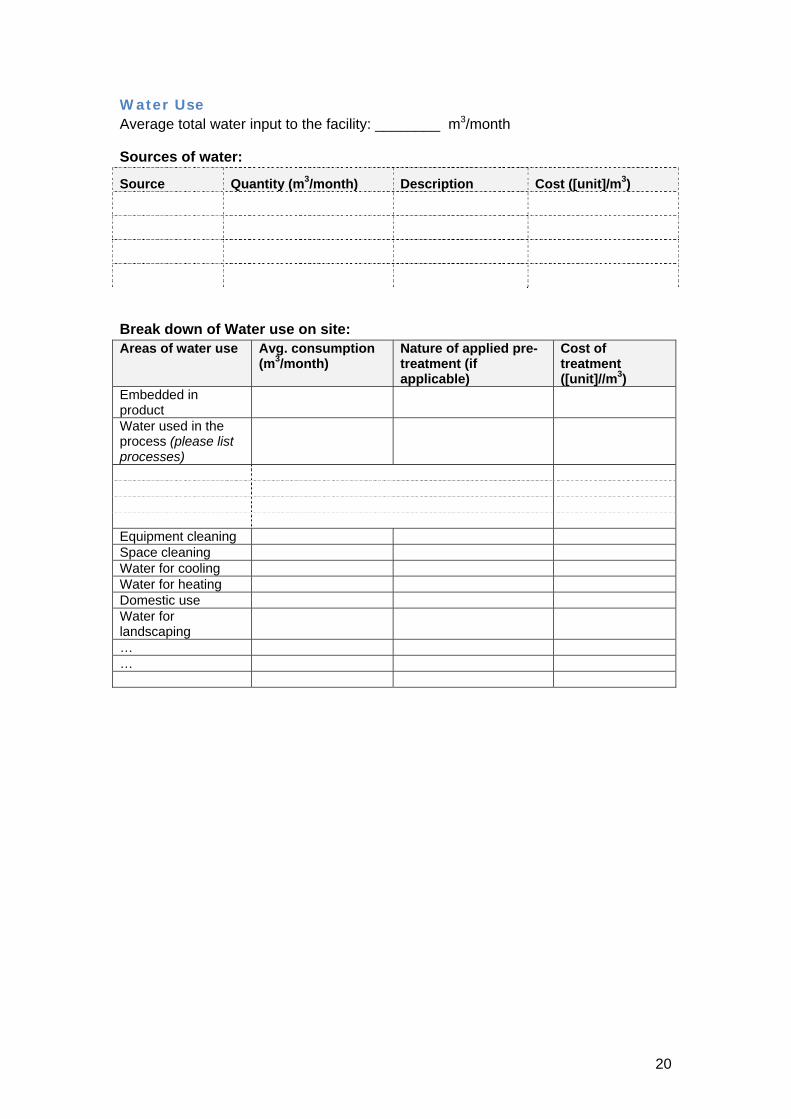
Water Use Average total water input to the facility: ________ m3/month
Sources of water:
Source Quantity (m3/month) Description Cost ([unit]/m3)
Break down of Water use on site: Areas of water use Avg. consumption
(m3/month) Nature of applied pre-treatment (if applicable)
Cost of treatment ([unit]//m3)
Embedded in product
Water used in the process (please list processes)
Equipment cleaning Space cleaning Water for cooling Water for heating Domestic use Water for landscaping
… …
21
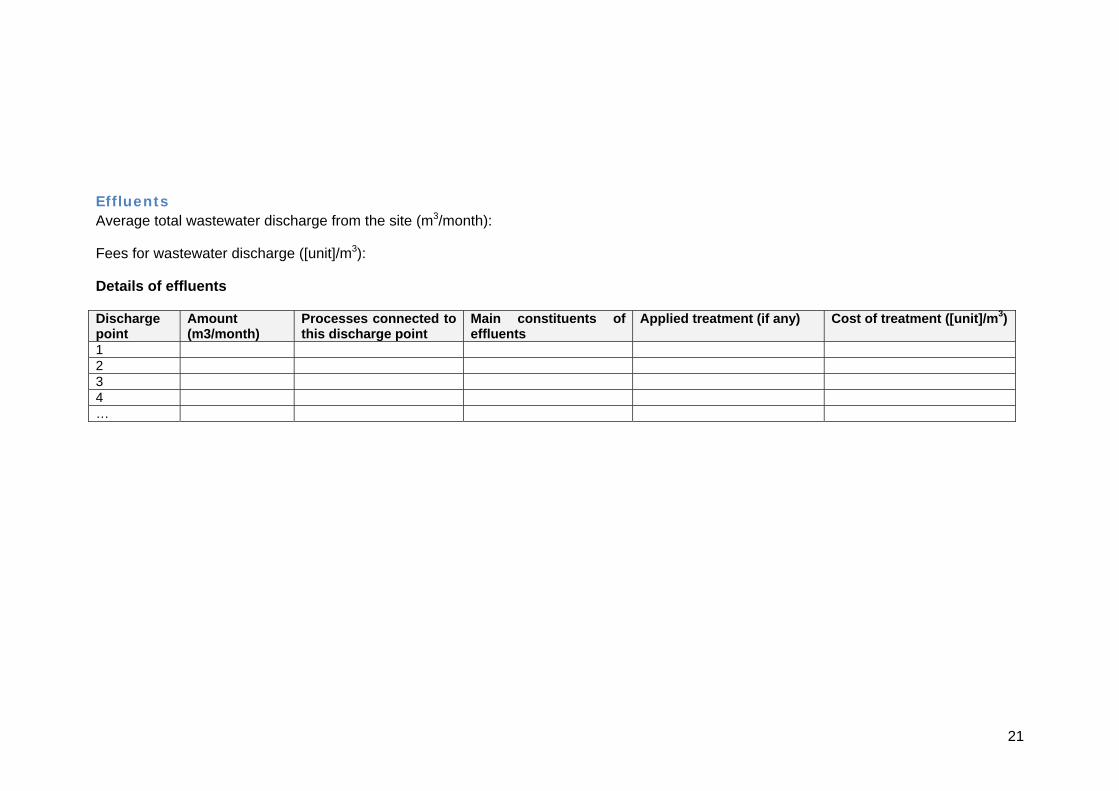
Effluents Average total wastewater discharge from the site (m3/month):
Fees for wastewater discharge ([unit]/m3):
Details of effluents
Discharge point
Amount (m3/month)
Processes connected to this discharge point
Main constituents of effluents
Applied treatment (if any) Cost of treatment ([unit]/m3)
1 2 3 4 …
22
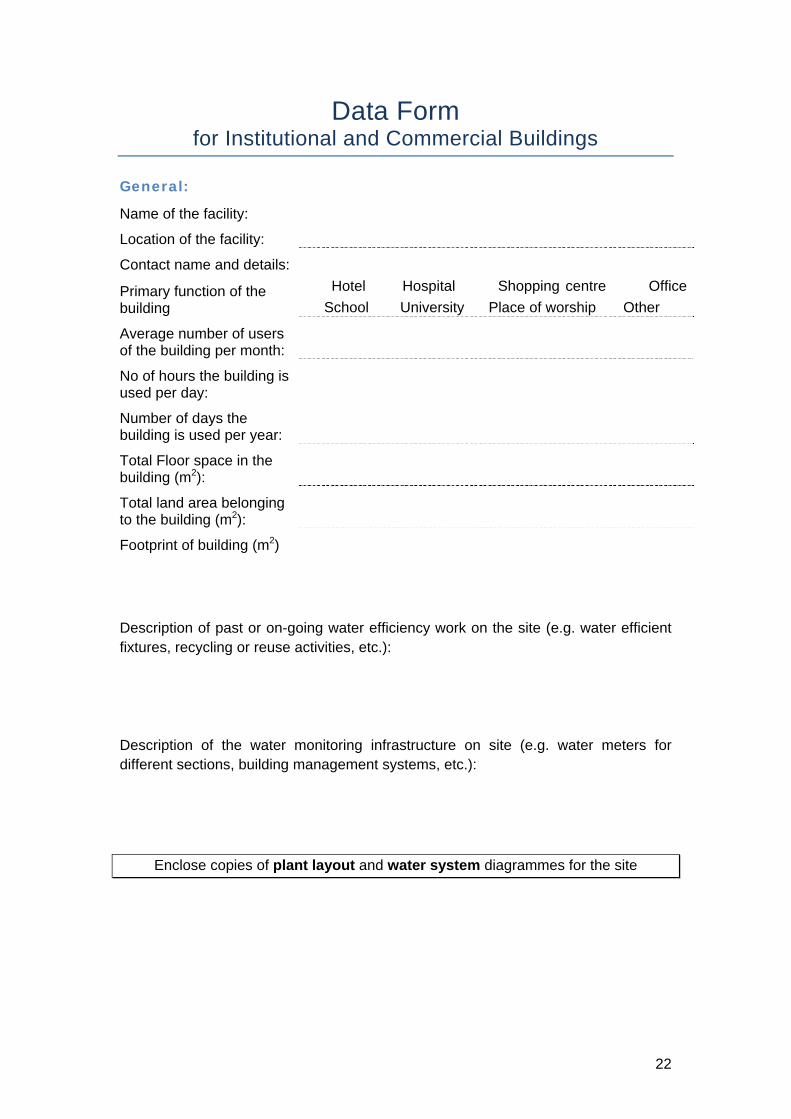
Data Form for Institutional and Commercial Buildings
General:
Name of the facility:
Location of the facility:
Contact name and details:
Primary function of the building
� Hotel � Hospital � Shopping centre � Office � School � University � Place of worship � Other
Average number of users of the building per month:
No of hours the building is used per day:
Number of days the building is used per year:
Total Floor space in the building (m2):
Total land area belonging to the building (m2):
Footprint of building (m2)
Description of past or on-going water efficiency work on the site (e.g. water efficient fixtures, recycling or reuse activities, etc.):
Description of the water monitoring infrastructure on site (e.g. water meters for different sections, building management systems, etc.):
Enclose copies of plant layout and water system diagrammes for the site

23
Water Use Average total water input to the facility: ________ m3/month
Sources of water:
Source Quantity (m3/month) Description Cost ([unit]/m3)
Break down of Water use on site: Areas of water use Avg. consumption
(m3/month) Nature of applied pre-treatment (if applicable)
Cost of treatment ([unit]/m3)
Guest or patient rooms Public toilets and wash basins
Public showers HVAC or cooling Heating Kitchen Laundry Space cleaning Recreational (swimming pool, spa, etc.)
Ornamental equipment (fountains, etc.)
Water for landscaping Fire fighting
Leakage:
Known or estimated amounts of leakage on site: ________ m3/month
For shopping centers:
Is the centre management responsible for the water supply and wastewater discharge of the tenants: � Yes � No
24
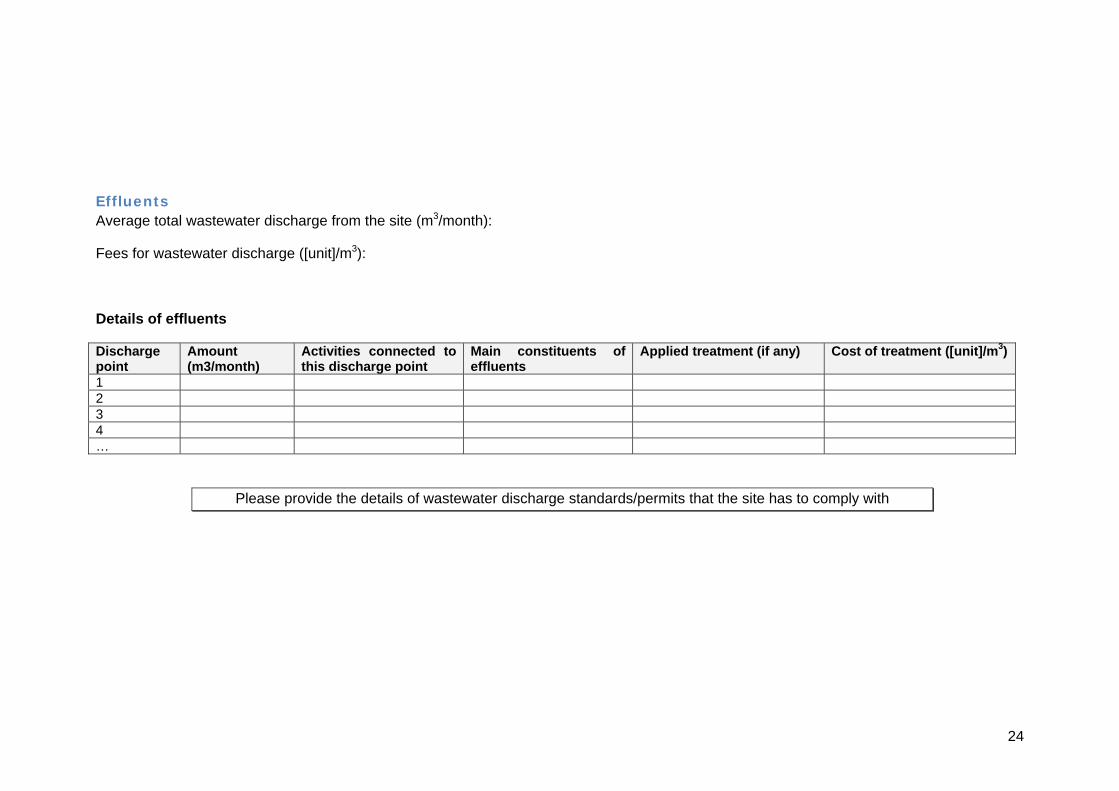
Effluents Average total wastewater discharge from the site (m3/month):
Fees for wastewater discharge ([unit]/m3):
Details of effluents
Discharge point
Amount (m3/month)
Activities connected to this discharge point
Main constituents of effluents
Applied treatment (if any) Cost of treatment ([unit]/m3)
1 2 3 4 …
Please provide the details of wastewater discharge standards/permits that the site has to comply with
25
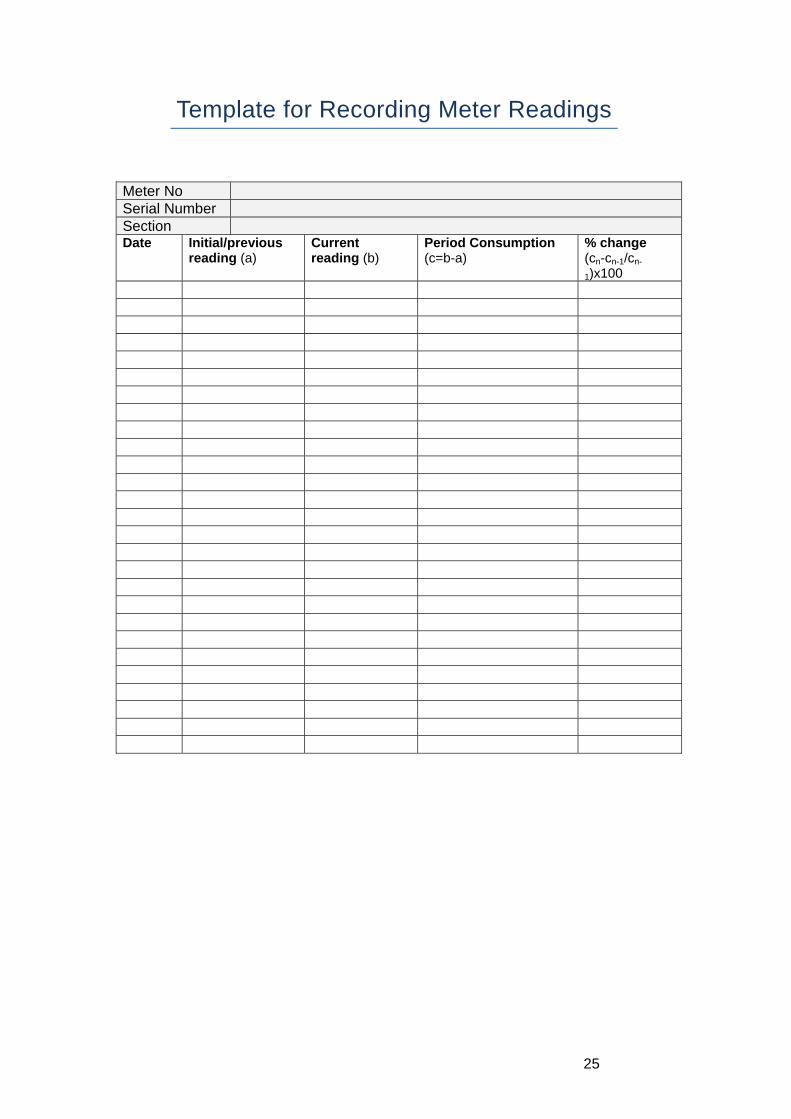
Template for Recording Meter Readings
Meter No Serial Number Section Date Initial/previous
reading (a) Current reading (b)
Period Consumption (c=b-a)
% change (cn-cn-1/cn-
1)x100
26
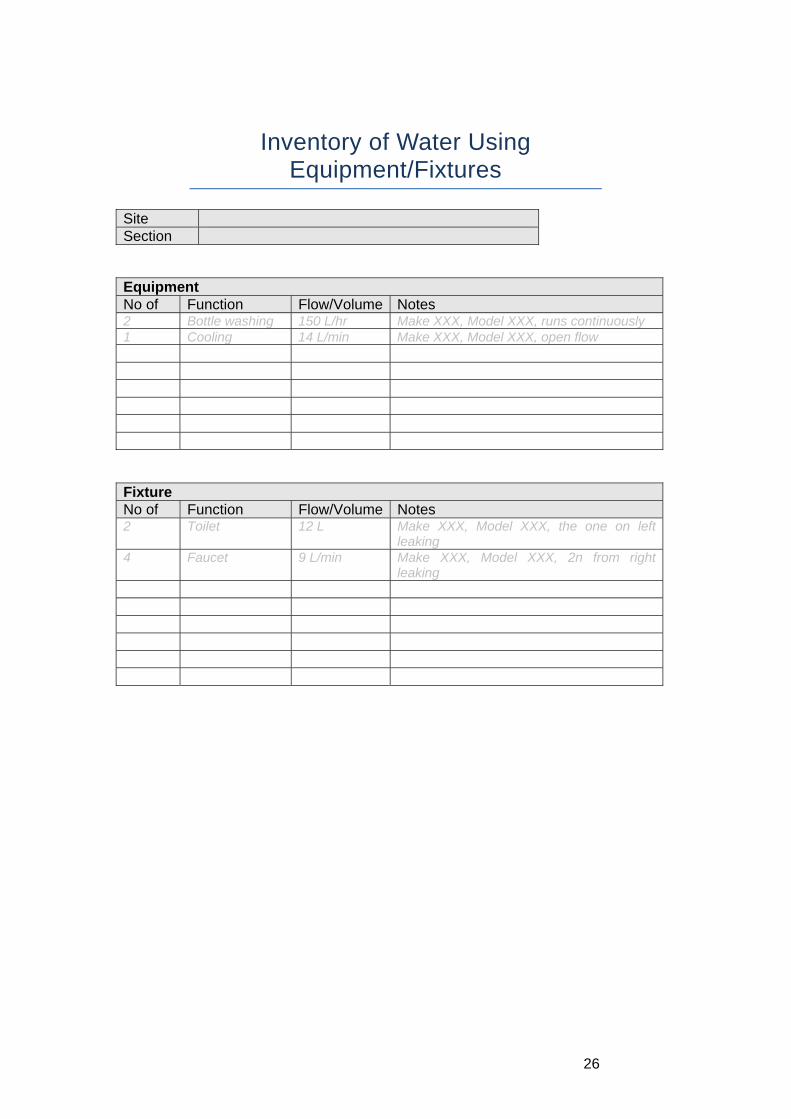
Inventory of Water Using Equipment/Fixtures
Site Section
Equipment No of Function Flow/Volume Notes 2 Bottle washing 150 L/hr Make XXX, Model XXX, runs continuously 1 Cooling 14 L/min Make XXX, Model XXX, open flow
Fixture No of Function Flow/Volume Notes 2 Toilet 12 L Make XXX, Model XXX, the one on left
leaking4 Faucet 9 L/min Make XXX, Model XXX, 2n from right
leaking
27
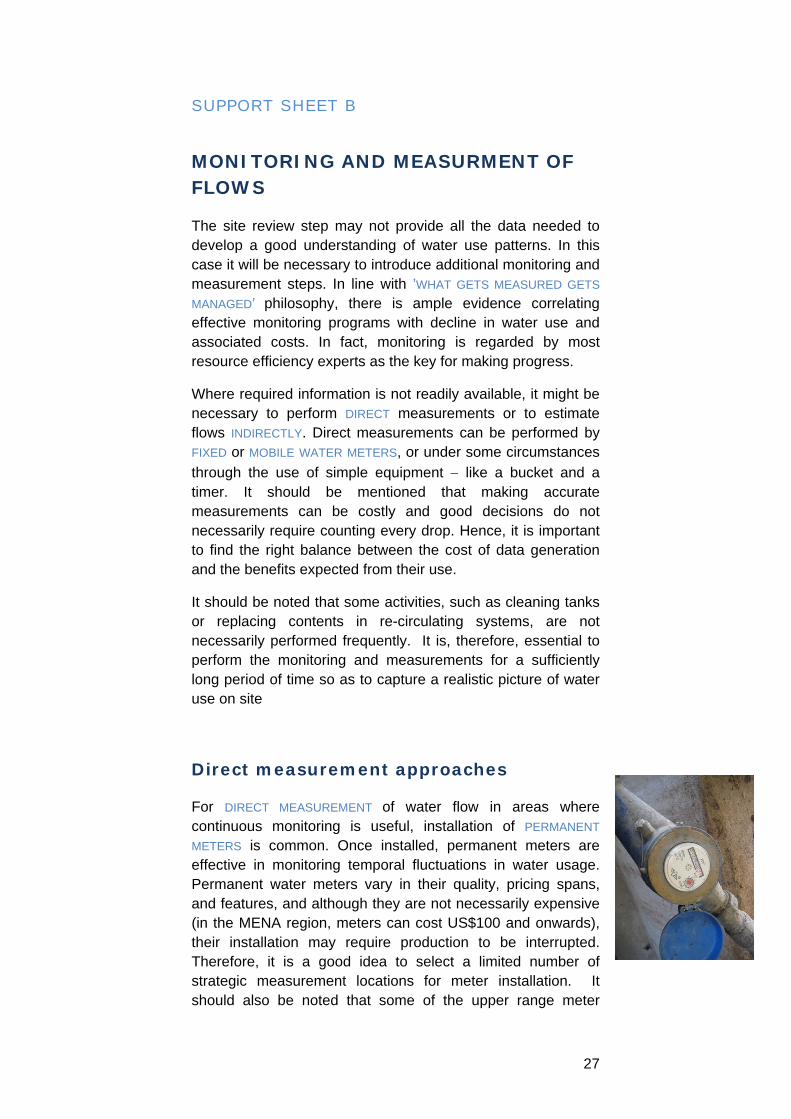
SUPPORT SHEET B
MONITORING AND MEASURMENT OF FLOWS
The site review step may not provide all the data needed to develop a good understanding of water use patterns. In this case it will be necessary to introduce additional monitoring and measurement steps. In line with ’WHAT GETS MEASURED GETS MANAGED’ philosophy, there is ample evidence correlating effective monitoring programs with decline in water use and associated costs. In fact, monitoring is regarded by most resource efficiency experts as the key for making progress.
Where required information is not readily available, it might be necessary to perform DIRECT measurements or to estimate flows INDIRECTLY. Direct measurements can be performed by FIXED or MOBILE WATER METERS, or under some circumstances through the use of simple equipment − like a bucket and a timer. It should be mentioned that making accurate measurements can be costly and good decisions do not necessarily require counting every drop. Hence, it is important to find the right balance between the cost of data generation and the benefits expected from their use.
It should be noted that some activities, such as cleaning tanks or replacing contents in re-circulating systems, are not necessarily performed frequently. It is, therefore, essential to perform the monitoring and measurements for a sufficiently long period of time so as to capture a realistic picture of water use on site
Direct measurement approaches
For DIRECT MEASUREMENT of water flow in areas where continuous monitoring is useful, installation of PERMANENT METERS is common. Once installed, permanent meters are effective in monitoring temporal fluctuations in water usage. Permanent water meters vary in their quality, pricing spans, and features, and although they are not necessarily expensive (in the MENA region, meters can cost US$100 and onwards), their installation may require production to be interrupted. Therefore, it is a good idea to select a limited number of strategic measurement locations for meter installation. It should also be noted that some of the upper range meter

28
models allow for distance readings and direct integration with data logging systems, that can prove to be more cost effective in the long run.
Use of non-contact, NON-INVASIVE PORTABLE FLOW METERS provides another alternative. There are various models of these meters utilizing different techniques for measurement. Using ultrasonic technology to measure the flow by tracing the movement of minute impurities in flowing water is common. Portable, non-contact meters can be less precise than fixed meters, but they are highly useful for obtaining flow readings quickly from different parts of the site and without any interruption to the process.
Reliable information can however be obtained by using much simpler methods. For example, in those cases where it is possible to direct the
water/effluent flow into a container, measurements can be taken with the help of a bucket and a timer. The water is let to fill the bucket of a known volume while measuring the amount of time it takes for filling. Dividing the bucket volume by the number of seconds it took to fill yields the flow-rate in terms of liters/second.
Indirect calculation approaches
When direct measurement is not possible or feasible, useful approximations can be made to estimate water flow rates. The following are commonly used estimation methods:
CALCULATE FROM OTHER MEASUREMENTS: In certain cases the missing data can be calculated by using data available in other linked activities/processes. For example, if water is used in three production lines, and the consumption figures for two of them are known, the third one can be calculated by subtracting water use in two lines from the total water supplied.
ESTIMATING FROM PROCESS KNOWLEDGE: Process knowledge can be a useful tool for estimating certain flows. For example, to calculate the water consumed in rinsing operations, good estimations can be reached based on knowledge of the tank dimensions, the extent to which the tank is filled in each rinsing cycle, and the number of cycles necessary to complete rinsing.
29
CALCULATIONS BASED ON MANUFACTURER’S INFORMATION: Manufacturers of equipment usually provide operational parameters, such as “water use per hour” or “water use per cycle”, in equipment manuals. When suggested operational parametes of the equipment are combined with user observations, it may be possible to make estimates of water flows. Care must be exercised to determine if, and when, modifications have been made to the original design.
STUDYING TYPICAL OPERATION/BEHAVIOR AND USING TYPICAL DATA: This method can be particularly useful in estimating flows for distributed uses - such as water consumed for toilets and showers. Based on average number of utilization and average specific consumption figures, reasonable approximations can be made. For example, if there are 120 employees working in three shifts, and two thirds of the employees are taking a shower for five minutes after their shift, and if the installed showers consume about 15 liters per minute, daily water consumption for showers is likely to be around 6,000 liters/day.
30
SUPPORT SHEET C
TOTAL WATER COST ACCOUNTING & FINANCIAL ASSESSMENTS
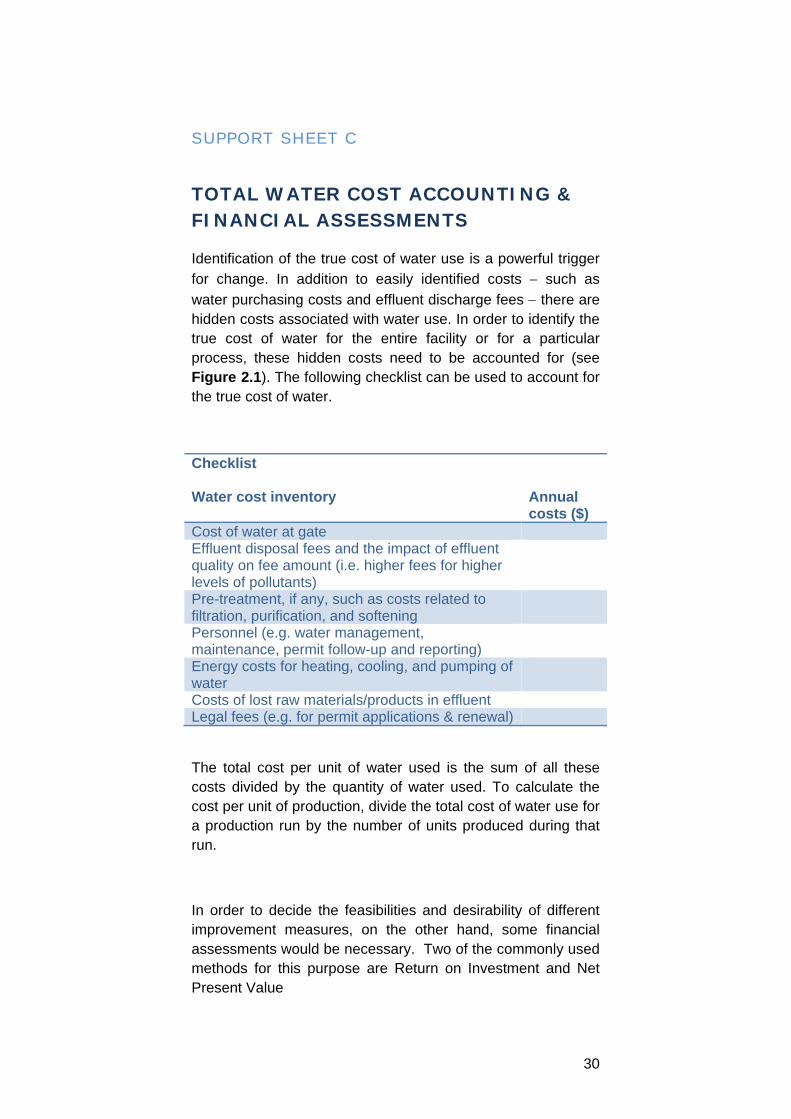
Identification of the true cost of water use is a powerful trigger for change. In addition to easily identified costs − such as water purchasing costs and effluent discharge fees − there are hidden costs associated with water use. In order to identify the true cost of water for the entire facility or for a particular process, these hidden costs need to be accounted for (see Figure 2.1). The following checklist can be used to account for the true cost of water.
Checklist Water cost inventory
Annual costs ($)
Cost of water at gate Effluent disposal fees and the impact of effluent quality on fee amount (i.e. higher fees for higher levels of pollutants)
Pre-treatment, if any, such as costs related to filtration, purification, and softening
Personnel (e.g. water management, maintenance, permit follow-up and reporting)
Energy costs for heating, cooling, and pumping of water
Costs of lost raw materials/products in effluent Legal fees (e.g. for permit applications & renewal)
The total cost per unit of water used is the sum of all these costs divided by the quantity of water used. To calculate the cost per unit of production, divide the total cost of water use for a production run by the number of units produced during that run.
In order to decide the feasibilities and desirability of different improvement measures, on the other hand, some financial assessments would be necessary. Two of the commonly used methods for this purpose are Return on Investment and Net Present Value
31
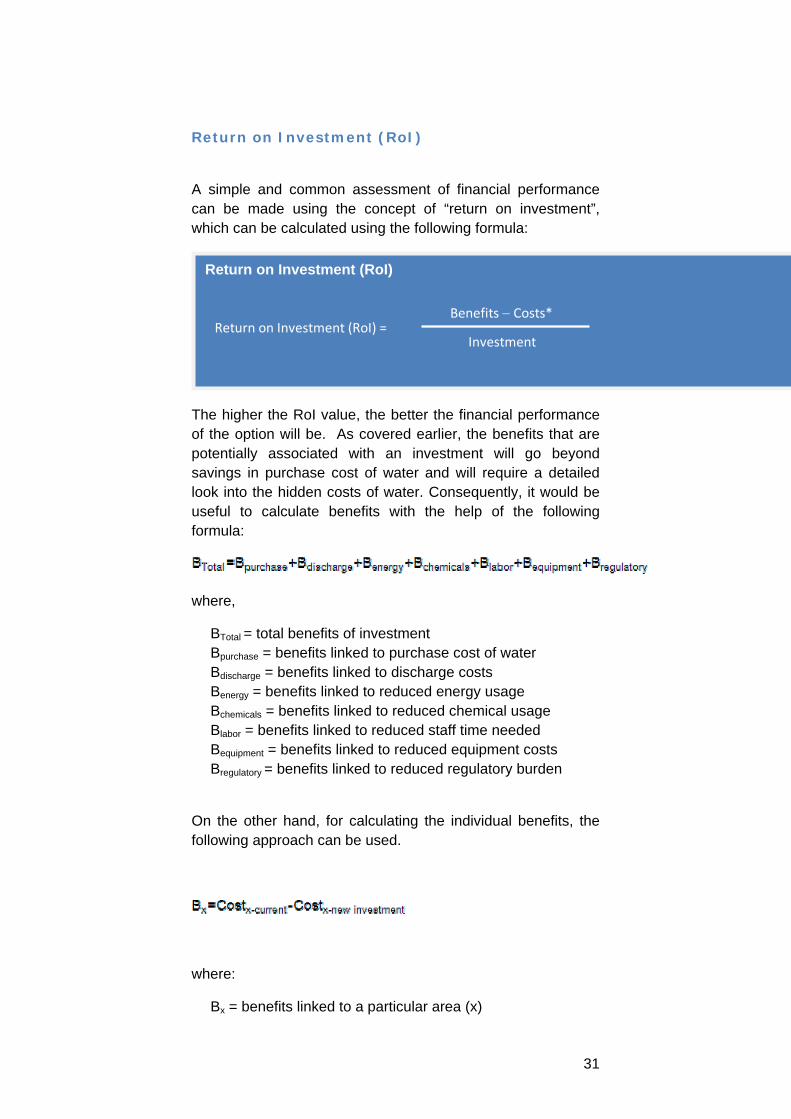
Return on Investment (RoI)
A simple and common assessment of financial performance can be made using the concept of “return on investment”, which can be calculated using the following formula:
The higher the RoI value, the better the financial performance of the option will be. As covered earlier, the benefits that are potentially associated with an investment will go beyond savings in purchase cost of water and will require a detailed look into the hidden costs of water. Consequently, it would be useful to calculate benefits with the help of the following formula:
where,
BTotal = total benefits of investment Bpurchase = benefits linked to purchase cost of water Bdischarge = benefits linked to discharge costs Benergy = benefits linked to reduced energy usage Bchemicals = benefits linked to reduced chemical usage Blabor = benefits linked to reduced staff time needed Bequipment = benefits linked to reduced equipment costs Bregulatory = benefits linked to reduced regulatory burden
On the other hand, for calculating the individual benefits, the following approach can be used.
where:
Bx = benefits linked to a particular area (x)
Return on Investment (RoI)
Return on Investment (RoI) = Benefits − Costs*
Investment
32
Costx-current = Costs related to x with current situation Costx-new investment = Expected costs related to x with new
investment
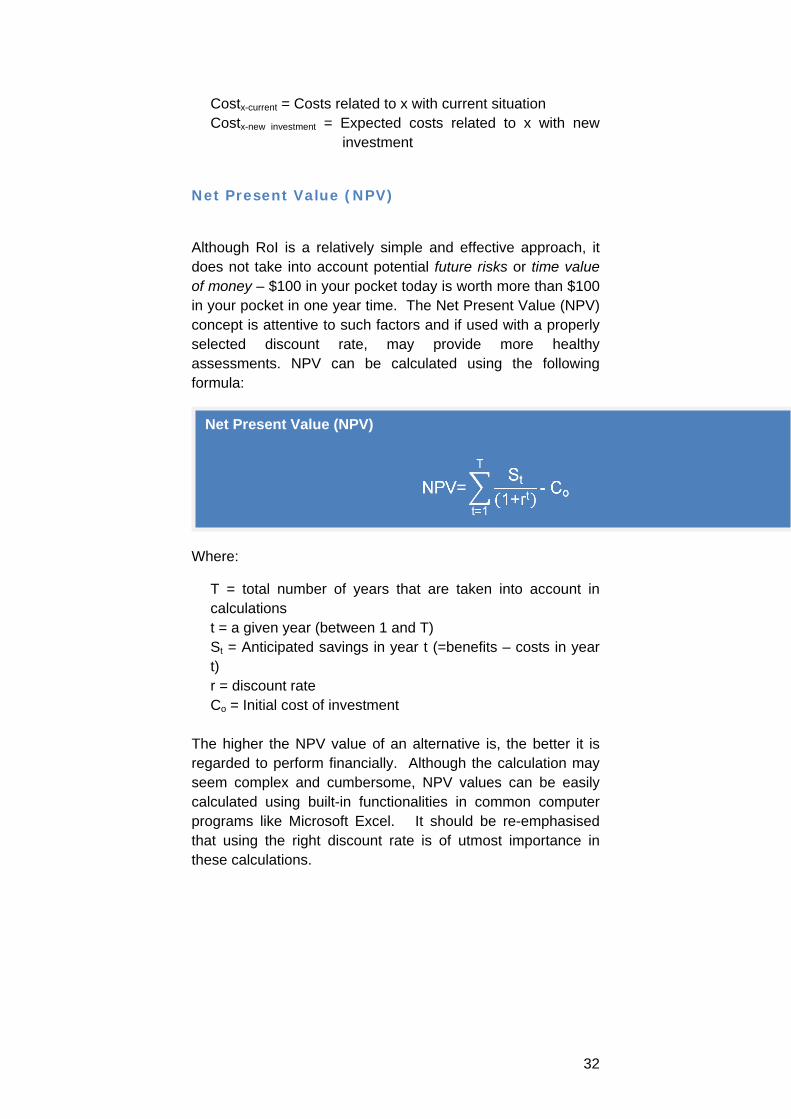
Net Present Value (NPV)
Although RoI is a relatively simple and effective approach, it does not take into account potential future risks or time value of money – $100 in your pocket today is worth more than $100 in your pocket in one year time. The Net Present Value (NPV) concept is attentive to such factors and if used with a properly selected discount rate, may provide more healthy assessments. NPV can be calculated using the following formula:
Where:
T = total number of years that are taken into account in calculations t = a given year (between 1 and T) St = Anticipated savings in year t (=benefits – costs in year t) r = discount rate Co = Initial cost of investment
The higher the NPV value of an alternative is, the better it is regarded to perform financially. Although the calculation may seem complex and cumbersome, NPV values can be easily calculated using built-in functionalities in common computer programs like Microsoft Excel. It should be re-emphasised that using the right discount rate is of utmost importance in these calculations.
Net Present Value (NPV)

33
SUPPORT SHEET D
VISUAL COMMUNICAITON OF WATER USE DATA AND WATER FLOWS
Monitoring measures can generate water flow data on an hourly, daily, weekly, and monthly basis or over an extended period of time. The purpose is to generate a representative view of water use under different operational conditions commonly observed in the facility. The optimum duration can vary from facility to facility but often collection of data for several weeks or months is desirable. This data needs to be systematically logged for further analysis. In addition, water flow data may need to be combined with other relevant data to become meaningful.
It is often desirable to communicate water use information using easy-to-understand visual representations. Water usage/discharge graphs over a time series, block diagrams, and Sankey diagrams are particularly useful tools for visual representation of data.
Time series graphs
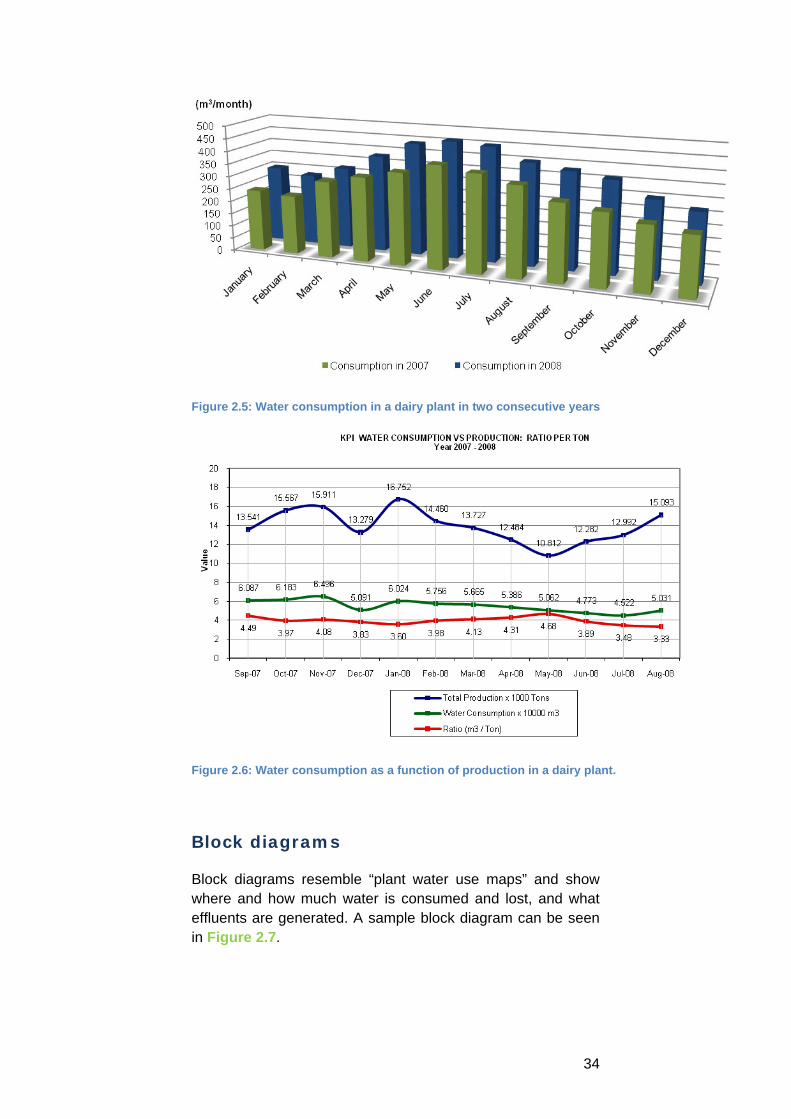
Graphs that depict water use over a time series, as shown in Figure 2.5, and possibly comparing rates of consumption or effluent generation over time, help to visually understand fluctuations. Combining such data with other information – such as production volume, product type, number of employees/operators, or ambient air temperature − that can also be shown on the same graph often enable more meaningful analysis. For example, in Figure 2.6 it can be observed that although production has steadily increased after May 2008, the water consumption continued to drop as a result of the efficiency measures implemented by the plant.
34
Figure 2.5: Water consumption in a dairy plant in two consecutive years
Figure 2.6: Water consumption as a function of production in a dairy plant.
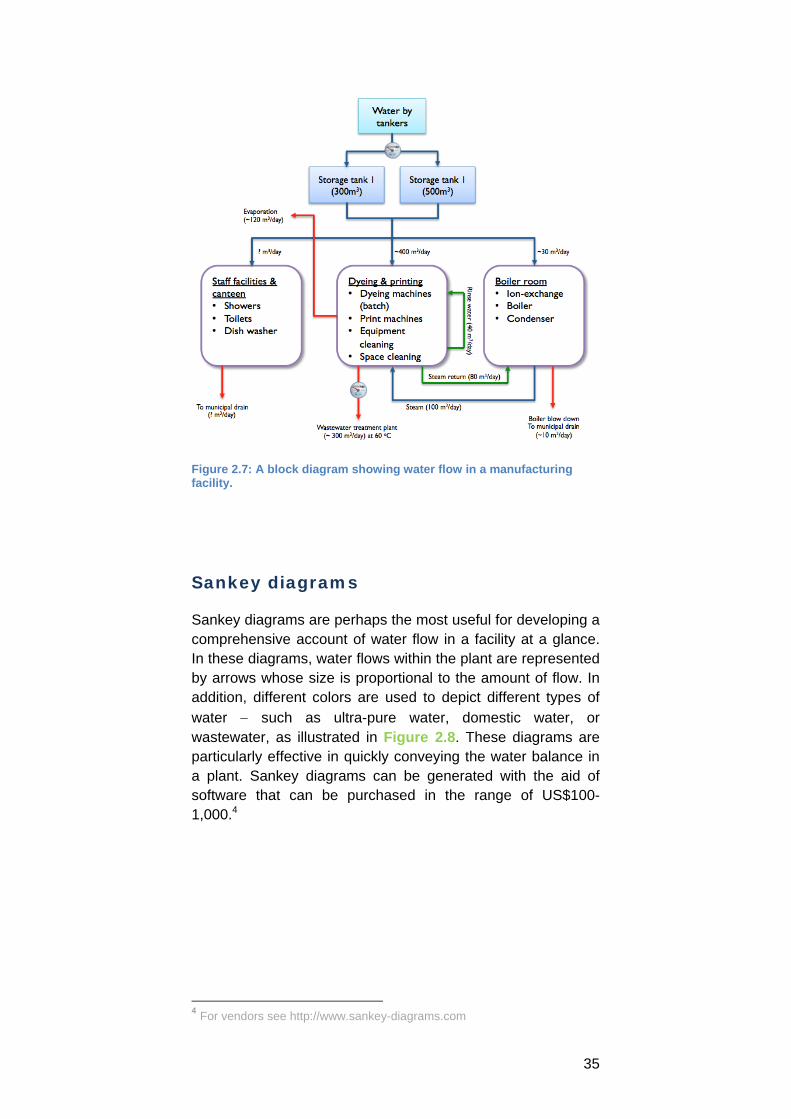
Block diagrams
Block diagrams resemble “plant water use maps” and show where and how much water is consumed and lost, and what effluents are generated. A sample block diagram can be seen in Figure 2.7.
35
Figure 2.7: A block diagram showing water flow in a manufacturing facility.
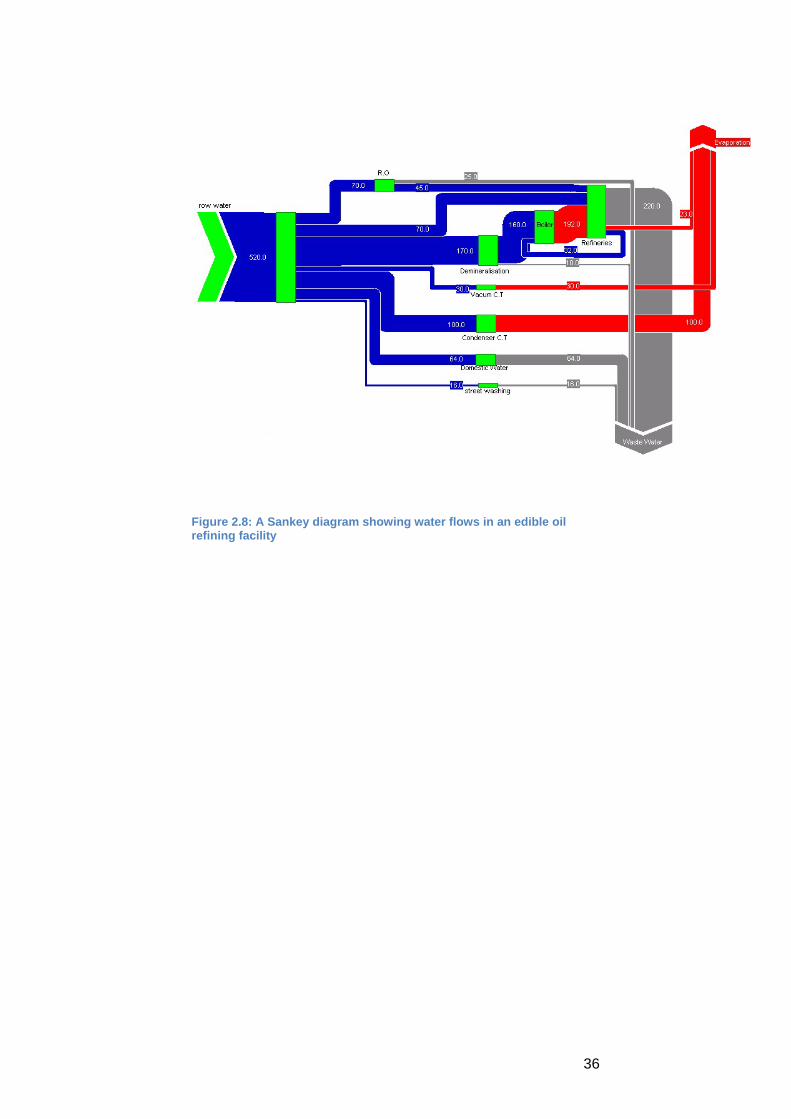
Sankey diagrams
Sankey diagrams are perhaps the most useful for developing a comprehensive account of water flow in a facility at a glance. In these diagrams, water flows within the plant are represented by arrows whose size is proportional to the amount of flow. In addition, different colors are used to depict different types of water − such as ultra-pure water, domestic water, or wastewater, as illustrated in Figure 2.8. These diagrams are particularly effective in quickly conveying the water balance in a plant. Sankey diagrams can be generated with the aid of software that can be purchased in the range of US$100-1,000.4
4 For vendors see http://www.sankey-diagrams.com
36
Figure 2.8: A Sankey diagram showing water flows in an edible oil refining facility
37
SUPPORT SHEET E
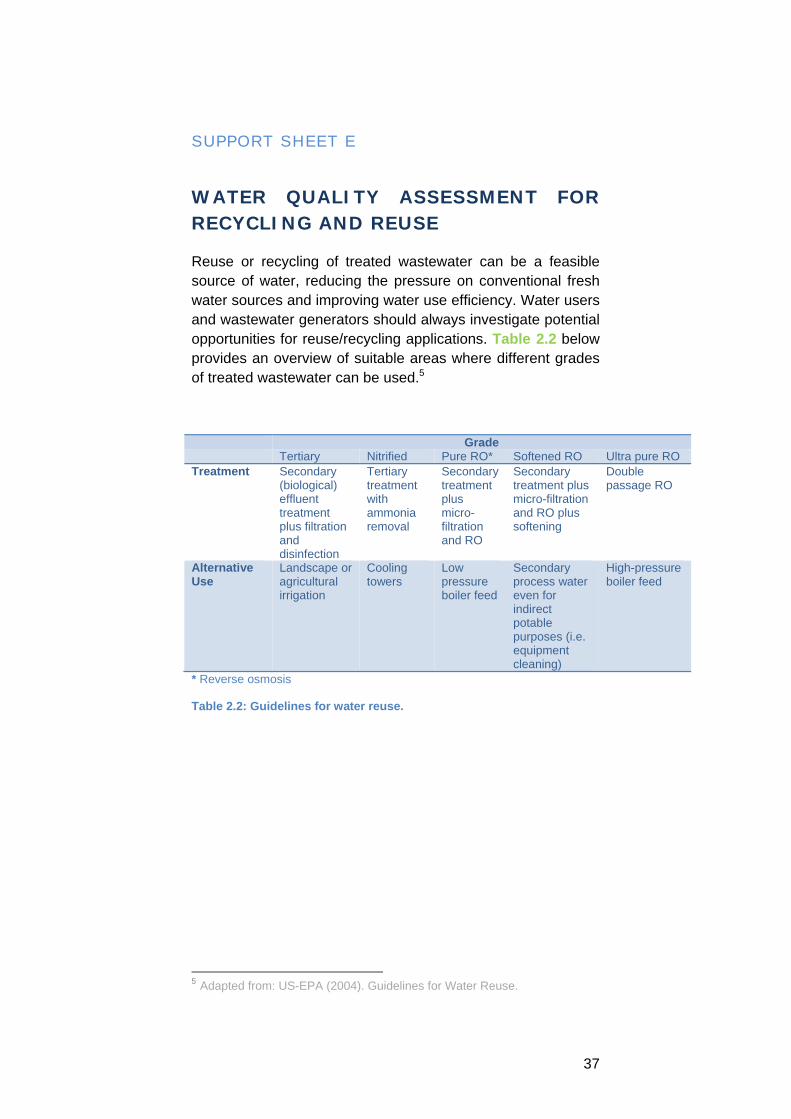
WATER QUALITY ASSESSMENT FOR RECYCLING AND REUSE
Reuse or recycling of treated wastewater can be a feasible source of water, reducing the pressure on conventional fresh water sources and improving water use efficiency. Water users and wastewater generators should always investigate potential opportunities for reuse/recycling applications. Table 2.2 below provides an overview of suitable areas where different grades of treated wastewater can be used.5
Grade Tertiary Nitrified Pure RO* Softened RO Ultra pure RO Treatment Secondary
(biological) effluent treatment plus filtration and disinfection
Tertiary treatment with ammonia removal
Secondary treatment plus micro- filtration and RO
Secondary treatment plus micro-filtration and RO plus softening
Double passage RO
Alternative Use
Landscape or agricultural irrigation
Cooling towers
Low pressure boiler feed
Secondary process water even for indirect potable purposes (i.e. equipment cleaning)
High-pressure boiler feed
* Reverse osmosis
Table 2.2: Guidelines for water reuse.
5 Adapted from: US-EPA (2004). Guidelines for Water Reuse.