Embed Size (px)
Citation preview
2010 South Florida Environmental Report Chapter 2
DRAFT 2-1 8/6/09
Chapter 2: Hydrology of the South Florida Environment
1
2
3 4
Wossenu Abtew, Chandra Pathak, R. Scott Huebner and Violeta Ciuca
SUMMARY 5
6 7 8 9
10 11 12
13 14 15 16 17 18 19
20 21 22 23 24 25 26 27 28 29 30 31 32 33 34 35 36 37 38
39 40 41
Given hydrology’s significance to the entire South Florida ecosystem, this chapter updates hydrologic data and analysis for Water Year 2009 (WY2009) (May 1, 2008–April 30, 2009). WY2008 hydrology is available in Chapter 2 of the 2009 South Florida Environmental Report (SFER) – Volume I (Abtew et al., 2009). This report includes a brief overview of the South Florida regional water management system, impact of Tropical Storm Fay on South Florida, and the specific hydrology of WY2009. Information on droughts in South Florida is presented in the 2009 SFER – Volume I, Chapter 2.
In multi-objective water management systems, challenges are created by hydrologic variation. Too much or too little water creates flooding, water shortage, and/or ecological impacts. Although South Florida is a wet region, serious droughts like the recent one do happen, and there is potential for periodic water shortages. Tropical systems have significant contribution to the hydrology of South Florida. Historically, drought streaks have been broken by deluges from tropical systems (tropical depressions, tropical storms, and hurricanes). Impacts from hydrologic variation can be mitigated with storage and conveyance capacity increases.
The hydrology of South Florida for WY2009 reflects a meteorological and a hydrologic severe drought with a temporary wet condition in the summer. Meteorologically, the water year’s rainfall was far below average in all of the South Florida Water Management District’s (SFWMD or District) rainfall areas with the exception of the Lower Kissimmee which received average rainfall. WY2009 rainfall was 45.24 inches, which is 86 percent of the average. There was a distinct difference between dry season (November through May) and wet season (June through October) rainfall. Generally, the wet season was wetter than normal in all rain areas except Palm Beach, Broward, and Everglades National Park (ENP or Park). Tropical Storm Fay’s passage in August 2008 had a significant contribution in making the wet season wetter while the months of September and October during the wet season were drier than average. The dry season was extremely dry with drought return periods of 100-year or more in most rain areas. Palm Beach County had the largest rainfall deficit (14.24 inches) followed by the ENP (12.62 inches). Rainfall deficits also occurred in the Broward rain area (11.26 inches), West Everglades Agricultural Area (EAA) (10.51 inches), Upper Kissimmee (10.03 inches), Miami-Dade (9.57 inches), East EAA (9.07 inches), Martin/St. Lucie (9.06 inches), Lake Okeechobee (8.13 inches), Water Conservation Area 3 (7.08 inches), East Caloosahatchee (4.68 inches), Big Cypress Basin (4.67 inches), Water Conservation Areas 1 and 2 (4.56 inches), and the Southwest Coast (3.22 inches). The spatial average District WY2009 rainfall deficit was 7.51 inches compared to a WY2008 rainfall deficit of 3.8 inches and a WY2007 deficit of 12 inches.
At the beginning of WY2009, the main storage of the system, Lake Okeechobee, continued to show record low water and storage levels. Gravity discharge from the lake was restricted due to persistent low water levels (stage). Since the watersheds of the lake were in continual drought,
Chapter 2 Volume I: The South Florida Environment
8/6/09 2-2 DRAFT
there was not enough surface water inflow to bring the lake level up. Fourteen temporary pumps were re-installed as in the previous water year (and in the 2000–2001 drought) to discharge water from the lake into the major canals to the south. In WY2009, 109,869 acre-feet (ac-ft) of water was pumped out of the lake in May and first part of June 2008. Forward pumping was terminated as wet season rainfall made it unnecessary. When the lake water level rises, the temporary pumps have to be removed to allow operation of the gravity structures (spillways). Wet season rainfall continued through August, with a major increase in rainfall resulting from Tropical Storm Fay. Details on the storm are presented in the Impact of Tropical Cyclones on South Florida section of this chapter. Rainfall from Tropical Storm Fay was as high as 15.47 inches at a rainfall site. Runoff from Tropical Storm Fay and other rains in August and early September raised Lake Okeechobee’s water level by 4 feet, ending drought conditions temporarily. Rainfall patterns changed to below-average conditions in September 2008 and the pattern continued through the rest of the water year. As a result, drought conditions returned to the region and drought management was re-initiated. At the beginning of WY2009, the Lake Okeechobee water level was 10.25 feet National Geodetic Vertical Datum (ft NGVD), rising to a maximum of 15.16 ft NGVD in September 2009, but falling back to 11.14 ft NGVD at the end of the water year.
42 43 44 45 46 47 48 49 50 51 52 53 54 55 56 57
58 59 60 61 62 63 64 65 66
67
68
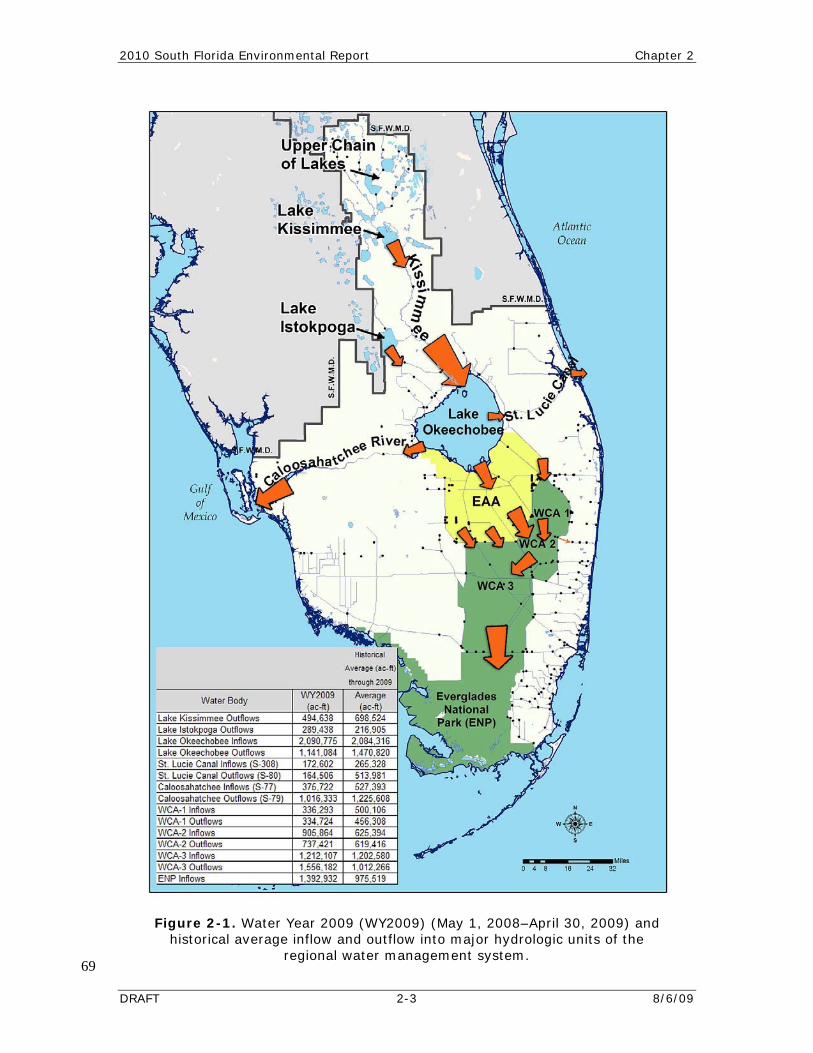
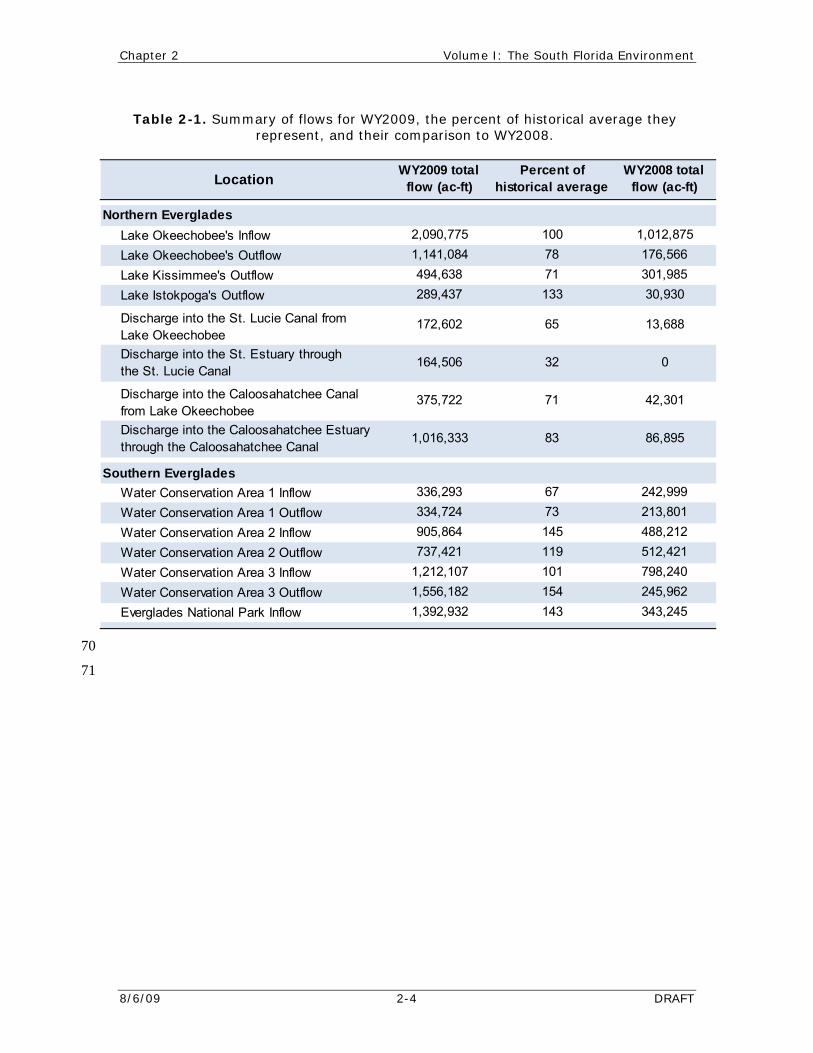
In summary, WY2009’s hydrology was unique. Rainfall for most months of the dry season and the water year was below average and drought conditions persisted throughout the District. But the three wet season months (June, July, and August) were wetter than normal and sufficient runoff was generated resulting in average inflows into major water bodies or hydrologic units. Runoff from the wet season rains, including Tropical Storm Fay, replenished subsurface storage, Lake Okeechobee, and the Water Conservation Areas’ storage and relieved water demand during the dry periods. Figure 2-1 presents WY2009 surface water flows for major hydrologic components in the regional system with historical average flows shown for comparison; Table 2-1 shows the increase in flows relative to the last water year..
2010 South Florida Environmental Report Chapter 2
DRAFT 2-3 8/6/09
69
Figure 2-1. Water Year 2009 (WY2009) (May 1, 2008–April 30, 2009) and historical average inflow and outflow into major hydrologic units of the
regional water management system.
Chapter 2 Volume I: The South Florida Environment
8/6/09 2-4 DRAFT
70
71
Northern EvergladesLake Okeechobee's Inflow 2,090,775 100 1,012,875Lake Okeechobee's Outflow 1,141,084 78 176,566Lake Kissimmee's Outflow 494,638 71 301,985Lake Istokpoga's Outflow 289,437 133 30,930
Southern EvergladesWater Conservation Area 1 Inflow 336,293 67 242,999Water Conservation Area 1 Outflow 334,724 73 213,801Water Conservation Area 2 Inflow 905,864 145 488,212Water Conservation Area 2 Outflow 737,421 119 512,421Water Conservation Area 3 Inflow 1,212,107 101 798,240Water Conservation Area 3 Outflow 1,556,182 154 245,962Everglades National Park Inflow 1,392,932 143 343,245
Location
172,602 65Discharge into the St. Lucie Canal from Lake Okeechobee
Discharge into the Caloosahatchee Canal from Lake OkeechobeeDischarge into the Caloosahatchee Estuary through the Caloosahatchee Canal
Discharge into the St. Estuary through the St. Lucie Canal
WY2008 total flow (ac-ft)
13,688
0
42,301
86,895
164,506 32
375,722 71
1,016,333 83
WY2009 total flow (ac-ft)
Percent of historical average
Table 2-1. Summary of flows for WY2009, the percent of historical average they represent, and their comparison to WY2008.
2010 South Florida Environmental Report Chapter 2
DRAFT 2-5 8/6/09
INTRODUCTION 72
73 74
75 76 77 78 79 80 81 82 83 84
85 86 87 88 89 90 91
92 93 94 95 96
97 98 99
100 101 102 103 104 105
106 107 108 109 110
111
THE SOUTH FLORIDA WATER MANAGEMENT SYSTEM: A REGIONAL OVERVIEW
The ecological and physical characteristics of South Florida have been shaped by years of hydrologic variation. South Florida’s hydrology is driven by the continuous balance of rainfall and evapotranspiration (ETp) reflected in surface water runoff, surface and subsurface storage, flows through the low-relief features, floods, dryouts, and wildfires. Generally, the region is wet with an average annual rainfall of 53 inches. The general hydraulic gradient is north-to-south, where excess surface water flows from the Upper Kissimmee Basin in the north to the Everglades in the south, but there are also water supply and coastal discharges to the east and to the west. The current hydraulic and hydrologic system is composed of lakes, impoundments, wetlands, canals, and water control structures that are managed under various water management schedules and operational decisions.
Because there is significant overlap between this overview of the hydrology of the South Florida environment and many other water management and Everglades restoration efforts, detailed updates for the major hydrologic components of the South Florida Water Management District’s (SFWMD or District) system appear in other chapters of this volume. For example, Table 1-1 describes the major features of the South Florida environment in terms of surface area and general role in South Florida’s hydrology; a detailed analysis of the Kissimmee Basin, including current basin conditions, is available in Chapter 11 of this volume.
The development of South Florida requires a complex water management system to manage flooding, occasional drought, and hurricane impacts. Excess water is stored in lakes, detention ponds, wetlands, impoundments, and aquifers, or is discharged to the coast through estuaries. Hydrologic extremes are exemplified by flooding and excess water during wet years and wildfires and water shortage during drought years.
Lake Okeechobee is a major component of this South Florida hydrologic system. Its storage capacity over 3.75 million acre-feet (ac-ft) at average lake levels (14.5 ft) is the largest of any hydrologic feature in South Florida. The lake is critical for flood control during wet seasons and water supply during dry seasons. The outflows from Lake Okeechobee are received by the St. Lucie River, Caloosahatchee River, Everglades Agricultural Area (EAA), and Water Conservation Areas (WCAs). The details of these subregional flows are provided in the Water Levels and Flows section of this chapter. While Lake Okeechobee and its related watersheds are outlined in this chapter, a more detailed discussion of the lake is presented in Chapter 10 of this volume.
The SFWMD area extends from Orlando to the north through to the Florida Keys in the south (Figure 2-1). It covers an area of 18,000 square miles (sq mi) and extends across 16 counties. The District manages the region’s water resources for flood control, water supply, water quality, and natural systems needs under water management schedules based on these criteria. The Northern and Southern Everglades environmental restoration areas are shown in Figure 2-1.
Chapter 2 Volume I: The South Florida Environment
8/6/09 2-6 DRAFT
The major hydrologic components of the SFWMD are the Upper Kissimmee Chain of Lakes, Lake Istokpoga, Lake Okeechobee, the EAA, the Caloosahatchee and St. Lucie basins, the Lower East Coast, and the Water Conservation Areas, the Lower West Coast and the Everglades National Park (ENP or Park). The Upper Kissimmee Chain of Lakes (Lake Myrtle, Alligator Lake, Lake Mary Jane, Lake Gentry, Lake East Tohopekaliga, Lake Tohopekaliga, and Lake Kissimmee) are a principal source of inflow to Lake Okeechobee. Various groundwater aquifers are part of the water resources with most of their water levels responding relatively quickly to changes in surface water conditions.
112 113 114 115 116 117 118 119
120 121 122 123 124 125
126
127 128 129 130 131 132
133 134 135 136 137 138 139
140 141 142 143 144 145 146 147 148
149
150 151 152 153 154
South Florida experiences hydrologic variation that ranges from extreme drought to flood. The hydrology of the area is driven by rainfall, rainfall-generated runoff, groundwater recharge and discharge, and ETp. Surface water runoff is the source for direct and indirect recharge of groundwater, lake and impoundment storage, and replenishments of wetlands. Excess surface water is discharged to the peninsula’s coasts. Most of the municipal water supply is from groundwater that is sensitive to surface recharge through direct rainfall, runoff, or canal recharge.
Water Management
Water management is accomplished by the operation of hundreds of water control structures across the District. It is complicated by many factors including surface-water-groundwater interaction, rainfall–runoff relationships, topography, errors in measurements, and/or estimates of hydrologic components such as flow, rainfall, ETp, storage and seepage, multiple competing objectives, and the uncertainty of forecasting meteorological events. In addition, there are significant spatial and temporal variations in the hydrologic components across the District.
Water management is performed to meet various purposes by using established regulation schedules that integrate different water needs and are designed to manage available regional storage. The regulation schedules are designed to balance the multiple and sometimes competing purposes of the system. In addition, appropriate and relevant constraints, such as salinity intrusion and water quality, are also incorporated in the regulation schedule. These schedules account for physical capacities of the upstream and downstream levees, canals, and water control structures and are revised when necessary to better balance system objectives.
A team of water managers, scientists, and engineers from the District, the U.S. Army Corps of Engineers (USACE), and other federal and state agencies meet weekly to discuss the state of the system and possible operational scenarios with a focus on environmental impacts of operational decisions. Information considered during these meetings includes recent weather conditions, short-term and long-term forecasts, and the current ecological and hydrological status of different areas of the system, such as the Kissimmee Basin, Lake Okeechobee, the estuaries, and the Everglades. Weekly operational recommendations are prepared by the team and submitted to District managers, then provided to the USACE and used to guide decisions on regulatory discharges from major impoundments including Lake Okeechobee (SFWMD, 2000).
Function of Water Management
Flood control and water supply are the two major purposes of water management at the District. During the wet season, the primary mode of water management is flood control. During the dry season, the water management system is operated primarily to satisfy various water supply demands that include environmental deliveries, urban water needs, agricultural irrigation needs, prevention of saltwater intrusion into groundwater, and others.
2010 South Florida Environmental Report Chapter 2
DRAFT 2-7 8/6/09
Use of Regulation Schedules for Water Management 155
156 157 158 159 160 161 162 163 164 165 166 167 168
169
170 171 172 173 174
175
176 177 178 179
180
The amount of storage volume available for water management varies significantly year to year due to large variations in rainfall. This variation causes large gaps between available water volume generated from rainfall runoff and water demands. For any given year, up to 30 to 40 percent of the standard project flood is met for flood control while most of the water supply needs of the District are met. In order to broadly satisfy flood control and water supply needs long term, monthly water level regulation schedules for each of the water bodies were developed by the District and the USACE in cooperation with other agencies and stakeholders. These regulation schedules are designed to balance the multiple and sometimes competing needs of the system and account for physical capacities of the upstream and downstream levees, canals, and water control structures. In addition, appropriate and relevant constraints, such as salinity intrusion, water quality and others, are also incorporated into each regulation schedule. These regulation schedules are revised when necessary to better balance system objectives. Regulation schedules for lakes and impoundments were presented in Abtew et al. (2007).
Elements of Water Management
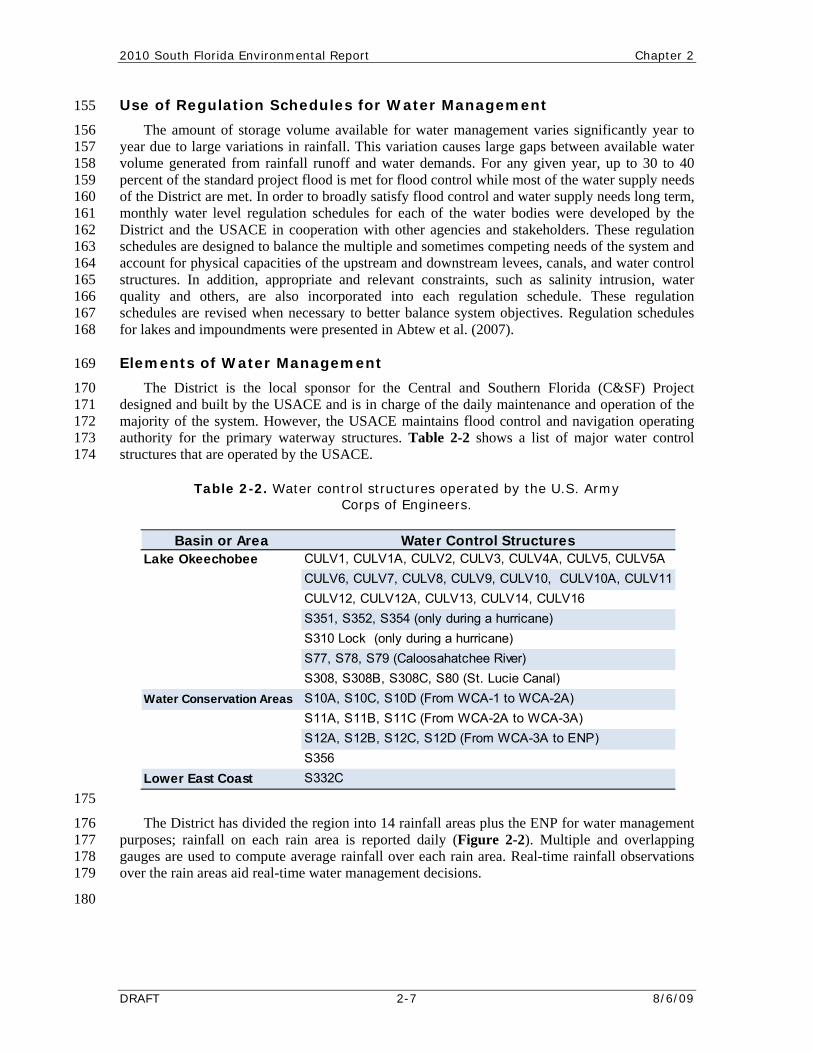
The District is the local sponsor for the Central and Southern Florida (C&SF) Project designed and built by the USACE and is in charge of the daily maintenance and operation of the majority of the system. However, the USACE maintains flood control and navigation operating authority for the primary waterway structures. Table 2-2 shows a list of major water control structures that are operated by the USACE.
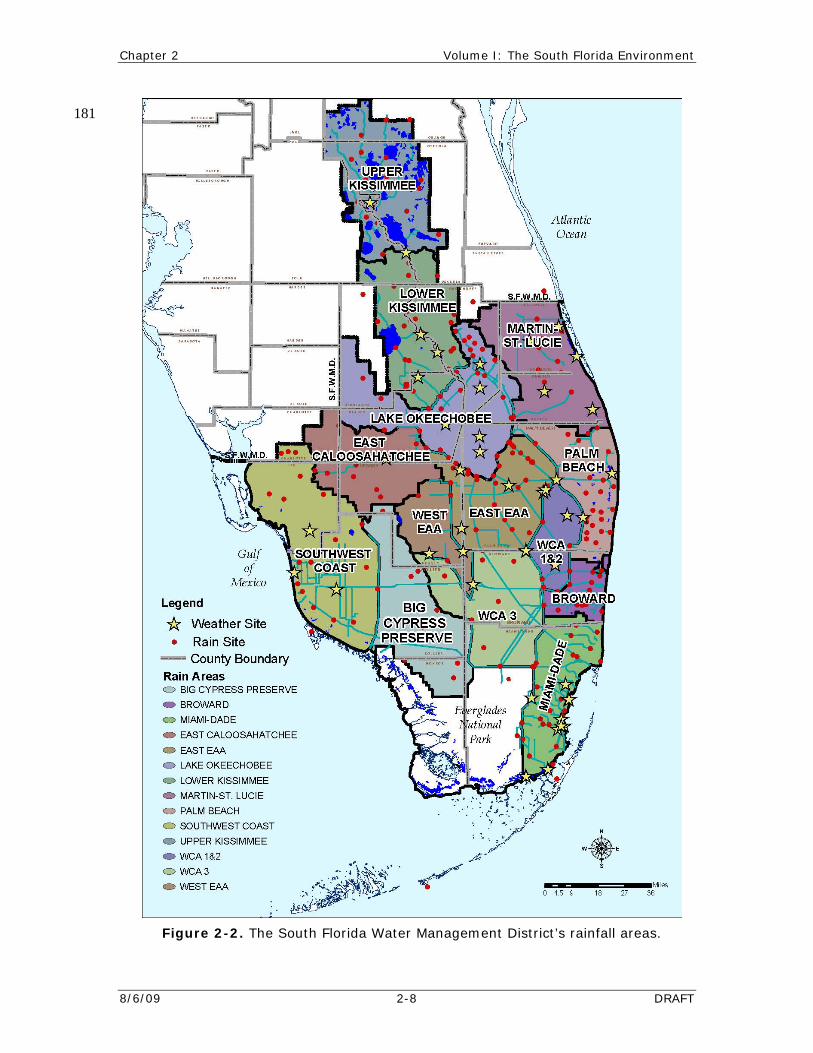
The District has divided the region into 14 rainfall areas plus the ENP for water management purposes; rainfall on each rain area is reported daily (Figure 2-2). Multiple and overlapping gauges are used to compute average rainfall over each rain area. Real-time rainfall observations over the rain areas aid real-time water management decisions.
Basin or Area Water Control StructuresLake Okeechobee CULV1, CULV1A, CULV2, CULV3, CULV4A, CULV5, CULV5A
CULV6, CULV7, CULV8, CULV9, CULV10, CULV10A, CULV11CULV12, CULV12A, CULV13, CULV14, CULV16S351, S352, S354 (only during a hurricane)S310 Lock (only during a hurricane)S77, S78, S79 (Caloosahatchee River)S308, S308B, S308C, S80 (St. Lucie Canal)
Water Conservation Areas S10A, S10C, S10D (From WCA-1 to WCA-2A)S11A, S11B, S11C (From WCA-2A to WCA-3A)S12A, S12B, S12C, S12D (From WCA-3A to ENP)S356
Lower East Coast S332C
Table 2-2. Water control structures operated by the U.S. Army Corps of Engineers.
Chapter 2 Volume I: The South Florida Environment
8/6/09 2-8 DRAFT
181
Figure 2-2. The South Florida Water Management District’s rainfall areas.
2010 South Florida Environmental Report Chapter 2
DRAFT 2-9 8/6/09
Operation of Water Control Structures 182
183 184 185 186 187 188
189 190 191 192 193 194
195 196 197 198 199 200
201
202 203 204 205 206 207
208 209 210 211
212
213 214 215 216 217 218 219 220 221 222 223 224
The operation of structures is performed on a daily basis by using the current conditions and following a set of previously established operating rules as guidelines. The operational rules of structures are available in water control manuals. Water managers pay close attention to infrastructure and public safety as a result of operations, especially during localized storm events. This requires knowing and understanding the physical capacity and capability of regional water control structures, levees, and canals.
Operations of the water control structures include adjustment of gate openings for gated spillways and gated culverts and the starting and stopping of pumps. Gated structure operations are classified into three groups. The first consists of Derived Data Set Point sites, which are computer controlled and operated from the Operations Control Center (OCC). The second consists of automatic sites, which are operated by computers or mechanical devices and are not controlled from the OCC. The third group consists of manually operated gated structures.
Agency staff is dispatched by the OCC operator from the appropriate field station to open or close the manually operated gated structures. Pumps are controlled by the operators housed at the respective pump stations, while some of the unmanned pump stations are operated by the dispatched field station. Although these stations are typically operated during regular work hours, some must be operated after hours during extreme weather events and during most of the wet season.
Tools Used for Operations and Water Management
Currently, there are two tools used in OCC operations. The first tool is a computer-based system, SCADA (Supervisory Control and Data Acquisition), also known as Telvent. This system provides real-time data acquired from field sensors. The system graphically displays the real-time data for a group of structures. The data include upstream and downstream stages, gate openings, and pump speed. Structures are grouped by the Field Operations Centers or operational sub-region.
The second tool, Auxiliary Operator Display, displays the real-time data for a specific structure or site on computer monitors. This display provides fairly detailed information about the structure, including upstream and downstream stages, gate openings, pump speed, flow, alarm setting, power availability, etc.
Use of Data and Decision Making for Operations
There are many pieces of data and information that are used in decision making for operations. The most important data for operations are real-time stage and gate opening or pump operation data from the water body in consideration. A water control manual or operating plan provides operations criteria for each water control structure. While it is necessary to follow the operations criteria, water managers are required to make decisions using sound judgment when physical conditions dictate and make temporary deviations from these criteria when necessary. At the District, water management decisions for operations are made in two primary modes – flood control and water supply. In both modes, daily and/or hourly rainfall amounts that vary from one geographic area to another are critical in decision making for operations. In addition, groundwater flow to and from the water bodies plays a significant role in maintaining a specific gate opening or pump operation. Water managers have learned from experience how much influence groundwater flow has on the stage of a lake or a canal and, in turn, on gate or pump operations.
Chapter 2 Volume I: The South Florida Environment
8/6/09 2-10 DRAFT
Management and Operations of Lake Okeechobee Water Levels 225
226 227 228
229 230 231 232 233 234 235
236 237 238 239 240 241 242 243 244 245
246 247 248 249 250
251 252 253 254 255
256
257 258 259 260 261 262 263 264 265 266 267
268 269 270
The regulation of lake water levels is performed by the USACE in consultation with the District. Flood control releases from Lake Okeechobee are made to the west through the Caloosahatchee River, to the east through the St. Lucie Canal, and southward to the Everglades.
Since the early part of the 1900s and until the middle of 2000, the lake was operated using a variety of calendar-based regulation schedules. During the 1990s, the District and USACE conducted a study to develop and implement a more robust regulation schedule. The WSE (Water Supply and Environment) Lake Okeechobee regulation schedule, instituted in July 2000, was complex. The schedule included tributary hydrologic conditions and climate forecasts into operational guidelines for use with the Operational Guideline Decision Tree. The WSE Operational Guidelines Decision Tree was an integral part of the regulation schedule.
A new regulation schedule for Lake Okeechobee operations was implemented as of May 2008, the beginning of Water Year 2009 (WY2009) (May 1,2008–April 30, 2009). The new regulation schedule (LORS2008) has three main bands: (1) high lake management band, (2) operational band, and (3) water shortage management band (see Figures 2-21 and 2-28). The operational band is divided into high, intermediate, low, base flow, and beneficial use categories. In the high lake management band, outlet canals may be maintained above their optimum water management elevations. In the operational band, outlet canals should be maintained within their optimum water management elevations. In the water shortage management band, outlet canals may be maintained below optimum water management elevations. Details are available in the Water Control Plan for Lake Okeechobee and Everglades Agricultural Area (USACE, 2008).
The normal Lake Okeechobee operation level is below 15.5 feet National Geodetic Vertical Datum (ft NGVD). Levee inspections at intervals of 7 to 30 days are initiated when water levels are between 15.5 and 16.49 ft NGVD. When water levels are 16.5 to 17.49 ft NGVD, levee inspections are conducted at intervals from one to seven days depending upon location. The levees are inspected daily when levels are above 17.5 ft NGVD.
Although flood control releases are made under the USACE’s authority, water supply deliveries from Lake Okeechobee for agriculture, domestic use, or environmental needs are made under the District’s water supply authority. Supply-side management provides guidelines for apportioning lake releases among different water users and release points when extreme drought conditions persist and water use restrictions are imposed by the District.
Hydraulics and Operations
The Upper and Lower Kissimmee basins drain into Lake Okeechobee through the Kissimmee River (C-38 canal). Lake Istokpoga and the Lake Istokpoga water management basin drain into Lake Okeechobee through three major canals (C-40, C-41, and C-41A). Lake Okeechobee discharge and local runoff flows into the Gulf of Mexico to the west through the Caloosahatchee River (C-43 canal) and to the St. Lucie Estuary to the east through the St. Lucie River (C-44 canal). Water supply and Lake Okeechobee regulatory releases are made to the south, to the EAA, the Everglades Protection Area (EPA), and the Lower East Coast. Major canals connecting Lake Okeechobee, the EAA, Water Conservation Areas (WCAs), and the Lower East Coast are the Miami Canal, North New River Canal, Hillsboro Canal, and the West Palm Beach (C-51) Canal (see the Overview of Selected Hydrologic Components section of this chapter for more detail on hydraulic structures).
Drainage from the EAA and a portion of the outflows from Lake Okeechobee are discharged to the south mainly through the Stormwater Treatment Areas (STAs), which are constructed wetlands designed to remove phosphorus from that water with an effective area of 43,000+ acres.
2010 South Florida Environmental Report Chapter 2
DRAFT 2-11 8/6/09
The STAs then discharge to the WCAs to the south and these WCAs discharge to the ENP and to the east coast.
271 272
273 274 275 276 277 278 279 280 281
282 283 284 285 286 287 288 289
290 291 292 293 294 295 296
297
298
The regional drainage system consists of three layers: primary, secondary, and tertiary. The primary system is managed by the District and is comprised of vast surface water storage areas such as lakes, impoundments, and wetlands. This layer consists of 1,875 miles of canals and more than 400 water control structures. The secondary system is also made up of canals and water control structures and is operated by local drainage districts. The tertiary system is mainly composed of residential and business area retention ponds, drainage canals, and water control structures and is maintained privately by entities like homeowner associations. In general, the tertiary (residential/business) system drains into the secondary system (drainage district or municipal), which then discharge to the primary system (the SFWMD).
Generally, South Florida has low topographic relief, meaning that the differences in ground surface elevation from site to site are relatively small. From Lake Tohopekaliga in the Upper Kissimmee Basin to Florida Bay in the south, the elevation drop is a gradual 54 ft over 250 miles. Most of the drop occurs in the basin north of Lake Okeechobee (the elevation drop from Lake Tohopekaliga to Lake Okeechobee is 44 ft in about 81 miles). On average, the water level drop from Lake Okeechobee to the Caloosahatchee Estuary (71 miles to the west) and to the St. Lucie Estuary (35 miles to the east) is 14.1 ft. This low-relief feature dominates the water control system in South Florida.
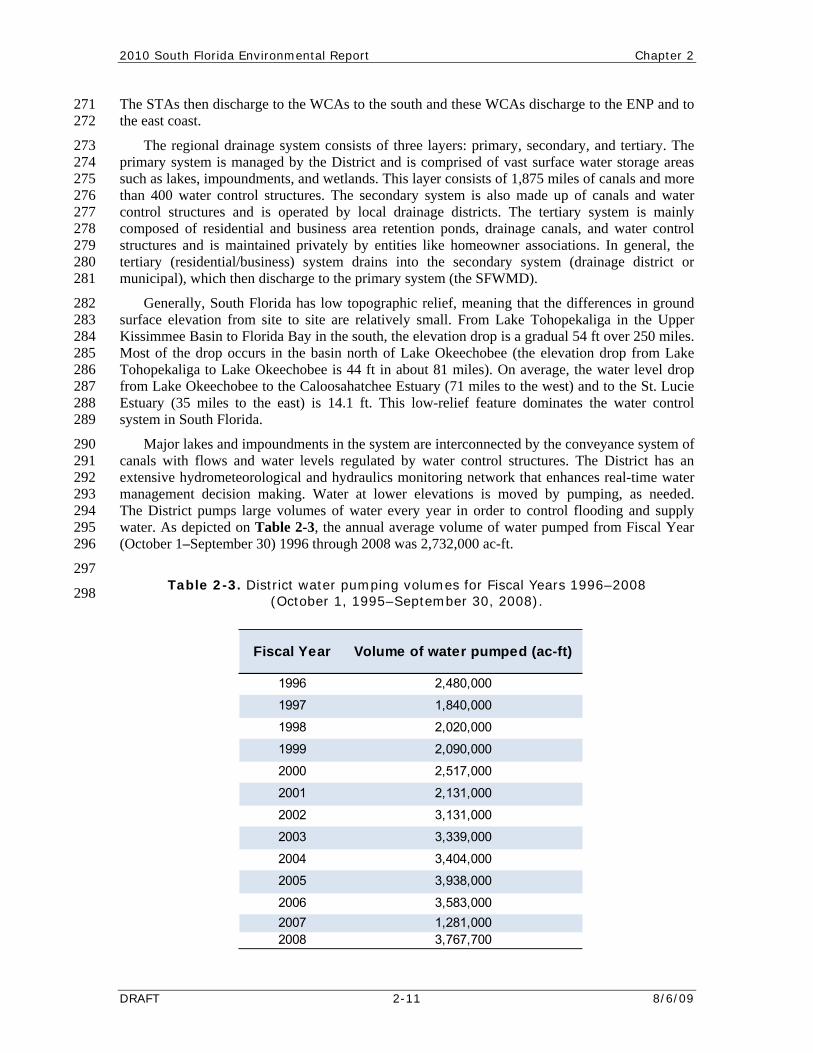
Major lakes and impoundments in the system are interconnected by the conveyance system of canals with flows and water levels regulated by water control structures. The District has an extensive hydrometeorological and hydraulics monitoring network that enhances real-time water management decision making. Water at lower elevations is moved by pumping, as needed. The District pumps large volumes of water every year in order to control flooding and supply water. As depicted on Table 2-3, the annual average volume of water pumped from Fiscal Year (October 1–September 30) 1996 through 2008 was 2,732,000 ac-ft.
1996 2,480,000
1997 1,840,000
1998 2,020,000
1999 2,090,000
2000 2,517,000
2001 2,131,000
2002 3,131,000
2003 3,339,000
2004 3,404,000
2005 3,938,000
2006 3,583,0002007 1,281,0002008 3,767,700
Fiscal Year Volume of water pumped (ac-ft)
Table 2-3. District water pumping volumes for Fiscal Years 1996–2008 (October 1, 1995–September 30, 2008).
Chapter 2 Volume I: The South Florida Environment
8/6/09 2-12 DRAFT
Storage 299
300 301 302 303 304 305 306 307
308 309 310 311
312 313 314 315 316 317 318 319 320 321
322
323
The amount of storage volume available for water management varies significantly year to year due to large variations in rainfall. This variation causes large gaps between available water volume generated from rainfall runoff and water demands. In order to broadly satisfy flood control and water supply needs on a long-term basis, monthly water level regulation schedules for each of the water bodies were developed by the District and the USACE in cooperation with other agencies and stakeholders (see the Water Management section of this chapter). The regulation schedule for each water body is used to manage regional storage capacity and is presented in following sections where WY2009 water levels are discussed.
Occasionally, temporary deviations from the normal regulation schedules are granted. This is to accommodate changing weather, hydrological and ecological conditions, structure malfunctions, and/or emergency conditions for a short interval with a start and end date. The deviations are typically requested by District managers or the USACE’s District engineer.
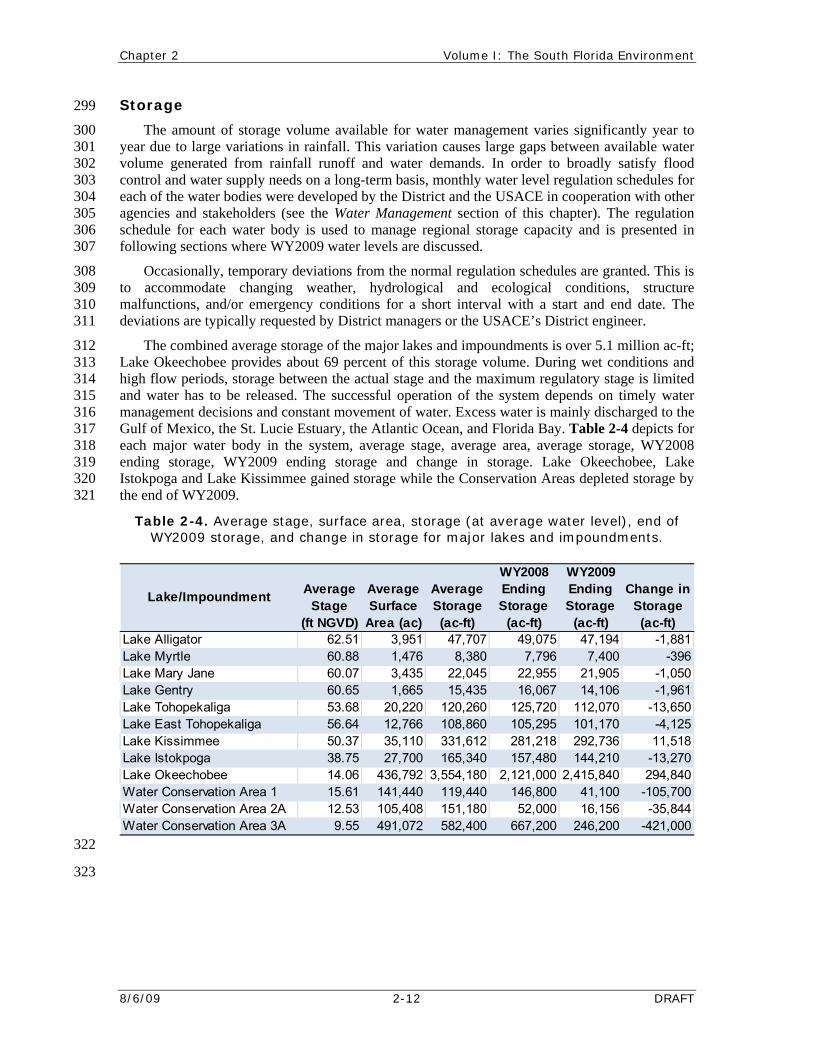
The combined average storage of the major lakes and impoundments is over 5.1 million ac-ft; Lake Okeechobee provides about 69 percent of this storage volume. During wet conditions and high flow periods, storage between the actual stage and the maximum regulatory stage is limited and water has to be released. The successful operation of the system depends on timely water management decisions and constant movement of water. Excess water is mainly discharged to the Gulf of Mexico, the St. Lucie Estuary, the Atlantic Ocean, and Florida Bay. Table 2-4 depicts for each major water body in the system, average stage, average area, average storage, WY2008 ending storage, WY2009 ending storage and change in storage. Lake Okeechobee, Lake Istokpoga and Lake Kissimmee gained storage while the Conservation Areas depleted storage by the end of WY2009.
Table 2-4. Average stage, surface area, storage (at average water level), end of WY2009 storage, and change in storage for major lakes and impoundments.
Lake Alligator 62.51 3,951 47,707 49,075 47,194 -1,881Lake Myrtle 60.88 1,476 8,380 7,796 7,400 -396Lake Mary Jane 60.07 3,435 22,045 22,955 21,905 -1,050Lake Gentry 60.65 1,665 15,435 16,067 14,106 -1,961Lake Tohopekaliga 53.68 20,220 120,260 125,720 112,070 -13,650Lake East Tohopekaliga 56.64 12,766 108,860 105,295 101,170 -4,125Lake Kissimmee 50.37 35,110 331,612 281,218 292,736 11,518Lake Istokpoga 38.75 27,700 165,340 157,480 144,210 -13,270Lake Okeechobee 14.06 436,792 3,554,180 2,121,000 2,415,840 294,840Water Conservation Area 1 15.61 141,440 119,440 146,800 41,100 -105,700Water Conservation Area 2A 12.53 105,408 151,180 52,000 16,156 -35,844Water Conservation Area 3A 9.55 491,072 582,400 667,200 246,200 -421,000
Lake/Impoundment Change in Storage (ac-ft)
Average Stage
(ft NGVD)
Average Surface
Area (ac)
Average Storage (ac-ft)
WY2008 Ending Storage
(ac-ft)
WY2009 Ending Storage
(ac-ft)
2010 South Florida Environmental Report Chapter 2
DRAFT 2-13 8/6/09
SELECTED HYDROLOGIC COMPONENTS 324
325 326 327 328 329
330
331 332 333 334 335 336 337 338 339 340 341
342
343 344 345 346 347
348
349 350 351 352 353 354 355 356 357 358 359
360
361 362 363 364 365 366 367 368
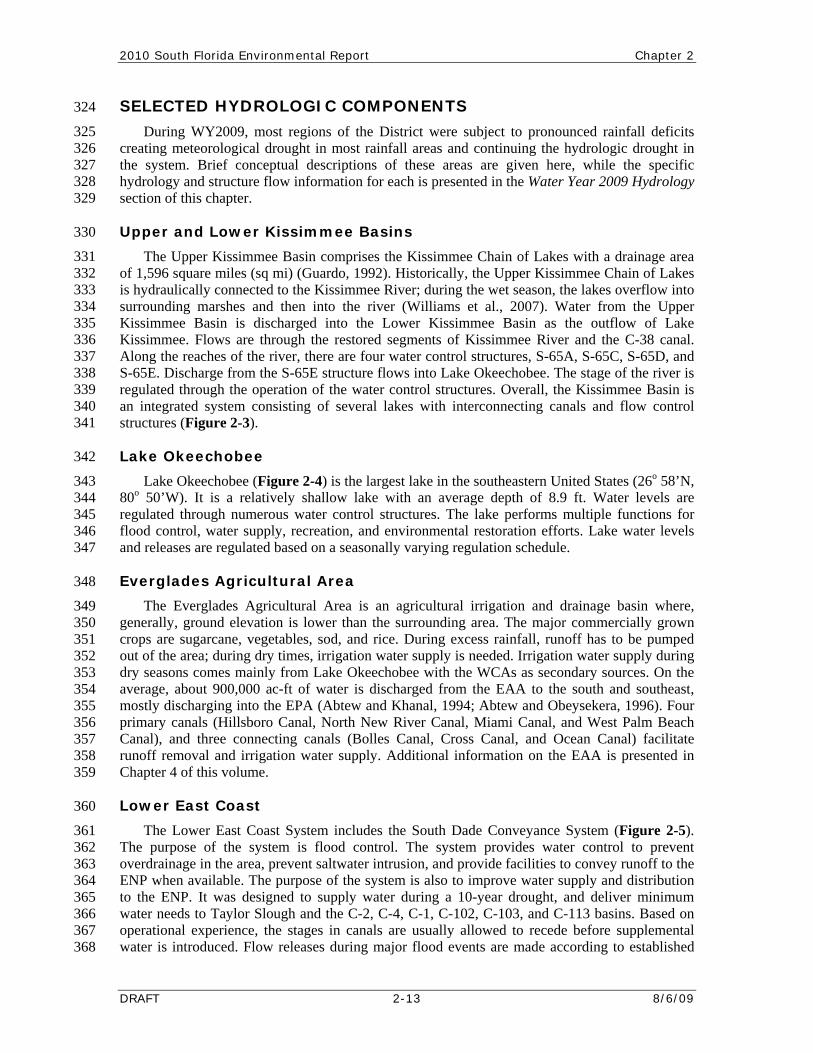
During WY2009, most regions of the District were subject to pronounced rainfall deficits creating meteorological drought in most rainfall areas and continuing the hydrologic drought in the system. Brief conceptual descriptions of these areas are given here, while the specific hydrology and structure flow information for each is presented in the Water Year 2009 Hydrology section of this chapter.
Upper and Lower Kissimmee Basins
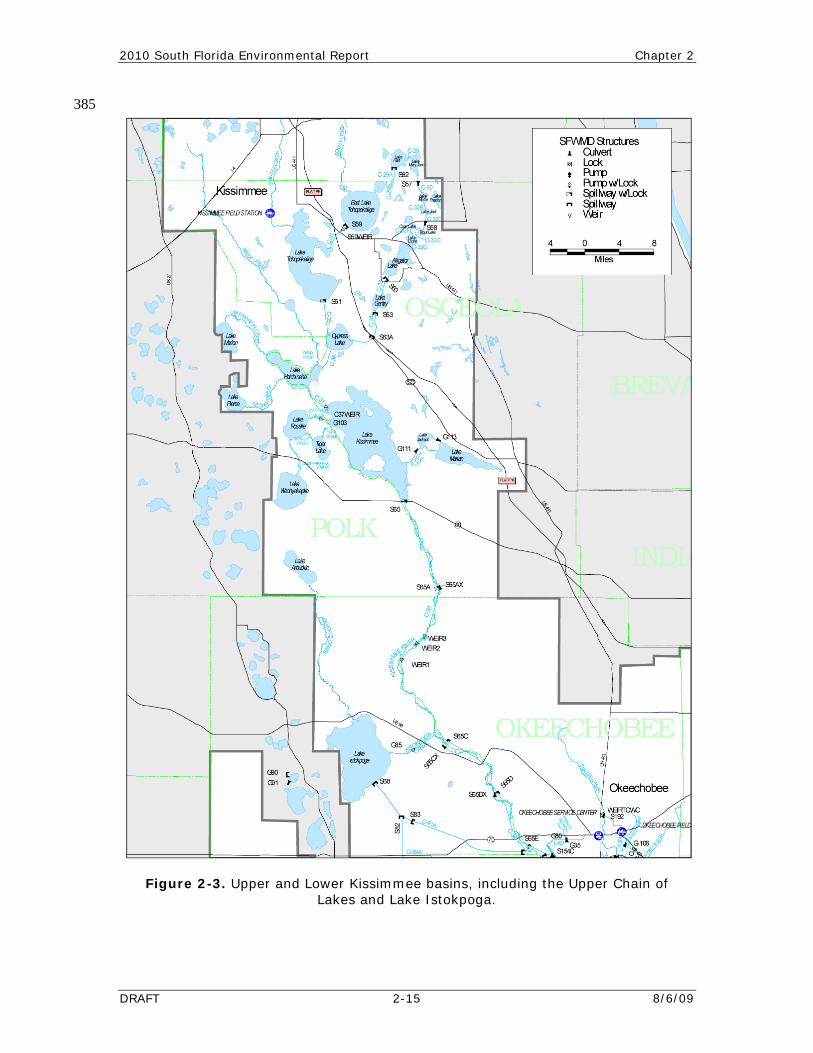
The Upper Kissimmee Basin comprises the Kissimmee Chain of Lakes with a drainage area of 1,596 square miles (sq mi) (Guardo, 1992). Historically, the Upper Kissimmee Chain of Lakes is hydraulically connected to the Kissimmee River; during the wet season, the lakes overflow into surrounding marshes and then into the river (Williams et al., 2007). Water from the Upper Kissimmee Basin is discharged into the Lower Kissimmee Basin as the outflow of Lake Kissimmee. Flows are through the restored segments of Kissimmee River and the C-38 canal. Along the reaches of the river, there are four water control structures, S-65A, S-65C, S-65D, and S-65E. Discharge from the S-65E structure flows into Lake Okeechobee. The stage of the river is regulated through the operation of the water control structures. Overall, the Kissimmee Basin is an integrated system consisting of several lakes with interconnecting canals and flow control structures (Figure 2-3).
Lake Okeechobee
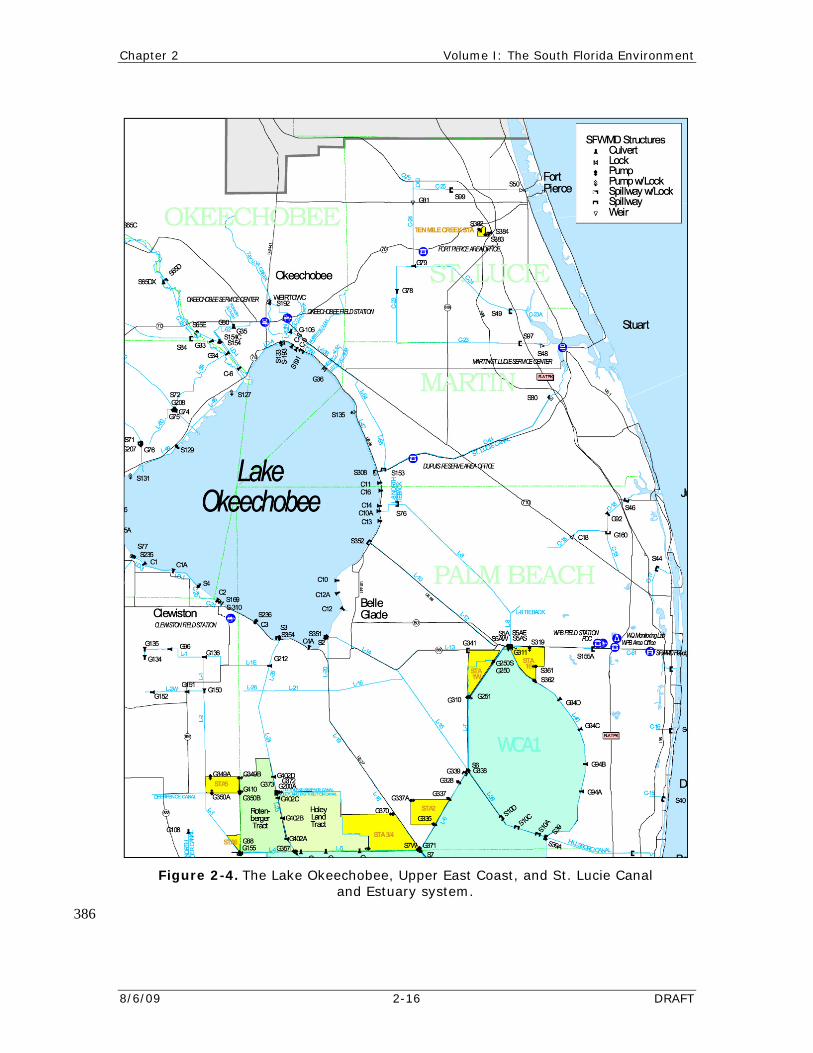
Lake Okeechobee (Figure 2-4) is the largest lake in the southeastern United States (26o 58’N, 80o 50’W). It is a relatively shallow lake with an average depth of 8.9 ft. Water levels are regulated through numerous water control structures. The lake performs multiple functions for flood control, water supply, recreation, and environmental restoration efforts. Lake water levels and releases are regulated based on a seasonally varying regulation schedule.
Everglades Agricultural Area
The Everglades Agricultural Area is an agricultural irrigation and drainage basin where, generally, ground elevation is lower than the surrounding area. The major commercially grown crops are sugarcane, vegetables, sod, and rice. During excess rainfall, runoff has to be pumped out of the area; during dry times, irrigation water supply is needed. Irrigation water supply during dry seasons comes mainly from Lake Okeechobee with the WCAs as secondary sources. On the average, about 900,000 ac-ft of water is discharged from the EAA to the south and southeast, mostly discharging into the EPA (Abtew and Khanal, 1994; Abtew and Obeysekera, 1996). Four primary canals (Hillsboro Canal, North New River Canal, Miami Canal, and West Palm Beach Canal), and three connecting canals (Bolles Canal, Cross Canal, and Ocean Canal) facilitate runoff removal and irrigation water supply. Additional information on the EAA is presented in Chapter 4 of this volume.
Lower East Coast
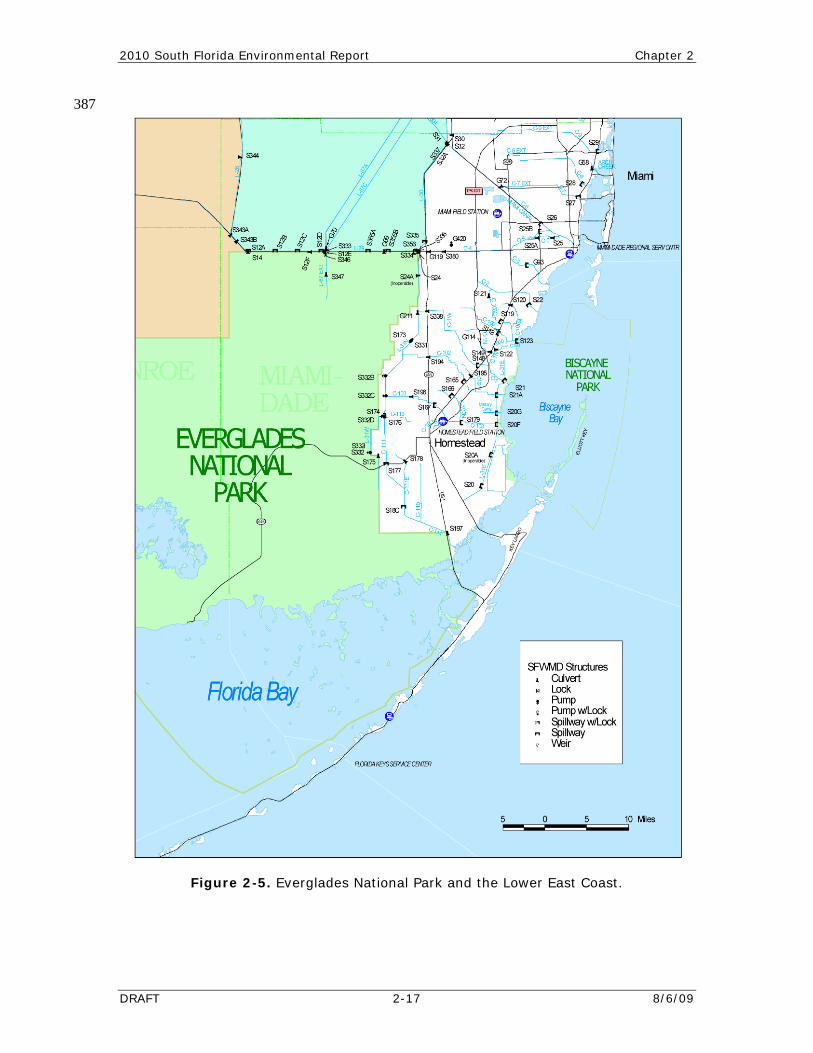
The Lower East Coast System includes the South Dade Conveyance System (Figure 2-5). The purpose of the system is flood control. The system provides water control to prevent overdrainage in the area, prevent saltwater intrusion, and provide facilities to convey runoff to the ENP when available. The purpose of the system is also to improve water supply and distribution to the ENP. It was designed to supply water during a 10-year drought, and deliver minimum water needs to Taylor Slough and the C-2, C-4, C-1, C-102, C-103, and C-113 basins. Based on operational experience, the stages in canals are usually allowed to recede before supplemental water is introduced. Flow releases during major flood events are made according to established
Chapter 2 Volume I: The South Florida Environment
8/6/09 2-14 DRAFT
guidelines (USACE, 1995). Lake Okeechobee is connected to the Lower East Coast through the Miami Canal. During dry periods, flows from the WCAs and Lake Okeechobee are released to raise canal and groundwater levels. During wet periods, the canal network is used to remove runoff to the ocean as quickly as possible.
369 370 371 372
373
374 375 376 377 378 379 380 381 382 383
384
Lower West Coast
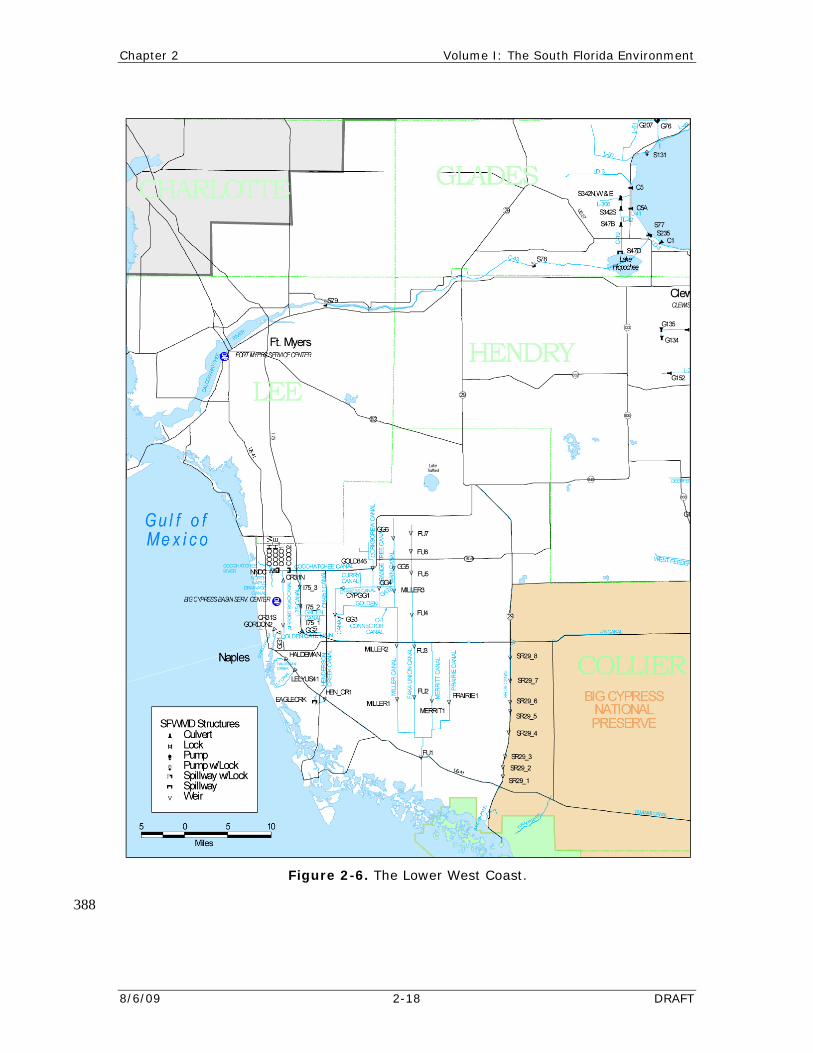
The main canal in the Lower West Coast is the Caloosahatchee River (C-43 canal). It runs from Lake Okeechobee to the Caloosahatchee Estuary. Inflows to the Caloosahatchee River are runoff from the basin watershed and releases from Lake Okeechobee by operation of the S-77 structure according to regulation procedures described in USACE (2008). Downstream of S-77 is a gated spillway, S-78, that also receives inflows from its local watershed to the east. Figure 2-6 shows the Lower West Coast and main hydrologic features. The outflow from the Caloosahatchee River (downstream of S-78) is discharged into the estuary via S-79, a gated spillway and lock operated by the USACE. S-79 is the last structure on the Caloosahatchee River that controls discharges into its estuary. The operations of S-79 include managing stormwater runoff from west Caloosahatchee and tidal (east) Caloosahatchee watersheds.
2010 South Florida Environmental Report Chapter 2
DRAFT 2-15 8/6/09
385
Figure 2-3. Upper and Lower Kissimmee basins, including the Upper Chain of Lakes and Lake Istokpoga.
Chapter 2 Volume I: The South Florida Environment
8/6/09 2-16 DRAFT
386
Figure 2-4. The Lake Okeechobee, Upper East Coast, and St. Lucie Canal and Estuary system.
2010 South Florida Environmental Report Chapter 2
DRAFT 2-17 8/6/09
387
Figure 2-5. Everglades National Park and the Lower East Coast.
Chapter 2 Volume I: The South Florida Environment
8/6/09 2-18 DRAFT
388
Figure 2-6. The Lower West Coast.

2010 South Florida Environmental Report Chapter 2
DRAFT 2-19 8/6/09
IMPACT OF TROPICAL CYCLONES ON SOUTH FLORIDA 389
390
391 392 393 394 395 396 397 398 399 400 401 402 403 404 405 406
407
INTRODUCTION
According to Chaston (1996), tropical cyclones, or hurricanes in the Atlantic and Eastern Pacific Oceans, are nature’s way of transporting heat energy, moisture, and momentum from the tropics to the poles in order to decrease the temperature differential and preserve the current climate of the earth. Historical records indicate that Atlantic hurricanes have been observed since Christopher Columbus’ voyages to the New World in the 1490s (Attaway, 1999). Based on published records, the average annual number of subtropical storms, tropical storms, and hurricanes in the North Atlantic Ocean between 1886 and 1994 was 9.4, of which 4.9 were hurricanes (Tait, 1995). Between 1871 and 1996, 1,000 tropical storms have occurred in the North Atlantic, Caribbean Sea, and Gulf of Mexico (Williams and Duedall, 1997). The distribution of tropical systems, excluding depressions, from 1906 through 2006 is shown in Figure 2-7. Eighty-two percent of tropical storms and hurricanes occurred from the beginning of August through the end of October. There were 114 hurricanes and tropical storms that affected the Florida peninsula between 1871 and 1996, with hurricanes comprising about half of these (Attaway, 1999). Tropical storm classification begins when a warm-core, low pressure system with organized circulation reaches a windspeed of 35 miles per hour (mile h-1) and hurricane classification begins at 75 mile h-1.
MonthsJan Feb Mar Apr May Jun Jul Aug Sep Oct Nov Dec
Num
ber o
f Atla
ntic
Sto
rms/
100
Yea
rs
0
100
200
300
400Tropical Stormsand Hurricanes
Hurricanes
Major Hurricanes
Figure 2-7. Distribution of North Atlantic tropical storms from 1906 through 2006. (Data source http://weather.unisys.com/hurricane/atlantic/index.html accessed on
November 15, 2007.)
Chapter 2 Volume I: The South Florida Environment
8/6/09 2-20 DRAFT
The general area of the SFWMD (Figure 2-2) has been affected by 49 hurricanes, 37 tropical storms, and nine tropical cyclones (hurricanes or tropical storms) from 1871 to 2008. As the spatial area of interest decreases, the frequency of hurricane effect also decreases. Since 1871, the Miami area was affected by hurricanes in 1888, 1891, 1904, 1906, 1909, 1926, 1935, 1941, 1945, 1948, 1950, 1964, 1965, 1966, 1972, 1992 (Williams and Duedall, 1997); and later in 1999, 2004 and 2005. Since 1998, South Florida has been affected directly or indirectly from Hurricanes Georges in 1998, Irene in 1999; Hurricanes Charley, Frances and Jeanne in 2004; and Dennis, Rita, Katrina and Wilma in 2005 (Abtew and Huebner, 2006; Abtew et al., 2006). Historically, South Florida experiences three tropical systems every four years.
408 409 410 411 412 413 414 415 416
417 418 419 420 421 422 423 424 425 426 427 428 429 430 431 432
433
434 435 436 437 438 439 440 441 442 443 444 445
446
447 448 449 450 451 452 453 454 455
It is estimated that tropical systems contribute 15 to 20 percent of South Florida rainfall (Walther and Abtew, 2006). Rainfall from tropical systems has ended severe regional droughts. For example, a tropical storm dropped more than 9.8 inches of rainfall over the Miami area at the end of August during the 1932 drought. Passage of Tropical Storm Dawn in September 1972 brought much needed rainfall to South Florida during the 1971–1972 drought. Similarly, Hurricane Dennis passed through South Florida in 1981 as a tropical storm and contributed over 20 inches of needed rainfall. In July 1985, Hurricane Bob also contributed to South Florida rainfall as a tropical storm. Hurricane Keith made landfall as a tropical storm in the upper portion of South Florida in November 1988 and deposited over 10.6 inches of rainfall. The 2000–2001 drought effect was minimized due to 5.9 inches of rainfall from Hurricane Gabrielle in the Kissimmee area when it landed as a tropical storm. Tropical Storm Fay relieved the 2006–2009 drought water shortage with rainfall as high as 15 inches in some locations. Large spatial coverage of rainfall and high runoff volumes are typical characteristics of rainfall associated with tropical systems. These characteristics result in flooding and high water levels in lakes and reservoirs. High volumes of surface water and intense runoff can damage water management infrastructure.
WATER YEAR 2009 HURRICANE SEASON
No hurricanes impacted South Florida during WY2007 and WY2008. But, the WY2009 hurricane season (June 1–November 30, 2008) ended with 16 named storms – of which eight were hurricanes. Four of these systems, Gustav, Hanna, Ike and Fay, threatened the District area necessitating activation of emergency management. Hurricane Gustav passed through the Gulf of Mexico west of the District from August 31–September 1, 2008, and contributed rainfall to South Florida (Beven and Kimberlain, 2009). Hurricane Hanna passed east of South Florida on September 5 and 6, 2008, contributing rainfall to the coastal areas from Palm Beach to Indian River Counties (Brown and Kimberlain, 2008). Hurricane Ike which devastated Galveston, Texas, contributed rainfall to South Florida as it passed through the Gulf of Mexico from Cuba to Galveston from September 8–13, 2008 (Berg, 2009). Tropical Storm Fay made direct landfall in South Florida, moving across the region longitudinally from the southwest to the northeast and impacting all 16 counties of the District.
TROPICAL STORM FAY
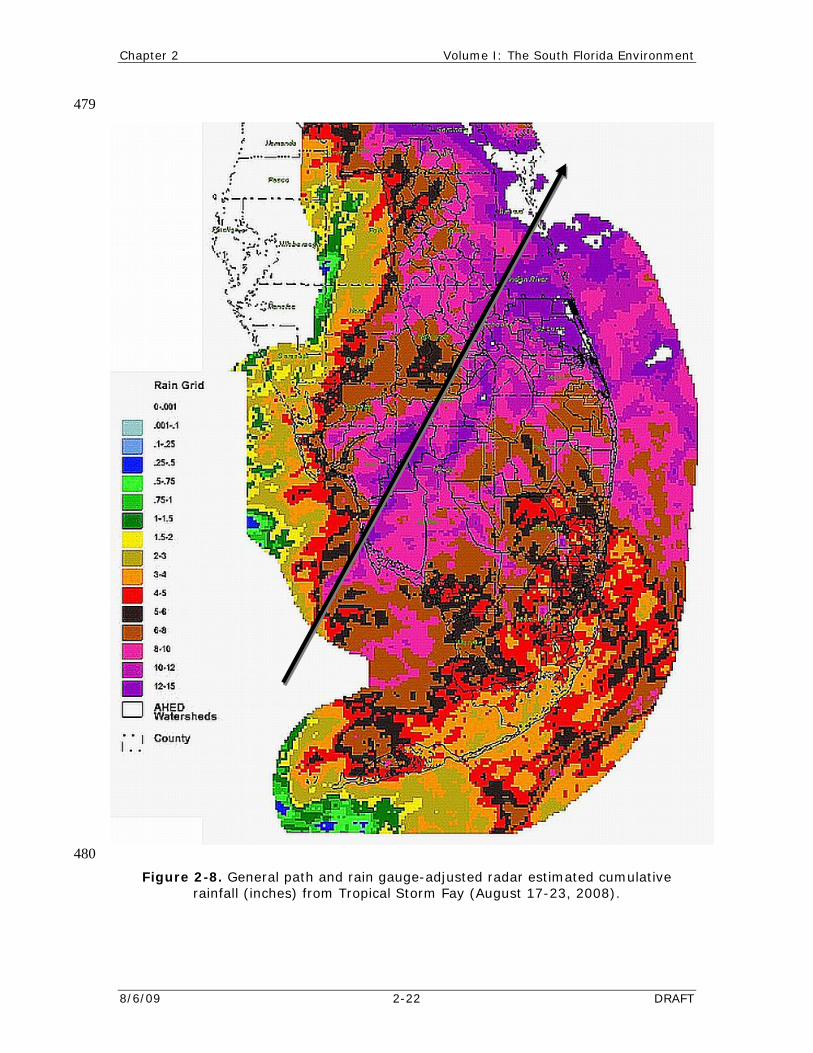
According to the National Hurricane Center (Stewart and Beven, 2009), Fay originated as a tropical wave off the coast of Africa on August 6, 2008. On August 15, 2008, a low pressure area over the Mona Passage became Tropical Storm Fay and moved over eastern Dominican Republic. The next day, the storm passed east of Haiti. On August 17, the storm reached Cuba. By August 18, it had moved northeast of the Florida Keys after a landfall on the Keys. On the morning of August 19, 2008, Tropical Storm Fay landed in southwest Florida, near Cape Romano, moving inland across Lake Okeechobee and moving on to the Atlantic Ocean near Melbourne (Figure 2-8). The mean Doppler surface wind velocity over Lake Okeechobee was estimated at 69 mile h-1 (Stewart and Beven, 2009). The District weather station L005 in Lake Okeechobee
2010 South Florida Environmental Report Chapter 2
DRAFT 2-21 8/6/09
observed a 15-minute mean maximum wind speed of 59 mile h-1 on August 19, 2009, at 12:45 pm. After lingering for three days off the coast of the Kennedy Space Center, it made its third landfall in Florida in Volusia County. The storm moved west and northwest across Florida and crossed into Gulf of Mexico. It made a fourth landfall in the panhandle of Florida. Rainfall from the tropical system affected all of the state, with Central and South Florida getting rainfall caused by the front August 17–23, 2008.
456 457 458 459 460 461
462
463 464 465 466 467 468 469 470 471 472 473 474 475 476 477
478
Rainfall
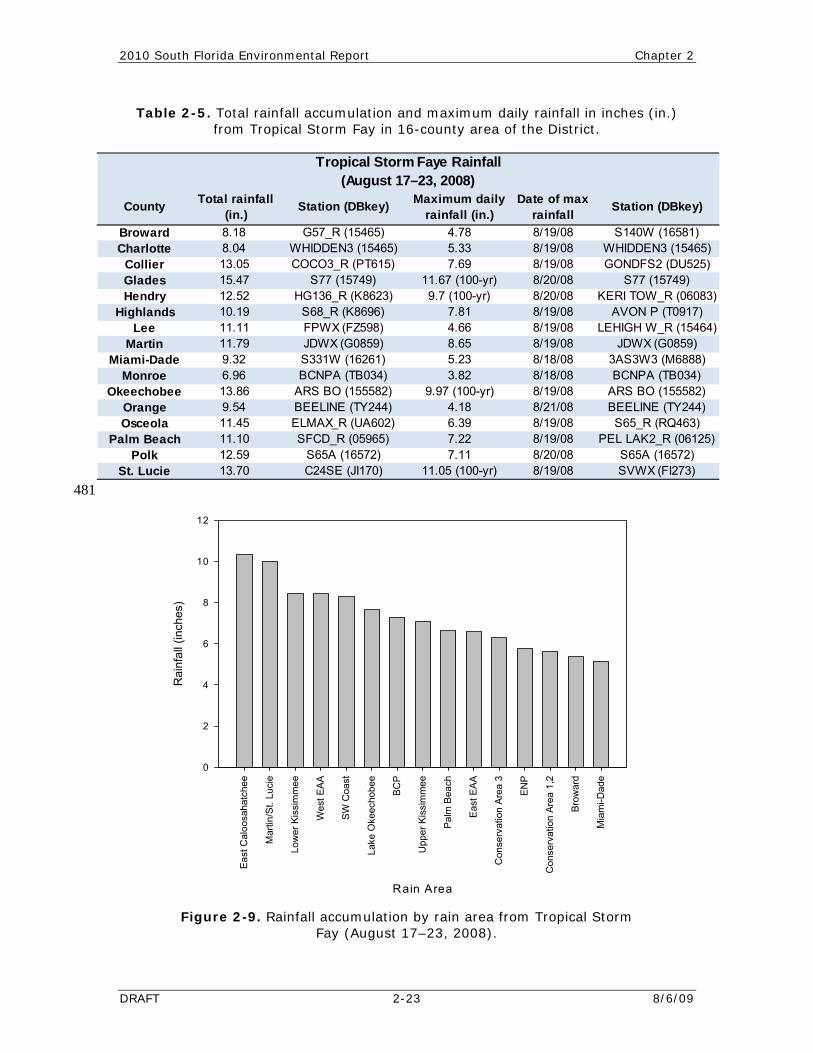
South Florida had been in severe drought since 2006 when Tropical Storm Fay arrived. The high rainfall and its distribution over the whole region resulted in generating surface water runoff to fill storage and relieve the drought. Figure 2-8 depicts the path of the storm and radar rainfall estimates. The storm lingered at the northeast coast of Florida near the Kennedy Space Center for three days, with the highest amount of rainfall on that area [27.65 inches near Melbourne, Florida (Stewart and Beven, 2009)]. The highest rainfall observed at individual rainfall stations in the SFWMD are shown in Table 2-5. In Glades County, at station S-77, 15.47 inches of rainfall was observed with a single-day accumulation of 11.67 inches with an estimated return period of 100-year (Trimble, 1990). Okeechobee and St. Lucie counties’ stations recorded 13.86 and 13.7 inches of rainfall from the tropical storm. A one-day accumulation of 9.97 inches in Okeechobee County and 11.05 inches in St. Lucie County is about 100-year return period event. The highest areal (spatial average) rainfall for the period August 17–23, 2008, was in the East Caloosahatchee and Martin/St. Lucie rainfall areas, 10.35 and 10.02 inches, respectively (Figure 2-9). Spatially averaged rainfall over each of the 14 rain areas and the ENP is shown in order of magnitude in Figure 2-9. The areal averaging process dampens the single-gauge, high-rainfall observation.
Chapter 2 Volume I: The South Florida Environment
8/6/09 2-22 DRAFT
479
480 Figure 2-8. General path and rain gauge-adjusted radar estimated cumulative
rainfall (inches) from Tropical Storm Fay (August 17-23, 2008).
2010 South Florida Environmental Report Chapter 2
DRAFT 2-23 8/6/09
481
Rain Area
East
Cal
oosa
hatc
hee
Mar
tin/S
t. Lu
cie
Low
er K
issi
mm
ee
Wes
t EA
A
SW
Coa
st
Lake
Oke
echo
bee
BC
P
Upp
er K
issi
mm
ee
Pal
m B
each
Eas
t EA
A
Con
serv
atio
n Ar
ea 3
EN
P
Con
serv
atio
n Ar
ea 1
,2
Brow
ard
Mia
mi-D
ade
Rai
nfal
l (in
ches
)
0
2
4
6
8
10
12
Table 2-5. Total rainfall accumulation and maximum daily rainfall in inches (in.) from Tropical Storm Fay in 16-county area of the District.
Figure 2-9. Rainfall accumulation by rain area from Tropical Storm Fay (August 17–23, 2008).
Broward 8.18 G57_R (15465) 4.78 8/19/08 S140W (16581)Charlotte 8.04 WHIDDEN3 (15465) 5.33 8/19/08 WHIDDEN3 (15465)
Collier 13.05 COCO3_R (PT615) 7.69 8/19/08 GONDFS2 (DU525)Glades 15.47 S77 (15749) 11.67 (100-yr) 8/20/08 S77 (15749)Hendry 12.52 HG136_R (K8623) 9.7 (100-yr) 8/20/08 KERI TOW_R (06083)
Highlands 10.19 S68_R (K8696) 7.81 8/19/08 AVON P (T0917)Lee 11.11 FPWX (FZ598) 4.66 8/19/08 LEHIGH W_R (15464)
Martin 11.79 JDWX (G0859) 8.65 8/19/08 JDWX (G0859)Miami-Dade 9.32 S331W (16261) 5.23 8/18/08 3AS3W3 (M6888)
Monroe 6.96 BCNPA (TB034) 3.82 8/18/08 BCNPA (TB034)Okeechobee 13.86 ARS BO (155582) 9.97 (100-yr) 8/19/08 ARS BO (155582)
Orange 9.54 BEELINE (TY244) 4.18 8/21/08 BEELINE (TY244)Osceola 11.45 ELMAX_R (UA602) 6.39 8/19/08 S65_R (RQ463)
Palm Beach 11.10 SFCD_R (05965) 7.22 8/19/08 PEL LAK2_R (06125)Polk 12.59 S65A (16572) 7.11 8/20/08 S65A (16572)
St. Lucie 13.70 C24SE (JI170) 11.05 (100-yr) 8/19/08 SVWX (FI273)
Tropical Storm Faye Rainfall
Total rainfall (in.)County Station (DBkey) Station (DBkey)Date of max
rainfall Maximum daily
rainfall (in.)
(August 17–23, 2008)
Chapter 2 Volume I: The South Florida Environment
8/6/09 2-24 DRAFT
Su482
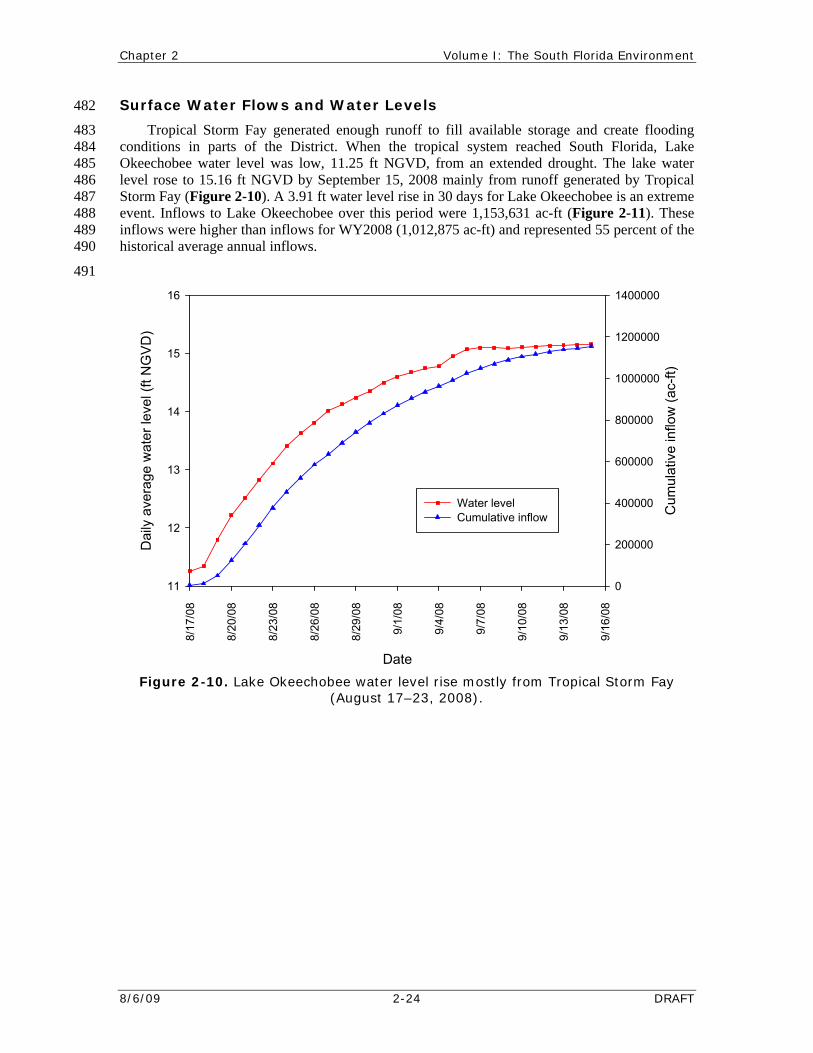
Tropical S reate flooding 483 conditions in parts of the District. When the tropical system reached South Florida, Lake 484 Okeechobee water level was low, 11.25 ft NGVD, from an extended drought. The lake water 485 level rose to 15.16 ft NGVD by September 15, 2008 mainly from runoff generated by Tropical 486 Storm Fay (Figure 2-10). A 3.91 ft water level rise in 30 days for Lake Okeechobee is an extreme 487 event. Inflows to Lake Okeechobee over this period were 1,153,631 ac-ft (Figure 2-11). These 488 inflows were higher than inflows for WY2008 (1,012,875 ac-ft) and represented 55 percent of the 489 historical average annual inflows. 490
491
rface Water Flows and Water Levels
torm Fay generated enough runoff to fill available storage and c
Date
8/17
/08
8/20
/08
8/23
/08
8/26
/08
8/29
/08
9/1/
08
9/4/
08
9/7/
08
9/10
/08
9/13
/08
9/16
/08
Dai
ly a
vw
ater
leve
l (ft
NG
VD
)er
age
11
12
13
14
15
16
Cum
ulat
ive
inflo
w (a
c-ft)
0
200000
400000
600000
800000
1000000
1200000
1400000
Water level Cumulative inflow
Figure 2-10. Lake Okeechobee water level rise mostly from Tropical Storm Fay (August 17–23, 2008).
2010 South Florida Environmental Report Chapter 2
DRAFT 2-25 8/6/09
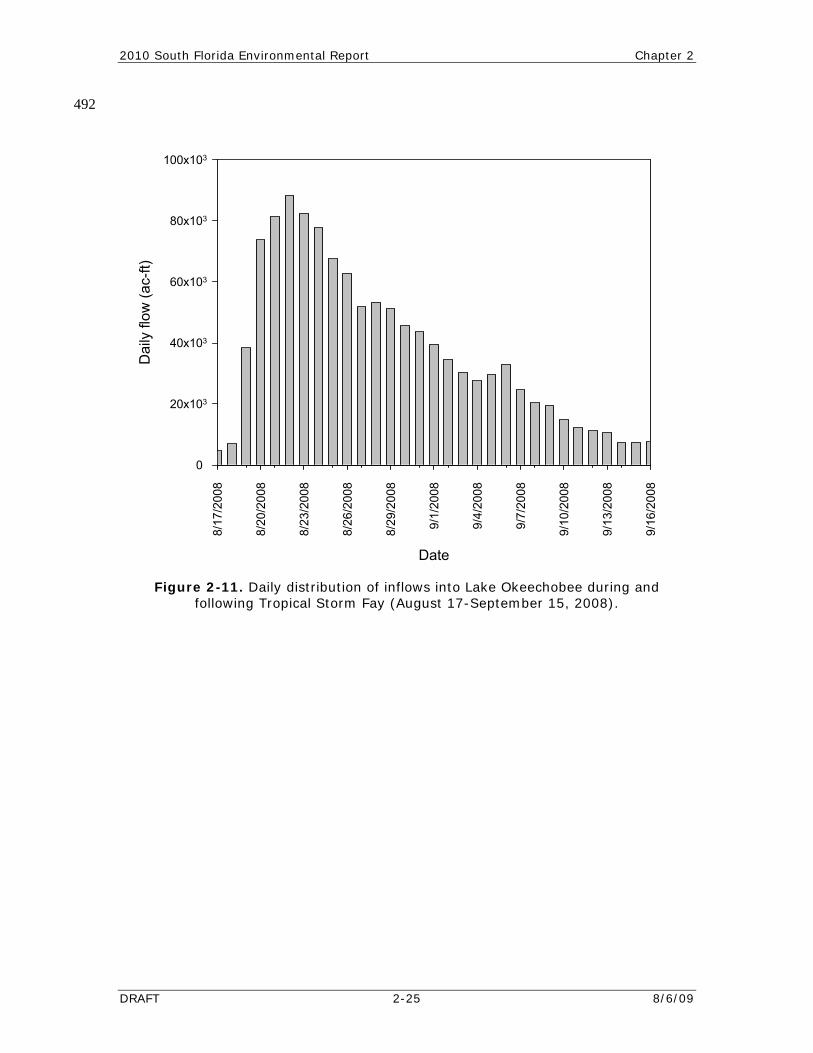
492
Figure 2-11. Daily distribution of inflows into Lake Okeechobee during and following Tropical Storm Fay (August 17-September 15, 2008).
Date
8/17
/200
8
8/20
/200
8
8/23
/200
8
8/26
/200
8
8/29
/200
8
9/1/
2008
9/4/
2008
9/7/
2008
9/10
/200
8
9/13
/200
8
9/16
/200
8
Dai
ly fl
ow (a
c-ft)
0
20x103
40x103
60x103
80x103
100x103
Chapter 2 Volume I: The South Florida Environment
8/6/09 2-26 DRAFT
Groundwater 493
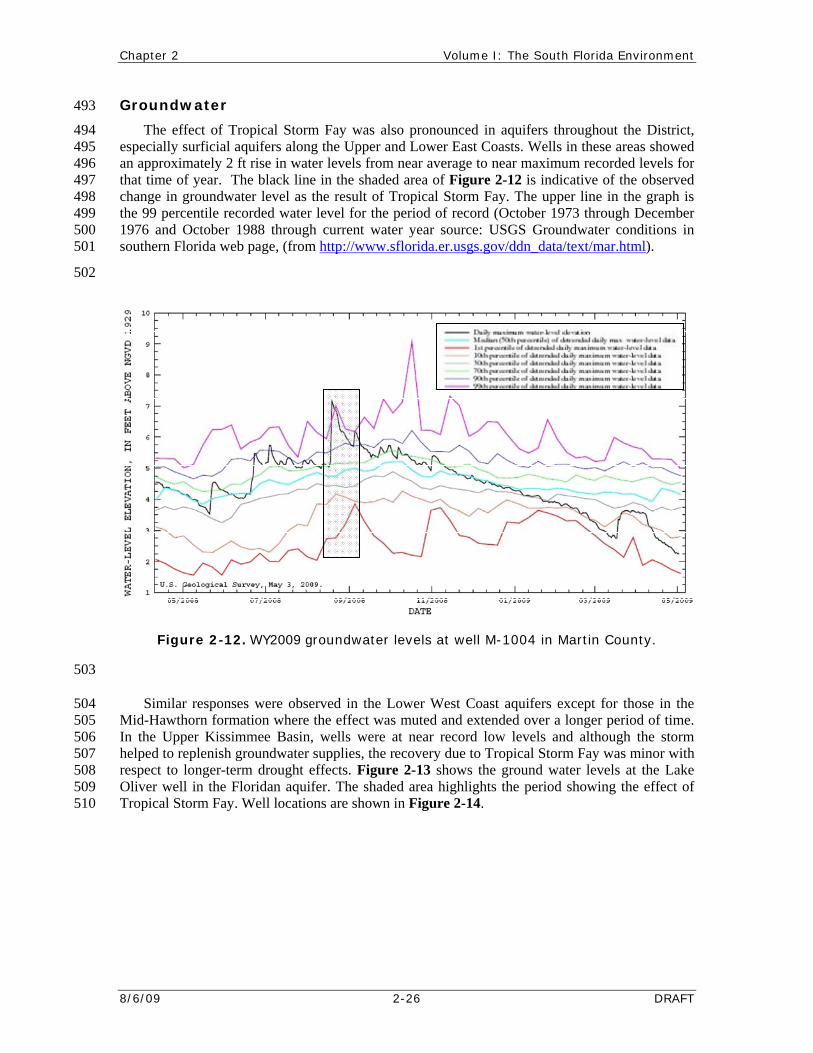
The effect of Tropical Storm Fay was also pronounced in aquifers throughout the District, 494 especially surficial aquifers along the Upper and Lower East Coasts. Wells in these areas showed 495 an approximately 2 ft rise in water levels from near average to near maximum recorded levels for 496 that time of year. The black line in the shaded area of Figure 2-12 is indicative of the observed 497 change in groundwater level as the result of Tropical Storm Fay. The upper line in the graph is 498 the 99 percentile recorded water level for the period of record (October 1973 through December 499 1976 and October 1988 through current water year source: USGS Groundwater conditions in 500 southern Florida web page, (from http://www.sflorida.er.usgs.gov/ddn_data/text/mar.html). 501
502
503
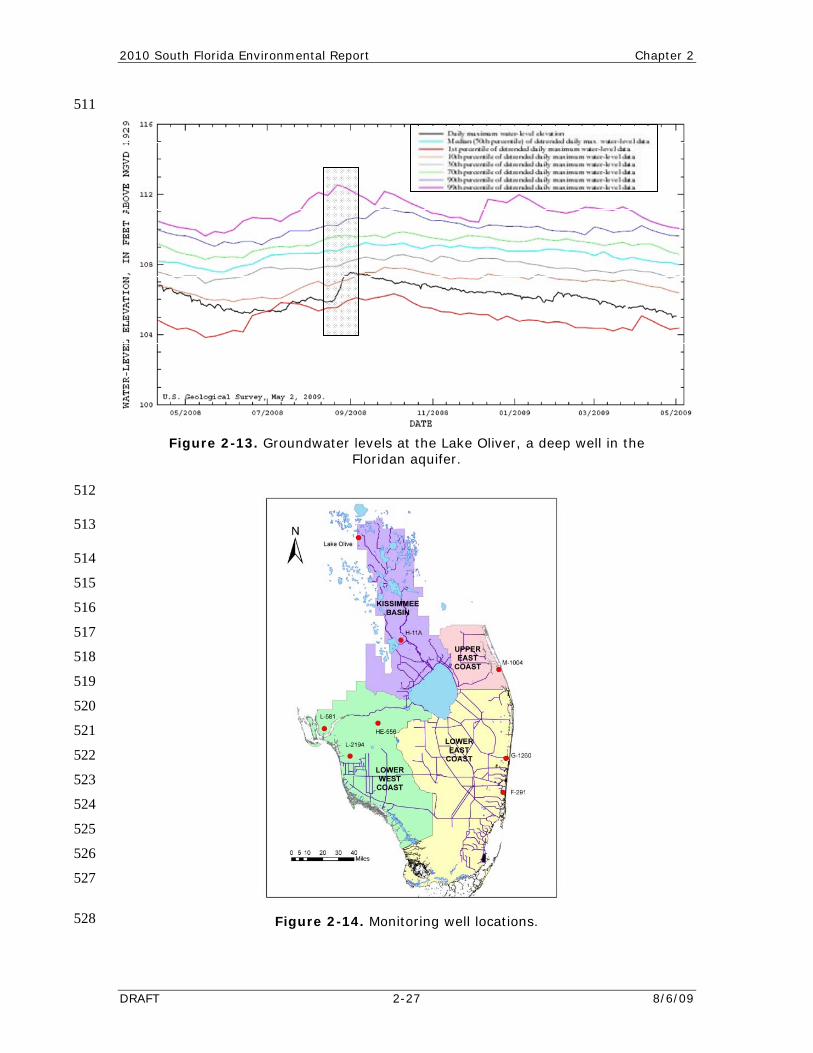
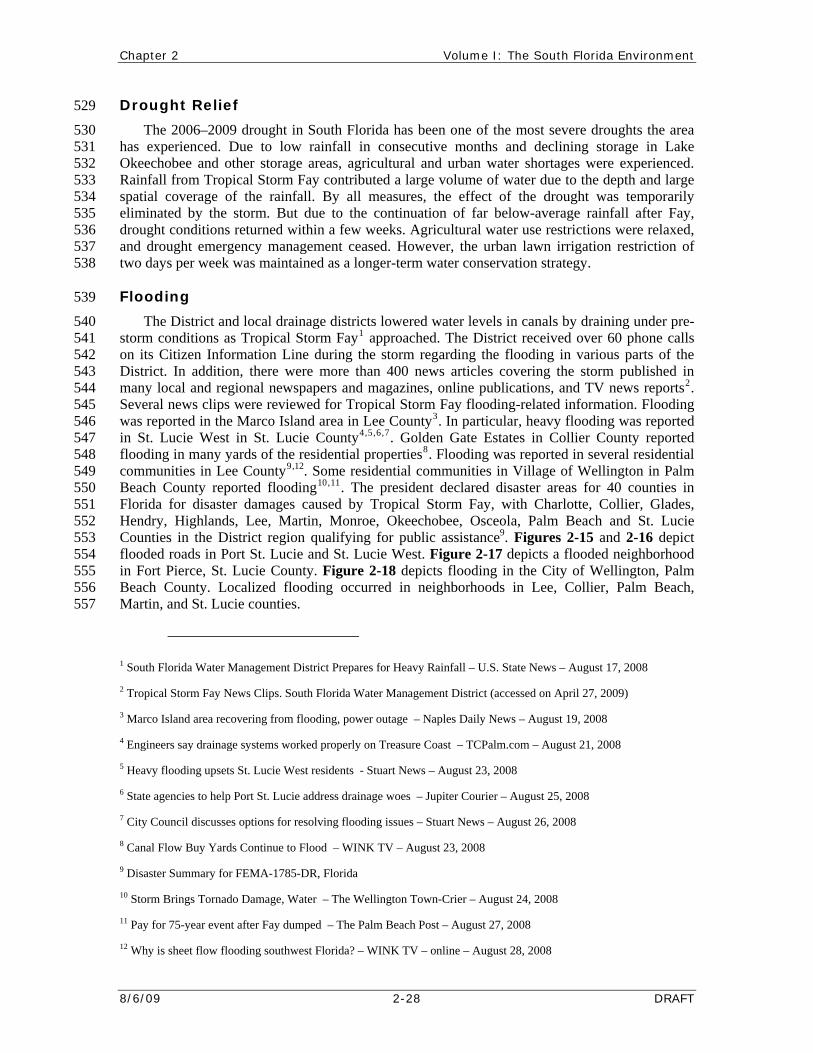
Similar responses were observed in the Lower West Coast aquifers except for those in the 504 Mid-Hawthorn formation where the effect was muted and extended over a longer period of time. 505 In the Upper Kissimmee Basin, wells were at near record low levels and although the storm 506 helped to replenish groundwater supplies, the recovery due to Tropical Storm Fay was minor with 507 respect to longer-term drought effects. Figure 2-13 shows the ground water levels at the Lake 508 Oliver well in the Floridan aquifer. The shaded area highlights the period showing the effect of 509 Tropical Storm Fay. Well locations are shown in Figure 2-14. 510
Figure 2-12. WY2009 groundwater levels at well M-1004 in Martin County.
2010 South Florida Environmental Report Chapter 2
DRAFT 2-27 8/6/09
511
512
513
514
515
516
517
518
519
520
521
522
523
524
525
526
527
528
Figure 2-13. Groundwater levels at the Lake Oliver, a deep well in the Floridan aquifer.
Figure 2-14. Monitoring well locations.
Chapter 2 Volume I: The South Florida Environment
8/6/09 2-28 DRAFT
Drought Relief 529
The 2006–2009 drought in South Florida has been one of the most severe droughts the area 530 has experienced. Due to low rainfall in consecutive months and declining storage in Lake 531 Okeechobee and other storage areas, agricultural and urban water shortages were experienced. 532 Rainfall from Tropical Storm Fay contributed a large volume of water due to the depth and large 533 spatial coverage of the rainfall. By all measures, the effect of the drought was temporarily 534 eliminated by the storm. But due to the continuation of far below-average rainfall after Fay, 535 drought conditions returned within a few weeks. Agricultural water use restrictions were relaxed, 536 and drought emergency management ceased. However, the urban lawn irrigation restriction of 537 two days per week was maintained as a longer-term water conservation strategy. 538
Flooding 539
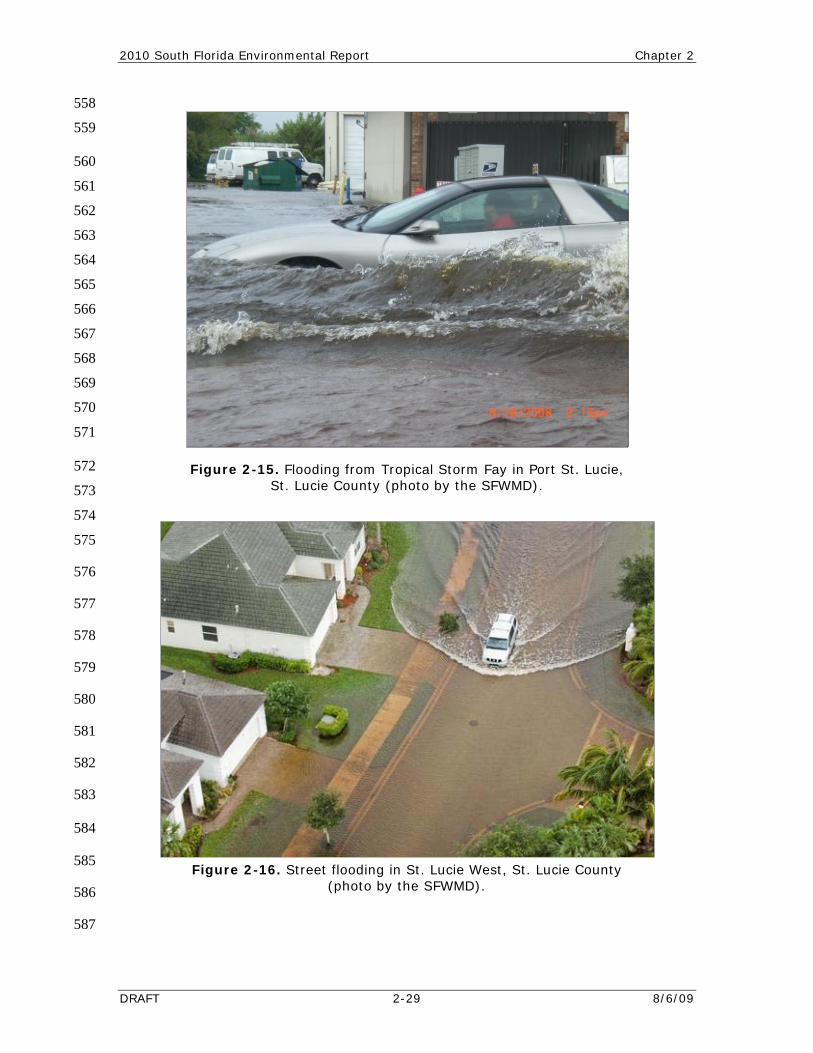
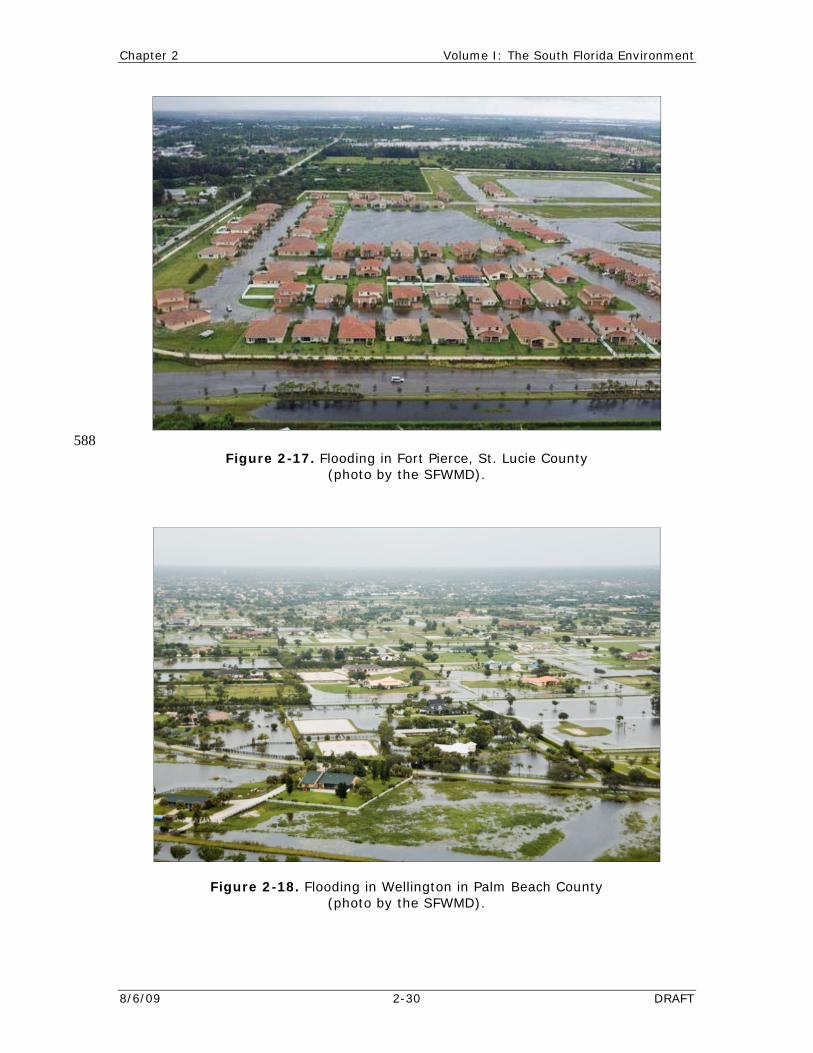
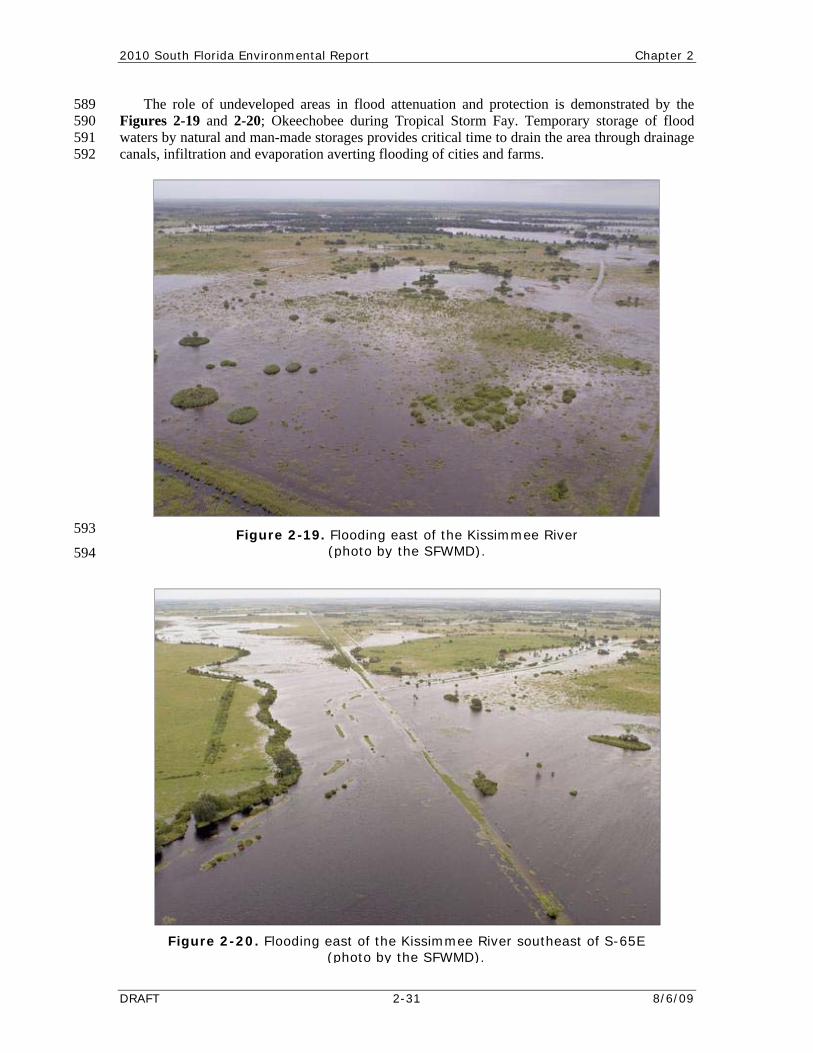
The District and local drainage districts lowered water levels in canals by draining under pre-540 storm conditions as Tropical Storm Fay1 approached. The District received over 60 phone calls 541 on its Citizen Information Line during the storm regarding the flooding in various parts of the 542 District. In addition, there were more than 400 news articles covering the storm published in 543 many local and regional newspapers and magazines, online publications, and TV news reports2. 544 Several news clips were reviewed for Tropical Storm Fay flooding-related information. Flooding 545 was reported in the Marco Island area in Lee County3. In particular, heavy flooding was reported 546 in St. L ported 547 flooding in many yards of the residenti ing was reported in several residential 548 communities in Lee County9,12. Some residential communities in Village of Wellington in Palm 549 Beach County reported flooding10,11. The president declared disaster areas for 40 counties in 550 Florida for disaster damages caused by Tropical Storm Fay, with Charlotte, Collier, Glades, 551 Hendry, Highlands, Lee, Martin, Monroe, Okeechobee, Osceola, Palm Beach and St. Lucie 552 Counties in the District region qualifying for public assistance9. Figures 2-15 and 2-16 depict 553 flooded road ucie and St. Lucie West. Figure 2-17 depicts a flooded neighborhood 554 in Fort Pierce, St. Lucie County. Figure 2-18 depicts flooding in the City of Wellington, Palm 555 Beach County. Localized flooding occurred in neighborhoods in Lee, Collier, Palm Beach, 556 Martin, and St. Lucie counties. 557
ucie West in St. Lucie County4,5,6,7. Golden Gate Estates in Collier County real properties8. Flood
s in Port St. L
1 South Florida Water Management District Prepares for Heavy Rainfall – U.S. State News – August 17, 2008
2 Tropical Storm Fay News Clips. South Florida Water Management District (accessed on April 27, 2009)
3 Marco Island area recovering from flooding, power outage – Naples Daily News – August 19, 2008
4 Engineers say drainage systems worked properly on Treasure Coast – TCPalm.com – August 21, 2008
5 Heavy flooding upsets St. Lucie West residents - Stuart News – August 23, 2008
6 State agencies to help Port St. Lucie address drainage woes – Jupiter Courier – August 25, 2008
7 Cit Council discusses options for resolving flooding issues – Stuart News – August 26, 2008
8 Canal Flow Buy Yards Continue to Flood – WINK TV – August 23, 2008
9 Disaster Summary for FEMA-1785-DR, Florida
10 Storm Brings Tornado Damage, Water – The Wellington Town-Crier – August 24, 2008
11 Pa 75-year event after Fay dumped – The Palm Beach Post – August 27, 2008
12 Why is sheet flow flooding so 8
y
y for
uthwest Florida? – WINK TV – online – August 28, 200
2010 South Florida Environmental Report Chapter 2
DRAFT 2-29 8/6/09
558
559
560
561
562
563
564
565
566
567
568
569
570
571
572
573
574
575
576
577
578
579
580
581
582
583
584
585
586
587
Figure 2-15. Flooding from Tropical Storm Fay in Port St. Lucie, St. Lucie County (photo by the SFWMD).
Figure 2-16. Street flooding in St. Lucie West, St. Lucie County (photo by the SFWMD).
Chapter 2 Volume I: The South Florida Environment
8/6/09 2-30 DRAFT
588 Figure 2-17. Flooding in Fort Pierce, St. Lucie County
(photo by the SFWMD).
Figure 2-18. Flo County (photo by the SFWMD). oding in Wellington in Palm Beach
2010 S outh Florida Environmental Report Chapter 2
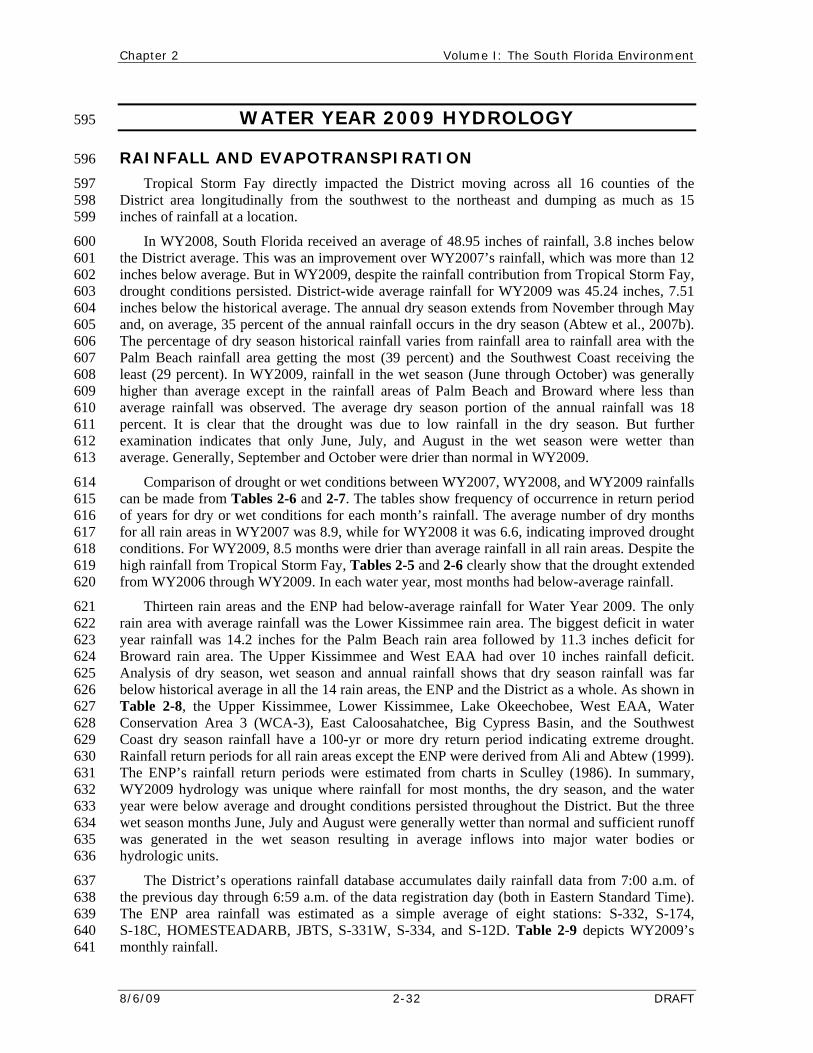
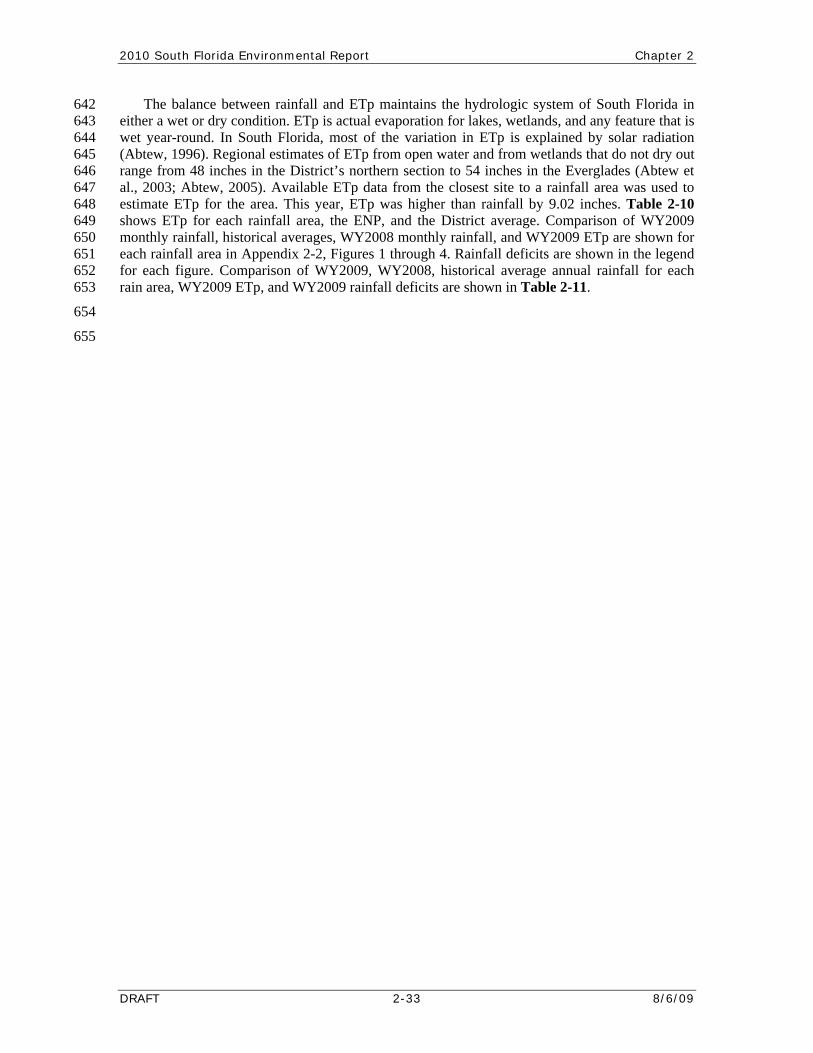
The role of undeveloped areas in flood attenuation and protection is demonstrated byFigures 2-19 and 2-20; Okeechobee during Tropical Storm Fay. Temporary storage of floowaters by natural and man-made storages provides critical time to drain the area through drainagecanals, infiltration and evaporation averting flooding of cities and farms.
DRAFT 2-31 8/6/09
Figure 2-19. Flooding east of the Kissimmee River (photo by the SFWMD).
the 589 d 590
591 592
593
594
Figure 2-20. Flooding east of the Kissimmee River southeast of S-65E (photo by the SFWMD).
Chapter 2 Volume I: The South Florida Environment
8/6/09 2-32 DRAFT
WATER YEAR 2009 HYDROLOGY 595
596
oving across all 16 counties of the ping as much as 15
was more than 12 Tropical Storm Fay,
nches, 7.51 November through May
season (Abtew et al., 2007b). area to rainfall area with the
eiving the r) was generally
h and Broward where less than y season portion of the annual rainfall was 18
y season. But further were wetter than
9.
and WY2009 rainfalls riod
ber of dry months for all rain areas in mproved drought 617 onditions. For WY2009, 8.5 mont infall in all rain areas. Despite the 618
Storm Fay, Tables 2-5 and 2-6 clearly show that the drought extended 619 from WY2006 through WY2009. In each water year, most months had below-average rainfall. 620
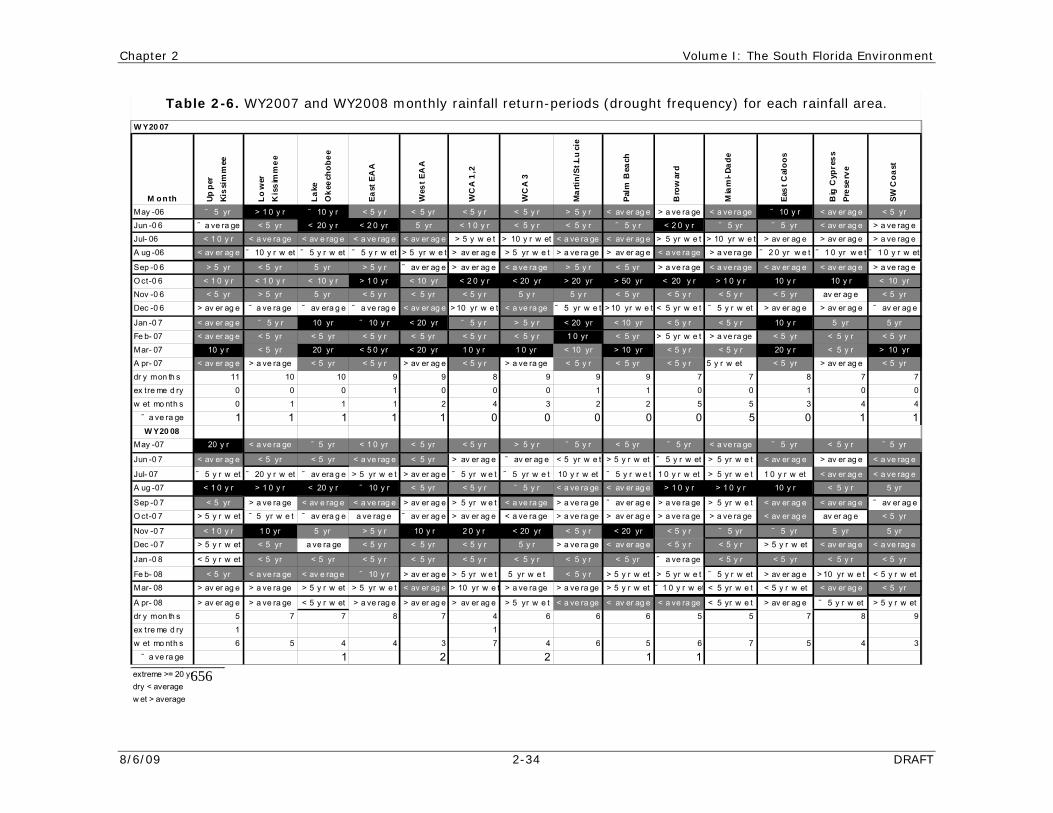
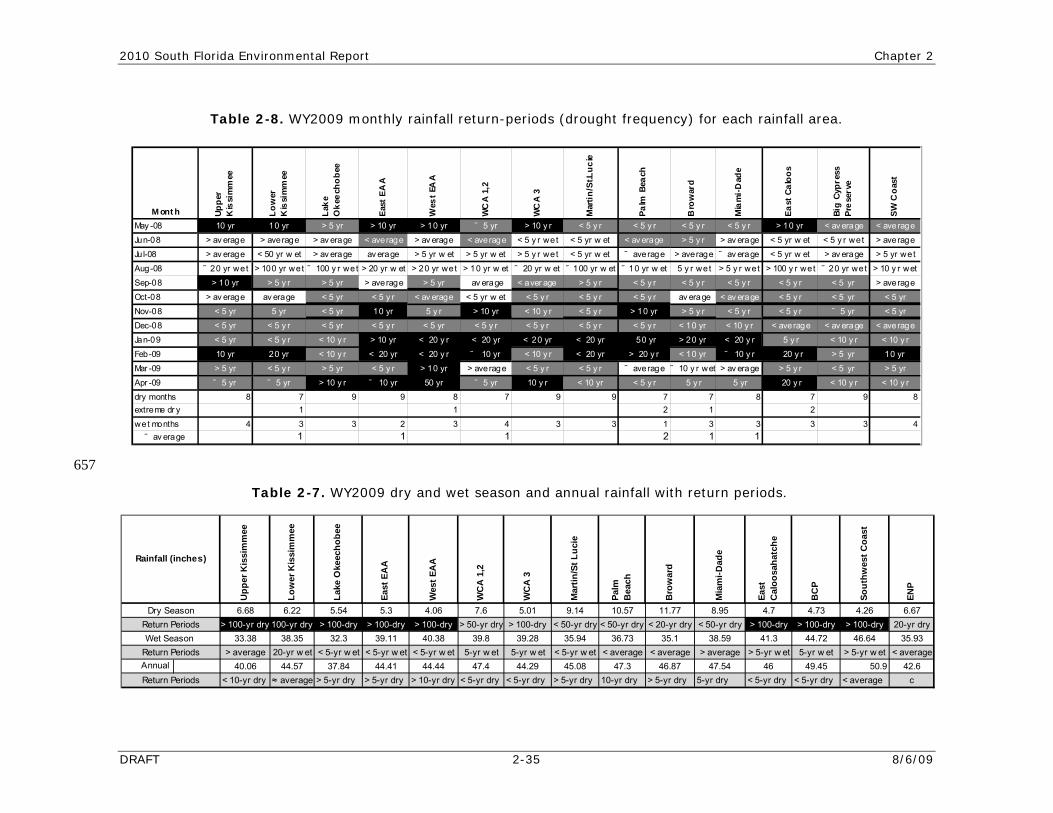
Thirteen rain areas and the ENP had below-average rainfall for Water Year 2009. The only 621 rain area with average rainfall was the Lower Kissimmee rain area. The biggest deficit in water 622 year rainfall was 14.2 inches for the Palm Beach rain area followed by 11.3 inches deficit for 623 Broward rain area. The Upper Kissimmee and West EAA had over 10 inches rainfall deficit. 624 Analysis of dry season, wet season and annual rainfall shows that dry season rainfall was far 625 below historical average in all the 14 rain areas, the ENP and the District as a whole. As shown in 626 Table 2-8, the Upper Kissimmee, Lower Kissimmee, Lake Okeechobee, West EAA, Water 627 Conservation Area 3 (WCA-3), East Caloosahatchee, Big Cypress Basin, and the Southwest 628 Coast dry season rainfall have a 100-yr or more dry return period indicating extreme drought. 629 Rainfall return periods for all rain areas except the ENP were derived from Ali and Abtew (1999). 630 The ENP’s rainfall return periods were estimated from charts in Sculley (1986). In summary, 631 WY2009 hydrology was unique where rainfall for most months, the dry season, and the water 632 year were below average and drought conditions persisted throughout the District. But the three 633 wet season months June, July and August were generally wetter than normal and sufficient runoff 634 was generated in the wet season resulting in average inflows into major water bodies or 635 hydrologic units. 636
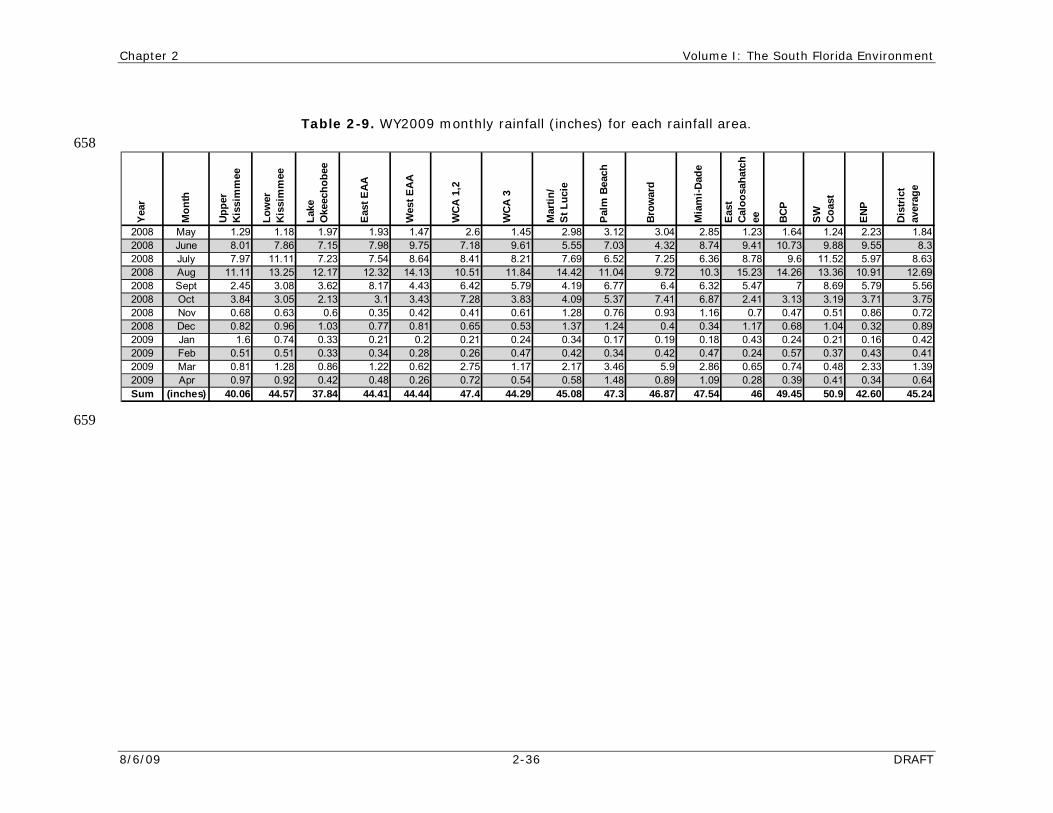
The District’s operations rainfall database accumulates daily rainfall data from 7:00 a.m. of 637 the previous day through 6:59 a.m. of the data registration day (both in Eastern Standard Time). 638 The ENP area rainfall was estimated as a simple average of eight stations: S-332, S-174, 639 S-18C, HOMESTEADARB, JBTS, S-3640 monthly641
RAINFALL AND EVAPOTRANSPIRATION
Tropical Storm Fay directly impacted the District m597 District area longitudinally from the southwest to the northeast and dum598 inches of rainfall at a location. 599
In WY2008, South Florida received an average of 48.95 inches of rainfall, 3.8 inches below 600 the District average. This was an improvement over WY2007’s rainfall, which 601 inches below average. But in WY2009, despite the rainfall contribution from602 drought conditions persisted. District-wide average rainfall for WY2009 was 45.24 i603 inches below the historical average. The annual dry season extends from604 and, on average, 35 percent of the annual rainfall occurs in the dry605 The percentage of dry season historical rainfall varies from rainfall606 Palm Beach rainfall area getting the most (39 percent) and the Southwest Coast rec607 least (29 percent). In WY2009, rainfall in the wet season (June through Octobe608 higher than average except in the rainfall areas of Palm Beac609 average rainfall was observed. The average dr610 percent. It is clear that the drought was due to low rainfall in the dr611 examination indicates that only June, July, and August in the wet season 612 average. Generally, September and October were drier than normal in WY200613
Comparison of drought or wet conditions between WY2007, WY2008, 614 can be made from Tables 2-6 and 2-7. The tables show frequency of occurrence in return pe615 of years for dry or wet conditions for each month’s rainfall. The average num616
WY2007 was 8.9, while for WY2008 it was 6.6, indicating ihs were drier than average rac
high rainfall from Tropical
31W, S-334, and S-12D. Table 2-9 depicts WY2009’s rainfall.
2010 South Florida Environmental Report Chapter 2
The balance between rainfall and ETp th Florida in 642 either a wet or dry c any feature that is 643 wet year-round. In South Florida, most of the variation in ETp is explained by solar radiation 644
d from wetlands that do not dry out 645 range from646 al., 647
648 ea, the ENP, and the District average. Comparison of WY2009 649
mon650 651 652 653
654
655
maintains the hydrologic system of Souondition. ETp is actual evaporation for lakes, wetlands, and
(Abtew, 1996). Regional estimates of ETp from open water an 48 inches in the District’s northern section to 54 inches in the Everglades (Abtew et
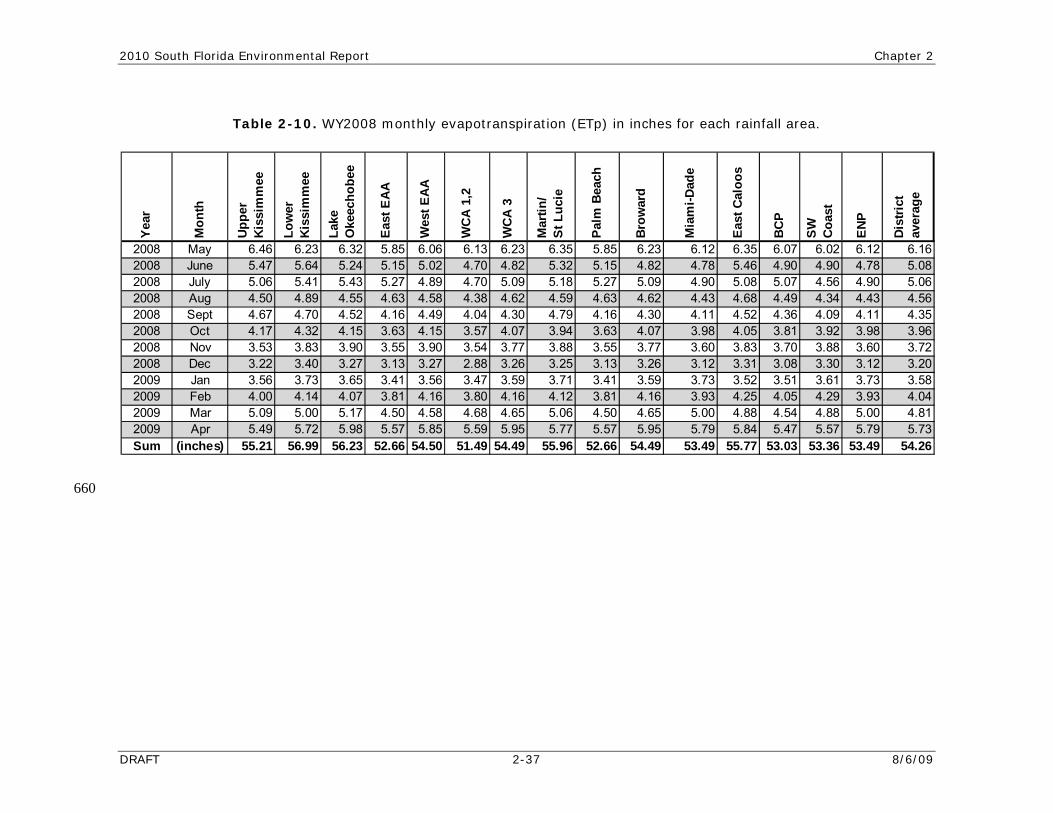
2003; Abtew, 2005). Available ETp data from the closest site to a rainfall area was used to estimate ETp for the area. This year, ETp was higher than rainfall by 9.02 inches. Table 2-10 shows ETp for each rainfall ar
thly rainfall, historical averages, WY2008 monthly rainfall, and WY2009 ETp are shown for each rainfall area in Appendix 2-2, Figures 1 through 4. Rainfall deficits are shown in the legend for each figure. Comparison of WY2009, WY2008, historical average annual rainfall for each rain area, WY2009 ETp, and WY2009 rainfall deficits are shown in Table 2-11.
DRAFT 2-33 8/6/09
Chapter 2 Volume I: The South Florida Environment
8/6/09 2-34 DRAFT
Table 2-6. WY2007 and WY2008 monthly rainfall return-periods (drought frequency) for each rainfall area.
656
May -06 ˜ 5 yr > 1 0 y r ˜ 10 y r < 5 y r < 5 yr < 5 y r < 5 y r > 5 y r < av er ag e > a ve ra ge < a ve ra geJun -0 6 ˜ a ve ra ge < 5 yr < 20 y r < 2 0 yr 5 yr < 1 0 y r < 5 y r < 5 y r ˜ 5 y r < 2 0 y r ˜ 5 yrJul- 06 < 1 0 y r < a ve ra ge < av e rag e < a ve rag e < av er ag e > 5 y w e t > 10 y r w et < a ve ra ge < av er ag e > 5 yr w e t > 10 yr w e
A ug -06 < av er ag e ˜ 10 y r w et ˜ 5 y r w et ˜ 5 y r w et > 5 yr w e t > av er ag e > 5 yr w e t > a ve ra ge > av er ag e < a ve ra ge > a ve ra ge
Sep -0 6 > 5 yr < 5 yr 5 yr > 5 y r ˜ av er ag e > av er ag e < a ve ra ge > 5 y r < 5 yr > a ve ra ge < a ve ra ge
O ct-0 6 < 1 0 y r < 1 0 y r < 10 y r > 1 0 yr < 10 yr < 2 0 y r < 20 yr > 20 yr > 50 yr < 20 y r > 1 0 y rNov -0 6 < 5 yr > 5 yr 5 yr < 5 y r < 5 yr < 5 y r 5 y r 5 y r < 5 yr < 5 y r < 5 y r
Dec -0 6 > av er ag e ˜ a ve ra ge ˜ av era g e ˜ a ve rag e < av er ag e > 10 yr w e t < a ve ra ge ˜ 5 yr w e t > 10 yr w e t < 5 yr w e t ˜ 5 y r w et
Jan -0 7 < av er ag e ˜ 5 y r 10 yr ˜ 10 y r < 20 yr ˜ 5 y r > 5 y r < 20 yr < 10 yr < 5 y r < 5 y rFe b- 07 < av er ag e < 5 yr < 5 yr < 5 y r < 5 yr < 5 y r < 5 y r 1 0 yr < 5 yr > 5 yr w e t > a ve ra ge
Mar- 07 10 y r < 5 yr 20 yr < 5 0 yr < 20 yr 1 0 y r 1 0 yr < 10 yr > 10 yr < 5 y r < 5 y rA pr- 07 < av er ag e > a ve ra ge < 5 yr < 5 y r > av er ag e < 5 y r > a ve ra ge < 5 y r < 5 yr < 5 y r 5 y r w et
dr y mon th s 11 10 10 9 9 8 9 9 9 7 7ex tre me d ry 0 0 0 1 0 0 0 1 1 0 0
w et mo nth s 0 1 1 1 2 4 3 2 2 5˜ a ve ra ge 1 1 1 1 1 0 0 0 0 0W Y20 08
May -07 20 y r < a ve ra ge ˜ 5 yr < 1 0 yr < 5 yr < 5 y r > 5 y r ˜ 5 y r < 5 yr ˜ 5 yr < a ve ra ge
Jun -0 7 < av er ag e < 5 yr < 5 yr < a ve rag e < 5 yr > av er ag e ˜ av er ag e < 5 yr w e t > 5 y r w et ˜ 5 y r w et > 5 yr w e t
Jul- 07 ˜ 5 y r w et ˜ 20 y r w et ˜ av era g e > 5 yr w e t > av er ag e ˜ 5 yr w e t ˜ 5 yr w e t 10 y r w et ˜ 5 y r w e t 1 0 y r w et > 5 yr w e tA ug -07 < 1 0 y r > 1 0 y r < 20 y r ˜ 10 y r < 5 yr < 5 y r ˜ 5 y r < a ve ra ge < av er ag e > 1 0 y r > 1 0 y r
Sep -0 7 < 5 yr > a ve ra ge < av e rag e < a ve rag e > av er ag e > 5 yr w e t < a ve ra ge > a ve ra ge ˜ av er ag e > a ve ra ge > 5 yr w e tO ct-0 7 > 5 y r w et ˜ 5 yr w e t ˜ av era g e a ve rag e ˜ av er ag e > av er ag e < a ve ra ge > a ve ra ge > av er ag e > a ve ra ge > a ve ra ge
Nov -0 7 < 1 0 y r 1 0 yr 5 yr > 5 y r 10 y r 2 0 y r < 20 yr < 5 y r < 20 yr < 5 y r ˜ 5 yrDec -0 7 > 5 y r w et < 5 yr a ve ra ge < 5 y r < 5 yr < 5 y r 5 y r > a ve ra ge < av er ag e < 5 y r < 5 y r
Jan -0 8 < 5 y r w et < 5 yr < 5 yr < 5 y r < 5 yr < 5 y r < 5 y r < 5 y r < 5 yr ˜ a ve ra ge < 5 y r
Fe b- 08 < 5 yr < a ve ra ge < av e rag e ˜ 10 y r > av er ag e > 5 yr w e t 5 yr w e t < 5 y r > 5 y r w et > 5 yr w e t ˜ 5 y r w etMar- 08 > av er ag e > a ve ra ge > 5 y r w et > 5 yr w e t < av er ag e > 10 yr w e t > a ve ra ge > a ve ra ge > 5 y r w et ˜ 1 0 y r w e
˜ 10 y r < av er ag e < 5 yr˜ 5 yr < av er ag e > a ve rag e
t > av er ag e > av er ag e > a ve rag e
˜ 2 0 yr w e t ˜ 1 0 yr w e t ˜ 1 0 y r w et
< av er ag e < av er ag e > a ve rag e
10 y r 10 y r < 10 yr< 5 yr av er ag e < 5 yr
> av er ag e > av er ag e ˜ av er ag e
10 y r 5 yr 5 yr< 5 yr < 5 y r < 5 yr
20 y r < 5 y r > 10 yr< 5 yr > av er ag e < 5 yr
8 7 71 0 0
5 3 4 4
5 0 1 1
˜ 5 yr < 5 y r ˜ 5 yr
< av er ag e > av er ag e < a ve rag e
1 0 y r w et < av er ag e < a ve rag e10 y r < 5 y r 5 yr
< av er ag e < av er ag e ˜ av er ag e< av er ag e av er ag e < 5 yr
˜ 5 yr 5 yr 5 yr> 5 y r w et < av er ag e < a ve rag e
< 5 yr < 5 y r < 5 yr
> av er ag e > 10 yr w e t < 5 y r w et
t < 5 yr w e t
A pr- 08 > av er ag e > a ve ra ge < 5 y r w et > a ve rag e > av er ag e > av er ag e > 5 yr w e t < a ve ra ge < av er ag e < a ve ra ge < 5 yr w e t > dr y mon th s 5 7 7 8 7 4 6 6 6 5 5
ex tre me d ry 1 1 w et mo nth s 6 5 4 4 3 7 4 6 5 6
˜ a ve ra ge 1 2 2 1 1
W Y20 07
M onth Palm
Bea
ch
Bro
war
d
Mia
mi-D
ade
Wes
t EA
A
WC
A 1
,2
WC
A 3
Mar
tin/S
t.Lu
cie
Uppe
r Ki
ssim
mee
Low
er
Kis
sim
mee
Lake
O
keec
hobe
e
East
EA
A
< 5 y r w et < av er ag e < 5 yr
av er ag e ˜ 5 y r w et > 5 y r w et7 8 9
7 5 4 3
SW C
oast
East
Cal
oos
Big
Cyp
ress
Pr
eser
ve
extreme >= 20 yrdry < averagew et > average
2010 South Florida Environmental Report Chapter 2
DRAFT 2-35 8/6/09
6.68 6.22 5.54 5.3 4.06 7.6 5.01 9.14 10.57 11.77 8.95 4.7 4.73 4.26 6.67> 100-yr dry 100-yr dry > 100-dry > 100-dry > 100-dry > 50-yr dry > 100-dry < 50-yr dry < 50-yr dry < 20-yr dry < 50-yr dry > 100-dry > 100-dry > 100-dry 20-yr dry
33.38 38.35 32.3 39.11 40.38 39.8 39.28 35.94 36.73 35.1 38.59 41.3 44.72 46.64 35.93> average 20-yr w et < 5-yr w et < 5-yr w et < 5-yr w et 5-yr w et 5-yr w et < 5-yr w et < average < average > average > 5-yr w et 5-yr w et > 5-yr w et < average
Annual 40.06 44.57 37.84 44.41 44.44 47.4 44.29 45.08 47.3 46.87 47.54 46 49.45 50.9 42.6< 10-yr dry ≈ average > 5-yr dry > 5-yr dry > 10-yr dry < 5-yr dry < 5-yr dry > 5-yr dry 10-yr dry > 5-yr dry 5-yr dry < 5-yr dry < 5-yr dry < average c
ENP
Dry SeasonReturn Periods
Palm
B
each
Bro
war
d
Wes
t EA
A
WC
A 1
,2
East
C
aloo
saha
tche
BC
P
Sout
hwes
t Coa
st
Mar
tin/S
t Luc
ie
Mia
mi-D
ade
East
EA
A
WC
A 3
Low
er K
issi
mm
ee
Lake
Oke
echo
bee
Return Periods
Rainfall (inches)
Upp
er K
issi
mm
ee
Wet Season Return Periods
657
May -08 10 yr 10 yr > 5 yr > 10 yr > 10 yr ˜ 5 yr > 10 y r < 5 y r < 5 y r < 5 y r < 5 y r > 10 yr < av erage < average
Jun-08 > av erage > average > av erage < average > av erage < average < 5 y r wet < 5 yr w et < av erage > 5 y r > av erage < 5 yr w et < 5 y r wet > averageJul-08 > av erage < 50 yr w et > av erage av erage > 5 yr w et > 5 yr w et > 5 y r wet < 5 yr w et ˜ average > average ˜ av erage < 5 yr w et > av erage > 5 yr wet
Aug-08 ˜ 20 yr wet > 100 yr wet ˜ 100 y r wet > 20 yr w et > 20 yr wet > 10 yr w et ˜ 20 yr w et ˜ 100 yr w et ˜ 10 yr w et 5 y r wet > 5 y r wet > 100 y r wet ˜ 20 yr wet > 10 y r wet
Sep-08 > 10 yr > 5 y r > 5 yr > average > 5 yr av erage < aver age > 5 y r < 5 y r < 5 y r < 5 y r < 5 y r < 5 yr > average
Oct-08 > av erage av erage < 5 yr < 5 y r < av erage < 5 yr w et < 5 y r < 5 y r < 5 y r av erage < av erage < 5 y r < 5 yr < 5 yr
Nov-08 < 5 yr 5 yr < 5 yr 10 yr 5 y r > 10 yr < 10 y r < 5 y r > 10 yr > 5 y r < 5 y r < 5 y r ˜ 5 yr < 5 yrDec-08 < 5 yr < 5 y r < 5 yr < 5 y r < 5 yr < 5 y r < 5 y r < 5 y r < 5 y r < 10 yr < 10 y r < average < av erage < average
Jan-09 < 5 yr < 5 y r < 10 y r > 10 yr < 20 y r < 20 yr < 20 yr < 20 yr 50 yr > 20 yr < 20 y r 5 y r < 10 y r < 10 y r
Feb-09 10 yr 20 yr < 10 y r < 20 yr < 20 y r ˜ 10 yr < 10 y r < 20 yr > 20 y r < 10 yr ˜ 10 y r 20 y r > 5 yr 10 yr
Mar -09 > 5 yr < 5 y r > 5 yr < 5 y r > 10 yr > average < 5 y r < 5 y r ˜ average ˜ 10 y r wet > av erage > 5 y r < 5 yr > 5 yr
Apr -09 ˜ 5 yr ˜ 5 yr > 10 y r ˜ 10 yr 50 yr ˜ 5 yr 10 y r < 10 yr < 5 y r 5 y r 5 yr 20 y r < 10 y r < 10 y rdry months 8 7 9 9 8 7 9 9 7 7 8 7 9 8extreme dr y 1 1 2 1 2
wet months 4 3 3 2 3 4 3 3 1 3 3 3 3 4˜ av erage 1 1 1 2 1 1
Mar
tin/S
t.Luc
ie
Uppe
r K
issi
mm
ee
Low
er
Kis
sim
mee
Lake
O
keec
hobe
e
East
EA
A
Big
Cypr
ess
Pres
erve
SW C
oast
M ont h Palm
Bea
ch
Bro
war
d
Mia
mi-D
ade
East
Cal
oos
Wes
t EA
A
WC
A 1,
2
WC
A 3
Table 2-8. WY2009 monthly rainfall return-periods (drought frequency) for each rainfall area.
Table 2-7. WY2009 dry and wet season and annual rainfall with return periods.
Chapter 2 Volume I: The South Florida Environment
8/6/09 2-36 DRAFT
2008 May 1.29 1.18 1.97 1.93 1.47 2.6 1.452008 June 8.01 7.86 7.15 7.98 9.75 7.18 9.612008 July 7.97 11.11 7.23 7.54 8.64 8.41 8.22008 Aug 11.11 13.25 12.17 12.32 14.13 10.51 11.82008 Sept 2.45 3.08 3.62 8.17 4.43 6.42 5.792008 Oct 3.84 3.05 2.13 3.1 3.43 7.28 3.82008 Nov 0.68 0.63 0.6 0.35 0.42 0.41 0.62008 Dec 0.82 0.96 1.03 0.77 0.81 0.65 0.52009 Jan 1.6 0.74 0.33 0.21 0.2 0.21 0.22009 Feb 0.51 0.51 0.33 0.34 0.28 0.26 0.42009 Mar 0.81 1.28 0.86 1.22 0.62 2.75 1.12009 Apr 0.97 0.92 0.42 0.48 0.26 0.72 0.5Sum (inches) 40.06 44.57 37.84 44.41 44.44 47.4 44.2
Year
Mon
th
East
EAA
Wes
t EA
A
WCA
1,2
WCA
3
Uppe
r Ki
ssim
mee
Low
er
Kiss
imm
ee
Lake
O
keec
hobe
e
2.98 3.12 3.04 2.85 1.23 1.64 1.24 2.23 1.845.55 7.03 4.32 8.74 9.41 10.73 9.88 9.55 8.3
1 7.69 6.52 7.25 6.36 8.78 9.6 11.52 5.97 8.634 14.42 11.04 9.72 10.3 15.23 14.26 13.36 10.91 12.69
4.19 6.77 6.4 6.32 5.47 7 8.69 5.79 5.563 4.09 5.37 7.41 6.87 2.41 3.13 3.19 3.71 3.751 1.28 0.76 0.93 1.16 0.7 0.47 0.51 0.86 0.723 1.37 1.24 0.4 0.34 1.17 0.68 1.04 0.32 0.894 0.34 0.17 0.19 0.18 0.43 0.24 0.21 0.16 0.427 0.42 0.34 0.42 0.47 0.24 0.57 0.37 0.43 0.417 2.17 3.46 5.9 2.86 0.65 0.74 0.48 2.33 1.394 0.58 1.48 0.89 1.09 0.28 0.39 0.41 0.34 0.649 45.08 47.3 46.87 47.54 46 49.45 50.9 42.60 45.24
Mar
tin/
St L
ucie
Palm
Bea
ch
Brow
ard
Mia
mi-D
ade
Dist
rict
aver
age
East
Ca
loos
ahat
chee BC
P
SW
Co
ast
ENP
658
659
Table 2-9. WY2009 monthly rainfall (inches) for each rainfall area.
DRAFT 2-37 8/6/09
2010 South Florida Environmental Report Chapter 2
2008 May 6.46 6.23 6.32 5.85 6.06 6.13 6.23 6.35 5.85 6.23 6.12 6.35 6.07 6.02 6.12 6.162008 June 5.47 5.64 5.24 5.15 5.02 4.70 4.82 5.32 5.15 4.82 4.78 5.46 4.90 4.90 4.78 5.082008 July 5.06 5.41 5.43 5.27 4.89 4.70 5.09 5.18 5.27 5.09 4.90 5.08 5.07 4.56 4.90 5.062008 Aug 4.50 4.89 4.55 4.63 4.58 4.38 4.62 4.59 4.63 4.62 4.43 4.68 4.49 4.34 4.43 4.562008 Sept 4.67 4.70 4.52 4.16 4.49 4.04 4.30 4.79 4.16 4.30 4.11 4.52 4.36 4.09 4.11 4.352008 Oct 4.17 4.32 4.15 3.63 4.15 3.57 4.07 3.94 3.63 4.07 3.98 4.05 3.81 3.92 3.98 3.962008 Nov 3.53 3.83 3.90 3.55 3.90 3.54 3.77 3.88 3.55 3.77 3.60 3.83 3.70 3.88 3.60 3.722008 Dec 3.22 3.40 3.27 3.13 3.27 2.88 3.26 3.25 3.13 3.26 3.12 3.31 3.08 3.30 3.12 3.202009 Jan 3.56 3.73 3.65 3.41 3.56 3.47 3.59 3.71 3.41 3.59 3.73 3.52 3.51 3.61 3.73 3.582009 Feb 4.00 4.14 4.07 3.81 4.16 3.80 4.16 4.12 3.81 4.16 3.93 4.25 4.05 4.29 3.93 4.042009 Mar 5.09 5.00 5.17 4.50 4.58 4.68 4.65 5.06 4.50 4.65 5.00 4.88 4.54 4.88 5.00 4.81
.95 5.77 5.57 5.95 5.79 5.84 5.47 5.57 5.79 5.73Sum (inches) 55.21 56.99 56.23 52.66 54.50 51.49 54.49 55.96 52.66 54.49 53.49 55.77 53.03 53.36 53.49 54.26
Year
Mon
th
Dist
rict
av
erag
e
East
Cal
oos
BCP
SW
Co
ast
ENP
Mia
mi-D
ade
Uppe
r Ki
ssim
mee
Low
er
Kiss
imm
ee
Lake
O
keec
hobe
e
East
EA
A
Wes
t EA
A
WC
A 1,
2
WC
A 3
Mar
tin/
St L
ucie
Palm
Bea
ch
Brow
ard
2009 Apr 5.49 5.72 5.98 5.57 5.85 5.59 5
660
Table 2- fall area. 10. WY2008 monthly evapotranspiration (ETp) in inches for each rain
Chapter 2 Volume I: The South Florida Environment
8/6/09 2-38 DRAFT
661 662
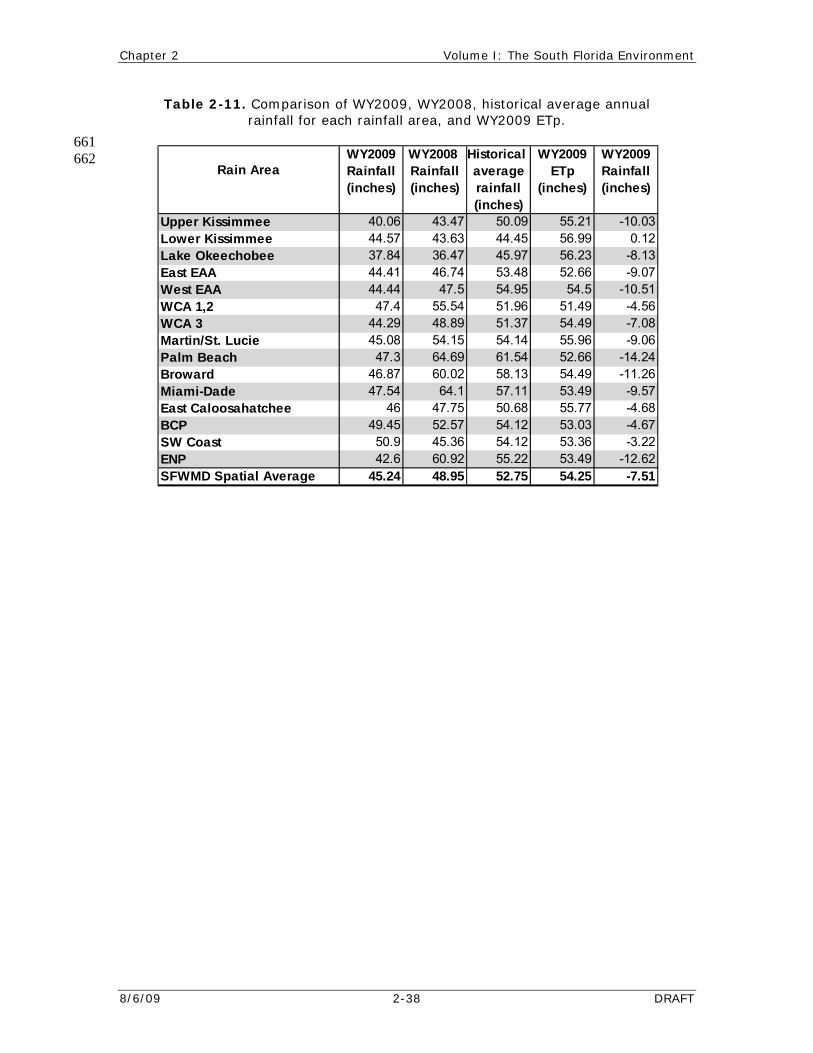
Table 2-11. Comparison of WY2009, WY2008, historical average annual rainfall for each rainfall area, and WY2009 ETp.
WY2009 WY2008 Historical WY2009 WY2009Rainfall Rainfall average ETp Rainfall(inches) (inches) rainfall (inches) (inches)
(inches)Upper Kissimmee 40.06 43.47 50.09 55.21 -10.03Lower Kissimmee 44.57 43.63 44.45 56.99 0.12Lake Okeechobee 37.84 36.47 45.97 56.23 -8.13East EAA 44.41 46.74 53.48 52.66 -9.07West EAA 44.44 47.5 54.95 54.5 -10.51WCA 1,2 47.4 55.54 51.96 51.49 -4.56WCA 3 44.29 48.89 51.37 54.49 -7.08Martin/St. Lucie 45.08 54.15 54.14 55.96 -9.06Palm Beach 47.3 64.69 61.54 52.66 -14.24Broward 46.87 60.02 58.13 54.49 -11.26Miami-Dade 47.54 64.1 57.11 53.49 -9.57East Caloosahatchee 46 47.75 50.68 55.77 -4.68BCP 49.45 52.57 54.12 53.03 -4.67SW Coast 50.9 45.36 54.12 53.36 -3.22ENP 42.6 60.92 55.22 53.49 -12.62SFWMD Spatial Average 45.24 48.95 52.75 54.25 -7.51
Rain Area
2010 South Florida Environmental Report Chapter 2
DRAFT 2-39 8/6/09
WAT663
Water manageme poral 664 distribution of rainfall and antecedent conditions. Although water management of the District 665 facilities is performed according to prescribed operation plans, there are various constraints that 666 need to be considered while developing and implementing shorter-term operating strategies. 667
During the wet and dry seasons of WY2009, most water control structures were operated 668 under water supply mode due to rainfall deficit conditions, except during flooding conditions 669 created by Tropical Storm Fay. There were other rainfalls which initiated flood control water 670 management. Typically, during wet seasons the operations are performed under flood control 671 mode. During both seasons of this year, the water supply deliveries were made for environmental, 672 agricultural, and control of saltwater intrusion purposes. Details are provided in subsections of 673 this chapter. 674
The District has been in drought conditions since the dry season of WY2006. The District’s 675 average annual rainfall is 52.75 inches. During WY2007 and WY2008, the SFWMD received a 676 total of 40.6 and 48.95 inches of rainfall, respectively. During WY2007 wet and dry seasons, the 677 District received 29.4 and 11.2 inches of rain, respectively; both were drier than normal rainfall 678 amounts: approximately 86 and 60 percent, respectively. However, during the WY2008 wet 679 season the District received 33.73 inches, an amount closer to normal rainfall. But during the dry 680 season of that water year, the rainfall of 15.22 inches was less than normal (approximately 82 681 percent of average). In WY2009, District-wide average annual rainfall was 45.24 inches. This is 682 7.51 inches below average. The wet season rainfall of 38.93 inches was above average (114 683 percent of average) and the dry season rainfall of 6.31 inches (34 percent of average) reflects 684 xtreme drought condition. 685
chobee, produced average flow 686 volume due to the wetter than normal wet season that included high rainfall from Tropical Storm 687 Fay. In almost all rain areas, most months received significantly lower amounts of rainfall than 688 normal while only June, July, and August were above average. The Lower Kissimmee rain area 689 received average annual rainfall while the Upper Kissimmee rain area was drier than normal. 690
The lake stages of the Upper Chain of Lakes, Lake Alligator, Lake Gentry, Lake East 691 Tohopekaliga, and Lake Kissimmee were generally lower than the regulation schedule. Lake 692 Myrtle, Lake Mary Jane, and Lake Tohopekaliga were generally close to their respective 693 regulation schedules during WY2009. The water levels of Lake Istokpoga were closer to the 694 upper regulation schedule for most of WY2009. 695
The USACE adopted revisions to Lake Okeechobee operations on April 28, 2008 696 (USACE, 2008). The plots of the lake stages from January 2007 through May 2009, the two 697 regulation schedules (before May 1, 2008 and after May 1, 2008), and water management 698 decisions are shown in Figure 2-21. 699
700
ER MANAGEMENT
nt operations of District facilities depend largely on the spatial and tem
e
The Kissimmee Basin, a major inflow source to Lake Okee
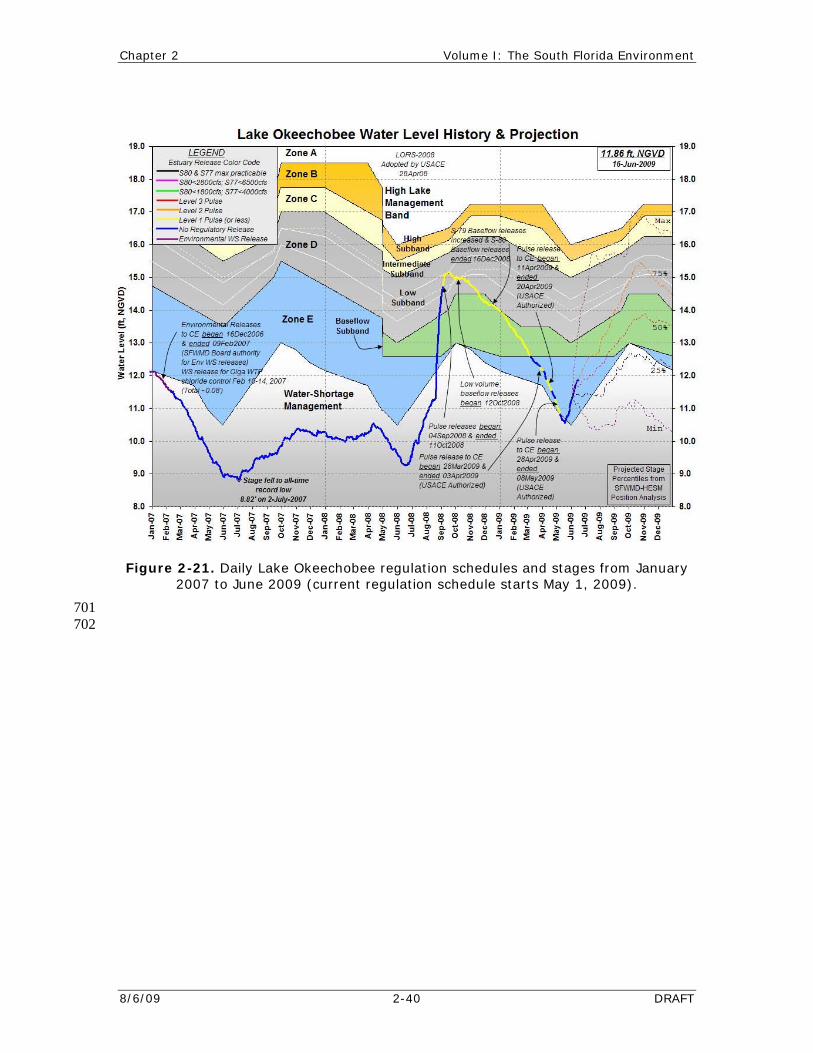
Chapter 2 Volume I: The South Florida Environment
8/6/09 2-40 DRAFT
701 702
Figure 2-21. Daily Lake Okeechobee regulation schedules and stages from January 2007 to June 2009 (current regulation schedule starts May 1, 2009).
2010 South Florida Environmental Report Chapter 2
DRAFT 2-41 8/6/09
Water supply releases are made for various beneficial uses that include water supply for 703 municipal and industrial use, irrigation of agriculture, environmental (the ENP), salinity control, 704 and estuarine management. Flood releases from the lake are made to the St. Lucie Canal and 705 Caloosahatchee River. At low lake levels, releases are made to maintain navigation depths if 706 sufficient water is available in Lake Okeechobee. Releases are also made for maintaining 707 favorable salinity conditions in the St. Lucie and Caloosahatchee Estuaries. Outflows from Lake 708 Okeechobee are received by the St. Lucie Canal, Caloosahatchee Canal, EAA, and WCAs. The 709 details of these sub-region flows are provided in the Water Levels and Flows section of 710 this chapter. 711
Lake Okeechobee’s water level of 10.25 ft NGVD at the beginning of WY2009 was in the 712 water shortage management band below the lowest regulation schedule. The stage continued to 713 fall, reaching 9.25 ft NGVD on June 17, 2008, and it stayed in this band until August 21, 2008, 714 when Tropical Storm Fay arrived. The stage then rose, reaching a peak of 15.16 ft NGVD on 715 September 15, 2008. Specifically, Tropical Storm Fay produced impressive amounts of areal 716 (spatially averaged) rainfall that varied between 5 to 10 inches from rain area to rain area. 717 Significant amount of rainfall from Tropical Storm Fay in the Kissimmee River Basin generated 718 runoff that increased the lake stage 3.24 ft in 15 days (11.26 ft NGVD stage on August 17 to 14.5 719 ft NGVD on August 31, 2008). For the rest of the water year the stage stayed above the water 720 shortage management band, although the stage declined and again approached the water shortage 721 management band at the end of the water year. 722
The USACE authorized level I pulse releases from the lake into the Caloosahatchee and St. 723 Lucie estuaries began on September 4, 2008 and ended on October 11, 2008. In addition, low 724 volume base flow releases were started on October 12, 2008 for S-79, at Caloosahatchee Estuary, 725 and S-80, at St. Lucie Estuary, structures and these base-flow releases ended on December 16, 726 2008. Later, a level I pulse release to Caloosahatchee Estuary began on March 28, 2009 and 727 ended on April 3, 2009. Additional level I pulse releases to Caloosahatchee Estuary were made 728 that started on April 11, 2009 and ended on April 20, 2009. One week later, the USACE 729 a730 April 28, and St. 731
ucie estuaries are shown in Table 2-12. 732
due to below normal rainfall in 733 November, December, January, February, March, and April. The lake stages continued receding 734 reaching 11.14 ft NGVD on April 30, 2009, the end of WY2009. Lake Okeechobee released a 735 total of 1,141,084 ac-ft of water in WY2009. During wet season, from June through October, a 736 total of 297,163 ac-ft of water were released from the lake. For May 2008 and November 2008 to 737 April 2009 (the dry season months for the water year), outflow from the lake was approximately 738 843,921 ac-ft. This included approximately 109,869 ac-ft of water that was discharged to the 739 EAA with 14 temporary forward pumps when gravity discharge was not attainable. Lake 740 Okeechobee received a total of 2,090,775 ac-ft of inflow. Ninety-four percent of the inflow to 741 Lake Okeechobee (1,963,272 ac-ft) was during the wet season, from June through October 2008. 742
Water levels in WAC- 1 started from close to maximum regulation schedule in May 2008 and 743 rose to higher than maximum regulation schedule in mid-June 2008. Then, the levels remained 744 close to maximum regulation schedule until August 2008. After that, water levels remained lower 745 than maximum regulation schedule for the remaining part of WY2009. 746
Water levels in WCA-2 began in May 2008 above the maximum regulation schedule. The 747 water levels remained above the maximum regulation schedule until February 2009. Then, the 748 levels fell in March 2008 to below the maximum regulation schedule and continued to fall in 749 April 2009 below the minimum regulation schedule. 750
uthorized another series of level I pulse releases from the lake to Caloosahatchee Estuary from 2009 to May 8, 2009. The three levels of pulse releases for the Caloosahatchee
L
After September 15, 2008, the lake stages continued receding
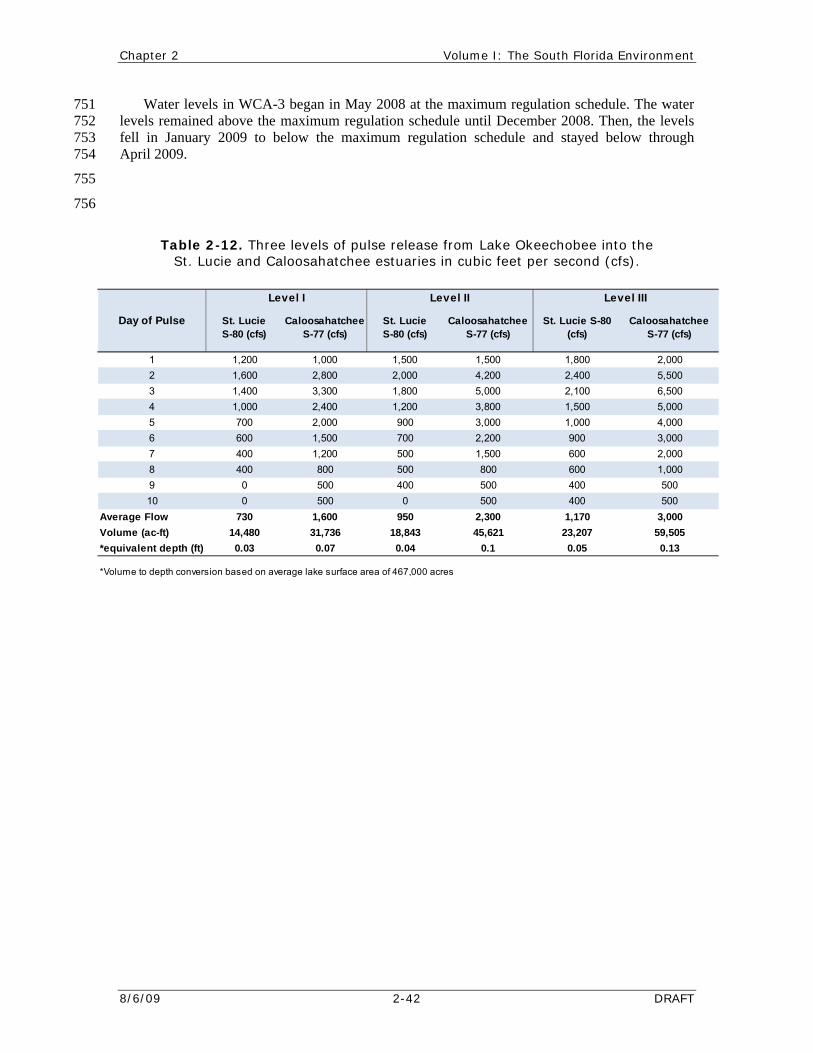
Chapter 2 Volume I: The South Florida Environment
8/6/09 2-42 DRAFT
Water levels in WCA-3 began in May 2008 at the maximum regulation schedule. The water levels remained above the maximum regulation schedule until December 2008. Then, the levels fell in January 2009 to below the maximum regulation schedule and stayed below through April 2009.
751 752 753 754
755
756
1 1,200 1,000 1,500 1,500 1,800 2,0002 1,600 2,800 2,000 4,200 2,400 5,5003 1,400 3,300 1,800 5,000 2,100 6,5004 1,000 2,400 1,200 3,800 1,500 5,0005 700 2,000 900 3,000 1,000 4,0006 600 1,500
CaloosahatcheeS-77 (cfs)
Day of Pulse
Level I Level II Level III
St. Lucie S-80 (cfs)
Caloosahatchee S-77 (cfs)
St. Lucie S-80 (cfs)
Caloosahatchee S-77 (cfs)
St. Lucie S-80 (cfs)
700 2,200 900 3,000
AveVol*eq
*Vol
7 400 1,200 500 1,500 600 2,0008 400 800 500 800 600 1,0009 0 500 400 500 400 50010 0 500 0 500 400 500
rage Flow 730 1,600 950 2,300 1,170 3,000ume (ac-ft) 14,480 31,736 18,843 45,621 23,207 59,505uivalent depth (ft) 0.03 0.07 0.04 0.1 0.05 0.13
ume to depth conversion based on average lake surface area of 467,000 acres
Table 2-12. Three levels of pulse release from Lake Okeechobee into the St. Lucie and Caloosahatchee estuaries in cubic feet per second (cfs).
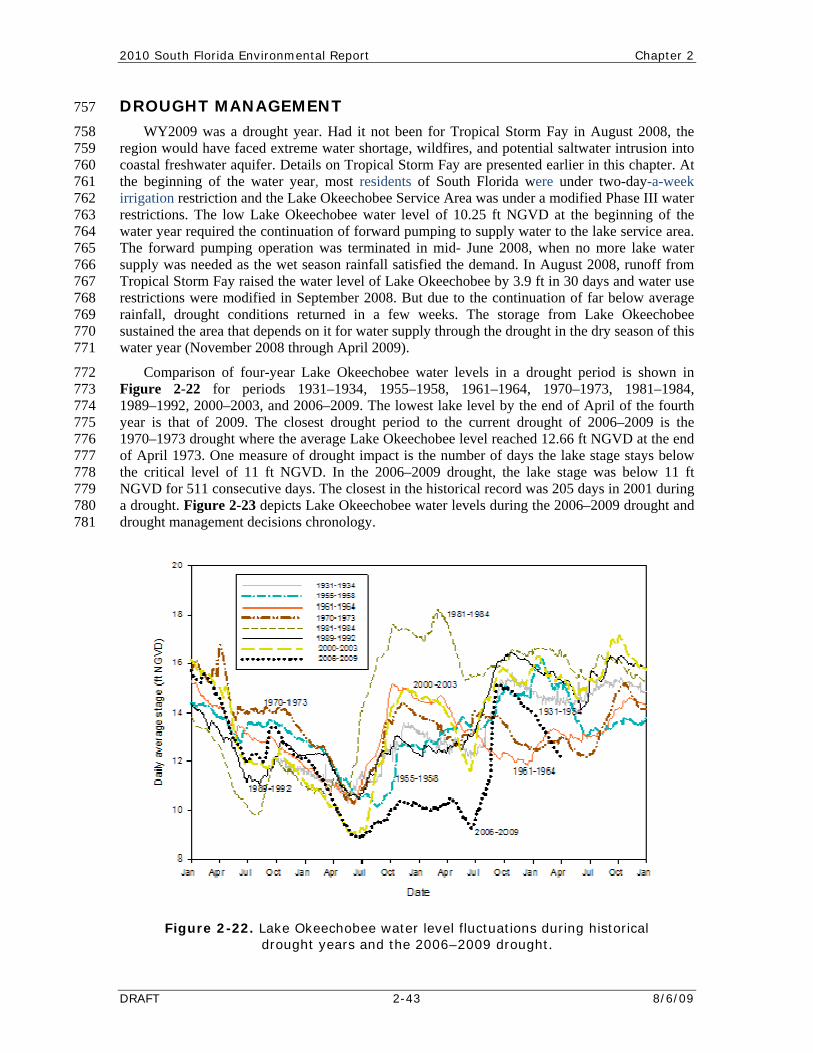
2010 South Florida Environmental Report Chapter 2
Figure 2-22. Lake Okeechobee water level fluctuations during historical drought years and the 2006–2009 drought.
DR757
758 759
water aquifer. Details on Tropical Storm Fay are presented earlier in this chapter. At 760 the beginning of the water year, most residents of South Florida were under two-day-a-week 761
nder a modified Phase III water 762 of the 763
water year required the continuation of forward pumping to supply water to the lake service area. 764 The fo765 supply w ff from 766 Tropical Storm Fay raised the water level of Lake Okeechobee by 3.9 ft in 30 days and water use 767 restrictions were modified in September 2008. But due to the continuation of far below average 768 rainfall, drought conditions returned in a few weeks. The storage from Lake Okeechobee 769 sustained the area that depends on it for water supply through the drought in the dry season of this 770 water year (November 2008 through April 2009). 771
Comparison of four-year Lake Okeechobee water levels in a drought period is shown in 772 Figure 2-22 for periods 1931–1934, 1955–1958, 1961–1964, 1970–1973, 1981–1984, 773 1989–1992, 2000–2003, and 2006–2009. The lowest lake level by the end of April of the fourth 774 year is that of 2009. The closest drought period to the current drought of 2006–2009 is the 775 1970–1973 drought where the average Lake Okeechobee level reached 12.66 ft NGVD at the end 776 of April 1973. One measure of drought impact is the number of days the lake stage stays below 777 the critical level of 11 ft NGVD. In the 2006–2009 drought, the lake stage was below 11 ft 778 NGVD for 511 consecutive days. The closest in the historical record was 205 days in 2001 during 779 a drought. Figure 2-23 depicts Lake Okeechobee water levels during the 2006–2009 drought and 780 drought management decisions chronology. 781
OUGHT MANAGEMENT
WY2009 was a drought year. Had it not been for Tropical Storm Fay in August 2008, the region would have faced extreme water shortage, wildfires, and potential saltwater intrusion into coastal fresh
irrigation restriction and the Lake Okeechobee Service Area was urestrictions. The low Lake Okeechobee water level of 10.25 ft NGVD at the beginning
rward pumping operation was terminated in mid- June 2008, when no more lake water as needed as the wet season rainfall satisfied the demand. In August 2008, runo
DRAFT 2-43 8/6/09
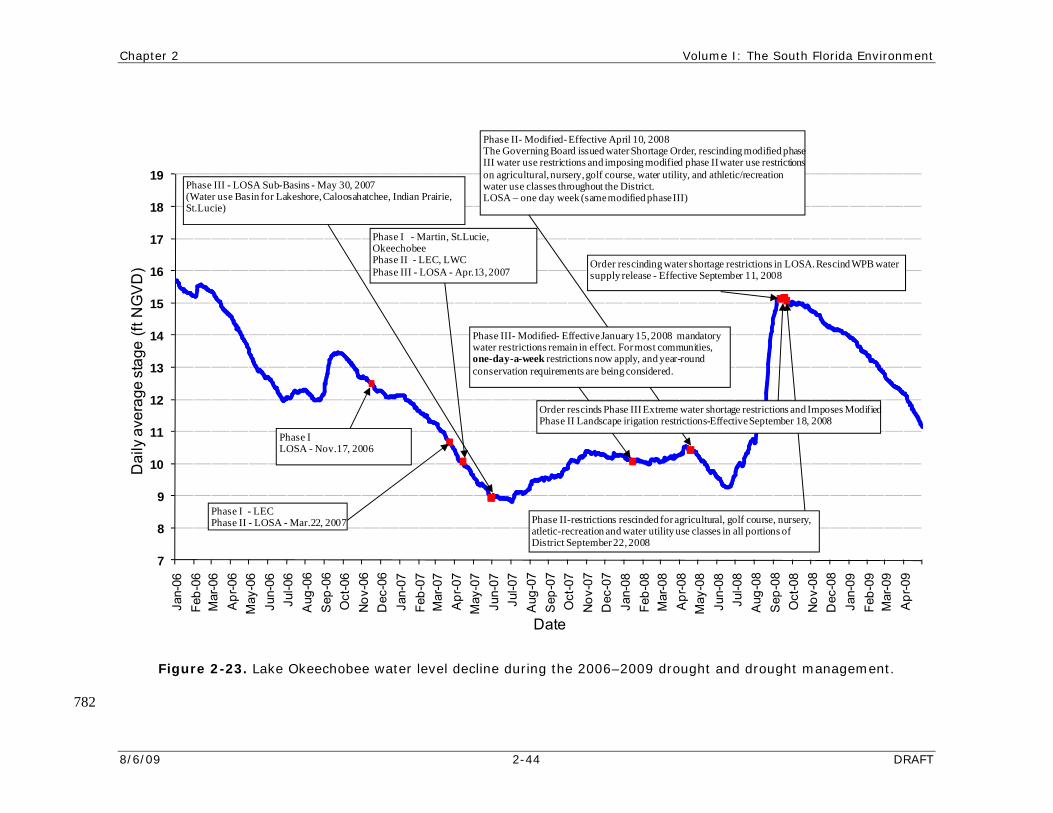
Chapter 2 Volume I: The South Florida Environment
8/6/09 2-44 DRAFT
782
Figure 2-23. Lake Okeechobee water level decline durin htg the 2006–2009 droug and drought management.
7
8
9
10
11
12
13
14
15
16
17
18
19Ja
n-06
Feb-
06M
ar-0
6A
pr-0
6M
ay-0
6Ju
n-06
Jul-0
6A
ug-0
6S
ep-0
6O
ct-0
6N
ov-0
6D
ec-0
6Ja
n-07
Feb-
07M
ar-0
7A
pr-0
7M
ay-0
7Ju
n-07
Jul-0
7A
ug-0
7
May
-08
Sep
-07
Oct
-07
Nov
-07
Dec
-07
Jan-
08Fe
b-08
Mar
-08
Apr
-08
Date
Jun-
08Ju
l-08
Aug
-08
Sep
-08
Oct
-08
Nov
-08
Dec
-08
Jan-
09Fe
b-09
Mar
-09
Apr
-09
Dai
ly a
vera
ge s
tage
(ft N
GV
D)
Phase ILOSA - Nov.17, 2006
Phase I - LECPhase II - LOSA - Mar.22, 2007
Phase I - Martin, St.Lucie, OkeechobeePhase II - LEC, LWCPhase III - LOSA - Apr.13, 2007
Phase III - LOSA Sub-Basins - May 30, 2007(Water use Basin for Lakeshore, Caloosahatchee, Indian Prairie,St.Lucie)
Phase III-water restrone-day-aconservatio
Modified- Effective January 15, 2008 manictions remain in effect. For most commun-week restrictions now apply, and year-roun requirements are being considered.
datory ities, nd
Phase IIThe GovIII wateron agricwater usLOSA –
- Modified-Effective April 10, 2008erning Board issued water Shortage Order use restrictions and imposing modified ph
ultural, nursery, golf course, water utility, ae classes throughout the District.one day week (same modified phase III)
, rescinding modified phase ase II water use restrictions nd athletic/recreation
Order rescinding water ssupply release - Effectiv
hortage restrictions in LOSA. Rescind WPB water e September 11, 2008
P ultua lassD
hase II-restrictions rescinded for agrictletic-recreation and water utility use cistrict September 22, 2008
ral, golf course, nursery, es in all portions of
Order rescinds Phase III Extreme watPhase II Landscape irigation restricti
er shortage restrictions and Imposes Modified ns-Effective September 18, 2008o
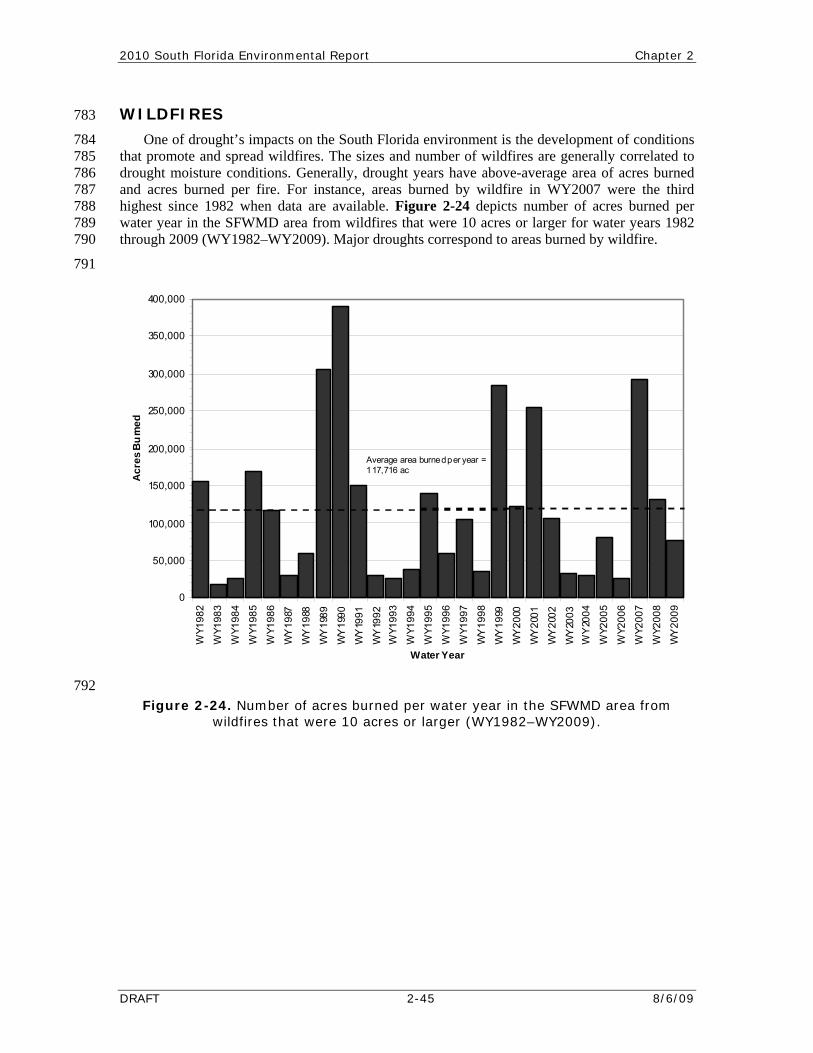
2010 South Florida Environmental Report Chapter 2
DRAFT 2-45 8/6/09
Figure 2-24. Number of acres burned per water year in the SFWMD area frowildfires that were 10 acres or larger (WY1982–WY2009).
WILDFIRES 783
One of drought’s impacts on the South Florida environment is the development of conditions 784 that promote and spread wildfires. The sizes and number of wildfires are generally correlated to 785 drought moisture conditions. Generally, drought years have above-average area of acres burned 786 and acres burned per fire. For instance, areas burned by wildfire in WY2007 were the third 787 highest since 1982 when data are available. Figure 2-24 depicts number of acres burned per 788 water year in the SFWMD area from wildfires that were 10 acres or larger for water years 1982 789 through 2009 (WY1982–WY2009). Major droughts correspond to areas burned by wildfire. 790
791
792
m
0
50,000
100,000
150,000
200,000
250,000
300,000
350,000
400,000
WY1
982
WY1
983
WY1
984
WY1
985
WY1
986
WY
1987
WY
1988
WY
1989
WY
1990
WY
1991
WY
1992
WY1
993
WY1
994
WY1
995
WY1
996
WY1
997
WY
1998
WY
1999
WY
2000
WY
2001
WY
2002
WY
2003
WY
2004
WY2
005
WY2
006
WY2
007
WY2
008
Water Year
Acr
es B
urn
ed
WY
2009
Average area burned per year =117,716 ac
Chapter 2 Volume I: The South Florida Environment
8/6/09 2-46 DRAFT
GROUNDWATER 793
794 795 796 797 798 799 800
al or 801 shallow aquifer and a deep aquifer, the Floridan aquifer. 802
In general for WY2009, groundwater levels were near or above average for the first part of 803 the year. All wells demonstrated a water level rise in response to Tropical Storm Fay in August 804 2008. Beginning in September, groundwater levels began a significant decline in all wells and 805 continued through April 2009. Wells in the Upper Kissimmee Basin (Lake Oliver) were already 806 at or near historically low levels. Representative groundwater level fluctuations are shown in 807 Appendix 2-1 of this volume for stations shown in Figure 2-4 (USGS, 2009). 808
WATER LEVELS AND FLOWS 809
In this section, water levels, regulation schedules and flows for WY2009 are discussed for the 810 major lakes and impoundments. Generally, during the dry season of WY2009, most water control 811 structures were operated under water supply mode due to rainfall deficit conditions. During the 812 wet season, flood management mode of operations was necessary for localized rain storms and 813 regional impacts from Tropical Storm Fay. Period of record daily mean stage graphs for lakes, 814 impoundments, and the ENP are shown in Appendix 2-3 of this volume. Regulation schedules for 815 lakes and impoundments were published in Abtew et al. (2007a). All water levels are expressed 816 in ft NGVD in this chapter and its related publications. Also, the current water year’s reported 817 stage statistics are compared to the previous water year and historical water level records in 818 Table 2-13. Comparison of monthly historical averages, WY2008, and WY2009 water levels are 819 shown in Appendix 2-4 of this volume. Water levels are also a measure of the amount of stored 820 water. The relationships of stage to storage for lakes and impoundments were presented in Abtew 821 et al (2007c). 822
Water levels and flows are regulated from the Upper Kissimmee Chain of Lakes to the 823 Everglades. Current water year flow statistics are compared to the previous water year and 824 historical flow records in Table 2-13. At times, temporary deviations are requested to operate the 825 sys nd 826 storage and con tions for each 827 impoundment or lake. Water control structures used are shown in Figures 2-3 through 2-6. 828
Appendix 2-5 of this volume contains tables of WY2009 monthly flow volumes for the 829 ystems discussed below while Appendix 2-6 presents comparisons of WY2008, WY2009, and 830
historical monthly average flows for each lake or impoundment. In most areas, Tropical Storm 831 Fay created significant increase in flows during an otherwise dry year. 832
The District is divided into four major water resources planning regions (Figure 2-14). Each has unique aquifers that provide water for agricultural, commercial, industrial, and domestic use. The Lower East Coast’s (LEC) principal groundwater source is the Biscayne aquifer, a surficial aquifer. The Upper East Coast’s (UEC) principal source of groundwater is the surficial aquifer. The Lower West Coast (LWC) relies on three aquifer systems for water supply, the Surficial Aquifer System (SAS), the Intermediate Aquifer System (IAS) and the Floridan Aquifer System (FAS). The Lower Tamiami aquifer is part of the SAS; the Sandstone and the Mid-Hawthorne aquifers are part of the IAS (SFWMD, 2006). The Kissimmee Basin is served by a surfici
tem outside the bounds of the regulation schedule to manage water quantity, quality, aveyance system integrity. These are noted in the following subsec
s
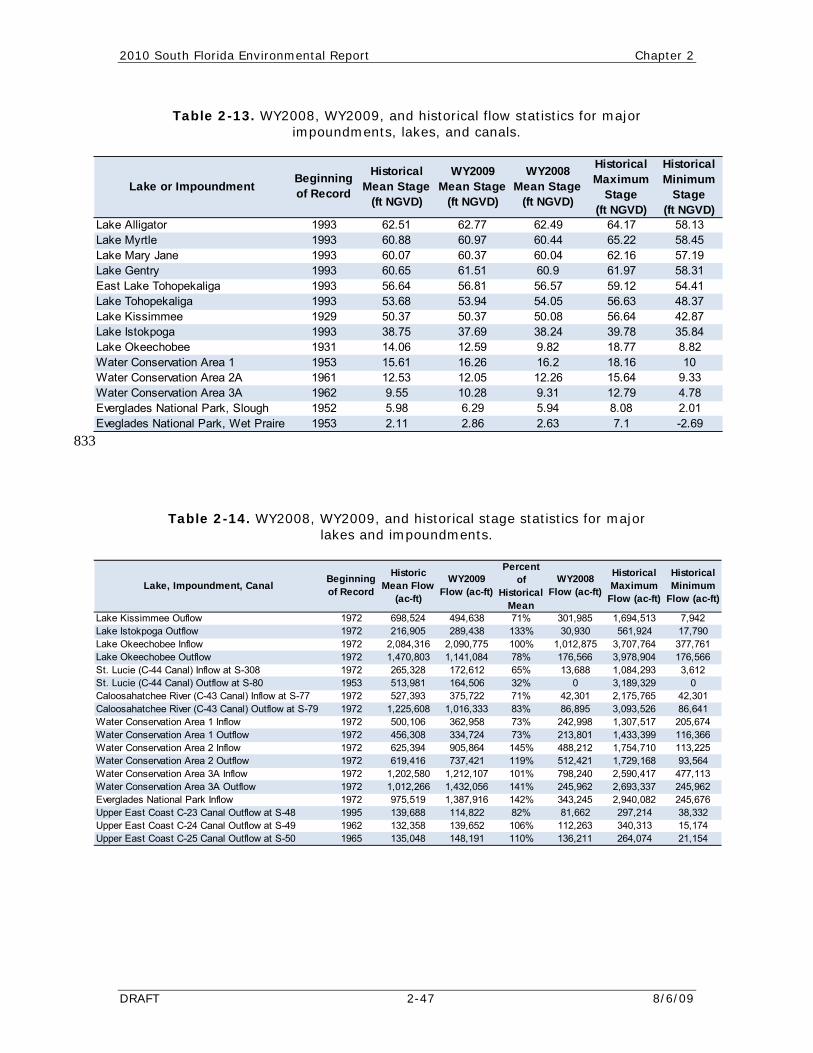
2010 South Florida Environmental Report Chapter 2
DRAFT 2-47 8/6/09
833
LakLakLakLak 61.51 60.9 61.97 58.31East LakLakLakLakLakWatWat 15.64 9.33Water Conservation Area 3A 1962 9.55 10.28 9.31 12.79 4.78Ever 5.98 6.29 5.94 8.08 2.01Eveglade
al m D)
e Alligator 1993 62.51 62.77 62.49 64.17 58.13e Myrtle 1993 60.88 60.97 60.44 65.22 58.45e Mary Jane 1993 60.07 60.37 60.04 62.16 57.19e Gentry 1993 60.65
WY2008 Mean Stage
(ft NGVD)
Historical Maximum
Stage (ft NGVD)
HistoricMinimu
Stage(ft NGV
Lake or ImpoundmentBeginning of Record
Historical Mean Stage
(ft NGVD)
WY2009 Mean Stage
(ft NGVD)
e Tohopekaliga 1993 56.64 56.81 56.57 59.12 54.41e Tohopekaliga 1993 53.68 53.94 54.05 56.63 48.37e Kissimmee 1929 50.37 50.37 50.08 56.64 42.87e Istokpoga 1993 38.75 37.69 38.24 39.78 35.84e Okeechobee 1931 14.06 12.59 9.82 18.77 8.82er Conservation Area 1 1953 15.61 16.26 16.2 18.16 10er Conservation Area 2A 1961 12.53 12.05 12.26
glades National Park, Slough 1952s National Park, Wet Praire 1953 2.11 2.86 2.63 7.1 -2.69
Table 2-14. WY2008, WY2009, and historical stage statistics for major lakes and impoundments.
Lake 2Lake 1972 216,905 289,438 133% 30,930 561,924 17,790Lake 1Lake Okee 6St. LSt. LCalo 1Calo 1Wate 4Wate 66Wate 113,225Water ConWate 3Wate 2Ever 6Uppe 81,662 297,214 38,332Upper E 112,263 340,313 15,174Upper East Coast C-25 Canal Outflow at S-50 1965 135,048 148,191 110% 136,211 264,074 21,154
al m
c-ft)
Kissimmee Ouflow 1972 698,524 494,638 71% 301,985 1,694,513 7,94 Istokpoga Outflow Okee
Historical Maximum
Flow (ac-ft)
HistoricMinimu
Flow (aLake, Impoundment, Canal Beginning
of Record
Historic Mean Flow
(ac-ft)
WY2009 Flow (ac-ft)
Percent of
Historical Mean
WY2008 Flow (ac-ft)
chobee Inflow 1972 2,084,316 2,090,775 100% 1,012,875 3,707,764 377,76chobee Outflow 1972 1,470,803 1,141,084 78% 176,566 3,978,904 176,56
ucie (C-44 Canal) Inflow at S-308 1972 265,328 172,612 65% 13,688 1,084,293 3,612ucie (C-44 Canal) Outflow at S-80 1953 513,981 164,506 32% 0 3,189,329 0osahatchee River (C-43 Canal) Inflow at S-77 1972 527,393 375,722 71% 42,301 2,175,765 42,30osahatchee River (C-43 Canal) Outflow at S-79 1972 1,225,608 1,016,333 83% 86,895 3,093,526 86,64r Conservation Area 1 Inflow 1972 500,106 362,958 73% 242,998 1,307,517 205,67r Conservation Area 1 Outflow 1972 456,308 334,724 73% 213,801 1,433,399 116,3r Conservation Area 2 Inflow 1972 625,394 905,864 145% 488,212 1,754,710
servation Area 2 Outflow 1972 619,416 737,421 119% 512,421 1,729,168 93,564r Conservation Area 3A Inflow 1972 1,202,580 1,212,107 101% 798,240 2,590,417 477,11r Conservation Area 3A Outflow 1972 1,012,266 1,432,056 141% 245,962 2,693,337 245,96
glades National Park Inflow 1972 975,519 1,387,916 142% 343,245 2,940,082 245,67r East Coast C-23 Canal Outflow at S-48 1995 139,688 114,822 82%
ast Coast C-24 Canal Outflow at S-49 1962 132,358 139,652 106%
Table 2-13. WY2008, WY2009, and historical flow statistics for major impoundments, lakes, and canals.
Chapter 2 Volume I: The South Florida Environment
8/6/09 2-48 DRAFT
Upper Kissimmee C834
The Upper Kissimmee ting of several lakes with 835 interconnecting canals and flow control structures (Figure 2-3). The major lakes are shallow with 836 depths from 6 to 13 ft (Guardo, 1992). The Upper Kissimmee Basin structures are operated 837 according to regulation schedules. The details of the water control plan for the Kissimmee River 838 are presented in the Master Water Control Manual for Kissimmee River – Lake Istokpoga 839 (USACE, 1994). Average stage, surface area, storage at average stage, WY2009 storage and 840 change in storage for the Upper Kissimmee Chain of Lakes are shown in Table 2-3. 841
In general, the stage of Lake Alligator, Lake Gentry, Lake East Tohopekaliga, Lake 842 Tohopekaliga and Lake Kissimmee were below their respective regulation schedules during 843 WY2009 except in August during Tropical Storm Fay. Although the Upper Kissimmee Basin was 844 dry for WY2009 with rainfall deficit of 10.03 inches, discharge from Lake Kissimmee was 71 845 percent due to the wetter than average wet season rainfall. 846
Alligator Lake 847
The outflows from Alligator, Center, Coon, Trout, Lizzie, and Brick lakes are controlled by 848 two structures, S-58 and S-60. The S-58 structure is located in the C-32 canal that connects lakes 849 Trout and Joel and the S-60 is located in the C-33 canal between lakes Alligator and Gentry. 850 Culvert S-58 maintains stages in Alligator Lake upstream from the structure, while the S-60 851
Lake. These lakes are regulated 852 between elevations 61.5 and 64.0 ft NGVD on a seasonally varying schedule. Daily water level 853 observations for Alligator Lake during the last 16 years show that the most significant change in 854 water levels occurred during the 2000–2001 drought (Appendix 2-3, Figure 1). The regulation 855 schedul 2-25, 856 panel a, shows the daily ation 857 schedule for Lake Alligator during WY he stages were below regulation 858 as there was a 10.03-inch annual rainfall deficit in the Upper Kissimmee rain area. Most of the 859 year, releases were made based on water supply needs. As a result of high rainfall from Tropical 860 Storm Fay and wet season rainfall, the stages temporarily rose and fell back below the regulation 861 schedule for the extent of the dry season. Monthly historical average, WY2008, and WY2009 862 water levels are shown in Appendix 2-4, Figure 1. 863
Lakes Joel, Myrtle and Preston 864
Lakes Joel, Myrtle, and Preston are regulated by structure S-57. The S-57 culvert is located in 865 the C-30 canal that connects Lakes Myrtle and Mary Jane. The lakes are regulated between 59.5 866 and 62.0 ft NGVD on a seasonally varying schedule. Figure 2-25, panel b, shows daily average 867 stage at the headwater of S-57, daily rainfall, and regulation schedule for Lake Myrtle during 868 WY2009. From May through mid-August 2008, the stages were below regulation. The high 869 rainfall from Tropical Storm Fay and following rains caused the stage to get close to the 870 regulation schedule for the rest of the water year. Daily water level observations for Lake Myrtle 871 in the last 16 years show that the most significant drop in water level occurred in 2001 during the 872 drought (Appendix 2-3, Figure 2). Monthly historical average, WY2008, and WY2009 water 873 levels are shown in Appendix 2-4, Figure 2. 874
Lakes Hart and Mary Jane 875
Lakes Hart and Mary Jane are regulated by structure S-62. The S-62 spillway is located in the 876 C-29 canal that discharges into Lake Ajay. The lakes are regulated between elevations of 59.5 877 and 61.0 ft NGVD according to a seasonally varying schedule. Figure 2-25, panel c, shows daily 878 average stage at the headwater of S-62, daily rainfall, and regulation schedule for Lake Mary Jane 879
hain of Lakes
Basin is an integrated system consis
spillway is operated to maintain the optimum stage on Alligator
e for Alligator Lake is presented in the 2007 SFER (Abtew, et al., 2007a). Figureaverage stage at the headwater of S-60, daily rainfall, and regul
2009. Through WY2009, t
2010 South Florida Environmental Report Chapter 2
DRAFT 2-49 8/6/09
during WY2009. Generally stages followed the regulation schedule except in August 2008 when 880 stag881
882 883 884 885 886
887
888 889 890 891
ation schedule for Lake Gentry during 892 ugh mid-August 2008, the stages were below regulation schedule. Due 893
opical Storm Fay, stages reached the regulation schedule and remained there 894 thro895
896 897 898 899
900
e briefly rose above the regulation schedule due to high rainfall from Tropical Fay. Releases were made during this period to bring stages back to regulation schedule whenever possible. Daily water level observations for Lake Mary Jane in the last 16 years show that the most significant drop in water level occurred in 2001 during the drought (Appendix 2-3, Figure 3). Monthly historical average, WY2008, and WY2009 water levels are shown in Appendix 2-4, Figure 3.
Lake Gentry
Lake Gentry is regulated by the S-63 structure, located in the C-34 canal at the south end of the lake. The stages downstream of S-63 are further lowered by S-63A before the canal discharges into Lake Cypress. The lake is regulated between elevations of 59.0 and 61.5 ft NGVD according to a seasonally varying schedule. Figure 2-25, panel d, shows daily average stage at the headwater of the S-63 spillway, daily rainfall, and regulWY2009. From June throto rainfall from Tr
ugh the end of 2008. Stages remained below the regulation schedule for remaining of WY2009 as dry months followed. Releases were made based on water supply needs. Daily water level observations for Lake Gentry in the last 16 years show that the most significant drop in water level occurred in 2001 during the drought (Appendix 2-3, Figure 4). Monthly historical average, WY2008, and WY2009 water levels are shown in Appendix 2-4, Figure 4.
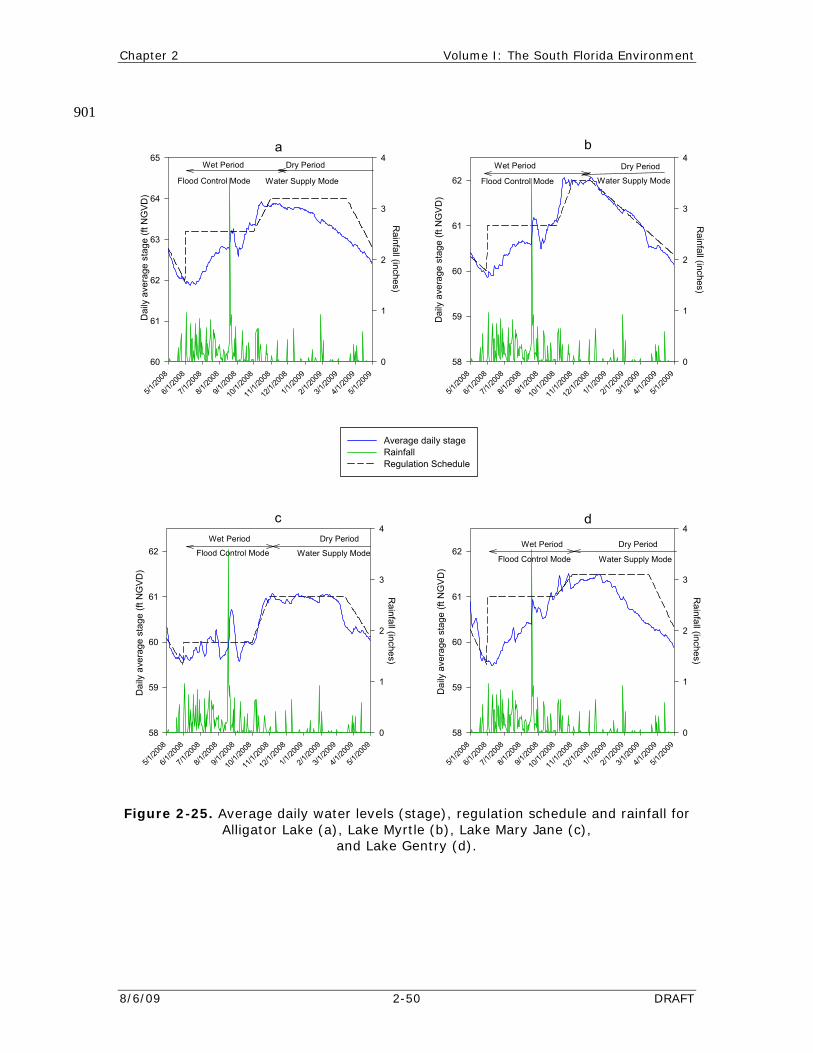
Chapter 2 Volume I: The South Florida Environment
8/6/09 2-50 DRAFT
901
b
5/1/20
08
6/1/20
08
7/1/20
08
8/1/20
08
9/1/20
08
10/1/
2008
11/1/
2008
12/1/
2008
1/1/20
09
2/1/20
09
3/1/20
09
4/1/20
09
5/1/20
09
Dai
ly a
vera
ge s
tage
(ft N
GV
D)
58
59
60
61
62
Rainfall (inches)
0
1
2
3
4 a
5/1/20
08
6/1/20
08
7/1/20
08
8/1/20
08
9/1/20
08
10/1/
2008
11/1/
2008
12/1/
2008
1/1/20
09
2/1/20
09
3/1/20
09
4/1/20
09
5/1/20
09
Dai
ly a
vera
ge s
tage
(ft N
GVD
)
60
61
62
63
64
65
Rainfall (inches)
0
1
2
3
4
Average daily stageRainfallRegulation Schedule
c
5/1/20
08
6/1/20
08
7/1/20
08
8/1/20
08
9/1/20
08
10/1/
2008
11/1/
2008
12/1/
2008
1/1/20
09
2/1/20
09
3/1/20
09
4/1/20
09
5/1/20
09
Dai
ly a
vera
ge s
tage
(ft N
GV
D)
58
59
60
61
62
Rainfall (inches)
0
1
2
3
4 d
5/1/20
08
6/1/20
08
7/1/20
08
8/1/20
08
9/1/20
08
10/1/
2008
11/1/
2008
12/1/
2008
1/1/20
09
2/1/20
09
3/1/20
09
4/1/20
09
5/1/20
09
Rainfall (inches)
0
1
2
3
4
Dai
ly a
vera
ge s
tage
(ft N
GVD
)
58
59
60
61
62
Wet Period
Flood Control Mode
Dry Period
Water Supply Mode
Wet Period
Flood Control Mode
Dry Period
Water Supply Mode
Wet Period
Flood Control Mode
Dry Period
Water Supply ModeWet Period
Flood Control Mode
Dry Period
Water Supply Mode
Figure 2-25. Average daily water levels (stage), regulation schedule and rainfall for Alligator Lake (a), Lake Myrtle (b), Lake Mary Jane (c),
and Lake Gentry (d).
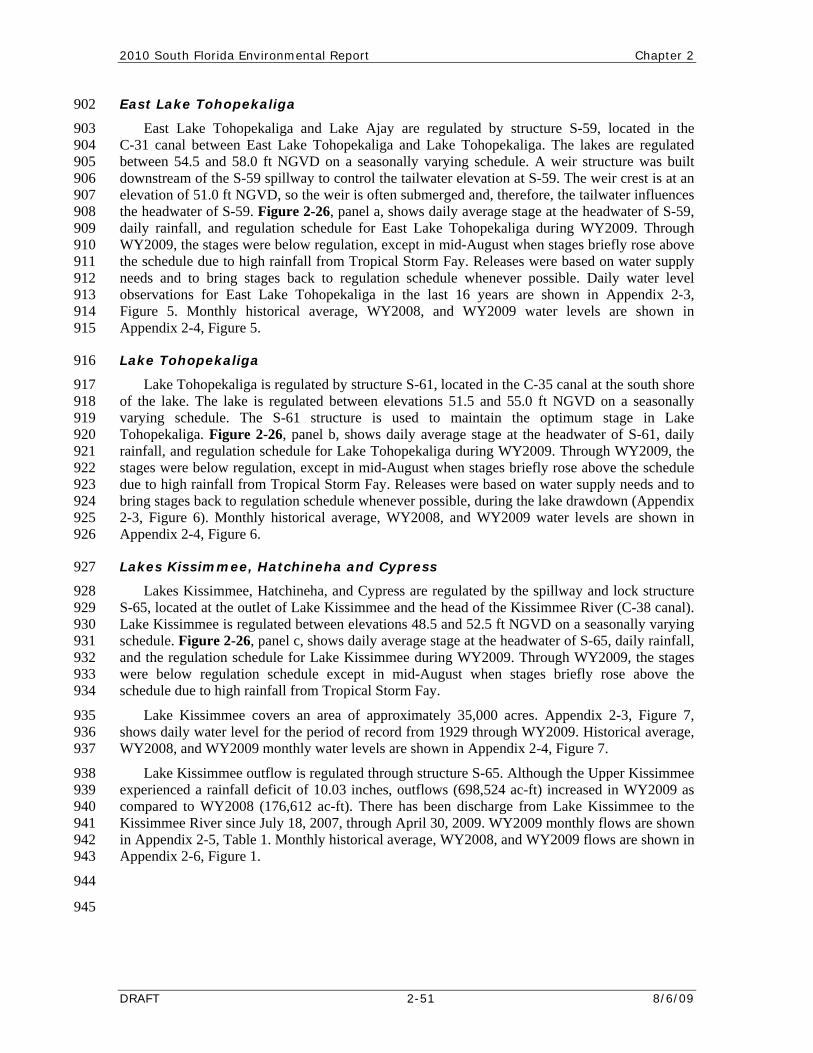
2010 South Florida Environmental Report Chapter 2
DRAFT 2-51 8/6/09
East Lake Tohopekaliga 902
East Lake Tohopekaliga and Lake Ajay are regulated by structure S-59, located in the 903 C-31 canal between East Lake Tohopekaliga and Lake Tohopekaliga. The lakes are regulated 904 between 54.5 and 58.0 ft NGVD on a seasonally varying schedule. A weir structure was built 905 downstream of the S-59 spillway to control the tailwater elevation at S-59. The weir crest is at an 906 elevation of 51.0 ft NGVD, so the weir is often submerged and, therefore, the tailwater influences 907 the headwater of S-59. Figure 2-26, panel a, shows daily average stage at the headwater of S-59, 908 daily rainfall, and regulation schedule for East Lake Tohopekaliga during WY2009. Through 909 WY2009, the stages were below regulation, except in mid-August when stages briefly rose above 910 the schedule due to high rainfall from Tropical Storm Fay. Releases were based on water supply 911 needs and to bring stages back to regulation schedule whenever possible. Daily water level 912 observations for East Lake Tohopekaliga in the last 16 years are shown in Appendix 2-3, 913 Figure 5. Monthly historical average, WY2008, and WY2009 water levels are shown in 914 Appendix 2-4, Figure 5. 915
Lake Tohopekaliga 916
Lake Tohopekaliga is regulated by structure S-61, located in the C-35 canal at the south shore 917 of the lake. The lake is regulated between elevations 51.5 and 55.0 ft NGVD on a seasonally 918 varying schedule. The S-61 structure is used to maintain the optimum stage in Lake 919 Tohopekaliga. Figure 2-26, panel b, shows daily average stage at the headwater of S-61, daily 920 rainfall, and regulation schedule for Lake Tohopekaliga during WY2009. Through WY2009, the 921 stages were below regulation, except in mid-August when stages briefly rose above the schedule 922 due to high rainfall from Tropical Storm Fay. Releases were based on water supply needs and to 923 bring stages back to regulation schedule whenever possible, during the lake drawdown (Appendix 924 2-3, Figure 6). Monthly historical average, WY2008, and WY2009 water levels are shown in 925 Appendix 2-4, Figure 6. 926
Lakes Kissimmee, Hatchineha and Cypress 927
Lakes Kissimmee, Hatchineha, and Cypress are regulated by the spillway and lock structure 928 S-65, located at the outlet of Lake Kissimmee and the head of the Kissimmee River (C-38 canal). 929 Lake Kissimmee is regulated between elevations 48.5 and 52.5 ft NGVD on a seasonally varying 930 schedule. Figure 2-26, panel c, shows daily average stage at the headwater of S-65, daily rainfall, 931 and the regulation schedule for Lake Kissimmee during WY2009. Through WY2009, the stages 932 were below regulation schedule except in mid-August when stages briefly rose above the 933 schedule due to high rainfall from Tropical Storm Fay. 934
Lake Kissimmee covers an area of approximately 35,000 acres. Appendix 2-3, Figure 7, 935 shows daily water level for the period of record from 1929 through WY2009. Historical average, 936 WY2008, and WY2009 monthly water levels are shown in Appendix 2-4, Figure 7. 937
Lake Kissimmee outflow is regulated through structure S-65. Although the Upper Kissimmee 938 experienced a rainfall deficit of 10.03 inches, outflows (698,524 ac-ft) increased in WY2009 as 939 c940 K 941 in Appendix 2-5, 942 Appendix 2-6, Figure 1. 943
944
945
ompared to WY2008 (176,612 ac-ft). There has been discharge from Lake Kissimmee to the issimmee River since July 18, 2007, through April 30, 2009. WY2009 monthly flows are shown
Table 1. Monthly historical average, WY2008, and WY2009 flows are shown in
Chapter 2 Volume I: The South Florida Environment
8/6/09 2-52 DRAFT
Figure 2-26. Average daily water levels (stage), regulation schedule and rainfall for East Lake Tohopekaliga (a), Lake Tohopekaliga (b), Lake Kissimmee
(c), and Pool S-65A (d).
946
5/1/20
08
1/200
8
/2008
1/200
8
1/200
8
/2008
1/200
8
1/20
6/ 7/1 8/ 9/ 10/1
11/
12/ 1/1 2/ 3/1 4/ 5/
08
/2009
1/200
9
/2009
1/200
9
1/200
9
Dai
ly a
vera
ge s
tage
(ft N
GV
D)
53
54
55
56
57
58
59
Rainfall (inches)
0
1
2
3
4
5/1/
6/1/
7/1/
8/1/
9/1/
10/1/
11/1/
12/1/ 1/1
/2/1
/3/1
/4/1
/5/1
/2008
2008
2008
2008
2008
2008
2008
2008
2009
2009
2009
2009
2009
Dai
ly a
vera
ge s
tage
(ft N
GV
D)
50
51
52
53
54
55
Rainfall (inches)
0
1
2
3
4
5/1/20
08
6/1/20
08
7/1/20
08
8/1/20
08
9/1/20
08
10/1/
2008
11/1/
2008
12/1/
2008
1/1/20
09
2/1/20
09
3/1/20
09
4/1/20
09
5/1/20
09
Dai
ly a
vera
ge s
tage
(ft N
GVD
)
46
48
50
52
Rainfall (inches)
0
1
2
3
4
5/1/20
08
6/1/20
08
7/1/20
08
8/1/20
08
9/1/20
08
10/1/
2008
11/1/
2008
12/1/
2008
1/1/20
09
2/1/20
09
3/1/20
09
/2009
/2009
4/1 5/1
Dai
ly a
vera
ge s
tage
(ft N
GVD
)
45
46
47
48
49
Rainfall (inches)
0
1
5
2
3
4
6
b a
c d
Optimum Stage
Wet Period
Flood Control Mode
Dry Period
Water Supply Mode Wet Period
Flood Control Mode
Dry Period
Water Supply Mode
Wet Period
Flood Control Mode Water Supply Mode
Dry Period Wet Period Dry Period
Average daily stageRainfallRegulation Schedule
2010 South Florida Environmental Report Chapter 2
DRAFT 2-53 8/6/09
The Lower Kissimmee System 947
The Lower Kissimmee System (Figure 2-3) consists of the Kissimmee River (C-38 canal) 948 and four structures (S-65A, S-65C, S-65D, and S-65E) that form four pools (A, BC, D, and E). 949 These structures are operated according to the optimum stages. The optimum stages for S-65A, 950 S-65C, S-65D, and S-65E are 46.3, 34.4, 26.8, and 21.0 ft NGVD, respectively. 951
Pool A 952
Stages in Pool A are controlled by S-65A and the pool is located downstream of S-65 953 structure. S-65A is a gated spillway and lock structure that normally maintains an optimum 954 headwater at elevation 46.3 ft NGVD. In addition to S-65A, there is a culvert structure that is 955 located through the east tieback levee at the natural channel of the Kissimmee River. The culverts 956 are two 66-inch barrels each with slide gates. During water supply periods, minimum releases are 957 made to satisfy irrigation demands and maintain navigation downstream. The culvert also 958 provides water to the oxbows of the natural river channel. Figure 2-26, panel d, shows daily 959 average stage at the headwater of S-65A, daily rainfall, and optimum stage schedule for Pool A 960 during WY2009. Generally, stages were optimum except mid-August 2008 when a sharp rise in 961 stage was observed due to Tropical Storm Fay. 962
Pool BC 963
Stages in Pool BC are controlled by the S-65C structure which is located downstream of the 964 S-65A structure. S-65C is a gated spillway and lock structure that normally maintains an 965 optimum headwater at elevation 34.0 ft NGVD. In addition to S-65C, there is a culvert structure 966 that is located through the east tieback levee at the natural channel of the Kissimmee River. 967 During WY2009, minimum and maximum headwater stages at S-65C were 32.96 and 35.31 ft 968 NGVD, respectively. 969
Pool D 970
Stages in Pool D are controlled by the S-65D structure which is located downstream of the 971 S-65C. S-65D is a gated spillway and lock structure that normally maintains an optimum 972 headwater at elevation 26.8 ft NGVD. During WY2009, headwater stages at S-65D ranged from 973 26.43 to 27.82 ft NGVD. 974
Pool E 975
Stages in Pool E are controlled by the S-65E structure which is located downstream of the 976 S-65D. S-65E is a gated spillway and lock structure that normally maintains an optimum 977 headwater at elevation 21.0 ft NGVD. During WY2009, minimum and maximum headwater 978 stages at S-65E were 20.59 and 21.40 ft NGVD. 979
Lake Istokpoga 980
Lake Istokpoga has a surface area of approximately 27,700 acres. Stages in Lake Istokpoga 981 are regulated by the S-68 spillway located at the south end of the lake. Lake Istokpoga is 982 regula s the 983 opt he 984 C-41A canal (the Slou n 985 Prairie Canal), and the C-39A canal (State ovide secondary conveyance 986 capacity for the regulation of floods in the Lake Istokpoga water management basin. The C-40 987 and C-41 canals flow into Lake Okeechobee, whereas the C-41A canal flows into the Kissimmee 988 River. The details of the Lake Istokpoga water control plan can be obtained from the Master 989 Water Control Manual for Kissimmee River – Lake Istokpoga Basin (USACE, 1994). 990
ted in accordance with a regulation schedule that varies seasonally. The S-68 maintainimum water stages in Lake Istokpoga. The S-68 discharges water from Lake Istokpoga to t
gh Canal). The C-41 canal (Harney Pond Canal), the C-40 canal (IndiaRoad 70 Canal) pr
Chapter 2 Volume I: The South Florida Environment
8/6/09 2-54 DRAFT
Figure 2-27, panel a, shows daily average stage at the headwater of S-68, daily rainfall, and 991 regu992
993 994 995
9 percent of the 996 ing the wet season. Monthly historical average, WY2008, and WY2009 flows are shown 997 ix 2-6, Figure 2. 998
lation schedule for Lake Istokpoga during WY2008. Appendix 2-3, Figure 8, shows daily water levels for the period from 1993 through WY2009. Monthly historical average, WY2008, and WY2009 water levels are shown in Appendix 2-4, Figure 8. Generally, stages were below the regulation schedule at the beginning and end of the water year (Appendix 2-5, Table 1). Outflows (289,438 ac-ft) for WY2009 were 133 percent of the historical average with 8flows durin Append
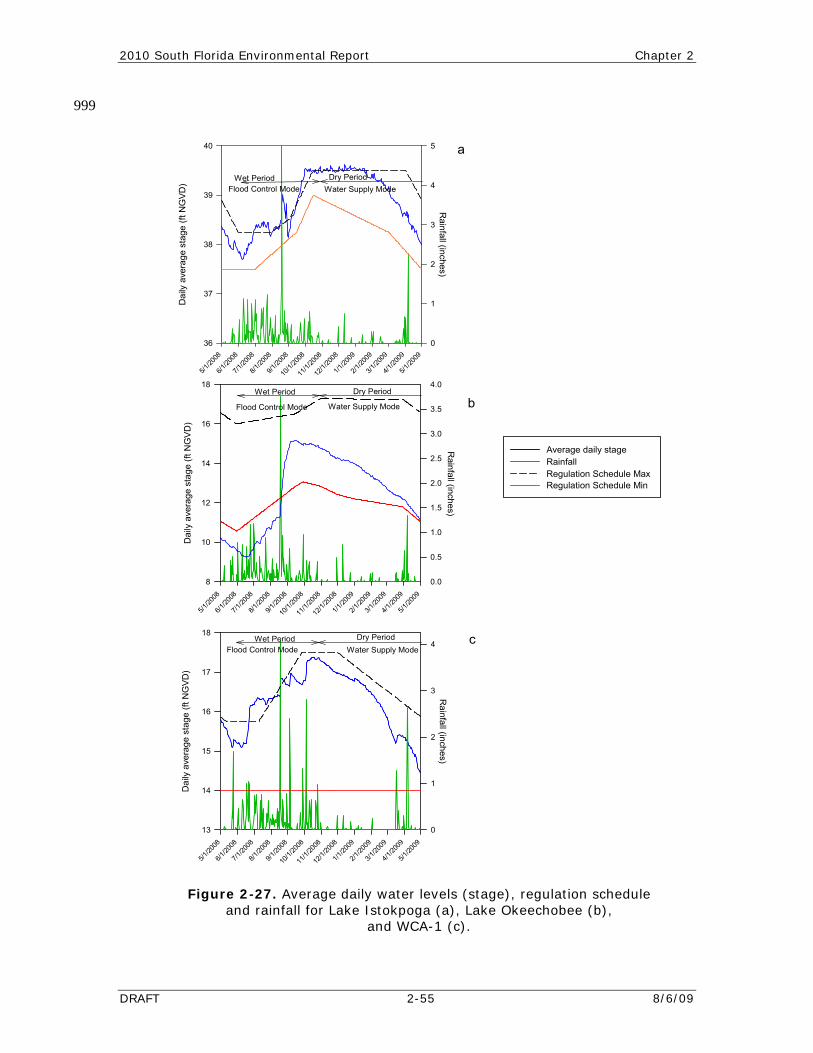
2010 South Florida Environmental Report Chapter 2
DRAFT 2-55 8/6/09
999
a
5/1/20
08
6/1/20
08
7/1/20
08
8/1/20
08
9/1/20
08
10/1/
2008
11/1/
2008
12/1/
2008
1/1/20
09
2/1/20
09
3/1/20
09
4/1/20
09
5/1/20
09
Dai
ly a
vera
ge s
tage
(ft N
GVD
)
36
37
38
39
40
Rainfall (inches)
0
1
2
3
4
5
b
5/1/20
08
6/1/20
08
7/1/20
08
8/1/20
08
9/1/20
08
10/1/
2008
11/1/
2008
12/1/
2008
1/1/20
09
2/1/20
09
3/1/20
09
4/1/20
09
5/1/20
09
Rainfall (inches)
0.0
0.5
1.0
1.5
2.0
2.5
3.0
3.5
4.0
Dai
ly a
vera
ge s
tage
(ft N
GV
D)
8
10
12
14
16
18
c
5/1/20
08
6/1/20
08
7/1/20
08
8/1/20
08
9/1/20
08
10/1/
2008
11/1/
2008
12/1/
2008
1/1/20
09
2/1/20
09
3/1/20
09
4/1/20
09
5/1/20
09
Dai
ly a
vera
ge s
tage
(ft N
GVD
)
13
14
15
16
17
18
Rainfall (inches)
0
1
2
3
4
Average daily stage Rainfall Regulation Schedule Max Regulation Schedule Min
Wet PeriodFlood Control Mode
Dry PeriodWater Supply Mode
Wet Period
Flood Control Mode
Dry Period
Water Supply Mode
Wet PeriodFlood Control Mode
Dry PeriodWater Supply Mode
Figure 2-27. Average daily water levels (stage), regulation schedule and rainfall for Lake Istokpoga (a), Lake Okeechobee (b),
and WCA-1 (c).

Chapter 2 Volume I: The South Florida Environment
Lake Okeechobee 1000
Lake Okeechobee’s water level is regulated to provide (1) flood control, (2) navigation, 1001 (3) water supply for agricultural irrigation, municipalities and industry, and the Everglades 1002 Protection Area, (4) regional groundwater control, (5) salinity control, (6) enhancement of fish 1003 and wildlife, and (7) recreation. The regulation schedule accounts for varying and often 1004 conflicting purposes. Lake Okeechobee has been regulated under a different regulation schedule 1005 in previous water years (Abtew et al., 2007a). 1006
Lake Okeechobee has an approximate surface area of 436,800 acres at the historical average 1007 stage of 14.06 ft NGVD (1931–WY2009). Lake Okeechobee’s stage at the beginning of WY2009 1008 was 10.25 ft NGVD; gravity discharge was restricted. By the end of the water year, it was 11.14 1009 ft NGVD and declining. Figure 2-27, panel b, shows daily average stage, daily rainfall, and 1010 regulation zones for Lake Okeechobee during WY2009. 1011
The average water level for Lake Okeechobee for WY2009 was 12.59 ft NGVD, which is 1012 1.47 ft lower than the historical water level. Since 2006, the lake level has been low. 1013 Below-historical daily average lake water levels were observed for 984 consecutive days from 1014 April 18, 2006 to August 28, 2008, due to the 2006–2009 drought years. Wet conditions from 1015 Tropical Storm Fay and wet season rainfall raised the lake level briefly above historical average 1016 for the period August 28, 2008 through December 25, 2008; then the lake declined back to 1017 below-average levels for the rest of WY2009. A maximum water level of 15.16 ft NGVD was 1018 reached on September 15, 2009. One important measure of the severity of Lake Okeechobee’s 1019 low water level is the number of days the stage is below the critical elevation of 11 ft NGVD. In 1020 WY2009, the lake level was below 11 ft NGVD for 511 consecutive days. Appendix 2-3, 1021 Figure 9, shows daily water levels for Lake Okeechobee for 1931–2009. Monthly historical 1022 average, WY2008, and WY2009 water levels are shown in Appendix 2-4, Figure 9. A new 1023 regulation schedule (USACE, 2008) for Lake Okeechobee was adopted on May 1, 2008, which 1024 was implemented in WY2009 (Figure 2-28). 1025
During WY2009, there was release of 172,602 ac-ft to the St. Lucie River from Lake 1026 Okeechobee at the S-308 structure and 375,722 ac-ft releases to the Caloosahatchee River at the 1027 S-77 structure. In May 2009, the lake level was falling towards restricting gravity discharge into 1028 the EAA and 14 temporary pumps were planned to be re-installed to discharge water from the 1029 lake into the major canals to the south. Temporary pumps were used (1) during the 2000–2001 1030 severe drought, (2) in April, May, and June 2007, (3) April, May, and June 2008. When water 1031 levels rise above 11.50 ft NGVD and when continued rise is predicted, the temporary pumps are 1032 removed as they become obstructive to the normal operation of the spillways. Although WY2009 1033 was a drought year, the wetter than normal wet season and Tropical Storm Fay resulted in normal 1034 inflow to the lake (2,090,775 ac-ft) and the outflow (1,471,084 ac-ft) was 78 percent of historical 1035 average. Summary of flows is presented in Table 2-13. WY2009 monthly inflows and outflows 1036 are shown in Appendix 2-5, Tables 2 and 3. Monthly historical average, WY2008, and WY2009 1037 inflows and outflows are shown in Appendix 2-6, Figures 3 and 4. 1038
8/6/09 2-56 DRAFT
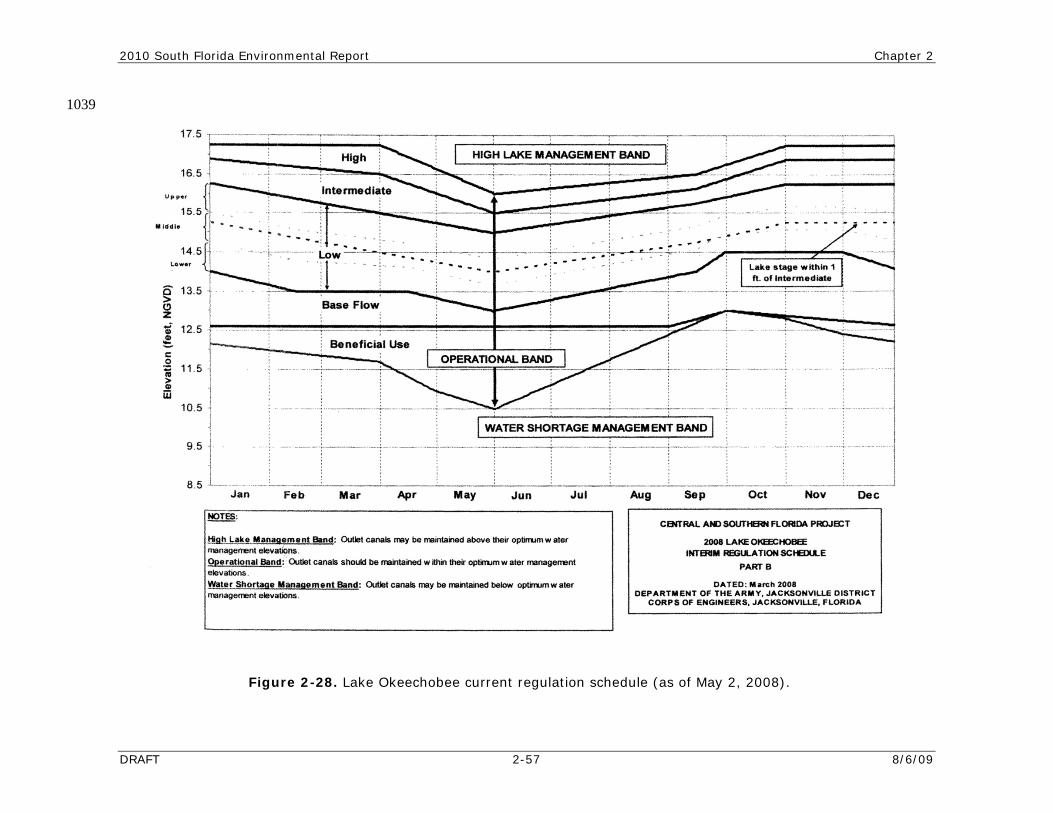
2010 South Florida Environmental Report Chapter 2
DRAFT 2-57 8/6/09
1039
Figur nt , 2e 2-28. Lake Okeechobee curre regulation schedule (as of May 2 008).
Chapter 2 Volume I: The South Florida Environment
8/6/09 2-58 DRAFT
Upper East Coast and the St. Lucie Canal and Estuary 1040
Inflows to the St. Lucie Canal are received from Lake Okeechobee by operation of S-308C, a 1041 gated spillway, the Port Mayaca lock (S-308B), and the basin watershed. Three levels of 10-day 1042 pulse releases are made to the St. Lucie Canal in high-water-level operations. The pulse releases 1043 emulate natural rain storm events within the basin. 1044
The optimum water control elevations for the St. Lucie Canal vary between 14.0 and 14.5 ft 1045 NGVD. The outflow from the St. Lucie Canal is discharged into the estuary via the 1046 S-80 structure. Since salinity is an important measure of estuary viability, freshwater flow at S-80 1047 is an important feature of water management activities. 1048
The C-23 canal discharges into the North Fork of the St. Lucie River at structure S-48. The 1049 C-24 canal discharges into the North Fork of the St. Lucie River at S-49. The C-25 c 1050 discharges into the southern part of the Indian River Lagoon at structure S-50. Structure S-80 1051 discharges water from the St. Lucie Canal into the south fork of the St. Lucie River. Although 1052 WY2009 was a drought year, due to wetter than normal wet season, flows through these canals 1053 were far higher than WY2008 flows (Table 2-13). WY2009 monthly flows for S-48, S-49, S-50, 1054 and S-80 are shown in Appendix 2-5, Table 4. Monthly historical average, WY2008, and 1055 WY2009 flows are shown in Appendix 2-6, Figures 5 to 8. WY2009 major flows and historical 1056 statistics is presented in Table 2-13. 1057
Lower West Coast 1058
Inflows to the Caloosahatchee River (C-43 canal) are runoff from the basin waters 1059 and releases from Lake Okeechobee by operation of S-77, a gated spillway and lock structure 1060 (Figure 2-5). S-77 operations use regulation procedures described in USACE (2008), the new 1061 regulation schedule for Lake Okeechobee. USACE authorized level I pulse releases from Lake 1062 Okeechobee into the Caloosahatchee Canal started on September 4, 2008, and ended on October 1063 11, 2008. In addition, low-volume base flow releases were started on October 12, 2008, and th 1064 releases ended on December 16, 2008. Later, the level I pulse release to Caloosahatchee Estu 1065 began on March 28, 2009, and ended on April 3, 2009. Additional level I pulse releases to the 1066 Caloosahatchee Estuary were started on April 11, 2009, and ended on April 20, 2009. One week 1067 later, the USACE authorized another level I pulse release series from the lake to the 1068 Caloosahatchee Estuary from April 28, 2009 through May 8, 2009. WY2009 discharge from Lake 1069 Okeechobee through S-77 was 375,722 ac-ft (71 percent of average). WY2009 major flows and 1070 historical statistics are presented in Table 2-13. 1071
Downstream of S-77 is S-78, a gated spillway that also receives runoff from the east 1072 Caloosahatchee Watershed, its local watershed. The optimum water control elevation for this 1073 portion of the Caloosahatchee Canal (upstream of S-78 and downstream of S-77) is between 1 1074 and 11.5 ft NGVD. The outflow from the Caloosahatchee Canal (downstream of S-78) is 1075 discharged into the estuary via S-79, a gated spillway and lock operated by the USACE. 1076 operations of S-79 include the stormwater runoff from west Caloosahatchee and tidal 1077 Caloosahatchee watersheds. The optimum water control elevations near S-79 range between 1078 and 3.2 ft NGVD. Because salinity is an important measure of estuary viability, freshwater flow 1079 at S-79 is an important feature of water management activities. 1080
The WY2009 discharge through S-79 to the coast, 1,225,608 ac-ft, was 83 percent of the 1081 historical average (1972–2009). WY2009 monthly flows for S-77 and S-79 are shown in 1082 Appendix 2-5, Table 5. Monthly historical average, WY2008, and WY2009 outflows at S-79 are 1083 shown in Appendix 2-6, Figure 9. 1084
1085
anal
hed
eseary
0.6
The
2.8
2010 South Florida Environmental Report Chapter 2
DRAFT 2-59 8/6/09
Everglades Agricultural Area 1086
1087 1088 1089
e to these canals are from structures S-351, 1090 S-31091
1092 1093 1094
e dry season and drier-than-normal wet 1095 sea1096
1097 1098 1099 1100 1101 1102 1103 1104
on Area 1105
1106 1107
1108
1109 1110 1111 1112 1113 1114 1115 1116
low stages at the beginning of the wet season 1117 (Ab1118
1119
1120 1121 1122 1123 1124 1125
, B, and C structures are used to 1126 rele1127
1128 1129
wer than that calculated from site 1-8C. Figure 2-27, panel c, 1130 depicts the WY2009 daily average water level, daily rainfall, and regulation schedule level for 1131 WCA-1. Daily average historical water levels are shown in Appendix 2-3, Figure 10, for the 1132
There are four major canals that pass through the EAA: Hillsboro Canal, North New River Canal, West Palm Beach Canal, and Miami Canal. Flows from Lake Okeechobee and runoff from the EAA are discharged to the STAs via these four canals to relieve flooding from the local drainage area. The inflows from Lake Okeechobe
52, and S-354. These structures are gated spillways with a maximum tailwater elevation that does not exceed 12.0 ft NGVD for Lake Okeechobee operation. The optimum water control elevations for S-351 and S-354 range between 11.5 and 12.0 ft NGVD. During WY2009, elevations ranged from 8.2 to 11.99 ft NGVD. S-352’s stage reached a maximum of 13.5 ft NGVD and a minimum of 8.84 ft NGVD. During th
sons, water supply for agricultural irrigation is provided by these four primary canals, mainly through gravity release from Lake Okeechobee. At times, water is also supplied to the EAA from the WCAs. For WY2009, a total of 109,869 ac-ft of water was delivered by the temporary pumps during critical water shortage periods where Lake Okeechobee water level was too low for gravity discharge. Farmers utilize a set of secondary and tertiary farm canals to distribute water from several gated culverts and pumps to their fields. During wet conditions the outflows from the four canals are mainly farm runoff and are discharged to the Stormwater Treatment Areas (STAs) through pump structures S-5A, S-319, S-6, G-370, and G-372. Outflows from STAs are inflows into the WCAs.
Everglades Protecti
During WY2009, the District did not request any temporary deviation to the regulation schedules of the Water Conservation Areas from the USACE.
Water Conservation Area 1
The primary objectives of the WCAs are to provide (1) flood control, (2) water supply for agricultural irrigation, municipalities, industry, and the ENP, (3) regional groundwater control and prevention of saltwater intrusion, (4) enhancement of fish and wildlife, and (5) recreation. A secondary objective is the maintenance of marsh vegetation in the WCAs, which is expected to provide a dampening effect on hurricane-induced wind tides. Water Conservation Area (WCA) 1 covers approximately 141,440 acres with a daily average water level of 15.61 ft NGVD (1960–2009). WCA-1 is regulated by outflow structures S-10A, S-10C, S-10D, and S-10E; the regulation schedule for WCA-1 is provided by the USACE (1996). The regulation schedule varies from high stages in the late fall and winter to
tew et al., 2007a). The seasonal range allows runoff storage during the wet season and water supply during the dry season.
The main inflows into WCA-1 are from Stormwater Treatment Area (STA) 1 West through the G-251 and G-310 pump stations and from STA-1 East (STA-1E) via pump station S-362. There are three diversion structures which can flow in both directions (G-300, G-301, and G-338). The S-10 structures outflow into WCA-2A. The two diversion structures (G-300 and G-301) are also used to discharge water from WCA-1 to the north (the STA-1 inflow basin). Water can also be discharged through S-39 to the east into the Hillsboro Canal. Four stage gauges (1-8C, 1-7, 1-8T, and 1-9) are used for stage monitoring. G-94A
ase water supply to the east urban area. Daily water levels were compiled from the four stage gauges based on their regulation schedule uses. Site 1-8C was used from January 1 to June 30, while the remaining sites 1-7, 1-8T, and 1-9 were used to calculate the average water level for the year, but only if the average was lo
Chapter 2 Volume I: The South Florida Environment
8/6/09 2-60 DRAFT
period from 1960–2009. Monthly historishown in Appendix 2-4, Figure 10. Water
cal average, WY2008, and WY2009 water levels are 1133 levels in WCA-1 generally were close to the maximum 1134
reg1135 1136
1137 1138 1139 1140 1141 1142 1143 1144 1145
1146 1147 1148 1149 1150
-5, Tables 6 and 7. Monthly historical average, WY2008, and WY2009 1151 inflows and outflows are shown in Appendix 2-6, Figures 10 and 11. WY2009 major flows and 1152
le 2-13. 1153
1154
WCA-2 is located south of WCA-1. An interior levee across the southern portion of the area 1155 WCA-2B, reducing water losses due to seepage into the 1156
extr1157 1158 1159 1160 1161 1162 1163
1164 1165 1166
2A. Water levels in WCA-2 began one foot above the maximum 1167 reg1168
1169 1170 1171
1172 1173 1174 1175 1176 1177
1178 1179 1180
ulation schedule for the first half of the water year and lower in the second half without reaching the minimum regulation schedule.
Inflow and outflow structures throughout the WCAs are operated based on regulation schedules. Historical flows through each structure have varying lengths of periods of record because of new structures coming online or because of existing structures that no longer contribute to the inflow and outflow of a system. The structures related to the STAs are relatively recent additions. WCA-1 is regulated between 14 and 17.50 ft NGVD. WY2009 inflows into WCA-1 (336,293 ac-ft ) were 67 percent of the historical average. Fifty-six percent of the inflow in WY2009 was from STA-1W through pump station G-310 and G-251; and 44 percent of the inflow was from STA-1E through pump station S-362. There was no inflow through structures G-301 and only 14 ac-ft through G-300.
WY2009 outflows from WCA-1 (334,724 ac-ft) were 73 percent of the historical average. Outflows from WCA-1 were mainly into WCA-2 to the south through the S-10 structures (76 percent) and to the north through structures G-300 and G-301 (8 percent). Release through the Hillsboro Canal through the S-39 structure (8 percent) and discharge to the Lake Worth Drainage District through structures G-94A and B was 8 percent. WY2009 monthly inflows and outflows are shown in Appendix 2
historical statistics are presented in Tab
Water Conservation Area 2
subdivides it into WCA-2A and emely pervious aquifer that underlies WCA-2B and precludes the need to raise existing levees
to the grade necessary to provide protection against wind tides and wave run-up. The regulation schedule for WCA-2A is provided in USACE (1996). A regulation schedule is not used for WCA-2B because of high seepage rates. Releases to WCA-2B from S-144, S-145, and S-146 are terminated when the indicator stage gauge 99 in WCA-2B exceeds 11.0 ft NGVD. Discharges from WCA-2B are made from spillway structure S-141 to North New River Canal when the pool elevation in WCA-2B exceeds 11.0 ft NGVD.
WCA-2A and WCA-2B combined have a total area of 133,400 acres, with 80 percent of the area in WCA-2A. Appendix 2-3, Figure 11, shows the daily water level for the period from 1961–2009. Figure 2-29, panel a, depicts WY2009 daily average water level, daily rainfall, and regulation schedule for WCA-
ulation schedule in May 2008 and stayed above the maximum schedule until the end of February 2009. Due to the drought conditions, the level went down below the minimum regulation schedule of 10.5 NGVD in April 2009. Monthly historical average, WY2008, and WY2009 water levels are shown in Appendix 2-4, Figure 11.
WY2009 inflows into WCA-2 (905,864 ac-ft) were 145 percent of the historical average. The major inflows (40 percent) to WCA-2A were STA-3/4 discharges through the S-7 pump station and STA-2 discharges through pump station G-335 (32 percent). WCA-1 discharges through the S-10A, C, and D structures were inflows to WCA-2A (28 percent). Inflows through structure G-339, a bypass structure at STA-2, were insignificant. There was no flow from WCA-3A to WCA-2 through structure S-142.
WY2009 outflows from WCA-2 (737,421 ac-ft) were 119 percent of the historical average. Outflows from WCA-2 were primarily into WCA-3A through structures S-11A, B, and C (85 percent) and discharge to canals 13 and 14 through structure S-38 (8 percent). Discharge
2010 South Florida Environmental Report Chapter 2
DRAFT 2-61 8/6/09
through the North New River Canal through structure S-34 was 4 percent and backflow through the S-7 structure into the EAA was 3 percent. There was no discharge to WCA-3A through S-142. Due to the drought, there was backflow for water supply to the EAA. WY2009 monthly inflows and outflows are shown in Append
1181 1182 1183
ix 2-5, Tables 8 and 9. Monthly historical average, 1184 WY1185
1186
1187
1188 1189 1190 1191
age rates. Indicator gauge 3B-2 is used for WCA-3B. 1192 Flow1193
1194
1195 1196 1197 1198 1199
ppendix 2-3, Figure 12, shows the daily water 1200 level for the period from 1961–2009. Monthly historical average, WY2008, and WY2009 water 1201
igure 12. 1202
1203 1204 1205 1206 1207 1208 1209 1210
6,182 ac-ft) were 154 percent of the historical 1211 ave1212
1213 1214 1215 1216 1217 1218
09 inflows and outflows are shown 1219 in A1220
1221
1222
1223 ntained as the Everglades National Park, a federal entity within 1224
the 1225 1226 1227
2008, and WY2009 inflows and outflows are shown in Appendix 2-6, Figures 12 and 13, respectively. WY2009 major flows and historical statistics are presented in Table 2-13.
Water Conservation Area 3
WCA-3 is located south and southwest of WCA-2A. Two interior levees across the southeastern portion of the area subdivide it into WCA-3A and WCA-3B. These levees reduce water losses due to seepage into the extremely pervious aquifer that underlies WCA-3B. The regulation schedule for WCA-3A is provided in USACE (1996). A regulation schedule is not used for WCA-3B because of high seep
releases into WCA-3B are from S-142, while releases from WCA-3B are through S-31 or S-337. Discharges from WCA-3B are rarely made from culvert L-29-1 for water supply purposes.
WCA-3A and WCA-3B combined have a total area of 585,560 acres, with 83 percent of the area in WCA-3A. Figure 2-29, panel b, depicts WY2009 daily average water level, daily rainfall, and regulation schedule for WCA-3A. Water levels in WCA-3 were below the maximum regulation schedule in May and June 2008. From July to December, 2008, water levels were higher than the maximum regulation schedule. Due to the drought in the dry season, water levels consistently fell to the end of the water year. A
levels are shown in Appendix 2-4, F
WY2009 inflows into WCA-3A (1,212,107 ac-ft) were average. The major inflows to WCA-3A in WY2009 were through S-11A, B, and C (52 percent) from WCA-2, and from STA-3/4 through structures S-8 and S-150 (18 percent). Discharges from the east through structure S-9 and S-9A accounted for 12 percent of the total inflow. The S-140 and S-190 structures to the northwest contributed 11 percent and 7 percent of the inflow to WCA-3A, respectively. There are possible inflows to WCA-3A through the L-4 borrow canal breach into the L-3 extension canal that is currently not gauged. The breach has a bottom width of 150 ft, at an elevation of 3 ft NGVD (SFWMD, 2002).
WY20009 outflows from WCA-3A (1,55rage. Outflows from WCA-3A into the ENP were through structures S-12A, B, C, D, and E
(52 percent) this water year. S-333 discharged 14 percent, with potential directions of flow in the ENP to the south and east, Shark River Slough, and Taylor Creek. Outflow from WCA-3A through S-151 was 9 percent. Outflow through S-140 was 9 percent. S-343 discharge was 6 percent and S-337 discharge was 4 percent. There was no discharge into the North New River Canal through structure S-142 and remaining minor discharges were through S-31 and S-344. WY2009 monthly inflows and outflows are shown in Appendix 2-5, Tables 10 and 11, respectively. Monthly historical average, WY2008, and WY20
ppendix 2-6, Figures 14 and 15. WY2009 major flows and historical statistics is presented in Table 2-13.
Everglades National Park
Everglades National Park is located south of WCA-3A and 3B (Figure 2-1). The land is a federal property operated and mai
jurisdiction of the U.S. Department of the Interior, National Park Service. The original operational criteria are presented in (USACE, 1996). The criteria were subsequently modified and presented in the Interim Operational Plan (IOP) for Protection of the Cape Sable Seaside Sparrow
Chapter 2 Volume I: The South Florida Environment
8/6/09 2-62 DRAFT
(USACE, 2002). The plan will be superseded when all the elements of the Modified Water Deliveries Project are built and capable of operating, and when the Record of Decision for the Combined Structural Operational Plan is approved (USACE, 2002).
The 1972 federal requirement for minimum monthly water deliveries to Shark River Slough was superseded in 1985 by an operational plan referred to as the Rain-Driven Plan. This plan addresses the overall objectives of providing water deliveries that vary in resp
1228 1229 1230
1231 1232
onse to 1233 the basin (USACE, 1996). The operation plans for S-333 and 1234 USACE (2002). 1235
1236 1237 1238 1239 1240
1241 WC1242
1243 1244 1245 1246 1247 1248 1249
1250 1251 1252 1253 1254 1255 1256 1257
rts water from S-18C via overland flow to the 1258 pan1259
1260
1261 1262 1263 1264 1265 1266 1267 1268
34 for WY2009. Monthly historical average, WY2008, and WY2009 water levels for 1269 ndix 2-4, Figures 13 and 14. 1270
1271 1272 1273 1274 1275
hydrometeorological conditions in S-12A, B, C, and D are presented in
The ENP water delivery goals are connected to water levels upstream and downstream, and rainfall amounts in WCA-3A. Flows to the ENP are made via S-333 and S-12A, B, C, and D. The operational plan for these structures is the Rain-Driven Plan that integrates the target flows required to be released from these structures. Because of complexities involved with the IOP, regulation schedule is not developed or used for the ENP.
The Rain-Driven Plan is used to operate water control structures that discharge from A-3A to the ENP. The objective of the plan is to restore a more natural hydroperiod and
hydropattern in northeast Shark River Slough and the ENP. A mathematical model is being used to define flow targets for the operation of five water control structures (S-333 and S-12A, B, C, and D) along the southern boundary of WCA-3A, subject to upstream hydrologic conditions and downstream hydrologic and ecologic constraints. Pathak and Palermo (2006) detail the mathematical model used to compute target weekly flow volumes to be released from WCA-3A. The model uses weekly rainfall data from 10 rain gauges, weekly evaporation data from three pan evaporation gauges, and weekly average stage data from three water level gauges.
Water deliveries to Taylor Slough are made via several seepage reservoirs and structures including the S-332B, C, and D pump stations. These pump stations are components of the C-111 Canal Project. Their operation plans are presented in USACE (2002). Water deliveries to the eastern panhandle are made via the C-111 canal. The S-18C structure maintains a desirable freshwater head against saltwater intrusion through the C-111 canal to act as a control point to the eastern panhandle of the ENP. The optimum water stages range between 2.0 and 2.6 ft NGVD upstream of S-18C while making minimum water discharges. Additionally, S-197 maintains optimum water control stages in C-111 canal and prevents saltwater intrusion during high tides. S-197 is closed most of the time and dive
handle. S-197 releases flows during major flood events according to established guidelines in the IOP.
The ENP is approximately 1,376,000 acres in size. Water level monitoring at sites P-33 and P-34 has been used in previous consolidated reports as representative of slough and wet prairie, respectively (Sklar et al., 2003). Station elevations for P-33 and P-34 are 5.06 and 2.09 ft NGVD (Sklar et al., 2000). Historical water level data for sites P-33 (1952–2009) and P-34 (1953–2009) was obtained from the District’s hydrometeorologic database, DBHYDRO, and from the ENP’s database. Figure 2-29, panel c, depicts daily average water level and rainfall at P-33 for WY2009. Daily average historical water levels for P-33 and P-34 are shown in Appendix 2-3, Figures 13 and 14, respectively. Figure 2-29, panel d, depicts daily average water level and rainfall at P-P-33 and P-34 are shown in Appe
WY2009 inflow into the ENP (1,392,932 ac-ft is 143 percent of the historical average. Inflow into the ENP is mainly through structures S-12A, B, C, D, and E, S-18C, S-332B, S-332C, S-332D, S-174, S-175, and S-333. The major inflow (64 percent) was through the S-12 structures. S-18C discharge into the ENP was 14 percent. The S-332D structure contributed 11 percent. S-332B contributed 7 percent and S-332C contributed 4 percent of the inflows. These
2010 South Florida Environmental Report Chapter 2
DRAFT 2-63 8/6/09
structures are operated by the District for the USACE, in accordance with the Rain-Driven Plan and the regulation schedule of WCA-3A. This plan determines discharges through the S-333 and through S-12 structures a week in advance using a computer prog
1276 1277
ram. Weekly reports on the 1278 WC1279 A-3A Rainfall-Based Management Plan are available on the District’s web site at www.sfwmd.gov/environmentalmonitoring. Structural and operational modifications were also incorporated into the delivery plan based on the IOP. Inflows through S-175. WY2009 monthly inflows are shown in Appendix 2-5, Table 12. Monthly historical average, WY2008, and WY2009 inflows are shown in Appendix 2-6, Figure 16. WY2009 major flows and historical statistics is presented in Table 2-13.
1280 1281 1282 1283 1284
1285
1286
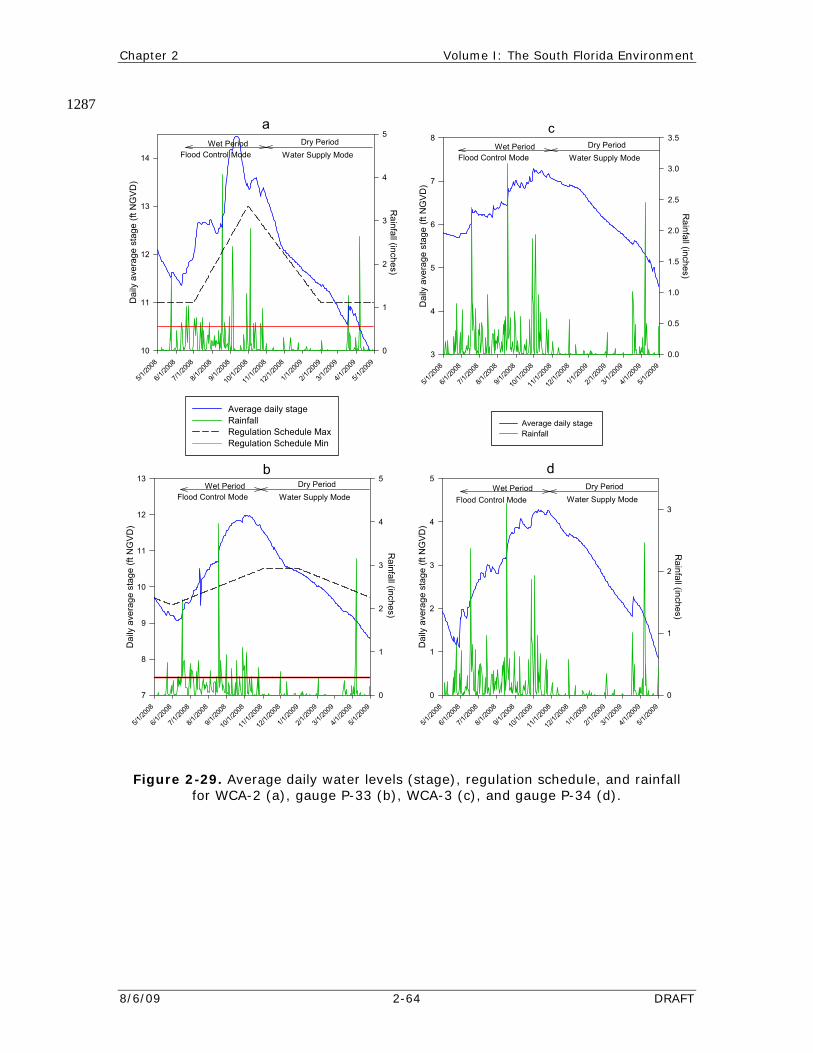
Chapter 2 Volume I: The South Florida Environment
8/6/09 2-64 DRAFT
Figure 2-29. Average daily water levels (stage), regulation schedule, and rainfall for WCA-2 (a), gauge P-33 (b), WCA-3 (c), and gauge P-34 (d).
1287 a
5/1/20
08
6/1/20
08
7/1/20
08
8/1/20
08
9/1/20
08
10/1/
2008
11/1/
2008
12/1/
2008
1/1/20
09
2/1/20
09
3/1/20
09
4/1/20
09
5/1/20
09
Rainfall (inches)
0
1
2
3
4
5D
aily
ave
rage
sta
ge (f
t NG
VD
)
10
11
12
13
14
Wet PeriodFlood Control Mode
Dry PeriodWater Supply Mode
b
5/1/20
08
6/1/20
08
7/1/20
08
8/1/20
08
9/1/20
08
10/1/
2008
11/1/
2008
12/1/
2008
1/1/20
09
2/1/20
09
3/1/20
09
4/1/20
09
5/1/20
09
Dai
ly a
vera
ge s
tage
(ft N
GV
D)
7
8
9
10
11
12
13
Rainfall (inches)
0
1
2
3
4
5
Average daily stage RainfallRegulation Schedule MaxRegulation Schedule MinCol 1 vs MinRegSched
Wet PeriodFlood Control Mode
Dry PeriodWater Supply Mode
c
5/1/20
08
6/1/20
08
7/1/20
08
8/1/20
08
9/1/20
08
10/1/
2008
11/1/
2008
12/1/
2008
1/1/20
09
2/1/20
09
3/1/20
09
4/1/20
09
5/1/20
09
Dai
ly a
vera
ge s
tage
(ft N
GV
D)
3
4
5
6
7
8R
ainfall (inches)
0.0
0.5
1.0
1.5
2.0
2.5
3.0
3.5
Average daily stage Rainfall
d
5/1/20
08
6/1/20
08
7/1/20
08
8/1/20
08
9/1/20
08
10/1/
2008
11/1/
2008
12/1/
2008
1/1/20
09
2/1/20
09
3/1/20
09
4/1/20
09
5/1/20
09
Dai
ly a
vera
ge s
tage
(ft N
GV
D)
0
1
2
3
4
5
Rainfall (inches)
0
1
2
3
Wet PeriodFlood Control Mode
Dry PeriodWater Supply Mode
Wet PeriodFlood Control Mode
Dry PeriodWater Supply Mode
Average daily stageRainfall Regulation Schedule MaxRegulation Schedule Min
2010 South Florida Environmental Report Chapter 2
DRAFT 2-65 8/6/09
CONCLUSIONS 1288
The hydrology of South Florida for WY2009 can be summarized as a meteorological and a 1289 hydrologic severe drought with a temporary wet condition in the summer. Meteorologically, the 1290 water year’s rainfall was far below average in all of the SFWMD’s rainfall areas except the 1291 Lower Kissimmee which received average rainfall. There was a distinct difference between dry 1292 season (November through May) and wet season (June through October) rainfall. Generally, the 1293 wet season was wetter than normal in all rain areas except Palm Beach, Broward, and the ENP. 1294 Tropical Storm Fay significantly contributed in making the wet season wetter while the months of 1295 September and October from the wet season were drier than average. The dry season was 1296 extremely dry with drought return periods of 100-yr or more in most rain areas. Palm Beach 1297 County had the most rainfall deficit (14.24 inches) followed by the ENP (12.62 inches). Broward 1298 rain area (11.26 inches), West EAA (10.51 inches), Upper Kissimmee (10.03 inches), 1299 Miami-Dade (9.57 inches), East EAA (9.07 inches), Martin/St. Lucie (9.06 inches), Lake 1300 Okeechobee (8.13 inches), WCA-3 (7.08 inches), East Caloosahatchee (4.68 inches), Big Cypress 1301 Basin (4.67 inches), WCA-1,2 (4.56 inches), and Southwest Coast (3.22 inches) had rainfall 1302 deficits. The spatial average District WY2009 rainfall deficit of 7.51 inches compares to WY2008 1303 rainfall deficit of 3.8 inches and 12-inch deficit of WY2007. 1304
At the beginning of WY2009, the main storage in the system, Lake Okeechobee, continued to 1305 show record low water and storage levels. Gravity discharge from the lake was restricted due to 1306 persistent low water levels. Since the watersheds of the lake were in continual drought, there was 1307 not enough surface water inflow to bring up the lake level at the beginning of the water year. The 1308 low lake level restricted gravity discharge, so 14 temporary pumps were installed in the previous 1309 water year to discharge water from the lake into the major canals to the south. In WY2009, 1310 109,869 ac-ft of water was pumped out of Lake Okeechobee in May and first part of June, 2008. 1311 Forward pumping was terminated as the wet season rainfall made it unnecessary. Wet season 1312 rainfall continued through August and a major increase in rainfall resulted from Tropical Storm 1313 Fay. Details on Tropical Storm Fay are presented as a section in this chapter. Rainfall from 1314 Tropical Storm Fay was as high as 15.47 inches at a site. Runoff from Tropical Storm Fay and 1315 other rains in June, July, August, and early September raised the water level in Lake Okeechobee 1316 by 4 ft ending drought conditions temporarily. Rainfall patterns changed to below-average 1317 conditions in September 2008 and continued through the rest of the water year. Drought 1318 conditions returned to the region re-initiating drought management. At the beginning of WY2009, 1319 Lake Okeechobee’s water level was 10.25 ft NGVD rising to a maximum of 15.16 ft NGVD in 1320 September 2009 but falling back to 11.14 ft NGVD at the end of the water year. 1321
In summary, WY2009 hydrology was unique where rainfall for most months, the dry season, 1322 and the water year were below average and drought conditions persisted throughout the District. 1323 But the three wet season months of June, July, and August were generally wetter than normal and 1324 enough runoff was generated to result in average inflows into major water bodies or hydrologic 1325 un e 1326 Ok s 1327 WY2009 su1328 average flows are also shown for comparison. 1329
1330
its. Runoff from the wet season rains, including Tropical Storm Fay (stored subsurface in Lakeechobee and the WCAs), relieved water demand during the dry periods. Figure 2-1 present
rface water flows for major hydrologic components in the entire system; historical
Chapter 2 Volume I: The South Florida Environment
8/6/09 2-66 DRAFT
LI D TERATURE CITE1331
1332 1333 1334
1335 1336 1337
1338 1339 1340
1341 1342 1343
Abtew, W. and R.S. Huebner. 2006. Hydrolog1344 1345 1346
1347 1348 1349
1350 1351 1352 1353
1354 1355 1356 1357
tland Systems in 1358 1359
1360 1361
1362 1363
ainfall Frequency Analysis for Central and South 1364 Florida. Technical Publication WRE # 380. South Florida Water Management District, West 1365 Palm Beach, FL. 1366
Attaway, J.A. 1999. Hurricanes and Florida Agriculture. Lake Alfred, FL. Florida Science 1367 Source, Inc. 1368
Berg, R. 2009. Tropical Cyclone Report Hurricane Ike (AL092008) 1–14 September 2008. 1369 National Hurricane Center. 23 January 2009. 1370
Abtew, W., C. Pathak, R.S. Huebner and V. Ciuca. 2009. Chapter 2: Hydrology of the South Florida Environment. In: 2009 South Florida Environmental Report – Volume I, South Florida Water Management District, West Palm Beach, FL.
Abtew, W., C. Pathak, R.S. Huebner and V. Ciuca. 2007a. Appendix 2-6: Regulation Schedules. In: 2007 South Florida Environmental Report – Volume I, South Florida Water Management District, West Palm Beach, FL.
Abtew, W., C. Pathak, R.S. Huebner and V. Ciuca. 2007b. Chapter 2: Hydrology of the South Florida Environment. In: 2007 South Florida Environmental Report – Volume I, South Florida Water Management District, West Palm Beach, FL.
Abtew, W., C. Pathak, R.S. Huebner and V. Ciuca. 2007c. Appendix 2-2: Stage-Storage Relationships of Lakes and Impoundments. In: 2007 South Florida Environmental Report – Volume I, South Florida Water Management District, West Palm Beach, FL.
ic Impact of the 2004 Hurricane Season on South Florida. Randall Graham (ed.). Proceedings of the World Water and Environmental Resources Congress 2007 held in Omaha, NE, on May 21-25, 2007. ASCE.
Abtew, W., R.S. Huebner, V. Ciuca. and E. Swartz. 2006. The 2005 Hurricane Season in South Florida. Technical Publication ERA # 439. South Florida Water Management District, West Palm Beach, FL.
Abtew, W. 2005. Evapotranspiration in the Everglades: Comparison of Bowen Ratio Measurements and Model Estimations. Proceedings of the Annual International Meeting of American Society of Agricultural Engineers, July 17-20, 2005, Tampa, FL. Available on CD-ROM, Paper Number 052118.
Abtew, W., J. Obeysekera, M. Irizarry-Ortiz, D. Lyons and A. Reardon. 2003. Evapotranspiration Estimation for South Florida. P. Bizier and P. DeBarry, eds. In: Proceedings of World Water and Environmental Resources Congress 2003, American Society of Civil Engineers, June 23–26, 2003, Philadelphia, PA. Available on CD-ROM.
Abtew, W. 1996. Evapotranspiration Measurements and Modeling for Three WeSouth Florida. J. of Amer. Water Res. Assoc., 32(3): 465-473.
Abtew, W. and J. Obeysekera. 1996. Drainage Generation and Water Use in the Everglades Agricultural Area Basin. J. of Amer. Water Res. Assoc., 32(6): 1147-1158.
Abtew, W. and N. Khanal. 1994. Water Budget Analysis for the Everglades Agricultural Area Drainage Basin. Water Res. Bull., 30(3): 429-439.
Ali, A.W. and W. Abtew. 1999. Regional R
2010 South Florida Environmental Report Chapter 2
DRAFT 2-67 8/6/09
Beven, J.L. and T.B. Kimberlain. 200 stav (AL072008) 1371 25 August – 4 September 2 anuary 2009. 1372
1373 1374
Cha y, MO. 1375
1376 1377 1378
1379 1380
Available on CD-ROM. 1381
1382 1383
1384 1385
SFWMD. 2002. Operational Plan Stormwater Treatment Area 6. South Florida Water 1386 1387
SFW1388 orps of Engineers, Jacksonville District and the Florida Department of 1389
1390
Skla1391 1392
Effects of Hydrology on the Everglades. In: 2000 1393 1394 1395
Skl1396 . Miao, S. Nueman, R. Penton, 1397
1398 1399
each, FL. 1400
1401 1402
1403 lantic City, NJ, on April 11–14, 1995. 1404
1405 1406 1407
1408 rglades Agricultural Area. March 2008. U.S. Army Corps of Engineers, 1409
1410
9. Tropical Cyclone Report Hurricane Gu008. National Hurricane Center. 22 J
Brown, D.P. and T.B. Kimberlain. 2008. Tropical Cyclone Report Hurricane Hanna (AL082008) 28 August – 7 September 2008. National Hurricane Center. 17 December 2008.
ston, P.R. 1996. Hurricanes. Chaston Scientific, Inc., Kearne
Guardo, M. 1992. An Atlas of the Upper Kissimmee Surface Water Management Basins. Technical Memorandum DRE-309. South Florida Water Management District, West Palm Beach, FL.
Pathak, C.S. and S. Palermo. 2006. Rainfall-Based Management Plan for Water Conservation Area 3A in Florida Everglades. Randall Graham, ed. World Environmental and Water Resources Congress 2006. ASCE, May 21–25, 2006, Omaha, Nebraska.
Sculley, S. 1986. Frequency Analysis of SFWMD Rainfall. Technical Publication 86-6. South Florida Water Management District, West Palm Beach, FL.
SFWMD. 2006. Lower West Coast Water Supply Plan Update 2005–2006. The South Florida Water Management District. West Palm Beach, FL.
Management District, West Palm Beach, FL.
MD. 2000. Adaptive Protocols for Lake Okeechobee Operations. Report in Co-operation with US Army CEnvironment Protection. South Florida Water Management District, West Palm Beach, FL.
r, F.H., L. Brandt, D. DeAngelis, C. Fitz, D. Gawlik, S. Krupa, C. Madden, F. Mazzotti, C. McVoy, S. Miao, D. Rudnick, K. Rutchey, K. Tarboton, L. Vitchek and Y. Wu. 2000. Chapter 2: Hydrological Needs –Everglades Consolidated Report. South Florida Water Management District, West Palm Beach, FL.
ar, F.H., C. Coronado, G. Crozier, M. Darwish, B. Garrett, D. Gawlik, A. Huffman, M. Korvela, J. Leeds, C.J. Madden, C. McVoy, I. Mendelssohn, SD. Rudnick, K. Rutchey, S. Senarath, K. Tarboton and Y. Wu. 2003. Chapter 6: Ecological Effects of Hydrology on the Everglades Protection Area. In: 2003 Everglades Consolidated Report. South Florida Water Management District, West Palm B
Stewart, S.R. and J.L Beven II. 2009. Tropical Cyclone Report Tropical Storm Fay (AL062008) 15-26 August 2008. National Hurricane Center, February 8, 2009.
Tait, L.S. 1995. Hurricanes. Different Faces in Different Places. The 17th Annual National Hurricane Conference held in Trump Taj Mahal, At
Trimble, P. 1990. Frequency Analysis of One and Three-Day Rainfall Maxima for Central and Southern Florida. Technical Memorandum. South Florida Water Management District, West Palm Beach, FL.
USACE. 2008. Central and Southern Florida Project – Water Control Plan for Lake Okeechobee and the EveJacksonville, FL.
Chapter 2 Volume I: The South Florida Environment
8/6/09 2-68 DRAFT
USACE. 2002. Final Environmental Impact Statement – Interim Operational Plan (IOP) for Protection of the Cape Sable Seaside Sparrow. U.S. Army Corps of Engineer
1411 s, Jacksonville, 1412
1413
US des National 1414 Corps of Engineers, 1415
1416
1417 1418
1419 1420
USG trended 1421 1422
Wa rom Tropical Systems in South 1423 1424 1425
1426 1427
ida Environmental Report – Volume I, South 1428 1429
Wil1430 1431
1432
FL.
ACE. 1996. Master Water Control Manual–Water Conservation Areas, EverglaPark, and ENP-South Dade Conveyance System. U.S. ArmyJacksonville, FL.
USACE. 1995. Master Water Control Manual – East Coast Canals. U.S. Army Corps of Engineers, Jacksonville District, FL.
USACE. 1994. Master Water Control Manual for Kissimmee River – Lake Istokpoga. U.S. Army Corps of Engineers, Jacksonville, FL.
S. 2009. Groundwater Conditions in Southern Florida. Real-time Conditions (de-data). U. S. Geological Survey. Tallahassee, FL.
lther, S. and W. Abtew. 2006. Contribution of Rainfall fFlorida. Technical Note. Environmental Resources Department. South Florida Water Management District, West Palm Beach, FL.
Williams, G.G., D.H. Anderson, S.G. Bousquin, C. Carlson, D.J. Colangelo, J.L. Glenn, B.L. Jones, J.W. Koebel Jr. and J. George. 2007. Chapter 11: Kissimmee River Restoration and Upper Basin Initiatives. In: 2007 South FlorFlorida Water Management District, West Palm Beach, FL.
liams, J.M. and I.W. Duedall. 1997. Florida Hurricanes and Tropical Storms. University Press of Florida, Gainesville, FL.