Embed Size (px)
Citation preview

27
CHAPTER 2
LITERATURE REVIEW
This literature review is the part of research that endeavors to fill
the gap in domain of research by exploring the different variables that covers
the nomological network of the study in reference of the financial sector with
special emphasis on India. The nomological network for this study contained
variables such as Customer expectation, Perceived Service quality, Customer
satisfaction and Customer Behavioral intentions. The first three variables
above are independently or in association with other variables are assumed as
capable of developing behavioral intentions in customer. The scope of the
chapter is to introduce the variables of interest in this study and to examine
the nature of linkages among the variables identified in previous studies
especially in the context of financial sector. The first four sections will narrate
the conceptual theories and prevailing practices in measurement the variables
of interest in the study. The next section will summarize some of established
models linking all the variables including studies related to financial sector
with the critical objective of developing a theory for this study. The last
section will offer a brief summary of various outputs from the literature
review.
2.1 CUSTOMER EXPECTATIONS
Expectations are Pre-trial beliefs about a service that functions as a
standard against which performance is judged by the customer
(Donna J. Hill 1986). Expectation is viewed, as perceived contingencies

28
between any two events of human or technical related experiences in a service
context. These events can be contingencies between an action and an outcome
or can be a contingency between two attributes such as high price and
implying high quality (Sheth and Mittal 1996). Word-of-mouth
communication between customers, the personal needs of customers, past
experiences of customers and external communications from service
providers (Parasuraman et al 1991), forms major reasons for customer
expectations.
The needs of the customer provides objective reasons (Martula and
Menon 1995) for expectations whereas past experiences (Lilley and
Usherwood 2000) in many cases become instrumental in developing
expectations. Oliver (1980) identified three factors responsible for
expectations namely the product, the context and the individual
characteristics. Winer (1985) acknowledged the significance of consumer
characteristics as sources of consumer expectation. Carman (1990) opinioned
that expectations are likely to change with familiarity and hence, if possible,
the level of familiarity should be gauged along with the expectations.
Calvert (2001) identified six factors which can have an impact on customer
expectation. Out of these six factors the first four are related to customer, the
fifth factor relates to service provider and the last factor is related to
competitors as mentioned below.
The customer related factors,
Past experience of the customer;
Word-of-mouth from other customers;
Personal needs of the customer; and
National culture of the customer.

29
The service provider related factor,
Communications (direct and indirect) about what the customer
can expect.
Competitors related factor,
Service provided by other providers that acts as a benchmark
Ojasolo (2001) emphasized the importance of understanding and
managing expectations in diagnosing problems related to customer relations
whereby creating sustainable long-term relationships. Various Expectation
standards were proposed by researchers. Woodruff et al (1993) proposed that
customers rely on standards that focal brand provide to meet needs and wants
and form an experience based norms for expectations. Miller (1977) proposed
minimum tolerable expectations and defined it as lower level of expectation
acceptable to the customer reflecting customer’s subjective evaluation of their
own product investment. Prakash ved (1984) proposed a standard called
comparative expectation based on comparing with similar brands
In service quality and customer satisfaction literature, expectations
are interpreted differently. In service quality, expectations have a normative
role and are based on past experience and they provide the consumer's view
of what should happen. In the customer satisfaction literature, expectations
are usually linked to what consumers forecast and therefore have a more
predictive role and they relate to what will happen (Parasuraman et
al1993).The concept of Zone of tolerance(ZOT) (Parasuraman et al 1993)
suggested that expectations in service quality has different levels of normative
expectations. Parasuraman et al (1993) defined ‘ZOT’ as the range of
customer perceptions of a service between desired and adequate level of
service. Desired service is defined as the blend of what can and should be

30
provided whereas the 'adequate' service quality level is defined as the
minimum level of service performance customers consider as adequate. The
authors of ‘ZOT’ theory proposed that the desired service level is relatively
stable but that the adequate service level moves up and down according to
consumer circumstances and needs.
In essence, ‘ZOT’ represents range of service performance that a
customer considers satisfactory or the range within which customers are
willing to accept variations in service delivery. Performance below the zone is
seen as dissatisfying and performance above the zone is seen as delighting.
The width ‘ZOT’ may vary from customer to customer and from situation to
situation and are likely to be influenced by involvement, individual quality
factors and past experiences (Parasuraman et al 1993).A wider ZOT means
that customers are more tolerant of variations in service levels and
organizations have more scope in managing their service. Parasuraman et al
(1993) in their comprehensive framework of service expectations explained
eleven antecedent factors which can have effect on expectation regarding
levels of service as shown in Figure 21.
Salehi and Rostami (2009) suggested the need to describe
expectation as a difference between anticipation of the facts and reference for
comparison. Expectations as a reference for comparison can be used as a
measure for evaluating satisfaction of customers. However, from the point of
view of the customer, the choice of a product is not only affected by his
expectations, but is also influenced by his needs. In many occasions
expectations may be the reason for acquiring a product or receiving a certain
service rather than needs. Also in most of the occasions customer expectation
and needs may be exactly the same, and even interchangeable. Hence it can
be assumed that expectations may be both what people expect and what they
want, and does not necessarily have to coincide with what they need.

31
Figure 2.1 Factors influencing levels of Service expectationSource: Parasuraman et al (1993)
According to the confirmation-disconfirmation paradigm by Oliver
and Bearden (1983), customers assess their levels of satisfaction by
comparing their actual experiences with their previous experiences,
expectations, and perceptions of the product's performance. The theory
postulates that three outcomes of this evaluation are possible:
(1) Confirmation occurs when the actual performance matches the
standard, leading to a neutral feeling;
(2) Positive disconfirmation occurs when the performance is
better than the standard, which then leads to satisfaction; and
(3) Negative disconfirmation occurs when the performance is
worse than the standard, which then leads to dissatisfaction.

32
The use of expectations as a basis for conceptualizing service
quality has given rise to numerous criticisms. Cronin and Taylor (1992), and
Teas (1993) argue that it is useless to recur to use expectations, in an attempt
to measure service quality, and that only perception should be used. Also
expectations always have a tendency to be high on their own, so the results
they provide when considered alone are not useful (Brown et al 1993). In this
study expectation component is not considered for assessing service quality,
rather the antecedent role of expectations was considered and an attempt was made to analyze customer expectations in a different perspective.
2.2 SERVICE QUALITY
Service quality can be considered as a differentiator that decides
the advantage a service firm enjoys in the competitive environment.
Marketers realized that to retain customers, and to support market growth,
they must provide high quality of service (Dabholkar et al 2000). It is said
that service quality is an important antecedent of consumer assessment of
value, which in turn influences customer satisfaction, which then motivates
loyalty (Babakus and Boller 1992). There has been much debate as to what
constitute service quality and how its measures can be operationalized in
various service industries, yet no consensus has been reached (Chowdary and
Prakash 2007). The following section traces the understanding service quality
to form the basis for the conceptualization of this construct in this study.
The first usage of the word “service quality” was surfaced in when
Anderson et al (1976) recognized importance of it for obtaining and retaining
customers. However substantial research were absent till early 1980s.
Churchill and Suprenant (1982) opinioned that service quality is an attitude.
Gronroos (1982) and Lewis and Booms (1983) identified the significance of
processes and outcomes in defining service quality. Holbrook and Corfman
(1985) concluded perceived service quality as a global value judgment. To

33
compete successfully, a firm must understand the perceptions of consumers
about quality. For achieving consumer satisfaction, expected service and
perceived service should match each other. An exploration of the literature on
service quality revealed the existence of two schools of thought namely
Nordic school of thought based on Gronroos’s (1982) and North American
school of thought based on Parasuraman et al (1984) GAP model. Later,
Cronin and Taylor (1992) questioned the conceptual basis of the SERVQUAL
and found it as confusing and proposed model that accounted only
performance component discarding the expectation component used in
SERVQUAL.
Gronroos (1982) defined the concept of perceived service quality,
as ‘the outcome of an evaluation process, where the consumer compares his
expectations with the service he perceived he has received’. Gronroos (1984),
based his definition on technical quality (the outcome or ‘what’) and
functional quality (the process or ‘how’). The functional quality represents
how the service is delivered; in other words it focuses on the interaction that
takes place during the service delivery. Whereas, the technical quality refers
to what the customer receives in the service encounter. Also corporate image
is introduced as a high order moderating dimension for perceived and
expected quality as illustrated in Figure 2.2.
Figure 2.2 Gronroos model of Service quality

34
Parasuraman et al (1984), proposed that Service quality is a
function of difference between expectations and performance with reference
to quality dimensions as experienced by the Customer. They developed a
service quality model (Figure 2.3) based on gap analysis. The various gaps
visualized in the model are:
Gap 1: Market information, the gap between customer expectations and
what the service provider thinks it is providing;
Gap 2: Service standards, the gap between what the service provider thinks
it is providing and the service provider’s standards;
Gap 3: Service performance, the gap between the service provider’s
standards and actual performance;
Gap 4: Internal communications, the gap between what the service
provider is marketing and what is being delivered; and
Gap 5: Service quality, the gap between the customers’ expectations and
their perception about the service delivery.
Figure 2.3 GAP Model Source: Parasuraman et al.(1984)

35
Parasuraman et al (1984) developed SERQUAL, a scale which asks
customers what they expect from excellent companies in any service sector
and their perception towards the level of service delivered by a specific
company in that sector. The methodology behind the development of the scale
was by capturing the agreement of customers on 22 indicators divided along
five dimensions that are capable of capturing the domain of service quality.
The same indicators were used to capture scores on expectation and
perceptions. The difference in expectation (E) and perception (P) scores gives
the measure of service quality (SQ). If perceived performance is higher than
the expectations, then it indicates high service quality, and the reverse
indicates poor quality. The procedure has got wide acceptance and many
researchers adopted the procedure to assess service quality in different
contexts such as retailing (Barnes and Vidgen 2002), health care
(Carman 1990; Yang et al 2003; Kilbourne et al 2005), banking
(Zhou et al 2002; Al-Hawari et al 2005), education (Ruby 1998; Tan and Kek
2004), information systems (Kettinger et al 1995; Jiang et al 2002), library
(Edwards and Browne 1995; Nitecki 1996; Cook and Thompson 2001;
Landrum and Prybutok 2004) and other areas of service across many
countries. The SERVQUAL was modified in multiple ways as illustrated in
table 2-1.However the classic format containing five dimensions with 22
indicators as illustrated in Table 2.2 is considered popular.

36
Table 2.1. SERVQUAL –Stages in evolution of SERVQUAL
SERVQUAL (Year) Features1985 -10 dimensions such as Reliability,
Responsiveness, Competence, Access, Courtesy, Communication, Credibility, Security, Knowing customer needs, Tangibles
1988 -Reduced to 5 dimensions like Reliability, Assurance, Tangibles, Empathy, Responsiveness, -22 item scale with 2 parts each for expectation and perceptions -sed 7 point scale
1991 -Dropped negative worded - Dropped the normative ‘should’ and replaced it with ‘would’ - Allocated 100 points as weights among the 5 dimensions on a 10 point scale
1993 -Expectation component interpreted in terms of ZOT
1994 -Reformatted 22 items to 21 items on a -9 point Likert-type scale - Included use of ‘no opinion’ - Perception next to desired and adequate separately
1996 -Developed a conceptual framework of both financial and behavioral consequences of service quality
2005 -Modified SERVQUAL to measure e-service quality - Identified 4 dimensions of e-service quality: Efficiency, Fulfillment, System availability, Privacy -Identified 3 dimensions for service recovery: Responsiveness, Compensation, Contact

37
Some major objections relate to use of disconfirmation theory
(Perception minus – Expectations gap scores) (Cronin and Taylor 1992; Teas,
1993, 1994; Buttle 1996), predictive power of the instrument (Babakus and
Boller 1992, Van Dyke et al 1999),validity of the five-dimension structure,
(Dabholkar et al 2000; Wilkins et al 2007; Ladhari 2009;
Saurina Canals 1997; Buttle 1996 and Robbinson 1999) and length of the
questionnaire (Hernon 2002). Subsequently some researchers recommend that
a performance-only measure (or direct-effect model) is superior to the Gap
score (Lee et al 2000; Cronin and Talyor 1992; Roszkowskit et al 2005; Caro
and Gracia 2007; Wilkins et al 2007) because it is more reliable and explains
more variance than the disconfirmation model. Page and Spreng (2002) have
further argued that performance is a much stronger indicator of service
quality than expectations. A new scale called SERVPERF, which measures
only service quality on the basis of perception alone was developed by Cronin
and Taylor (1992). The SERVPERF scale reduced the number of items to be
measured by 50% and is considered more efficient (Jain and Gupta 2004).
Even though various criticisms as cited above were coined against
SERVQUAL, the multi-dimensional structure was accepted by majority of
researchers and the structure and contents of the instrument also gathered
much popularity. However the selection of appropriate dimensions that are
relevant to the context of the study emerged as a new area for research. Table
2-3 below was presented to provide a general idea about various dimensions
considered in service quality measurement. In this study, service quality
dimension were identified according to currents trends based on
recommendations of the expert panel. The emerging trends related to
E-banking were also considered during the literature review to identify
possible dimensions to explain the domain of current banking scenario in
India.

38
Table 2.2 SERVQUAL dimensions and indicators
With the advent of technology influence service delivery
possibilities in the banking sector, the relevance of machine related, system
related and connectivity related dimensions also gathered attention in service
quality measurement. Zeithaml et al (2001) identified 11 dimensions for
measuring service quality in the online context after a series of focus group
interviews. These were access, ease of navigation, efficiency, flexibility,

39
reliability, personalization, security, responsiveness, assurance/trust, site
aesthetics, and price knowledge.The service quality perceptions in E-banking
have to be evaluated purely system oriented as possibility of direct interaction
with human involvement is limited. In such a context, service quality will be
decided by system quality, network quality and information quality as
suggested by the expert panel when consulted during the preliminary study.
Therefore this study considered conventional dimensions which are
contemporary as well as technical and system related dimensions which are
more representative of current service delivery options.
Table 2.3 Dimensions used in some important studies
Author Year Context Dimensions Gronroos 1982 bank, insurance,
restaurants, shipping,airline companies,cleaning andmaintenance
technical quality, functional quality & corporate image (3)
Lehthinen and Lehthinen
1982 general physical quality, corporate quality and interactive quality(3)
Parasuraman et al 1984 telephoneco., securitiesbrokerage, insurance co., banks and repair and maintenance
Reliability, responsiveness, tangibility, courtesy, access, credibility, communication, competence, understanding & security (10)
Parasuraman et al 1988 general Reliability, responsiveness, tangibles, assurance & empathy (5)
Gronroos 1990 general attitude and behavior, skills and professionalism, accessibility and flexibility, reliability and trustworthiness, recovery; reputation and credibility (6)
Avkiran 1994 Australian Banking Staff Conduct, Credibility, Communication and Access to Teller Services(4)
Rust and Oliver 1994 general Service product, service delivery and service environment(3)
Johnston 1995 UK banking context Aesthetic, availability, attentiveness, access, care, cleanliness, comfort, commitment, communication, competence, courtesy, friendliness, flexibility, functionality, integrity; reliability, responsiveness &security(18)
Oppewal and Vriens 2000 UK banking accessibility,competence, accuracy and friendliness, and tangibles (4)

40
Table 2.3 (Continued)
Bahia and Nantel 2000 Canada banking Effectiveness and assurance, access, price, tangibles, service portfolio and reliability (6)
Siu and Cheung 2001 Retail format personal interaction; policy; physical appearance; promise; problem solving; and convenience(6)
Othman& Owen 2001 Kuwait banking Compliance with Islamic law, reliability, responsiveness, tangibles, assurance & empathy (6)
Aldlaigan and Buttle 2002 UK banking Service system quality, behavioral service quality, machine service quality and service transactional accuracy (4)
Sureshchander et al 2002 Banking Core service or service product, Human element of service delivery, Systematization of service delivery - non-human element; Servicscapes and Social responsibility(5)
Gounaris et al 2003 Greek Banking employee competence, reliability, the innovativeness of the bank’s products, pricing (value for money), physical evidence and convenience(5)
Karatepe et al 2005 Northern Cyprus banking
service environment, interaction quality, empathy and reliability (4)
Gounaris 2005 B2B context Potential quality, hard processing quality, soft processing quality and output quality (4)
Al-Hawari and Ward 2006 Australia banking ATM, Telephone banking, internet banking, price, core product, customer service and financial performance (8)
Ibrahim et al 2006 UK banking sector provision of convenient/accurate electronic banking operations, the accessibility and reliability of service provision, good queue management, service personalization, the provision of friendly and responsive customer service and the provision of targeted customer service (5)
Nam 2008 US and South Korea Banking
Trustworthiness, functionality, appearance and helpful employees(4)
Guo et al 2008 China Banking Reliability, technology, communication, technical quality and human capital(5)
Kumar et al 2009 Malaysian Banking Tangibility, reliability, convenience and competence (4)
Ravichndran et al 2010 Indian banking Reliability, responsiveness, tangibles, assurance , empathy and price (6)

41
The structure of service quality was conceptualized differently by
researchers. Dabholkar et al (1996) suggested that service quality dimensions
should be viewed as higher-order constructs that have various sub-
dimensions. They identified and tested a hierarchical conceptualization of
retail service quality that proposes three levels: i) customers overall
perception of service quality; ii) primary service quality dimensions and iii)
sub-dimensions of service quality. Philip and Hazlett (1997), proposed a
model that takes the form of a hierarchical structure – based on three main
classes of attributes – pivotal, core and peripheral. According to the model
every service has overlapping of above attributes, where majority of the
dimensions and concepts used to define service quality are contained. The
pivotal attributes, located at the core, are considered collectively to be the
single most determining influence on consumer decision in selecting a
particular organization and exert the greatest influence on the satisfaction
levels. Core attributes, centered on the pivotal attributes, can best be
described as the amalgamation of the people, processes and the service
organizational structure through which consumers must interact and/or
negotiate so that they can achieve/receive the pivotal attribute. The peripheral
attributes which can be defined as the “incidental extras” or frills designed to
add” roundness” to the service encounter and make the whole experience for
the consumer a complete delight. When a consumer makes an evaluation of
any service encounter, he is satisfied if the pivotal attributes are achieved, but
as the service is used more frequently the core and peripheral attributes may
began to gain importance
Brady and Cronin (2001), proposed the hierarchical service quality
model (HSQM) where service quality was conceptualized as a multilevel
construct consisting of three primary dimensions: interaction quality, physical
environment quality, and outcome quality. Each of these three broad
dimensions was composed of various lower-level dimensions. The interaction

42
quality dimension was comprised of attitude, behavior, and expertise of the
service provider. The physical environment quality dimension comprised of
ambient conditions, design, and social factors. The outcome quality
dimension comprised of waiting time, tangibles, and valence (Figure 2-4).
The multilevel-hierarchical structure for service quality proposed by Brady
and Cronin has also been empirically tested in travel services (Ho 2007); B2B
services (Gounaris 2005); electronic services (Fassnacht and Koese 2006) and
hotel services (Wilkins et al 2007).
Figure 2.4 Hierarchical Model for Service Quality
Some researchers approached the concept of service quality in a
different manner and contributed substantially to the body of knowledge. Few
such studies are cited below.
Mukjerjee and Nath (2005) conducted a study to empirically
compare alternate approaches like TOPSIS from decision sciences, and Loss
function from operations research and engineering with SERVQUAL for
measuring service quality. The empirical evidence was provided by large
sample consumer data on the service quality for leading Indian commercial
banks. Findings revealed that the rankings obtained from different methods

43
are statistically in agreement, suggesting that the alternative approaches can
provide equally good measurement of service quality.
Ugur Yavas and Martin Benkenstein (2007) conducted a study to
determine the underlying configurations of service quality perceptions
between Turkish and German bank customers by ascertaining the extent of
cross-cultural congruence and found that underlying configurations of service
quality items decompose into three factors for both groups and the extent of
congruence between the two groups were strong.
Dash et al (2009), conducted a study to find the effect of power
distance and individualism on service quality expectations in banking among
Indian and Canadian banking customers. The results showed that the
importance of various SERVQUAL dimensions was related to Hofstede's
power distance and individualism cultural dimensions both at the individual
and national levels. Also consumers low on power distance expects highly
responsive and reliable service. High power distance customers attached
higher importance to tangible service attributes. Consumers high on
individualism expect lower empathy and assurance from service providers.
Furthermore, Indian consumers attached higher importance to tangible
attributes, whereas Canadian consumers found service reliability more
important. However, differences in overall service quality expectations were
not significantly different across the two countries.
Tigineh Mersha and Veena Adlakha (1992), identified the attributes
for good and poor quality of five selected types of services such as physician
service, retail banking, auto maintenance, college/university, and fast food.
The findings indicated that consumers had well-conceived ideas about service
quality, and that certain quality attributes were emerged important for most
types of services. This study found that some attributes seem to have effects

44
similar to Herzberg's hygiene factors, i.e. the absence of certain attributes may
lead consumers to perceive service quality as poor. However, the presence of
these attributes may not substantially improve the perceived quality of the
service. Also suggested that most customers would be willing to trade some
convenience for a price break, and that the behaviour, skill level and
performance of service employees are key determinants of perceived quality
of services.
Nitin Seth et al (2004),conducted a study with the objective of
critically appraising various service quality models and revealed that the
service quality outcome and measurement were dependent on type of service
setting, situation, time and need factors. In addition to this even the
customer’s expectations towards particular services were also found changing
with respect to factors like time, increase in the number of encounters with a
particular service, competitive environment, etc.
Malhotra et al (1994), identified that economic and socio-cultural
differences will affect customer perceptions of service quality. Service quality
dimensions of courtesy, credibility, and communication were related to
cultural dimensions of individualism/collectivism and power distance.
Similarly service quality dimensions such as reliability, access and the
understanding of the customer were related to factors of economic
development such as affluence, competition, education, infrastructure, and
technology.
According to Johnson (1996), non-personal-contact (e.g. bank
statements) dimensions are expected to be less related to personal-contact
(teller service) dimensions. Seeking information, service training and support,
service rewards and recognition were the service climate themes that were
most predictive of specific facets of customer satisfaction and overall

45
satisfaction with service. These three dimensions were probably highly
related because they all had an informational component. It was expected that
all service climate dimensions would be related to customer service
satisfaction. This was generally supported, as all dimensions were
significantly related to at least some facets of customer satisfaction except
bank statements. It was also expected that the customer dimensions of bank
statements and convenience would tend to be less related to service climate
dimensions, because these are non-personal-contact facets of customer
satisfaction.
2.3 SERVICE QUALITY IN BANKING SECTOR
Extensive research has been undergone to understand service
quality perceptions in the banking sector. Many of such studies used
SERVQUAL (Angur et al 1999; Arasli et al 2005; Lam 2002; Zhou 2004;
Nam 2008; Ravichandran et al 2010) whereas application of alternative
measures (Bahia and Nantel 2000; Aldlaigan and Buttle 2002; Jabnoun and
Al-Tamimi 2003; Karapte et al 2005; Guo et al 2008) also cherish the
literature.
Ravichandran et al (2010),conducted a study in India banking
context to identify the Influence of Service Quality on Customer Satisfaction
using SERVQUAL Model and found out that Customers are satisfied with the
quality of banks’ services ( all the 5 dimensions) but in varying degrees. It
was further identified that with regards to overall satisfaction of banks
services, responsiveness was the only significant dimension. Three
dimensions such as tangibles, reliability and a combination of empathy and
responsiveness were identified as important in Cyprus banking context
(Arasli et al 2005) whereas reliability and assurance decided service quality
of US customers (Zhou 2004).The Chinese customers offered two sub

46
dimensions such as “understanding of needs” and “convenient operating
hours” for the empathy dimension while identifying all other dimensions
significant (Lam 2002).An earlier study conducted in the Indian Banking
context identified responsiveness and reliability seem to be the most
important dimensions followed by the empathy and tangible dimensions;
whereas, assurance appears to be the least important dimension
(Angur et al1999)
Jabnoun and Al-Tamimi (2003) examined perceived services
quality in commercial banks in the United Arab Emirates and emphasized the
importance of service quality to maintain market share, the study identified
human skills as the most significant dimension in service quality. Guo et al
(2008) conducted a study to measure Service Quality in the Chinese
Corporate Banking and concluded that service quality contained two higher-
order constructs (Functional Quality and technical quality) and four lower-
order dimensions (reliability, human capital, technology and communication).
Aldlaigan and Buttle (2002), based on the technical and functional
service quality model proposed by Gronroos (1984), developed a scale to
measure service quality perceptions of bank customers. Their study resulted
in SYSTRA-SQ, which consisted of service system quality, behavioral
service quality, service transactional accuracy, and machine service quality. A
21-item scale comprising four dimensions: service system quality,
behavioural service quality, service transactional accuracy, and machine
service quality was developed and validated. It was found that that customer
evaluates SQ at two levels: organizational and transactional. The parsimony,
reliability and validity of the scale suggested high utility of this scale to the
banking industry.

47
Bahia and Nantel (2000) developed a new measurement called
Bank Service Quality (BSQ) for perceived service quality in Retail Banking.
This scale includes 31 items classified across six dimensions - effectiveness
and assurance, access, price, tangibles, range of services offered and accuracy
and reliability. They argued that the dimensions of BSQ are more reliable
than the dimensions of SERVQUAL and are fit for all retail banking of the
world.
Tsoukatos and Mastrojianni (2010) developed a 27-item
BANQUAL-R scale consists of 12 SERVQUAL, seven BSQ, two common in
SERVQUAL and BSQ and six items specific to the context of Greece
banking. Avkiran (1999) developed an instrument BANKSEV which had
identified the following four discriminating factors of service quality in the
banking sector.
Staff Conduct: Responsiveness, civilised conduct and
presentation of branch staff that will project a professional
image to the customers.
Credibility: maintaining bank staff-customer trust by rectifying
mistakes and keeping customers informed.
Communication: Fulfilling banking needs to customers by
successfully communicating financial advice and serving
notices timely.
Access to Teller Services: The adequacy of number of branch
staff

48
2.4 E- BANKING SERVICE QUALITY
The emergence of internet and its widespread popularity resulted in
the introduction of virtual market place instead of traditional physical ones.
The banks also employed the Internet as an alternative service delivery
channel. It has been pointed out that the introduction of e-banking services
could offer both bankers and customers diverse benefits (Broderick and
Vachirapornpuk 2002). The interaction between the customer, and the bank’s
Web site or employees over the Internet enabled the bank to lower its
operating and fixed costs by reducing the number of employees, branch
offices, and other physical facilities while maintaining a high quality level of
customer service. These cost benefits could make favorable conditions for the
bank to provide customer services at lower fees. E-service quality can be
defined as overall consumer evaluations and opinions about the excellence of
e-service delivery in the virtual marketplace (Santos 2003). Colier and
Bienstock (2006) describe e-service quality as user’s perceptions of the
outcome of the service delivery along with service recovery perceptions, if
service failures happened. It was widely accepted that certain dimensions
relating to technical aspects and website characteristics need to be
incorporated to fully capture the service quality perception in e-context
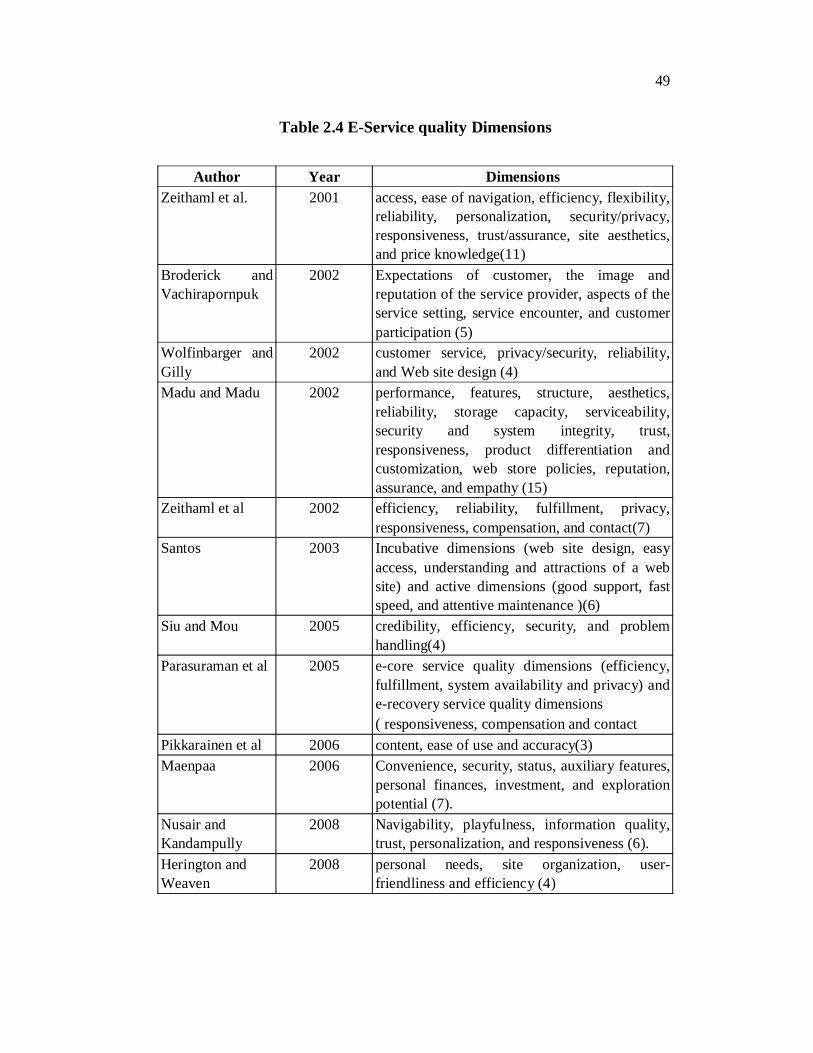
(Zeithaml 2002).The following Table 2.4 narrates few of the prominent
dimensions considered by researcher’s to measure e-service quality applicable
to multiple contexts.
49
Table 2.4 E-Service quality Dimensions
Author Year Dimensions Zeithaml et al. 2001 access, ease of navigation, efficiency, flexibility,
reliability, personalization, security/privacy, responsiveness, trust/assurance, site aesthetics, and price knowledge(11)
Broderick and Vachirapornpuk
2002 Expectations of customer, the image and reputation of the service provider, aspects of the service setting, service encounter, and customer participation (5)
Wolfinbarger and Gilly
2002 customer service, privacy/security, reliability, and Web site design (4)
Madu and Madu 2002 performance, features, structure, aesthetics, reliability, storage capacity, serviceability, security and system integrity, trust, responsiveness, product differentiation and customization, web store policies, reputation, assurance, and empathy (15)
Zeithaml et al 2002 efficiency, reliability, fulfillment, privacy, responsiveness, compensation, and contact(7)
Santos 2003 Incubative dimensions (web site design, easy access, understanding and attractions of a web site) and active dimensions (good support, fast speed, and attentive maintenance )(6)
Siu and Mou 2005 credibility, efficiency, security, and problem handling(4)
Parasuraman et al 2005 e-core service quality dimensions (efficiency, fulfillment, system availability and privacy) and e-recovery service quality dimensions ( responsiveness, compensation and contact
Pikkarainen et al 2006 content, ease of use and accuracy(3)Maenpaa 2006 Convenience, security, status, auxiliary features,
personal finances, investment, and explorationpotential (7).
Nusair and Kandampully
2008 Navigability, playfulness, information quality, trust, personalization, and responsiveness (6).
Herington and Weaven
2008 personal needs, site organization, user-friendliness and efficiency (4)

50
A web site that acts as an interface between customer and service
provider is an essential component that can bring more quality perceptions in
e- context. Hence many researchers have attempted to identify dimensions for
measuring web-site quality. Yoo and Donthu (2001) proposed a scale called
SITEQUAL for measuring web site quality based on four factors namely ease
of use, aesthetic design, processing speed, and security. Cox and Dale (2001)
claimed that traditional service quality dimensions such as competence,
comfort, cleanliness and courtesy were not suitable for online environment,
whereas dimensions such as accessibility, communication, credibility,
understanding, appearance, and availability were very significant for online
environment. A scale called WebQual has been developed by Loiacono et al
(2002) to evaluate web site quality, which is composed of 12 dimensions:
informational fit-to-task, tailored communications, trust, response time, ease
of understanding, intuitive operations, visual appeal, innovativeness,
emotional appeal, consistent image, online completeness, and relative
advantage. Barnes and Vidgen (2002) developed WebQual scale for
measuring web site quality based on three factors: usability, information
quality, and service interaction quality.
The hierarchical structure of e-service quality was considered idea
by Collier and Bienstock (2006) in his study on e-retailing. The study
identified three dimensions: process quality, outcome quality, and recovery
quality. Each of these dimensions has sub dimensions such as functionality,
information accuracy, design, privacy, and ease of use to determine process
quality. Whereas the outcome quality is determined by order accuracy, order
condition, and timeliness; and recovery quality is determined by interactive
fairness, procedural fairness, and outcome fairness. Table 2.5 lists down
certain dimensions considered by researchers as relevant to e-banking
context.

51
Table 2.5 E-banking Dimensions
Dimension Author
Website designs/ Web site appears/ Aesthetic design
Jun and Cai (2001), Kim and Stoel (2004), Kim et al (2009)
Reliability Madu and Madu(2002), Yang and Jun (2002)
Ease of use Yang et al (2003), Sukasame (2004), Yang et al (2004), Sohn and Tadisina (2008), Obi (2009)
Responsiveness Zeithaml et al (2002), Madu and Madu (2002)
Communication Sohn andTadisina (2008), Surjadaja et al(2003), Kim et al (2009)
Information Jun and Cai (2001), Yang (2001), Zeithaml et al (2002)
Courtesy Jun and Cai (2001), Yang et al (2003)
Customization Sohn andTadisina (2008), Surjadaja et al(2003), Kim et al (2009)
2.5 CUSTOMER SATISFACTION
Zeithaml et al (2009), defined Customer satisfaction as “the
customer’s evaluation of a product or service in terms of whether that product
or service has met the customer needs and expectations”. Gustafsson (2005)
defined Customer satisfaction as a “customer’s overall evaluation of the
performance of an offering to date”. Kotler (2000) defined satisfaction as a
“person’s feeling of pleasure or disappointment resulting from comparing a
product’s perceived performance/outcome from his/her expectations”.
Yi (1990) defined customer satisfaction as “collective outcome of perception,
evaluation and psychological reaction to consumption-experience with a
product or service”. Zairi (1996), mentioned the importance of asking

52
customers about their needs and expectations and collecting feedback
regularly about the level of service they have received in order to serve them
better. Satisfaction is a function of perceived performance and expectations.
If the performance falls short of expectations, the customer will be
dissatisfied. If the performance matches the expectations, the customer will
be satisfied. If the performance exceeds expectations, the customer is highly
satisfied or delighted. Thus satisfaction formed as a result of post-
consumption evaluative judgment (Westbrook and Oliver 1991).
Most studies on satisfaction were based on the theory that the
confirmation or disconfirmation of pre-consumption product standards
essentially determines satisfaction. So, in a service context, it was argued that
customers have certain service standards in mind prior to consumption (their
expectations) which are observed and compared with their standards during
service encounter and then satisfaction judgments are formed. The resulting
judgment is labeled negative disconfirmation if the service is worse than
expected, which results in customer dissatisfaction and may lead to negative
word of mouth publicity and/or customer defection. In contrast, a positive
disconfirmation exists if service is better than expected, thereby resulting in
customer satisfaction, positive word of mouth publicity and customer
retention (Hoffman and Bateson 1997). A simple confirmation occurs if
service turns to be as expected. Positive disconfirmation along with pleasure
and an element of surprise develops customer delight.
Most of the retail banks set their strategies towards increasing satisfaction and loyalty of customers through the quality of service. Devlin, (2001), pointed out that “customers perceive very little difference in the services offered by retail banks and any new offering is quickly matched by competitors.” Ability of SERVQUAL dimensions to develop customer satisfaction is identified as different in prior studies. Zaim et al (2010), observed that tangibility, reliability and empathy are important factor for

53
customer satisfaction, whereas Mengi (2009), founded that responsiveness and assurance are important factors. Kumar et al (2010), and Lai (2004), found that assurance, empathy and tangibles are the important factors, and on the other hand, Baumann et al (2007), found that tangibles are not related to customer satisfaction and Ahmed et al (2010), find out that empathy is negatively related to customer satisfaction. Kirti and Dutta (2009) explored the gulf between customer expectations and perceptions of service quality factors throughout public, private and foreign banks in India based on the SERVEQUEL model and found that tangibles, assurance, empathy and reliability dimensions explain customer satisfaction in Indian banks
Researchers have identified various determinants of customer satisfaction in the retail banking sector. Arasli et al (2005), pointed out that reliability dimension of SERVQUAL has the highest impact on customer satisfaction in Greek Cypriot banking industry. Chaniotakis and Lymperopoulos (2009), observed that reliability was not related to customer satisfaction. According to Levesque and McDougall (1996), competitive interest rate was one of the important determinants of customer satisfaction in retail banking sector. They also found out that a good “employee customer” relationship can increase the satisfaction level and pointed out that problem-recovery is important to maintain the customer satisfaction. They concluded that competitiveness and convenience of the banks are the two important determinants of customer satisfaction. On the other hand, Jamal and Naser(2003), found that convenience and competitiveness are not the critical factors for all gender, age and income groups. Johnston (1995) opined that attentiveness, responsiveness, care, and friendliness are the main source of satisfaction in banking services, and integrity, reliability, responsiveness, availability, and functionality are the main source of dissatisfaction. Yang and Fang (2004) identified that dimensions of responsiveness, competence, service reliability, and ease of use as key determinants of both satisfaction and dissatisfaction in online banking context.

54
In marketing literature, Service Quality and Customer Satisfaction have been conceptualized as a distinct, but closely related constructs. There is a positive relationship between the two constructs (Beerli et al 2004). Some researchers argued that service quality is the antecedent of customer satisfaction, while others argued the opposite relationship. Jamal and Naser(2003), stated that service quality is the antecedent of customer satisfaction. Figure 2.4a explains the summary of debate by various researchers regarding the Causal Relationships between Satisfaction and Service Quality.
Figure 2.4a Summary of the Causal Relationships between Satisfaction and Service Quality
Source: Gonzalez et al (2007)
The most popular method to measure customer satisfaction was by way of surveys that capture customer perceptions on selected attributes that are relevant to conclude about satisfaction level of customers. The Customer satisfaction Index is considered as the most popular method that directly captures customer satisfaction level. The CSI model consists of a number of latent factors, each of which is operationalised by multiple indicators. Customer satisfaction can be defined as an overall evaluation of a firm’s post-

55
purchase performance or utilization of a service. The antecedent of overall customer satisfaction considered in the framework includes expectations, image, perceived quality, value, customer loyalty and customer complaints(Adela Poliakova 2010). The American Customer Satisfaction Index (ACSI), developed in the mid-1990s, has provided a basic framework for many other index models created elsewhere in the world (Fornell et al 1996). Thecustomer satisfaction Index in simple words is a weighted average score of all attributes that are believed to contribute to customer satisfaction on a scale from 1 to 10. Since different attributes can contribute differently to the overall customer satisfaction, the individual attributes are awarded proper weights. The following Table 2.6 list down various studies based on customer satisfaction index
Table 2.6 Prior studies on customer satisfaction index models
Model Author Dimensions American Customer Satisfaction Index(ACSI)
Fornell et al 1996
Perceived quality, customer expectations, perceived value, overall customer satisfaction, customer complaints, customer loyalty
European Customer Satisfaction Index(ECSI)
O’Loughlin and Coenders
1998
Image, customer expectations, perceived hardware quality/perceived software quality, perceived value, customer satisfaction, customer loyalty
ECSI for Portal Services
O’Loughlin and Coenders
2004
Image, customer expectations, product hardware quality, customer service human ware quality, perceived value, customer satisfaction, customer loyalty
Swiss CSI Bruhn and Grund 2000
Customer satisfaction, customer dialogue, customer loyalty
Canadian CSI for Mobile Services
Turel and Serenko 2006
Perceived quality, customer expectations, perceived value, customer satisfaction, customer complaints, price tolerance, repurchase likelihood
African Banking KPMG 2013 Convenience, customer care, transactions, methods &systems, pricing and products and services

56
A model of customer satisfaction was introduced by Kano et al
(1984), distinguishing between three types of product requirements which
influence customer satisfaction in different ways was accepted by various
scholars as an approach to measure satisfaction in both products and services.
KANO model defines three types of customer needs: The basic needs,
expected needs, excited needs. Basic needs are fundamental functions of
products in the view of customers. They are basic requirements to the
product. If the product doesn’t satisfy these basic needs, customers would be
extremely dissatisfied; on the contrary, when the product fully satisfies the
basic needs, consumers will not show a particular satisfaction either as they
think it’s the fundamental function of products. The more Expected needs are
achieved in the product, the more satisfied customers are; while the product
does not meet these requirements, customers will also be dissatisfied. Excited
needs are referred to unexpected product features. If the product does not
provide this type of demand, customers will not be dissatisfied, because they
often do not think about these requirements, on the contrary, when the
products provide such demands; the customer would be very satisfied with
the products.
Kano has developed a two-dimensional questionnaire positive
(functional) and negative (disfunctional) version of the attribute that evaluates
satisfaction. The responses were collected on a five point scale containing
options “like, must-be, neutral, live with and dislike”. The combinations
scores of responses are classified into six categories and are evaluated as per
the tables developed for the purpose of the model. The six categories were
Attractive (A): An Attractive attribute leads to a better
satisfaction, whereas it is not expected to be in the product.
One-dimensional (O): A One-dimensional attribute
fulfillment helps enhance the satisfaction and vice versa.

57
Must-be(M) : A Must-be attribute absence produces absolute
dissatisfaction and its presence does not increase satisfaction
Indifferent (I): An Indifferent attribute, that result neither in
satisfaction nor dissatisfaction, whether fulfilled or not.
Reverse (R): A Reverse attribute presence causes
dissatisfaction and its absence causes satisfaction.
Questionable (Q): contradictory responses
All possible combinations of customer answers and the
corresponding classification of attribute are evaluated using the Table 2.7
below. Two scores between 0 and 1 are calculated after the classification
based on the formulae to evaluate the satisfaction on various attributes
considered.
Better values close to 1 suggests satisfying attributes and worst
values close to1 indicates that the attributes causes dissatisfaction.
Table 2.7 Kano evaluation

58
This study has attempted to explore and measure customer
satisfaction in a different perspective as elaborated in the theoretical frame
work. The outcomes of customer satisfaction are reflected in various
behavioral intentions displayed by the customer. The behavioral intentions
can be favorable or unfavorable which in turn can give rise to a “remain”
behavior or a “defect” behavior. Dimensions of “loyalty” and “pay more”
describe a favorable behavior whereas “switch” represents an unfavorable
behavior. External response and internal response can be favorable or
unfavorable depending upon the level of satisfaction of the customer. Nuri
Calik and Figen Balta (2006), identified “Loyalty” as a major behavioral
intention, believed to be resulting from customer satisfaction. To have
favorable behavioral intentions the need to satisfy the customer was found
essential. Retaining satisfied customers lead to word of mouth
recommendations to a new customer. The next section attempts to explore
research undertaken to understand the scope of behavioral intentions in the
banking context.
2.6 BEHAVIORAL INTENTIONS
Behavioral intentions are assumed to be the immediate antecedent
of a specific behavior by the customer. Intentions are explicit decisions to act
in a certain way, and they concentrate on a person’s motivation towards a
goal in terms of direction and intensity (Sheeran 2002). Triandis (1980)
defined Behavioral intention as "instructions that people give to themselves to
behave in a certain way". Ajzen (2002) defined Behavioral intention as “ an
indication of an individual's readiness to perform a given behavior”. Warshaw
and Davis (1985) defined behavioral intention as, “the degree to which a
person has formulated conscious plans to perform some specified future
behavior”. As immediate predictors of behavior, intentions have been at the

59
centre of research for many years, for instance in the theories of planned
behavior and reasoned action (Ajzen and Madden 1991).
According to the theory of reasoned action, behavioral intention
explains the most immediate determinant of any social behavior but only
under conditions where the behavior in question remains under volitional
control and behavioral intention remains unchanged. The theory proposes that
an individual’s intention is determined by attitudes and subjective norm
regarding the performance of the behavior. Furthermore, attitude to the
behavior accounts for beliefs about the outcomes of the behavior and
evaluations of those outcomes. Subjective norm is determined by perceived
pressure from specified significant others to carry out the behavior and
motivation to comply with the wishes of those significant others.
Ajzen and Madden (1991) extended the theory of reasoned action
to better account for behaviors which are not fully under volitional control by
introducing the theory of planned behavior. The theory of planned behavior
incorporates the original components of the reasoned action model, but also
includes a perceived behavioral control variable, defined as, “the perceived
ease or difficulty of performing the behavior”. According to Ajzen where
behaviors are not fully under volitional control, perceived behavioral control
and behavioral intention will together account for behavior, at least when
perceptions of control are accurate reflections of actual control over a
behavior. The theory of planned behavior also proposes that, along with
attitude and subjective norm, perceived behavioral control is a determinant of
behavioral intention.
Minami and Dawson (2008), suggested that importance should be
given to behavioral intentions of the customer as it contributes to profitability
of the firm. Boulding et al (1993) reported that the overall service quality

60
perception were positively related with willingness to recommend
and negatively related with switching and complaining behavior
(Kelley et al1993). Lee et al (2006), reported that customers are more likely
to spread out negative word of mouth than positive word of mouth. Empirical
evidences are available to claim that a direct positive relationship exist
between customer satisfaction and active engaging in more word-of-mouth
(Brown et al 2005; Babin et al 2005).Also researchers observed the existence
of positive association between satisfaction and repurchase intention
(Bitner et al 1990; Jones and Suh 2000; Cronin and Taylor 1992). Both
Parasuraman et al (1988) and Zeithaml et al (1996) have reported that a
positive relationship exists between perceived service quality and behavioural
intentions. In particular, positive word-of-mouth has been clearly associated
with superior service quality. Bitner (1990) also found that perceived service
quality influence behavioural intentions in terms of word-of-mouth and
repurchase intention. Similarly, Dabholkar et al (1996) reported a positive
association between perceptions of service quality and the likelihood of
recommending a product or service.
Many empirical studies have investigated the relationships among
the constructs of service quality, customer satisfaction, and behavioural
intentions in a variety of industries and cultures. These include studies of the
lodging industry in the USA (Olorunniwo et al 2006), audit industry in
Malaysia (Ismail et al 2006), banking industry in Taiwan (Lee and Hwan,
2005), recreation industry in the USA (Tian-Cole et al 2002; Lee et al 2004),
health-care industry in South Africa (Boshoff and Gray, 2004), and airline
industry in Korea (Park et al 2004).

61
Several studies show that merely satisfied customers don’t suffice
to service companies and the assumption that satisfaction comes with loyalty
is incorrect (Deming 1986; Jones and Sasser 1995). The evidence from Bain
and Company showed that around 65 to85 percent of the satisfied customers
will defect from the company (Oliver 1999). The result from automobile
industry also showed that among the 85 to 95 percent of the satisfied
customer, only 30 to 40 percent return (Oliver 1999). The relationship
between customer retention and profits has been estimated by many
researchers (Anderson and Sullivan 1993; Fomell and Wemerfelt 1987;
Reichheld and Sasser 1990) and found positive.
Zeithaml et al (1996), identified five dimensions to behavioral
intentions such as loyalty to company (loyalty), propensity to switch (switch),
willingness to pay more (pay more), external response to problem (external
response), and internal response to problem (internal response). To measure
the above dimensions an instrument with 13 items divided among 5
dimensions is used. The loyalty (with five items) and pay more (with two
items), Switch (with two items) and external response (with three items),
internal response, contains just one item are used to measure behavioral
intentions. Bloemer et al (1999) raised a number of conceptual and empirical
criticisms of the Behavioral-Intentions Battery that inter-dimensional overlap
is occurring among “external response to a problem” and “internal response
to a problem” as well as “propensity to switch” and “willingness to pay more.
Empirically, they claimed that the use of a single-item measure, “internal
response to a problem”, should be avoided.
Bloemer et al (1999) developed a scale to measure service loyalty
using the dimensions Word-of-mouth, Purchase intentions, Price sensitivity,
and Complaining behavior. Ravichandran et al (2010) used a 13 item scale
under four dimensions namely Attitudinal Loyalty, Switching propensity, Pay

62
more Sum and External and Internal response and measured behavioral
intentions in the Indian banking context.
The measurement behavioral intentions are commonly done in the
qualitative manner seeking responses from the customer regarding indicators
that are capable of extracting various intentions of the customer. The scope of
measurement with regard to behavioral intentions is to limited actions such as
loyalty, switch over, positive word of mouth and complaint nature. In this
study set of validated questions were used to measure this construct.
2.7 PREVIOUS STUDIES ON CUSTOMER EXPECTATION,
SERVICE QUALITY, CUSTOMER SATISFACTION AND
BEHAVIORAL INTENTIONS
Dabholkar et al (2000), presented a comprehensive model of
service quality which attempted to examine antecedents, consequences, and
mediators of service quality for better understanding of concepts. This model
analyzed some of the relevant factors related to service quality as components
or antecedents and the relationship of customer satisfaction with behavioral
intentions (Figure 2.5).
Figure 2.5 Antecedents and mediator model

63
Christopher White and Yi-Ting Yu (2005), conducted a study to
develop and refine the theoretical framework behind consumer satisfaction
emotions. The study suggested that satisfaction emotions were best
conceptualized as a three-dimensional construct that included positive,
negative and “bi-directional” emotions. Moreover, a positive statistically
significant relationship between “bi-directional” emotions and consumer
complaining behavior was established through correlation analysis. The study
indicated that satisfaction emotions can be conceptualized as a three-
dimensional construct of: positive emotions (hopeful, happy, positively
surprised); negative emotions (guilty, humiliated, depressed); and bi-
directional emotions (angry, disappointed). The researchers used the term “bi-
directional” to accommodate the position when customers exhibit angry and
disappointment with themselves for consuming the service, and at the same
time be angry and disappointed with the service provider for failing to satisfy
their needs.
Festus Olorunniwo et al (2006), conducted a study to investigate,
through the development of an operationalized service quality construct in the
context of a service factory, whether the typology to which a service belongs
may explain the nature of the service quality (SQ) construct and its
relationship to customer satisfaction (SAT) and behavioral intentions (BI).
The study revealed that the dominant dimensions of SQ construct in the
service factory were found to be: Tangibles, Recovery, Responsiveness, and
Knowledge. Further results indicate that, although the direct effect of SQ on
BI is significant, the indirect effect (with SAT playing a mediating role) was
stronger driver for BI in the context of the service factory.
Birgit Leisen Pollack (2009), had attempted to study the linking of
hierarchical service quality model developed by Brady and Cronin (2001),

64
to customer satisfaction and loyalty. A conceptual model was developed
where service quality was antecedent to customer satisfaction and loyalty
(Figure 2.6). The results confirmed the ability of HSQM to generate
satisfaction and loyalty.
Fomell and Wemerfelt (1987), developed the concept of offensive
effects (capturing new customers) and defensive effects (retaining customers)
for the analysis of financial impact on service quality. Determining the
offensive impact of service quality was found similar to advertising-sales
relation. Service quality's effect’s— similar to advertising's effects—was
cumulative, and therefore evidence of the link developed slowly. And, similar
to advertising, service quality, pricing, advertising, efficiency, and image
simultaneously influenced profits. Furthermore, spending on service quality
alone does not guarantee results, because strategy and execution must both be
considered. On the other hand, evaluating the defensive impact of service
quality through customer retention had impact on service quality.
However, the results suggested that the significance of various
service quality dimensions differs depending on the type of service. The
services considered for the study were Local telephone services being more
equipment-based and hairdresser/barber services being people-based. The
findings suggested that the importance (significance) of sub dimensions and
primary dimensions were service dependent. For instance, the main drivers of
interaction quality for the phone service were attitude and behavior while
attitude and expertise were important for the hairdresser/barber service.
Interaction quality, physical environment quality and outcome quality were
the primary dimensions of overall service quality for both services. Outcome
quality emerged as the most important dimension.

65
Figure 2.6 Service quality as antecedent to customer satisfaction and
loyalty
Source: Birgit Leisen Pollack (2009)
Le Blanc and Nguyen, (1988), developed a model where, Service
quality was related to the degree of customer satisfaction derived from the
service offering (Figure 2.7). Customer service was the most important factor
in explaining service quality in financial institutions. Service quality depends
on the tangible characteristics (contact personnel, the internal organization
and physical environment) associated with the service offering or on the
performance of the service provider.

66
Figure 2.7 Model developed by Le Blanc and Nguyen
Source: Le Blanc and Nguyen (1988)
Oh (1999), proposed an integral model for service quality,
customer value and customer satisfaction focusing on post purchase decision
process. The key variables such as perceptions, service quality, consumer
satisfaction, customer value and intentions to repurchase were incorporated in
the model. Finally word of mouth communication was conceptualized as a
direct, combined function of perceptions, value, and satisfaction and
repurchase intentions. The model provided evidence that customer value has a
significant role in customer’s post-purchase decision-making process and
formed an immediate antecedent to customer satisfaction and re-purchase
intentions. Results also indicated that perceived price has a negative influence
on perceived customer value and no relationship with perceived service
quality.
Ugur Yavas et al (1997), conducted a study to investigate the effect
of service quality on customer satisfaction, complaint behavior and

67
commitment. The study was conducted in Turkish banking sector.
SERVQUAL instrument covering conventional five dimensions with seven-
point scales ranging from “Much worse than I expected” to “Much better than
I expected”, was used to evaluate the performances of bank. Satisfaction was
operationalized by a five item measure. These items related to the five
dimensions of SERVQUAL. After defining each dimension, respondents
were asked to rate their level of satisfaction on that dimension on a five-point
scale ranging from “very satisfied” to “very dissatisfied”. Respondents’
complaint behaviour was operationalized by two questions relating to two
forms of complaint, private response and voice response. Specifically, on
five-point balanced scales ranging from “very likely” to “very unlikely”,
respondents were asked to indicate the likelihood with which they would
complain to a bank’s employees and other consumers when experiencing a
problem with their bank’s services. Two questions were used to
operationalize commitment (e.g. consumers’ intentions to continue to do
business with their bank).The results of the study indicated that tangibles,
responsiveness and empathy are significant predictors of consumer
satisfaction. Of those three attributes, tangibles and responsiveness are also
significant antecedents of commitment. Empathy was the only attribute with a
significant relationship with complaint behaviour.
Gour C. Saha and Theingi (2009), examined the relationships
among the constructs of service quality, satisfaction, and behavioural
intentions in passengers of three low-cost carriers (LCCs) offering airline
services in Thailand. The study revealed that the order of importance of the
dimensions of service quality tested were flight schedules, flight attendants,
tangibles and ground staff. Passenger satisfaction with these service-quality
dimensions were found to be very important in explaining behavioural
intentions. Satisfied passengers are mostly influenced by the schedule. Such
customers engage in positive word-of-mouth communication and have high

68
repurchase intentions. Dissatisfied passengers prefer to change airlines, rather
than provide feedback to the LCCs. Analysis of the relationships among
service quality, satisfaction, and behavioural intention revealed that
satisfaction plays a direct role in enhancing passengers’ intentions to become
involved in word-of-mouth activities and repurchase. However, satisfaction
had a weaker correlation with the provision of feedback; unsatisfied
customers tended to move to other airlines. Passengers who engaged in word-
of-mouth activities were found to become loyal customers subsequently.
Having satisfied passengers was thus shown to be important in developing
loyal passengers.
Huseyin Arasli et al (2005) conducted a study to measure the
service quality perceptions of Greek Cypriot bank customers and to examine
the relationship between service quality, customer satisfaction and positive
word of mouth. The study revealed that SERVQUAL scale proved to be of a
three-dimensional structure. Results revealed that the expectations of bank
customers were not met and the largest gap was obtained in the
responsiveness-empathy dimension. Reliability items had the highest effect
on customer satisfaction, which in turn had a statistically significant impact
on the positive word of mouth
Wen-Bao Lin (2009), studied the effect of the difference between
the consumer’s expectation and perception of service quality on post-
purchase behavior intentions and the effect of the consumer’s personality
traits and the enterprise’s service recovery strategy as intervening variables on
post-purchase behavior intentions of consumers. The study was conducted
among customers of various banks in Taiwan. The result indicated that the
smaller the difference between expectation and perception of service quality,
the more the consumers will show their loyalty in post-purchase behavior; the
bigger the difference between expectation and perception of service quality,

69
the more the customers will make complaints and convert to other brands.
When the difference between customer expectation and perception of service
quality increases, then the personality trait of external control orientation may
prevail over the personality trait of internal control orientation. The following
model was developed for the purpose of the study (Figure 2.8).
Figure 2.8 model developed by Wen-Bao Lin
Source: Wen-Bao Lin (2009)
The conclusions from the above study were found to have
significance in developing strategies for customer loyalty. It was observed
that when banks narrow the gap between the expected and perceived service
quality level by promotion activities and other methods, consumers show
more loyalty and other positive behavior intentions. Service providers should
motivate positive behavior of consumers by favorable deployment of various
marketing mixes. As for the influence of personality traits, consumers with
external-control character tend to manifest negative behavior when the

70
difference in expected and perceived service quality was more prominent.
However, when the difference in expected and perceived service quality was
narrow, personality traits had no significant intervening effects on behavior
intentions, but some other factors, such as goodwill and purchase habit had
greater intervening effect.
Uppal and Bishnupriya Mishra (2011) conducted a study to
analyze the widening gap between desirability and availability regarding
reliability, accuracy, confidentiality, flexibility, e-channels, high attention to
customers, low service charges and overall satisfaction of customers in three
bank groups i.e. public sector banks, Indian private sector banks and foreign
banks. The study concluded that desirability regarding reliability, accuracy,
confidentiality, flexibility, e-channels, high attention to customers, low
service charges and overall satisfaction is much higher than the availability.
This gap causes dissatisfaction among the customers and to some extent the
customers are shifting from one bank to another due this reason.
Riadh Ladhari (2009), attempted to develop and test a conceptual
model of the relationships among the constructs of “service quality”,
“emotional satisfaction”, and “behavioural intention” in the hospitality
industry. The study proposed a conceptual model (Figure 2.9) with service
quality positively related to consumers’ emotions, behavioural intentions.
Also consumers’ emotions were positively related to behavioural intentions.
Moreover, the model postulated that emotional satisfaction partially mediates
the effect of service quality on behavioural intentions. The results confirmed
that service quality exerts both direct and indirect effects (through emotional
satisfaction) on behavioural intentions. In this study, satisfaction was posited
as having both a cognitive component and an affective component. The
cognitive component (referred to as “perceived service quality”) refered to a
customer’s evaluation of a series of service attributes that constitute a service

71
performance. The emotional component (referred to as “emotional
satisfaction”) consisted of such emotions as anger, contentment, happiness,
pleasure, irritation, and disappointment.
Sang-Lin Han and Seung Baek (2004) conducted a study to
investigate the usefulness and applicability of SERVQUAL in measuring
online service quality and its relationships to customer satisfaction and
customer retention. The results of the study confirmed that service quality had
positive impact on customer satisfaction and, the level of customer
satisfaction influenced the level of customer retention and that service quality
emerged as antecedent to customer satisfaction and retention
Figure 2.9 Model developed by Riadh Ladhari
Source: Riadh Ladhari, 2009

72
A review of all the models linking critical variable in the
framework concluded that perceived quality significantly develops customer
satisfaction and leads to loyalty intentions. In most of the studies perceived
service quality is conceptualized as multi dimensional one with distinct
dimensions.
2.8 SUMMARY
The observations from the literature revealed that there exists a
recognized importance for better service quality in the banking industry,
which can be achieved only through better product offerings and value-added
services. The critical factors that accounts for such an emergency in quality
improvement are listed as, intensity of competition, changes in government
regulations and level of technology adoption tendencies. To remain
competitive in today’s environment (Angur et al 1999) service quality offers a
distinct marketing edge to banks since improved levels of service quality are
related to higher revenues, increased cross-sell ratios, higher customer
retention , loyalty intentions of the customer, word of mouth advertising,
higher market shares and lower operating costs.
The literature on service quality exposed several areas that need
immediate attention to operatonalize the concept in the Indian scenario. The
role of customer expectation, documented in the SERVQUAL concept as
component that measures service quality, even though initiated lot of debate,
needs re-examination. The scope of considering expectation and perception as
two different constructs in the nomological framework having clear cause-
effect relationship requires an empirical testing. Prior research considering
expectations as the antecedent to service quality perceptions in the Indian
context in the contemporary settings emerged as void that demands attention.
Also the conceptualization of expectation construct demands a fresh approach

73
as the current customers are likely to expect more and with adequate service
customer alone, retention will not be easy in the banking context where scope
of differentiation is limited now. Hence an enquiry about desired expectation
levels of customers on selected attributes related to service are essential to
offer better service aimed at customer loyalty.
Even though literature on service quality considered various
dimensions that are significant in the conventional format as well as emerging
virtual format, a clear gap is visible in the in the Indian context especially in
kerala, the first ‘total banking state’ in the country, with the unique distinction
of each household in all the 14 districts having at least one bank account and
banking facilities available within the reach of people everywhere. The need
to develop and validate a scale capable of capturing the existing trends of the
customers of this state emerged as a serious issue to be addressed.
The theory regarding customer satisfaction demands a conceptual
exploration as most of the studies have considered customer satisfaction as
similar to service quality and the dimensions used to measure both constructs
had similarity. The studies either attempted to quantity satisfaction into a
score or just evaluated the empirical linkage with perceived service quality
and other variables of interest to customer feelings. The multi dimensional
perspective of customer satisfaction as higher order construct requires to be
tested for empirical evidence. There exists a visible shortage in the body of
knowledge related to the behavioral intentions construct. Most of the previous
studies attempted to assess the loyalty intentions of the customer alone.
The available literature presents two conflicting views regarding
the relation between perceived service quality and satisfaction construct.
Literature does not clearly explain the causal ordering of perceived service
quality and satisfaction. One school of researchers believes that Customer

74
satisfaction is antecedent to Service quality. Whereas the other group of
researchers argued that Service quality is antecedent to Customer satisfaction
and that a positive Service quality perception can lead to customer
satisfaction resulting in positive Behavioural Intentions (Brady and Robertson
2001). A third perspective forwarded by Taylor and Cronin, 1994, believes
that neither of the above two constructs is an antecedent of the other.
However, Dabholkar (1996) reiterates that the antecedent role of each
construct is consumer specific. If the consumer who is cognitive oriented, he
or she will perceive the relationship as service quality being antecedent to
satisfaction and if the consumer was affective oriented then he or she will
perceive that satisfaction causes positive perceived service quality.
In brief the literature review could provide a clear direction in
which the theory needs to be developed to cover various gaps observed.