Embed Size (px)
Citation preview
13
CHAPTER 2
LITERATURE REVIEW
21 Waste
Coined as the by-product of human activity waste is any material or product that has
no value in the perception of the generator or the consumer (Agamuthu 2001) In
todayrsquos economy waste plays a significant role with the ever increasing problem of
sustainable waste management Conversely the amplified volume of solid waste in
the past decades grounds from rapid population growth urbanization economic
development industrialisation and affluence (World Bank 2012) Solid waste is
commonly generated by human and animals which are normally solid and discarded
There are four main categories of solid waste (1) MSW which includes household
waste commercial waste and institutional waste (2) Hazardous waste which also
includes clinical waste (3) Agricultural waste and (4) Industrial waste (Agamuthu
2001) MSW is the largest contributor to the waste stream and the biggest problem
faced by the growing urban cities
22 Waste Generation
221 Global
The world population is expected to grow by one-third by 2030 in sync with the
doubling of the worldrsquos economy Higher income level and standard of living have
paved the way to the rise in MSW generation in the recent decades Statistics
14
provided by the World Bank (2012) indicates that the current global MSW generation
rate by its 3 billion residents is estimated at 13 billion tonnes per year and is expected
to ascent to 22 billion tonnes with 46 billion residents by the year 2025 Countries
from the Organisation for Economic Co-operation and Development (OECD 2013)
produced almost half of the worldrsquos waste while Africa and South Asia regions
produced the least waste The table below shows the per capita generation of MSW in
different countries and cities around the world (Table 21)
Table 21 Per capita generation of waste in different countries and cities
Country
Waste generation
(kgpercapitaday)
References
United States of America (USA) 196 World Bank (2012)
Sweden 140 OECD (2008)
Germany 158 OECD (2008)
United Kingdom (UK) 154 OECD (2008)
Malaysia 130 Agamuthu amp Tanaka (2014)
Hong Kong China 133 Li et al (2009)
Mexico 068 Couth amp Trois (2010)
Chennai India 060 Esakku et al (2007)
Delhi India 047 Esakku et al (2007)
Sub-Saharan Africa 065 World Bank (2012)
15
From Table 21 it is evident that MSW generation is a function of affluence with the
per capita generation spanning a wide range from 047 to 196 kgcapitaday
following the economic status of the countries and cities
222 Malaysia
In Malaysia 65 of the total population currently lives in the cities and the
urbanisation level has greatly influenced the MSW generation (Agamuthu et al
2009) In 1970rsquos Malaysia recorded an urbanisation rate of 268 and the figure rose
to 710 in 2010 (Compendium JPM 2012) With rapid development of urban area
rural-urban migration change in lifestyle and consumption pattern the MSW
generation has increased by more than 91 over the past decades (Agamuthu et al
2009) The daily generation of waste escalated from 22544 tonnes in 2003 to 33000
in 2013 marking a 46 hike in just 10 years (Agamuthu amp Tanaka 2014 KPKT
2013) Table 22 shows the trend in waste generation in Malaysia by states from 2003
to 2012 (KPKT 2013 Fauziah 2009)
16
Table 22 Daily generation of MSW in Malaysia from 2003 to 2012 (KPKT 2013)
Year State 2003 2006 2009 2012
Johor 2199 2475 2549 3005
Kedah 1520 1711 1762 2078
Kelantan 1188 1337 1377 1623
Melaka 590 664 684 808
Negeri Sembilan 869 978 1007 1188
Pahang 1099 1236 1273 1502
Perak 1753 1973 2032 2397
Perlis 224 252 260 307
Pulau Pinang 1248 1405 1447 1707
Selangor 3245 3653 3763 4435
Terengganu 1013 1140 1174 1385
Wilayah Persekutuan
Kuala Lumpur
Putrajaya
Labuan
2965 3337 3437 3965
Sabah 2641 3002 3092 2137
Sarawak 1982 2210 2276 2028
Total 22544 25372 26134 28565
17
23 Waste composition
The MSW composition varies from one country to another and is the pre-determinant
factor for sustainable waste disposal method In Malaysia organic waste dominates
the waste stream by more than 40 and it mainly consists of kitchen waste and food
waste (Agamuthu et al 2009) Similar results were found from a study done in China
by Yuan et al (2006) where the MSW was also dominated by waste with high
organic and moisture content and makes up to approximately 60 of the total MSW
However this is in contrast with many developed and industrialised countries whorsquos
waste consist more of recyclable and bio-degradable organic waste (Zhang et al
2010) For example in Western Europe the waste composition features a high
percentage of paper and plastic (Zhang et al 2010) From the World Bank report
(2012) it is further deduced that the low income countries make up for 64 and 5
of organics and paper in their MSW whereas in the high income countries it is 28
and 31 respectively Higher income countries have applied many techniques to
tailor suite its own unique waste management system This is to manage various
components of waste streams in a flexible manner Figure 21 shows the waste
composition in countries with different income level with comparison to Malaysia
Malaysia which is categorised as a middle income country has lower amount of
organic waste compared to the statistics of the middle income country However in
Malaysia the plastic waste is still mushrooming due to lack of awareness and NIMBY
attitude by many manufacturers and end users
18
Figure 21 Waste composition by Income level (a b c) and in Malaysia (d) (KPKT
2013 and World Bank 2012)
24 Solid waste management
The need for sustainable waste disposal operation within a country has a ripple effect
as it drives legislation action by the authorities and new technical and technological
innovations (Agamuthu et al 2009) In the European Union (EU) countries
comprehensive policies and regulations regarding waste management were introduced
as early as the 1990rsquos The Landfill Directive of 1999 by EU limits the amount of
19
waste going to the landfill and newly constructed landfill must be equipped with
liners and gas capture systems (ISWA 2009) However in majority of developing
countries the development of modern and sustainable system of waste management is
frequently delayed due to the scarcity in policy implementation political set-up as
well as for some technical and economic reasons A similar scenario was observed in
Malaysia After a 10 year debate on the solid waste bill the Government of Malaysia
approved The Solid Waste amp Public Cleansing Management (SWPCM) Act in 2007
The Act transferred the responsibility of solid waste management from the state
government and local authorities (LArsquos) to the Federal Government to implement an
integrated solid waste management system (Agamuthu et al 2009) This Act is
expected to bring new challenges and major changes in solid waste management in
Malaysia
25 Waste management practices
A wide range of waste management methods have been practiced to address the
growing demand in waste disposal Many factors like technology advancement
economic sustainability policies environmental and health benefits waste capacity
waste composition and climate conditions are considered in choosing the best waste
management practices At the same time the general perception that waste
management still pose considerable environmental threats is inevitable although waste
management practices have evolved significantly over the last decades (Polettini
2012)
20
The waste management options practiced are often classified in a waste management
hierarchy following an order of the least impactful to the environment to the most
(Raina 2010) The waste management hierarchyrsquos usage dated back to 1970rsquos during
the Ontariorsquos Pollution Probe (World Bank 2012) and started with the use of 3Rrsquos
(reduce reuse recycle) as well as the edition of the latest R ndash recovery In this
hierarchy waste prevention or reduction is given the highest priority while disposal
methods such as landfilling and incineration are the least preferred
Waste prevention and reduction refers to reducing waste at the source which includes
reusing products donating items buying in bulk redesigning products and reducing
packaging The recycling and composting practice focuses on activities such as
collecting sorting and processing the recyclable products as well as composting of
food waste and yard trimmings In energy recovery the conversion of non-recyclable
waste material into heat electricity and fuel through many waste-to-energy (WTE)
processes Although landfilling and incineration are the most widely used disposal
method globally it is still the least preferred waste management practice due to its
environmental impacts (USEPA 2012) Figure 22 shows the waste management
hierarchy in an inverse triangle image The larger the portion of the triangle the
higher the priority that is given to that waste management practice
21
Figure 22 The waste management hierarchy (USEPA 2012)
Figure 23 shows the common waste management practices in few countries around
the world in year 2008 (OECD 2008) In Germany 47 of the MSW was recycled
while another 32 was incinerated Only 06 of the MSW was sent directly to the
landfills In countries like France Italy Japan UK and the USA recycling rates were
recorded from 17 to 25 (OECD 2008) Stringent legislation regulations and
policies such EU directives and Zero Organic Waste to Landfills Policy have paved
the way to the more environmentally sound strategies for MSW disposal in most of
the EU countries (ISWA 2009) While in Japan land scarcity has made them depend
on incinerators to dispose their waste However even with many environmentally
sound waste management options landfilling still remains as the main option for
MSW disposal in many countries In countries like the USA UK China Italy and
many other developing nations landfills are the final waste disposal sites as it is the
cheapest and easiest method to adhere (SivaShangari amp Agamuthu 2013 OECD
2008)
22
26 Climate change and waste
Climate change has become a hotly debated global issue The increase in GHGs
emission and global warming has been given the utmost importance to understand
mitigate and adapt to climatic changes occurring around the world Also the
initiation of the International Treaty of Kyoto Protocol in 1997 and its enforcement in
2005 established a worldwide cooperation in GHGs reduction (UNFCCC 2012)
Following this was other important climate negotiations which outlined action plans
like The Bali Road Map in 2007 Copenhagen Accord in 2009 Cancun Agreement in
2011 Durban Outcomes in 2012 and the latest Doha Climate Gateway in 2013
(UNFCCC 2014) All these talks and action plans were targeted at reducing GHGs
0
20
40
60
80
100
China France Germany Italy Japan UK USA Malaysia
Waste Management practice (as of total MSW)
Other Methods Landfilling Incineration Composting Recycling
Figure 23 Waste management practices in various countries (SivaShangari amp
Agamuthu 2013 OECD 2008)
23
emissions and turning down the projected global temperature increase of 4˚C to only
2˚C climate goal (UNFCCC 2012 ECOFYS 2010) The industrialised countries or
popularly known as the Annex 1 countries as well as the seven major emerging
economies of non-Annex 1 countries (Mexico Brazil China India Indonesia Korea
and South Africa) have pledged to reduce their GHGs emissions between 17 to 40
as compared to the year 2005 or their business as usual (BAU) level (COP15 2009
ECOFYS 2010) Malaysia too in the Global Climate Change Summit (COP15) had
pledged to voluntarily reduce CO2 intensity up to 40 by 2020 as compared to 2005
levels (COP15 2009) This had subsequently paved the way to the formulation of the
National Green Technology Policy in 2011 which focused on energy buildings waste
and transportation (KeTTHA 2013)
As for the GHG emissions from the waste sector it only denotes to 3-5 of the total
global GHG emissions (World Bank 2012 Bogner et al 2007) Although the
quantity seems trivial there is now credible evidence that taking into account the
associated avoided emissions the waste sector can move from being a minor source
of emitter to becoming a major saver of emissions (UNEP 2010) It is a known fact
that every waste management practice generates GHG both directly from emissions
and indirectly through energy consumption Nevertheless the overall climate benefit
or impact of the waste management practices will depend on net GHGs accounting
for both emissions and indirect downstream GHG savings Table 23 depicts the
results by Polettini (2012) on several waste management practices and its GHG
emissions and savings
24
WM
Practices
Indirect
(upstream) Direct Indirect (downstream)
Waste
reduction
reuse
recycling
E Fuel used in the
facility
E Consumption of
heat and electricity
E Materials used
in facility
construction
E Transportation
of materials to the
facility
E GHGs from fuel
combustion
S Avoided emissions from substituted
raw materials (-390 kg CO2-eq tonne-1
ww observed in Germany)
S Avoided emissions from avoided use
of harvested wood
E Transportation of recovered materials
for reuserecycling
E Transportation of residues for
treatmentfinal disposal
Mechanical
biological
treatment
E Fuel used in the
facility
E Consumption of
heat and electricity
E Materials used
in facility
construction
E Transportation
of materials to the
facility
E GHGs from fuel
combustion
E Constituents of
biogas from waste
degradation
(aerobic
anaerobic)
S Avoided emissions from biogas use
for energetic purposes (-103 kg CO2-eq
tonne-1
ww observed in Germany)
S Avoided emissions from materials
recycling
S Avoided emissions from compost use
as a substitute of soil growth media
S Carbon storage in compost
E Treatment of the off-gases and
leachate
E Transportation of recovered materials
for recycling
E Transportation of residues for
treatmentdisposal
Thermal
treatment
E Fuel used in the
facility
E Consumption of
heat and electricity
E Materials used
in facility
construction
E Transportation
of materials to the
facility
E GHGs from
thermal waste
conversion
S Heatelectricity from substituted
fossil fuels (-563 kg CO2-eq tonne-1
ww
observed in Dermark)
S Avoided emissions from recovered
metals from the ash
S Avoided emissions from use of ash as
a substitute of natural aggregates
E Transportation of recovered materials
for recycling
E Treatment of residual ashes
E Transportation of residues for
treatmentfinal disposal
S Carbon sequestration by residual
ashes
Traditional
landfilling
E Fuel amp energy
used at the landfill
site
E Materials used
in landfill
construction
E Transportation
of materials to the
facility
E Constituents of
LFG from waste
degradation (+454
and +346 kg CO2-eq
tonne-1
ww in
Greece and Poland)
E GHGs from fuel
combustion
E Emissions from
leachate treatment
S Avoided emissions from LFG
combustion
S Carbon storage within the landfill
body
S Advanced CH4 oxidation in active
covers
Footnote E ndash Emission S ndash Savings (+) = Emission and ( - ) = savings ww ndash wet waste
Table 23 Waste management practices and GHG emissions and savings adapted from
(Polettini 2012 Gentil et al 2009)
25
Currently the OECD countries generate the highest levels of methane However the
developing nations are anticipated to increase significantly as better waste
management practices lead to more anaerobic methane producing conditions in
landfills (UNEP 2010) Landfilling especially in developing countries like Asia
South America and Africa are reported to contribute about 37 million tonnes of CO2-
eq or 40 of the annual CH4 emission (Bogner et al 2007) Global CH4 budget
from year 2000 to 2009 for agriculture and waste was between 187 to 224 Tg(CH4) y-1
These anthropogenic emissions are from paddy agriculture ruminant livestock
landfills man-made lakes and wetlands and waste treatment (IPCC 2013)
27 Landfilling as a MSW disposal option
Landfilling is the most widely used and economically viable solution for final
disposal of MSW in many countries around the world High cost of treatment and
comparative disposal alternatives are a major reason for the reliance on MSW
landfilling particularly in developing countries (Laner et al 2012 Brunner amp Fellner
2007) Similarly in Malaysia 85 of the daily collected MSW is landfilled while
only 15 are recycled (Agamuthu et al 2009) Based on a report by the Malaysian
Ministry of Urban Wellbeing Housing and Local Government (KPKT 2012) there
are a total of 296 landfills in Malaysia in 2012 with 56 of landfill in Malaysia are
currently in operation (Table 24) Out of this total only 8 are sanitary landfills
equipped with adequate high density polyethylene (HDPE) liner gas capture wells
and leachate treatment ponds The rest of it are common landfills or mere dumpsites
with could pose great danger to the adjacent residents or water supply
26
Table 24 Total landfills in Malaysia according to the states (KPKT 2012)
State Operational landfills Non-operational landfills Total
Johor 14 23 37
Kedah 8 7 15
Kelantan 13 6 19
Melaka 2 5 7
Negeri Sembilan 7 11 18
Pahang 16 16 32
Perak 17 12 29
Perlis 1 1 2
Pulau Pinang 2 1 3
Sabah 19 2 21
Sarawak 49 14 63
Selangor 8 14 22
Terengganu 8 12 20
WP Kuala Lumpur 0 7 7
WP Labuan 1 0 1
Total 165 131 296
271 Non-sanitary landfills and dumpsites
Non-sanitary landfills or also known as tip dumpsites and dumping ground are in
abundance around the world These landfills are often used as burial areas for waste
27
and is closed with some soil when the height of waste reaches a desirable maximum
at the site (Themelis amp Ulloa 2007) These types of landfills are neither engineered
with any liner system leachate treatment ponds nor gas collection facility and pollute
the local environment through bad odour and ground and surface water
contamination In a study by Manfredi et al (2009) open dumpsites in European
countries produce 100 tCO2-eq of LFG for per tonne of wet waste
272 Sanitary landfill
Sanitary landfills are modern landfills which are well-engineered designed operated
monitored and located away from residential areas These landfills are constructed in
accordance with the government regulations to ensure the safety of people and the
environment Among the common regulations administered for a sanitary landfill are
location restriction artificial liner requirements leachate collection and removal
systems gas collection and control system groundwater monitoring system as well
as closure and post closure requirement for the landfill (USEPA 2012) Barton et al
(2008) concluded that sanitary landfills in developing countries could produce up to
148 tCO2ndasheq of LFG for per tonne of wet waste Figure 24 shows a sanitary landfill
28
Figure 24 A sanitary landfill (USEPA 2012)
28 Landfill Output
The organic compounds in the MSW are converted to gaseous or liquid states by
undergoing various chemical and biological transformation (Wang et al 2012) The
decomposition of MSW with the presence of rain water produces landfill gas (LFG)
leachate and other inert solid waste as the primary output Organics in the solid waste
decomposes to produce LFG which contains CH4 CO2 and other trace amounts of
toxic substances (Park amp Shin 2001) Conversely landfills are also known as long-
term sink for carbon sources (Bogner et al 2007) Previous studies by Bogner (1992)
and Barlaz (1998) estimates that a minimum of 50 of the organics landfilled is not
converted to LFG but still remains in the landfill This condition is due to the presence
of inert organics slowly degrading cellulose and hemicellulose and biologically
29
recalcitrant (lignin) constituents within the MSW landfilled (Polettini 2012 Bogner
et al 2007)
29 Landfill gas
291 Landfill gas generation
The MSW buried in landfills are subjected to physical chemical and biological
processes in which the biodegradable fractions decompose in an anaerobic condition
through a complex series of microbial and abiotic reactions (Wangyao et al 2010)
Accordingly the biodegradation of organic waste takes place in five stages and leads
to the production of landfill gas (LFG) The 5 stages are (1) aerobic (hydrolysis and
aerobic degradation converting ready degradable carbohydrates to simple sugars
carbon dioxide (CO2) and water (H2O)) (2) acidogenic (hydrolysis and fermentation
of simple sugars to solute volatile acids) (3) acetogenic (conversion of soluble acids
to acetic acids hydrogen (H2) and CO2) (4) methanogenic (methane (CH4) generation
bacteria metabolizes acetate and forms CH4 and CO2 ndash LFG) (5) aerobic (oxidation of
CH4 with the re-establishment of aerobic conditions)(Couth et al 2011 Environment
Agency 2004) The stages above can be simplified in a formula to represent the
maximum amount of LFG generation as below (Nickolas amp Priscilla 2007)
Figure 25 shows the flow chart of the process
30
Waste organic fraction
Hydrolysis
Aerobic degradation
Hydrolysis and
Fermentation
Acetogenesis
Methanogenesis
Oxidation
CO2H2O
Organic acid
H2CO2H2OA
mmoniacal
nitrogen
Acetic acid
H2CO2
CH4CO2
CO2
Processes Products Gases Leachate
Stage I
Aerobic Aerobic
Anaerobic Anaerobic
Stage II
Stage III
Stage IV
Anaerobic Anaerobic
Aerobic Aerobic
Stage V
292 LFG Composition
Abichou et al(2004) and Humer amp Lechner (1999) denoted that the biological
decomposition of one tonne of MSW will produce approximately 160 msup3 to 250msup3 of
LFG LFG is composed by a mixture of gases compound as shown in Table 25 In
general more than 50 of the LFG is CH4 followed by CO2 between 40 to 60 and
Figure 25 The major stages of waste degradation in landfills (Williams 2005)
31
other trace amounts of various chemical compounds (Hegde et al 2003) Although
CO2 is produced in landfill it is said to have neutral greenhouse effect due to its
biogenic origin Its generation in a landfill is also negligible compared to other CO2
producing sectors such as industry energy and transportation (Polettini 2012)
Table 25 The composition and characteristics of LFG (ATSDR 2001
Tchobanoglous et al 1993)
Component Volume () Characteristics
CH4 45 - 60 Is colourless odourless and naturally produced
gas
CO2 40 - 60 Is colourless odourless and slightly acidic
Nitrogen (N2) 2 - 5 Is colourless odourless and tasteless The major
contributor to atmospheric gas (79)
Oxygen(O2) 01 - 1 Is colourless odourless and tasteless The
second major contributor to atmospheric gas
(21)
Ammonia (NH3) 01 - 1 Is a colourless gas with a pungent odour
Non-methane organic
compounds
(NMOCs)
001 ndash 06 Is an organic compound that forms naturally or
through synthetic chemical processes
Sulphides 0 - 1 Is a naturally occurring gas with a smell like
rotten-egg
Hydrogen (H2) 0 ndash 02 Is an odourless and colourless gas
Carbon Monoxide 0 ndash 02 Is an odourless and colourless gas
Inversely CH4 is a more significant GHG in the landfill Given a time horizon of 100
years CH4 has a global warming potential of 25 which means it is capable of
32
absorbing and trapping infrared radiation 25 times more as compared to CO2 and has
a longer residence time in the atmosphere (Pachauri amp Reisinger 2007) Globally
CH4 from landfills represent 12 of the total anthropogenic CH4 emission (World
Bank 2012) and the estimated release is between 35 and 69 Tg (CH4) y-1
(Bogner et
al 2007) In a separate report by IPCC (2013) landfills are responsible for almost
half of the CH4 emissions attributed by the MSW in 2010 In Malaysia where almost
85 of the daily generated MSW is landfilled 47 of national CH4 average is from
landfills (Agamuthu amp Fauziah 2012 NC2-Malaysia 2010)
293 Factors Influencing gas generation
The rate and volume of the LFG generated in landfills are influenced by several
factors According to Agamuthu (2001) the rates of LFG production depend on size
and composition of solid waste age of solid waste and landfill moisture content of
waste temperature conditions in landfill quantity and quality of nutrients organic
content of refuse pH and alkalinity of liquids in the landfill and presence of toxic and
hazardous materials in landfills Some of the factors are described further below
a) Waste composition The bacteria within the landfills feed on the organic
matter while decomposing The optimum ratio of organic matter (expressed as
chemical oxygen demand (COD) nitrogen (N) and phosphorous (P) is
100044008 (Christensen et al 1996) In addition nutrients and metal
supplements have a positive effect on the LFG production rate (Isci amp Demier
33
2007) Gas generation is also increased by the presence of putrescible
materials (Christensen et al 1996)
b) Age of refuse waste buried in the landfill within the recent years (less than
10 years) Peak gas production occurs between 5 to 7 years after the waste is
buried However small quantities of LFG may continuously be emitted from a
closed landfill for 50 or more years (ATSDR 2001)
c) Presence of oxygen O2 is considered as inhibiting for CH4 formation The
absence of O2 is important for the anaerobic bacteria to grow and convert solid
carbon to CH4 and CO2 (Christensen et al 1996)
d) Moisture content Rees (1980) had summarized that the LFG production rate
increases between 25 to 60 water content The increase of water content
limits O2 transport and facilitates CH4 production However saturated
moisture content hinders CH4 production (Christensen et al 1996 Rees
1980) While a moisture content of 40 or higher based on wet waste
promotes maximum gas production (ATSDR 2001)
e) Temperature Like many other microbial processes CH4 formation is highly
affected by temperature The warmer the temperature the higher the bacterial
activity which in turn increases the rate of LFG production At elevated
temperatures the CH4 production is more rigorous and produces more heat as
34
such is self-enhancing During the decomposition process the bacterial
releases heat which stabilizes the temperature of between 25˚C to 45˚C
(ATSDR 2001)
f) pH The methanogenic bacteria which produces CH4 as a metabolic by-
product operates efficiently only within a narrow pH range of 6 to 8
(Abushamamala et al 2009) The methanogenic ecosystem in the landfill is
rather delicate and a balanced relation between bacterial groups is crucial for
good CH4 production (Christensen et al 1996)
210 Impact of landfill gas emission
LFG contains H2 and CO2 in the initial phase of LFG production from the waste
degradation process but at the final stage it is mainly a mixture of CH4 and CO2
(Williams 2005) All these gases have generated several impacts to the environment
as well as human The impacts are felt at different scales of radius depending on its
severity as shown in Figure 26
35
2101 Greenhouse effect and global warming
At the end of the 20th
century and during the industrial era the concentration of the
global GHG(s) such as CO2 CH4 and N2O showed major hikes The CH4
concentration generally showed an increasing trend since pre-industrial years (Figure
27a) But a more comprehensive derivation magnified a decreasing growth rate of
CH4 from early 1980 to 1998 a stable growth rate period between 1999 and 2006 and
an increasing growth rate thereafter from 2007 to 2011 (Figure 27b) (IPCC 2013
Dlugokenly et al 2009 Rigby et al 2008) The current contribution of CH4 to
climate change forcing is 18 of the total radiative forcing by all long-lived GHG
Figure 26 Different scales of landfill effects (Scheutz et al 2009
Luning amp Tent 1993)
36
(Foster et al 2007) Radiative forcing denotes to a measure of energy balance of the
Earth-atmosphere system when factors that affect the climate are altered naturally or
by human
In a report by World Bank (2012) the GHG emissions from MSW have emerged as a
major concern as post-consumer waste is estimated to generate almost 5 that is
about 1460 metric ton CO2-eq of the total global GHG emissions Whereas the global
CH4 emissions from landfills are estimated to be between 500 to 800 metric ton CO2-
eq per year (USEPA 2006 Monni et al 2006 Bogner amp Mattews 2003)
Figure 27 Global average of CH4 from 1978 to 2011 and Figure 28 Instantaneous growth
rate of globally averaged atmospheric CH4 for the same period line colours represents
green-quarterly average red-monthly average blue-quasi weekly average (IPCC 2013
Dlugokenly et al 2009 Rigby et al 2008)
37
2102 Odour and weather impact
The odour from landfills caused by secondary emissions is a growing concern to the
area surrounding the landfill Since both CH4 and CO2 are odourless the stench
smells from the landfills often originate from other principal components of LFG such
as H2S and organic sulphur compounds (mercaptanes) (Sitiaishah 2011) Similarly in
a study by Bertacchi et al (1997) the main cause of odour in an Italian landfill was
identified as dimethyl sulphide and carbon sulphite In a case study done at Bisasar
Road Landfill in Durban South Africa the meteorological parameter such as
temperature relative humidity and rainfall were evaluated against the odour
complaint by the surrounding residents The number of complains had increased
during October to January (summer months) when the weather condition was hot
humid and wet (Stretch et al 2001) These results are shown in Figure 29
Figure 29 Temporal distribution of odour complaints and selected weather conditions
from January 1997 to February 2001 at Bisasar Road Landfill Weather data is not to scale
(Stretch et al 2001)
38
2103 Groundwater pollution
Landfill gas (LFG) migrating to the unsaturated zone surrounding the landfill is
exposed to infiltrating water The infiltrating of water is caused by rainfall water
present in the waste itself and water from biodegradation of waste CO2 and CH4 are
water-soluble (the solubility of CO2 is 2320 mg l-1
and only 30 mg l-1
for CH4 at
10˚C) Besides LFG leachate produced by the landfill also contains large amount of
contaminants such as heavy metals which are likely to cause groundwater pollution
In a study by Bundela et al (2012) in Jabalpur India the physico-chemical analysis
of groundwater adjacent to the landfill found that the total dissolved solids (TDS)
varied between 546 mgL to 907 mgL much higher than the permissible level of
India Therefore an engineered landfill with sound leachate removal and treatment
pond will be the best option to cater this sort of problem
211 Landfill CH4 mass balance controlling processes and factors
The landfill CH4 mass balance and quantity of CH4 emitted from landfills are affected
by many different processes It is important that the mass balance must be well
understood before a landfill is designed and properly engineered The processes of
CH4 mass balance are summarized in Figure 210 which shows the migration of CH4
through lateral direction recovery and emission
39
In an earlier study done by Bogner amp Spokas (1993) CH4 mass balance in the landfills
was expressed by the following equation
(all units = mass t-1
)
The CH4 mass balance associates CH4 generation to CH4 transport and microbial CH4
oxidation terms Lateral migration is usually qualitatively monitored at most landfill
sites to some extent using gas probes placed around the landfill perimeter The factors
affecting the transport processes of LFG leading to gas emission or migration in a
landfill are summarized in Table 26 Both ambient and internal factors greatly
Figure 210 Landfill CH4 balance
Lateral migration
CH4 emission
CH4 recovered
Gas well CH4
CO2
Landfill gas
O2 + CH4 = CO2
40
influence the LFG transfer processes Therefore it is well documented that landfill
CH4 emission and migration is controlled by a combination of factors and processes
Table 26 Factors affecting the LFG transport in a landfill (Scheutz et al 2009)
Factors
Meteorological conditions SoilColor conditions Waste amp landfill
conditions
Barometric pressure
Precipitation
Temperature
Wind
Cracks
Permeability
Diffusivity
Porosity
Moisture content
Organic content
CH4 oxidation capacity
Gas production rate
Internal barriers
Gas vents
Lateral Migration
Area
212 Quantification and estimation of LFG
LFG generation rates are currently estimated using mathematical models The input
parameters for these models are amount of waste landfilled for the calculated years
and in most models also a specific composition of the waste Most models calculates
CH4 generation potentials (Lo) degradable organic carbon (DOC) reaction constant
(k) and subsequently the CH4 generation released throughout the years However
some models consider the degradation of waste over the years or decade while some
do not Among the models widely used are the IPCC model the TNO-model the
41
GasSim model the LandGEM model the Alvalzorg-model and the French E-PRTR
model (Oonk 2010)
2121 The IPCC Waste Model
The LFG generation can be modelled empirically using zero-order first-order or
second-order generation model (Beh 2013) However studies have proved that
higher order model have near accuracies to the measured data (Amini et al 2012
Oonk 2010) Generally the first-order models are preferred as the second order
models are more complicated and are not justified by increase in accuracy (Oonk et
al 1994) The IPCC Model or better known as the IPCC Waste Model is based on a
FOD method In this model it is assumed that the degradable organic component in
the waste decays slowly for a few years or even decades During this process the
LFG containing mainly CH4 and CO2 is formed The rate of CH4 production depends
solely on the amount of carbon remaining in the waste provided the conditions within
a landfill remains constant (IPCC 2006) This model has a three tier hierarchy to
calculate estimates of CH4 emissions from solid waste disposal sites (Jensen amp
Pipatti 2006) The higher tier with good quality data estimates more accurate results
The tiers are explained further in Table 27 The tier three calculations are used if
countryrsquos specific data are available The main uncertainties within the model arise
due to the parameter used in this model rather than the method used
42
Table 27 The 3 tiers of the IPCC Waste Model
Tier Description
1 Estimation is based the IPCC FOD method using mainly default data and default
parameter
2 Uses IPCC FOD method and some default parameter and historical waste data
3 Methods are based on good quality country specific data and either uses FOD
methods with
i Nationally developed key-parameter
ii Empirical country-specific parameter with key parameter like half-life
and either methane generation potential (Lo) or DOC content in waste
and the putrescible fraction of DOC (known as DOCf)
This freeware model can be downloaded from the IPCC website and the main input
parameters are amount of waste and waste composition This model is used to
calculate the specific amount of CH4 from the landfill and accommodates four
different climate regions wet boreal or temperate dry boreal or temperate wet
tropical and dry tropical The climate region chosen determines the key parameters
used within the model such as half-life decay rate and degradable organic carbon
The equation used to calculate CH4 emissions in this model is as follow
Where the final amount of CH4 emitted depends on the amount of CH4 recovered and
oxidized by the cover layer (IPCC 2006) A number of studies have specifically
focused on the use of this model which have been carried out in many countries to
obtain a regional and national level CH4 emission estimation (Penteado et al 2012
Abushammala et al 2012 Couth et al 2011 Wangyao et al 2010 Machado et al
2009 Weitz et al 2008 Jha et al 2008)
43
2122 The TNO-Model
The Netherlands Organisation of Applied Scientific Research model or in short The
TNO ndash model describes the LFG generation as a function of amount of waste
deposited from different organics (household waste industrial waste etc) The
degraded organic carbon from waste is used to calculate the LFG produced This
single phase model was used by the Dutch to calculate and report the national
averages of CH4 emission In studies done by Oonk et al (1994) and Scharff amp
Jacobs (2006) CH4 and CO2 measurements from landfills were used to validate the
TNO-model Finally to calculate the CH4 production the LFG generated using the
TNO-model is multiplied with CH4 concentration of 50 and volumetric mass of
714g CH4 m-3
(Scharff amp Jacobs 2006) The formula for the TNO-model is as follow
(Thompson et al 2009)
Where
Q is CH4 production [kty]
DOCf is the fraction of assimilated DOC
M is waste generation [Mty]
DOC is the degradable organic carbon [kgtonne]
k is the decay rate [y-1
]
t is te time of waste disposal [y]
187 is the model multiplication factor
44
2123 The GasSim model
The GasSim model was developed for the Environment Agency of England and
Wales as a risk assessment tool to be used to evaluate the impact of LFG (Oonk
2010) This model quantifies LFG related problems within a landfill ranging from the
CH4 emissions the effects of utilisation of LFG on local air quality and LFG
migration via subsoil to adjacent buildings (Oonk 2010) The GasSim model does not
provide the complete set of equations Calculation modules within the program are
protected from sharing which makes it difficult to be used without purchasing the
software At present the LFG generated is based on the UK Waste Statistics The
principal input for this model is the amount of waste in megagrams (Mg) with the
specific breakdown of the waste into different categories and carbon content (Scharff
amp Jacobs 2006) The basic equation for this model is
2124 The LandGEM
The Landfill Gas Emission model or LandGEM was developed and widely used by
the United States Environment Protection Agency (USEPA) to calculate the LFG
emission from solid waste based on the USEPA standards The model uses the mass
of waste deposited and CH4 generation capacity to determine the mass of CH4 that is
being generated Mathematically LandGEM can be described using the following
formula
45
Where
QCH4 is CH4 emission rate [m3CH4y
-1]
k is CH4 generation constant [y-1
]
L0 is CH4 generation potential [m3CH4Mg waste
-1]
Mi is mass of waste in ith section [Mg]
Ti is age of the ith increment or section [y-1
]
Similar to the IPCC model the LandGEM is based on the FOD method and can be
used with the site specific data or default parameter in the absence of site-specific data
(USEPA 2004) This model too has been widely used by many researchers to
quantify the amount of CH4 generated in landfills (Sormunen et al 2013 Amini et
al 2012 Bella et al 2011 Kamalan et al2011 Tolaymat et al 2010 Cruz et al
2010 Thompson et al 2009 Scharff amp Jacobs 2006)
2125 The Afvalzorg ndash model
This model was developed by NV Afvalzorg in the Netherlands and is based on
combination of literature and own experiences with landfill gas generation (Oonk
2010) In this multi-phase model eight waste categories and three fractions were
distinguished (Scharff amp Jacobs 2006) For each fraction LFG production is
calculated separately The following equation describes the Afvalzorg model (Scharff
amp Jacobs 2006)
46
Where
αt is LFG production at given time [m3LFG y
-1]
ς dissimilation factor
i is waste fraction with degradation rate k1i [kg i kg-1
waste]
c is conversion factor
A is amount of waste in place [Mg]
C0 amount of organic matter in waste [kg per Mg of waste]
k1i is degradation rate constant of fraction i [y-1
]
t is time elapsed since depositing [y]
2126 The French E-PRTR or EPER model
The European Pollution Release and Transfer Register (E-PRTR) is the new Europe-
wide register that provides easy access to environmental data from industrial facilities
in the EU and few other places This register replaces the previous European Pollutant
Emission Register (EPER) Both the EPER and E-PRTR Protocols were used to
determine the pollutant release in the air This model gives two approaches to estimate
CH4 emissions from landfills (i) by using the CH4 emission estimates from LFG
recovery in the landfill or (ii) by using a multiphase model (Oonk 2010) The formula
for this model is as follow (Kamalan et al 2011 Oonk 2010 Scharff amp Jacobs
2006)
47
Where
FECH4 is annual CH4 production [m3 CH4 y
-1]
FE0 is CH4 generation potential [m3 CH4 Mg waste
-1]
pi is waste fraction with degradation rate ki [kgi kg-1
]
ki is degradation rate of fraction i [y-1
]
t is age of waste [y]
Ai is normalization factor
2127 Comparison of models for CH4 generation
All the models above are compared using the CH4 generation potential as shown in
Table 28
Table 28 Comparisons of models for CH4 generation potential L0 (kg CH4 per tonne waste)
and half-lives for biodegradation for household waste (HHW) or MSW (Oonk 2010)
Model L0 (kgtonne) Half-life (year) remark
IPCC-model 63 12-23 (slow)
7 (moderate)
4 (fast degradable)
MSW Europe
TNO-model 60 7 Dutch HHW
GasSim 51 15 (slow)
9 (moderate)
6 (fast degradable)
UK HHW
LandGEM 122
72
14 (conventional)
35 (arid)
MSW USA
Afvalzorg 39-45 23 (slow)
7 (moderate)
3 (fast degradable)
Dutch HHW
E-PRTR (French) 55 5-10 France HHW
213 Validation of Model Performance
Models used to estimate the amount of LFG especially CH4 emission always needs to
be verified and validated for its persistency and accuracy The comparison between
48
observations and predicted CH4 emission concentration was performed by applying
statistical measures of error The measures used reflected different aspect of spatial
distribution of mean concentration and the characteristics of the concentration field
(Cervone amp Franzese 2010) The error function analyses (EFA) that are commonly
used are the fractional bias root mean square normalized root mean square and
geometric variance and correlation functions Further details of this analysis are
discussed in Section 318
214 LFG Collection and Utilization
It is important that the LFG generated at landfills should be collected and utilized to
avoid environmental hazard as well as health risk Besides the potential threats the
LFG collected could be beneficial and in the case of large landfills an income
generator In most countries regulatory requirements have urged the landfill owners
to install a proper LFG control technology (ATSDR 2001) Control technologies are
often installed in landfills to collect control and treat gases and use gases to benefit
the community There are two types of gas collection system (1) the passive gas
collection system and (2) the active gas collection system A passive gas collection
system relies on pressure or concentration gradient to vent LFG into the atmosphere
or a control system Collection wells with vertical vents and gravel trenches are used
to collect the LFG either during the active operation of landfill or after closure
(ATSDR 2001)
49
Whereas in an active system it includes vacuums and pumps to move gas out of the
landfill and piping that connects the collection wells to the vacuum Vacuums or
pumps pull gas from the landfill by creating low pressure within the collection wells
The active system basically consists of vertical gas wells and horizontal collectors
Table 29 shows the comparison between the two collection systems
Table 29 Comparison between passive and active LFG collection system (ATSDR 2001)
Passive Active
Initial amp operating cost low high
Income low high
Pressure gradient positive negative
Gas collection inefficient Efficient and functions with
various gas system
Capacity minimal maximum
In a case study done in Thailand among three different landfill types namely semi-
aerobic anaerobic and gas to energy landfill showed that the gas to energy landfill
with active LFG collection systems had a higher operating as well as highest net
present value (NPV profit) (Pattharathanon et al 2012) The gas to energy landfill
had a NPV of 50 Thai Baht for every tonnes of MSW in one day while the semi
aerobic and anaerobic landfills had NPVs of 5-10 Thai Baht for every tonne of MSW
per day (Pattharathanon et al 2012)
50
In the USA LFG is the largest contributor to the man-made CH4 emission
contributing to almost 40 of the total CH4 emission each year (USEPA 2004)
Several landfills in the USA have reported collecting about 100Nm3 of CH4 per ton of
MSW landfilled in a given year (Themelis amp Ulloa 2007) Adding on to this a total
of 912000kW or approximately 8 billion kWhannum of electricity was generated by
295 LFG recovery facilities in the USA Generally the efficiency of LFG recovery
system in a landfill is between 50-60 (Boumlrjesson et al 2007) but with the state of
art CH4 control system the LFG recoveries can rise to about 97 (Spokas et al
2006)
Likewise LFG could be used as an alternative fuel source Shrestha et al (2012)
reported that LFG has about half the heating value at 16785 ndash 20495 kJm3 (450 to
550 Btuft3) as compared to 35406 kJm
3 (950 Btuft
3) of natural gas It is also a
much cheaper fuel source than natural gas Thus LFG can be utilized as an alternative
energy source which reduces the risk of explosion within a landfill provides financial
benefits for the community conserves other energy resources and potentially reduces
the risk of global climate change (ATSDR 2001) Figure 211 illustrates the
potential usage of LFG collected from landfills as fuel for combustion as well as for
power generation Where as in smaller landfills where such utilization procedures are
not applicable the LFG is flared to become CO2 to reduce the global warming input
of CH4 through direct release
51
Figure 211 LFG collection and utilization system
215 Surface emission of landfill gas
The surface emission of LFG from landfill resources are through diffusion advection
via Darcy Flow and wind induced advection (Scheutz et al 2009) The diffusion
mechanism is caused by LFG concentration variations in soil while advective
transport is due to the pressure gradient The pressure gradient between landfill and
the atmosphere induces further LFG emission through advection Thus without
proper LFG control technologies the landfills are significant contributors to the
atmospheric load of GHG However before any LFG control system is installed it is
important to quantify the amount of CH4 that is being generated and emitted from the
surface of the landfill into the atmosphere Till-to-date there have been numerous
field studies undertaken worldwide to measure the CH4 emissions from landfills
52
through CH4 fluxes The fluxes are normally reported as CH4 emission rate per unit
area
While in a separate study by Bogner et al (1997) the direct field measurements of
landfill CH4 emissions at small scale (lt1m2) varied over seven order of magnitudes
(0001 - gt1000g CH4m2day) This difference in magnitude results from variation in
waste composition cover materials soil moisture temperature and other eminent
variables (Bogner et al 2007) Therefore it can be said that the spatial variability of
CH4 emissions is higher than the temporal variability
2151 Methods used to measure surface emission of CH4 from landfills
Taking into consideration the spatial and temporal variability of CH4 surface emission
from landfills several methods to measure CH4 fluxes from landfills have been
developed tested and adapted (Bogner et al 2007) However there is no single
method that is widely recognized or preferred to measure the annual average of CH4
emissions (Oonk 2010) Normally the choice of measurement is dependent upon the
purpose of the measurement desired scale cost and the available technology The
methods are divided into 3 categories (1) above ground methods (2) ground level
methods and (3) below ground methods All these methods have their uniqueness as
well as advantages and disadvantages Table 210 summarizes the types of
measurement methods commonly used to measure the surface emission of CH4
including its advantages and limitations
53
Table 210 Types of measurement methods used to measure surface emission of CH4 (Scheutz et al 2009)
Application Status and references for method Advantages Disadvantages
Static chambers
Single point measurements for chamber
deployed at surface for variable time periods
(usually less than 1 h) Measures diffusional
flux based on change of gas concentration
within chamber vs time
Most common technique for landfill
emissions Field validated for many
terrestrial ecosystems and landfill settings
(Rolston amp Klute 1986)
A technique suitable for both positive
and negative fluxes Able to quantify
very low fluxes Simple to deploy
with supporting analytical capability
(Gas chromatography detector)
It is labour and time intensive
Appropriate geostatistical techniques
are need for larger measurement area
Ay cause temporary disturbance of
surface soil
Dynamic chambers
Single point measurements at ground surface
using a chamber which continuously flushed
with air or a flux gas Measures flux based on
the gas flow and difference between
incoming and outgoing chamber CH4
concentrations
A common technique which has been field
validated for terrestrial ecosystems and
landfills(Rolston amp Klute 1986)
Similar advantages as static chambers
except it cannot measure the negative
fluxes
Same disadvantages as static chambers
Not able to quantify very low fluxes
because of dilution of chamber gas with
flux gas
Soil core measurements
Soil collected to determine bacterial activity
Soil sample is exposed to high concentration
of CH4 and decrease over time is measured
Also measures oxidation capacity of soil
Measurements are done on ground surface
CH4 and CO2 concentration gradients in
soil are indication of diffusion of gases
through the layer (Bogner etal 1995)
Gives the fundamental steps leading
to emissions
It has a very low spatial temporal
resolution and does not take into
account emissions caused by
convection Labor-intensive too
Field flame ionization detector (FID)
technique
Measures the atmospheric CH4 at a point
directly above the landfill surface
Widely used
Easy and simple to be practised
Gradient techniques
Measurement of below-ground gas
concentration and pressure gradients with
calculation of flux using equations for
diffusional and pressure-driven flux
Limited landfill field measurements but the
basis for many transport models(Glinski amp
Stepniewski 1985)
It is used to measure the relative
contribution of convective flux
diffusion and the influence of short
term changes of barometric pressure
wind driven flux and passing storm
fronts
When there a cover soil and variable
saturation in waste the temporal points
are often difficult to interpret
54
Mass Balance method
Measurements of CH4 fluxes before and after the landfill is done using two imaginary vertical planes CH4 flux is measured as a product of wind velocity at each point
Product of wind velocity and difference in
CH4 concentration is used to calculate CH4
emissions (Oonk 2010)
It is based on a simple and robust
principle It only needs wind direction
and velocity as for emission
calculation
The instruments used are complicated
expensive and less flexible CH4
emission is underestimated at certain
areas like slope
Tracer techniques
Rely on the concurrent measurement of
atmospheric CH4 and a tracer gas (usually
SF6 or N2O) The tracer is released at a
known rate then the rate of CH4 release can
be determined from the ratio of CH4 to tracer
in the downwind plume
A common technique which has been field
validated for terrestrial ecosystems and
landfills(Czepiel et al 1996 Boumlrjesson et
al 2007)
Takes into account the whole landfill
including the edge leakages It gives
an integrated measurement of flux
Not suitable for various topography at
landfill and cannot quantify negative
fluxes Needs tracers gases such as SF6
and N2O which are potent GHG(s)
Micrometeorological techniques
A group of techniques which measure the
turbulent transfer of gases between the land
surface and the lower part of the atmosphere
Rely on tower-mounted fast-response sensors
to measure vertical gradients of wind speed
and direction CH4 concentration and other
variables
Widely used for landscape scale fluxes
from terrestrial ecosystems Has been
sparingly used for landfill CH4 fluxes
(Laurila et al 2005)
Gives an integrated measure of
landscape scale fluxes Best used for
flat terrain It is useful for short-term
and studies under changing
atmospheric conditions
Expensive technique which requires
special equipment and cannot be
applied at various topographies Also
not suitable for negative fluxes (only
uptake of CH4)
Remote sensing and other regional
techniques
Remote sensing techniques rely on tower- or
aircraft-mounted sensors to measure
atmospheric CH4 and other variables Flux is
determined through models andor scaling up
of micrometeorological techniques Regional
techniques encompass both bottom-up and
top-down techniques including inverse
modelling
Used for regional or larger scale
atmospheric studies especially complex
regional air quality studies examining
spatial and temporal variations Robust
methods and models specific for landfill
CH4 not yet field-validated(Modrak et al
2007)
Table 210 (Cont)
55
2152 The flux chamber measurement
The static and dynamic chamber measurement or also known as flux chamber
measurement method were reviewed by numerous researchers through an extensive
body of data gathering (Scheutz et al 2011 2009 Wongyao et al 2010 Ishigaki et
al 2008 Fourie amp Morris 2004 Spokas et al 2003) The operating principals of
chambers are simple and flexible The cost is low and it is also portable It is generally
operated by restricting the volume of air with which the gas exchange occurs to quantify
changes in concentration of gases in the head space (Denmead 2008)
In the static or closed chamber the air circulation in and out of the chamber is hindered
Usually periodic air samples are taken from the head-space with a gas syringe and their
concentration is measured using gas analyzers like gas chromatography While in a
dynamic or flow-through chamber a constant flow of outside air is maintained through
the headspace of the chamber and the difference in concentration between the air
entering and leaving the head space is measured as flux (Denmead 2008) In this study
the closed flux chamber made of plexi glass as discussed in Section 391 was used
In Europe the USA and South Africa the flux chamber measurements were the
predominant method for quantifying surface emission of landfill CH4 (Scheutz et al
2011 Galle et al 2001 Boumlrjesson et al 2000 Boumlrjesson 1997 Czepiel et al 1996)
This method precluded to be inexpensive while still providing meaningful results
56
Disadvantages to this method are normally spatial limitations as well as labor
constrains
In a study by Tregoures et al (1999) seven methods to measure CH4 flux from
landfills were evaluated at French landfill sites with regard to scientific technical and
economic criteria The study found that the chamber methods provided the best overall
measurement strategy in terms of accuracy flexibility and robustness This technique is
also commonly used for CH4 fluxes measurements both before and after placement of
landfill cover layer (Fourie amp Morris 2004) However chambers with small chamber
volume and short gas extracting time (lt3 minute) showed inconsistent CH4 flux
measurement compared to other indirect methods of measurements (Boumlrjesson et al
2000)
Hence suitable chamber volume is required to obtain a representative result Livingston
amp Hutchinson (1995) concluded that flux measurements on sites with large exchange
rate are best served by chambers with large volume to area ratios (VA) typically greater
than 150 Lm-2
Other researchers have scaled the range of ratio between 60 Lm-2
to 300
Lm-2
and with measuring period ranging from 20 to 40 minute (Abushammala et al
2012 Senevirathna et al 2007 Denmead 2008Bogner et al 1997 Reinhart et al
1992)
Chambers are normally made out of stainless steel poly-vinyl chloride (PVC) and fibre-
glass The chamber used in this study was designed according to the specifications
above Details on the design and volume to area ratio are explained further in Section
391
57
216 Meteorological factors influencing the surface emission of LFG
The importance of the meteorological factors influencing the surface emission of
landfill CH4 has been observed on site by various researchers (Wang et al 2012
Czepiel et al 2003 Christophersen et al 2001 Galle et al 2001) In addition to this
gas flux models by Young (19901992) Naster et al (2001) and Poulsen et al (2003)
have used barometric pressure as its key variable
Figure 212 shows a conceptual diagram for LFG flow rate and composition as well as
the connection between atmospheric pressure temperature and other weather
parameters As a result the LFG emission is delicately dependent on the atmospheric
pressure variation which is induced by temperature air intrusion and other
meteorological factors (Gebert amp Groengroeft 2006) The atmospheric pressure
perturbs the LFG pressure gradient in the landfill Therefore when there is positive
LFG pressure gradient CH4 gas emission increases However when a negative LFG
pressure gradient occurs the air is in-fluxed The air influx reduces CH4 to the
atmosphere but increase the potential risk of explosion within a landfill
58
2161 Atmospheric pressure
Czepiel et al (2003) examined the influence of atmospheric pressure on landfill
methane emission from 12 individual emission tests and concluded that the measured
emissions were negatively correlated with surface atmospheric pressure The results
from the test had a 093 correlation coefficient when modelled by linear regression
Figure 213 shows the CH4 emission and pressure relationship from the test (Czepiel et
Auto-oscillation
of air
Δ temperature Δ general weather
station
Δ atmospheric
pressure
[CH4] darr [O2] uarr [CH4] uarr [O2] darr
Air influx Gas emission
Negative (-)
LFG Pressure
Positive (+)
LFG Pressure
Figure 212 Conceptual diagram on the regulation of LFG emission in a
landfill Δ = difference LFG = landfill gas [CH4]= methane concentration
[O2] = oxygen concentration uarr = increase darr = decrease (Gebert amp
Groengroeft 2006)
59
al 2003) The different shapes in the figure represents different period of measurement
while the error bars indicate the coefficient of variation of each measurement
2162 Rainfall
The effect of rainfall on the surface emission of CH4 at landfills had contradicting
evidences In a study at nine solid waste disposal sites in Thailand it was found that
CH4 emissions during the rainy season were about five to six times higher in magnitude
compared to winter and summer season (Wangyao et al 2010) Comparatively in a
research conducted at the Sudokwon Landfill in South Korea a different reasoning was
Figure 213 CH4 emissions vs atmospheric pressure Solid squares are data from August
1996 solid circles are data from February 1997 and solid triangles are data from March and
April 1997 The error bars represent the coefficient of variation of each measurement The
solid line is the linear regressions of these data with its equation of the regression line and r2
Source Czepiel et al (2003)
60
given to the higher CH4 emissions during the rainy season (Park amp Shin 2001) Due to
much ground water content during the rainy season the surface pores at the landfill are
blocked Thus this accelerated the CH4 flux through the remaining open pores
However when it was a sunny day CH4 is easily released through many pores on the
surface and eventually escapes to the atmosphere (Park amp Shin 2001) So
quantitatively more CH4 is emitted through the surface during the hotsunny days
2 16 3 Temperature
In general the thermal regime of landfills is controlled by climatic and operational
conditions of a landfill The temperature in the landfill plays a key role in determining
the long-term potential of LFG production and emissions Wang et al (2012)
concluded that high temperature (30˚C to 40˚C) accelerated the waste degradation and
gas generation thus increasing the higher possibility of surface emissions of CH4 In an
earlier study by Park amp Shin (2001) they had examined the diurnal and seasonal
variation of CH4 from landfills Results from the diurnal variation concluded that the
surface CH4 emission was scarce during the minimum temperature of the day and rose
to a peak when the temperature was at a maximum Figure 214 shows the variation of
flux rate according to time of the day A significant peak of LFG was generally obtained
during the hottest time of the day which is around 2pm (Park amp Shin 2001) Viewing
the recorded of the seasonal variation they summarized that the CH4 flux rate decreased
from summer to winter
61
The influence of ambient temperature on the LFG emission was studied by researchers
in the past (James et al 2008 Yesiller et al 2008 Einola et al 2007 Townsend et al
1996 Attal et al 1992) and was mostly concentrated in temperate countries like
Alaska British Columbia Michigan Finland and New Mexico Alternatively Robinson
(2007) found that the rapid transition from acetogenic to the methanogenic phase of the
landfills in the warmer climates were two to three times faster than that of the landfills
in temperate countries Blakey et al (1997) had summarized that temperature is an
important factor which affects the CH4 content in LFG So it is important for landfills to
operate under optimum temperature for faster LFG production and refuse stabilization
(Wang e al 2012)
Figure 214 Variation of LFG flux according to the time of the day (Park amp
Shin 2001)
62
217 Landfill cover
The two main recommendations put forward by the IPCC as strategies for potential
mitigation of CH4 from the waste sector are (1) the enhancement of landfill CH4
recovery and utilization and (2) the optimization of methanotrophic CH4 oxidation in
landfill cover soils and biofilter (Polettini 2012 Huber-Humer 2011 IPCC 2007) The
former strategy are often adapted in most of the larger landfills while the latter strategy
is a common practice in smaller and older landfills which do not produce much LFG for
gas recovery and utilization (Chanton et al 2011 Stern et al 2007) However a
landfill cover is an essential mitigation practice in both larger and small landfills as an
effort to reduce lateral migration of CH4 from the landfill cover Therefore the landfill
cover soil acts as the environmental interface between the waste layer and atmosphere
(Jing et al 2011) Landfill cover with the potential microbial activities from
methanotrophs has been frequently verified in the past years (Huber-Humer et al 2008
Scheutz et al 2009) and the following benefits were identified
a) reduction of gas emissions especially CH4
b) protection of the sealing element (eg capillary barrier)
c) growth of vegetation ability of root penetration and sustainable nutrient supply
d) optimization of water balance and water holding capacity
e) prevention of direct contact between harmful substances and environment
f) stability especially at long and steep slopes
63
2171 Different types of cover material
In a review by Scheutz et al (2009) different types of cover materials had been used as
the landfill cover to obtain maximum CH4 oxidation capacity to reduce the impact of
CH4 emission to the environment and health Each of these materials was studied in the
laboratory using the incubation experiments (batch test) or in continuous gas flow
system (packed column test) to simulate and control the external factors involved in the
actual environment Among the materials used were sand coarse sand humid soil clay
landfill soil and waste soil from landfill reactor The materials tested were later applied
to field studies to evaluate its actual performance in CH4 oxidation It was noted that in
both tests the CH4 oxidation rate in landfill cover soil has been more than 100 microg CH4
g-1
h-1
and 200 g CH4 m-2
day-1
respectively (Scheutz et al 2009)
2172 Biocover
In the 2007 IPCC AR4 report on climate change mitigation efforts biocovers and
biofilters were listed as the key mitigation technologies and practices to reduce GHG
emissions from landfills (Bogner et al 2007) Biocovers are organic filter material
which supports the growth of methanotrophs for CH4 oxidation when placed upon a gas
distribution layer made of gravel (Pedersen et al 2011)
Biocovers are normally rich in organic matter and from previous studies it is evident
that this condition enhanced the microbial CH4 oxidation in landfill cover soil compared
to the use of pure clay cover (He amp Ruan 2008 Stern et al 2007 Abichou et al
2006) He et al (2008) established that compared to a clay soil biocovers made from
64
organic waste products like compost could reduce CH4 emission to the atmosphere by
about 374 kg CH4 per m2 annually The biocover is routinely spread over a certain
level of depth above the waste layer to act as a medium for CH4 oxidation
218 Methane oxidation in landfill cover
Scheutz et al (2009) reported that around 20cm to 40cm below the surface in zones
where vertical profiles of CH4 and O2 overlap the CH4 oxidation is at its greatest CH4
oxidation occurs at the interface of aerobic and anaerobic zones where CH4 is generated
in anaerobic regions below and methane uptake occurs in aerobic zones above The
first experiment to quantify methane oxidation in landfill cover was done by Whalen et
al (1990) using laboratory batch experiments 45g CH4msup2d ( = 63L CH4msup2d) was
rapidly oxidized in a landfill topsoil in a closed municipal solid waste landfill where the
CH4 concentration was between 1 ppm to 10000 ppm Capacity for CH4 oxidation was
observed in landfill cover soil in column experiments with rates as high as gt200 g
CH4msup2d (Scheutz et al 2003 DeVisscher et al 1999) High methane oxidation
capacity could be found in porous coarse and organic-rich substrates (Croft and
Emberton 1989)
219 Methanotrophic activity in landfill cover
Methanotrophs are a physical group of bacteria that are unique in their ability to utilize
CH4 as carbon and energy source Whalen et al (1990) was the first to recognize the
65
importance of methanotrophs in landfill soils followed by a more comprehensive review
on the properties of methanotrophs by Hanson amp Hanson (1996) The former had
estimated that methanotrophs were able to convert about 50 of the CH4 emitted from
the landfill surface while the latter was able to define the characteristics of the
methanotrophs and narrate the complete pathway for the microbial oxidation of CH4 to
CO2 Figure 215 shows the pathway for the microbial oxidation including the
intermediate steps of CH4 oxidation into methanol then methanol into formaldehyde
(CHOH) the subsequent oxidation of formaldehyde to formate (CHOOH) and finally
into CO2
220 Factors influencing methanotrophic activity in landfill cover
There are a number of factors that influenced the methanotrophic activity in the landfill
cover The most important factors are temperature moisture content pH CH4
Figure 215 The pathway for methane oxidation and assimilation of formaldehyde by
Methanotrophs (Hanson amp Hanson 1996 and Scheutz et al2009)
66
concentration O2 supply organic content and nutrients (He amp Ruan 2008 Einola et al
2007 Hanson amp Hanson 1996) Thus these parameters are very important in
controlling CH4 oxidation in a landfill Hanson amp Hanson (1996) have also observed
that a shift in any of these environmental stimuli response to changes in the
methanotroph population in the cover soil
2201 Temperature
Temperature is one of the most important element for the methanotropic activity in the
cover soil The optimum temperature helps to maximize CH4 oxidation with addition to
construct a better landfill cover Since most methanotrophs are mesophiles the optimum
temperature range for CH4 oxidation in soil environment was around 25˚C to 35˚C
(Scheutz et al 2009 Hanson amp Hanson 1996) Einola et al (2007) also reported
similar optimum temperature which ranged from 20˚C to 38˚C While in temperate
countries during winter when the atmospheric temperature is between 5˚C to 10˚C CH4
oxidation is reduced significantly or even reaches a plateau The Q10 describes the
value for number of times the oxidation rate increases when temperature is increased by
10˚C at temperature below the optimum temperature Higher Q10 value indicates higher
CH4 oxidation For temperatures ranging from 10˚C to 30˚C the Q10 value was
observed exponentially between 17 to 41 suggesting that mesophilic methanotrophs
are the main consumer of CH4 in the biocover soil (Scheutz et al 2009 Park et al
2005 Scheutz amp Kjeldsen 2004 Czepiel et al 1996)
67
2202 Moisture Content
The moisture content typically follows a parabolic curve on the CH4 oxidation rate in
the cover soil This indicates that the CH4 oxidation is reduced at both very low and
high moisture content of the cover (Scheutz et al 2009 Einola et al 2007 Park et
al 2005 Scheutz amp Kjeldsen 2004) Since moisture content within the soil is the main
transport medium of the nutrients for microbial activity it is an essential factor for CH4
oxidation Besides microbial activity the optimum soil moisture content is also
important to maximize gas phase molecular diffusion of LFG In addition to this soil
texture pore size distribution and water retention capacity of the soil also aide the
gaseous transport From previous literatures the optimum soil moisture content for
landfill cover soils ranged between 10 to 20 of wet weight basis and 45 to 110
of dry weight basis ( Scheutz et al 2009 Mor et al 2006 Czepiel et al 1996 Whalen
et al 1990) The moisture content of the cover soil was closely related to the
temperature range of the cover soil (Einola et al 2007)
2203 pH
Previous studies suggest that the optimum pH for CH4 in the cover soil was between pH
55 and pH 75 (Scheutz et al 2009 Scheutz amp Kjeldsen 2004) This pH range
maximizes the growth of methanotrophs and is in consistent with the pure cultures of
methanotrophs by Hanson amp Hanson (1996) Similar results of pH range were also
presented by Navarani (2009) Sitiaishah (2011) and Jayanthi (2013) for maximum CH4
oxidation According to Pawloska (1999) no significant methanotropic activity was
observed between pH 761 and pH 889 The pH of the cover material used in the
68
studies were lowered using acid substances and raised using lime for studying the
optimum pH for methanotrophic activities for maximum CH4 oxidation The pH used
was from pH 5 to pH 8
2204 Methane concentration
The response of CH4 oxidation within cover material or soil varies with the CH4
concentration The vertical profile of the cover material is exposed to different amount
of CH4 The deepest layer of the landfill cover will be exposed to the highest amount of
CH4 (He amp Ruan 2008) Previous studies by Jayanthi (2013) Navarani (2009) and
Perdikea et al (2008) showed that cover material between the 40 to 60 cm thickness is
sufficient for CH4 oxidation Therefore it is essential for the cover material to be
implanted to a certain depth to produce maximum CH4 oxidation Cover material which
are too thick or too thin are not cost effective and a waste of resources It is important
to the CH4 content in the LFG for effective cover material to be applied Maximum CH4
oxidation is said to occur when suitable environment exists with the presence of
methanotrophic bacteria optimum O2 and CH4 ratio and good retention time (Jayanthi
2013)
2205 Oxygen supply
Oxygen is required to oxidize CH4 produced by the methanotrophs The stoichiometry
equation below states that two molecules of O2 per molecule of CH4 are needed for
microbial CH4 oxidation as shown below
69
However in most of the landfills O2 penetration depth will often be the limiting factor
of CH4 oxidation process In relation to this soil texture and composition pore size and
porosity are important parameter to aide this process However O2 supply into the cover
soil also deprived from CH4 when landfills use low permeable cover to hinder rainfall
infiltration and subsequent leachate production (Scheutz et al 2009) In a study by
Wilshusen et al (2004) it was established that an O2 range between 045 to 20
supported maximum CH4 oxidation
2206 Organic content and nutrient
Huber-Humer et al (2009) recommended the minimum organic content in any
biocover or cover material to be 15 of its dried mass or weight This value was used
as a threshold criterion to access the performance of different biocover or cover material
used in CH4 oxidation (Pedersen et al 2011 Huber-Humer et al 2009) Another
important factor is the availability of nutrients such as N in the cover material N
specifically inorganic N in the form of ammonia (NH4+) and nitrate (NO3
-) helps to
stimulate or inhibit CH4 while oxidizing it in the cover material (Scheutz et al 2009)
221 Organic waste as Biocover
Many researches have used various materials as biocover for CH4 oxidation in landfills
Sand clay and soil are among the commonly used materials as it is easily available to
the landfill operators Although these materials have been good landfill caps but CH4
70
oxidation rate remains low in some cases This result emphasized the importance of
texture pore size and porosity of the cover material for the enhancement of microbial
CH4 oxidation (Rachor et al 2011 Maurice amp Lagerkvist 2004)
The use of organic waste such as compost as a biocover material has been given due
importance for its high CH4 oxidation rate in a landfill cover Among the organic waste
commonly use a direct or supplementary material for landfill covers are food waste
agricultural waste garden waste animal manure and sewage sludge This sort of
manipulation of landfill covers or better known as engineered materials provides a
promisingly complementary strategy for the control of CH4 emission
2211 Compost
Compost is mixture of organic residue and soil or organic residue only that has been
piled moistened and have undergone aerobic biological decomposition Compost is
normally made from residues of garden waste agricultural waste and animal manure
Compost is normally rich in organic matter and a suitable medium for methanotroph
activities A number of studies by Abichou et al (2006) Stern et al (2007) and He et
al (2008) also concluded that compost rich in organic matter showed better microbial
CH4 oxidation compared to pure clay cover While in year 1999 and 2001 researches
done by Humer amp Lechner (who studied compost made from MSW and sewage sludge
as a cover material) discovered that 100 CH4 oxidation was possible with the use of
these materials Furthermore engineered biocovers like this have been known to
71
effectively perform multiple annual cycles of CH4 oxidation in northern temperate
climates (Huber-Humer 2004)
In separate studies performed by Navarani (2009) Sitiaishah (2011) and Jayanthi
(2013) the performance of compost made from grass clippings and cow manure were
examined in laboratory scale batch and packed column test for CH4 oxidation rate All
compost used showed 100 CH4 oxidation capacity varying only in the number of days
for the maximum CH4 oxidation Therefore this proves that compost is an effective
cover material for CH4 oxidation
222 Response Surface Modeling
Response Surface Modelling (RSM) is used to design the best combination of
experiments needed to choose the optimum parameters without carrying out large
number of experiments to save time and resources (Guo et al 2009 Bhunia amp
Ghangrekar 2008) This method which uses the mathematical modelling and
optimization studies using a three-factor three-level Box-Behnken experimental design
for excellent predictability and fewer experiments compared to other designs
(Yetilmezsoy et al2009) In this study the experimental design was applied to
determine optimum pH moisture content and temperature to determine the optimum
parameter required for maximum CH4 oxidation within the biocover material

20
The waste management options practiced are often classified in a waste management
hierarchy following an order of the least impactful to the environment to the most
(Raina 2010) The waste management hierarchyrsquos usage dated back to 1970rsquos during
the Ontariorsquos Pollution Probe (World Bank 2012) and started with the use of 3Rrsquos
(reduce reuse recycle) as well as the edition of the latest R ndash recovery In this
hierarchy waste prevention or reduction is given the highest priority while disposal
methods such as landfilling and incineration are the least preferred
Waste prevention and reduction refers to reducing waste at the source which includes
reusing products donating items buying in bulk redesigning products and reducing
packaging The recycling and composting practice focuses on activities such as
collecting sorting and processing the recyclable products as well as composting of
food waste and yard trimmings In energy recovery the conversion of non-recyclable
waste material into heat electricity and fuel through many waste-to-energy (WTE)
processes Although landfilling and incineration are the most widely used disposal
method globally it is still the least preferred waste management practice due to its
environmental impacts (USEPA 2012) Figure 22 shows the waste management
hierarchy in an inverse triangle image The larger the portion of the triangle the
higher the priority that is given to that waste management practice
21
Figure 22 The waste management hierarchy (USEPA 2012)
Figure 23 shows the common waste management practices in few countries around
the world in year 2008 (OECD 2008) In Germany 47 of the MSW was recycled
while another 32 was incinerated Only 06 of the MSW was sent directly to the
landfills In countries like France Italy Japan UK and the USA recycling rates were
recorded from 17 to 25 (OECD 2008) Stringent legislation regulations and
policies such EU directives and Zero Organic Waste to Landfills Policy have paved
the way to the more environmentally sound strategies for MSW disposal in most of
the EU countries (ISWA 2009) While in Japan land scarcity has made them depend
on incinerators to dispose their waste However even with many environmentally
sound waste management options landfilling still remains as the main option for
MSW disposal in many countries In countries like the USA UK China Italy and
many other developing nations landfills are the final waste disposal sites as it is the
cheapest and easiest method to adhere (SivaShangari amp Agamuthu 2013 OECD
2008)
22
26 Climate change and waste
Climate change has become a hotly debated global issue The increase in GHGs
emission and global warming has been given the utmost importance to understand
mitigate and adapt to climatic changes occurring around the world Also the
initiation of the International Treaty of Kyoto Protocol in 1997 and its enforcement in
2005 established a worldwide cooperation in GHGs reduction (UNFCCC 2012)
Following this was other important climate negotiations which outlined action plans
like The Bali Road Map in 2007 Copenhagen Accord in 2009 Cancun Agreement in
2011 Durban Outcomes in 2012 and the latest Doha Climate Gateway in 2013
(UNFCCC 2014) All these talks and action plans were targeted at reducing GHGs
0
20
40
60
80
100
China France Germany Italy Japan UK USA Malaysia
Waste Management practice (as of total MSW)
Other Methods Landfilling Incineration Composting Recycling
Figure 23 Waste management practices in various countries (SivaShangari amp
Agamuthu 2013 OECD 2008)
23
emissions and turning down the projected global temperature increase of 4˚C to only
2˚C climate goal (UNFCCC 2012 ECOFYS 2010) The industrialised countries or
popularly known as the Annex 1 countries as well as the seven major emerging
economies of non-Annex 1 countries (Mexico Brazil China India Indonesia Korea
and South Africa) have pledged to reduce their GHGs emissions between 17 to 40
as compared to the year 2005 or their business as usual (BAU) level (COP15 2009
ECOFYS 2010) Malaysia too in the Global Climate Change Summit (COP15) had
pledged to voluntarily reduce CO2 intensity up to 40 by 2020 as compared to 2005
levels (COP15 2009) This had subsequently paved the way to the formulation of the
National Green Technology Policy in 2011 which focused on energy buildings waste
and transportation (KeTTHA 2013)
As for the GHG emissions from the waste sector it only denotes to 3-5 of the total
global GHG emissions (World Bank 2012 Bogner et al 2007) Although the
quantity seems trivial there is now credible evidence that taking into account the
associated avoided emissions the waste sector can move from being a minor source
of emitter to becoming a major saver of emissions (UNEP 2010) It is a known fact
that every waste management practice generates GHG both directly from emissions
and indirectly through energy consumption Nevertheless the overall climate benefit
or impact of the waste management practices will depend on net GHGs accounting
for both emissions and indirect downstream GHG savings Table 23 depicts the
results by Polettini (2012) on several waste management practices and its GHG
emissions and savings
24
WM
Practices
Indirect
(upstream) Direct Indirect (downstream)
Waste
reduction
reuse
recycling
E Fuel used in the
facility
E Consumption of
heat and electricity
E Materials used
in facility
construction
E Transportation
of materials to the
facility
E GHGs from fuel
combustion
S Avoided emissions from substituted
raw materials (-390 kg CO2-eq tonne-1
ww observed in Germany)
S Avoided emissions from avoided use
of harvested wood
E Transportation of recovered materials
for reuserecycling
E Transportation of residues for
treatmentfinal disposal
Mechanical
biological
treatment
E Fuel used in the
facility
E Consumption of
heat and electricity
E Materials used
in facility
construction
E Transportation
of materials to the
facility
E GHGs from fuel
combustion
E Constituents of
biogas from waste
degradation
(aerobic
anaerobic)
S Avoided emissions from biogas use
for energetic purposes (-103 kg CO2-eq
tonne-1
ww observed in Germany)
S Avoided emissions from materials
recycling
S Avoided emissions from compost use
as a substitute of soil growth media
S Carbon storage in compost
E Treatment of the off-gases and
leachate
E Transportation of recovered materials
for recycling
E Transportation of residues for
treatmentdisposal
Thermal
treatment
E Fuel used in the
facility
E Consumption of
heat and electricity
E Materials used
in facility
construction
E Transportation
of materials to the
facility
E GHGs from
thermal waste
conversion
S Heatelectricity from substituted
fossil fuels (-563 kg CO2-eq tonne-1
ww
observed in Dermark)
S Avoided emissions from recovered
metals from the ash
S Avoided emissions from use of ash as
a substitute of natural aggregates
E Transportation of recovered materials
for recycling
E Treatment of residual ashes
E Transportation of residues for
treatmentfinal disposal
S Carbon sequestration by residual
ashes
Traditional
landfilling
E Fuel amp energy
used at the landfill
site
E Materials used
in landfill
construction
E Transportation
of materials to the
facility
E Constituents of
LFG from waste
degradation (+454
and +346 kg CO2-eq
tonne-1
ww in
Greece and Poland)
E GHGs from fuel
combustion
E Emissions from
leachate treatment
S Avoided emissions from LFG
combustion
S Carbon storage within the landfill
body
S Advanced CH4 oxidation in active
covers
Footnote E ndash Emission S ndash Savings (+) = Emission and ( - ) = savings ww ndash wet waste
Table 23 Waste management practices and GHG emissions and savings adapted from
(Polettini 2012 Gentil et al 2009)
25
Currently the OECD countries generate the highest levels of methane However the
developing nations are anticipated to increase significantly as better waste
management practices lead to more anaerobic methane producing conditions in
landfills (UNEP 2010) Landfilling especially in developing countries like Asia
South America and Africa are reported to contribute about 37 million tonnes of CO2-
eq or 40 of the annual CH4 emission (Bogner et al 2007) Global CH4 budget
from year 2000 to 2009 for agriculture and waste was between 187 to 224 Tg(CH4) y-1
These anthropogenic emissions are from paddy agriculture ruminant livestock
landfills man-made lakes and wetlands and waste treatment (IPCC 2013)
27 Landfilling as a MSW disposal option
Landfilling is the most widely used and economically viable solution for final
disposal of MSW in many countries around the world High cost of treatment and
comparative disposal alternatives are a major reason for the reliance on MSW
landfilling particularly in developing countries (Laner et al 2012 Brunner amp Fellner
2007) Similarly in Malaysia 85 of the daily collected MSW is landfilled while
only 15 are recycled (Agamuthu et al 2009) Based on a report by the Malaysian
Ministry of Urban Wellbeing Housing and Local Government (KPKT 2012) there
are a total of 296 landfills in Malaysia in 2012 with 56 of landfill in Malaysia are
currently in operation (Table 24) Out of this total only 8 are sanitary landfills
equipped with adequate high density polyethylene (HDPE) liner gas capture wells
and leachate treatment ponds The rest of it are common landfills or mere dumpsites
with could pose great danger to the adjacent residents or water supply
26
Table 24 Total landfills in Malaysia according to the states (KPKT 2012)
State Operational landfills Non-operational landfills Total
Johor 14 23 37
Kedah 8 7 15
Kelantan 13 6 19
Melaka 2 5 7
Negeri Sembilan 7 11 18
Pahang 16 16 32
Perak 17 12 29
Perlis 1 1 2
Pulau Pinang 2 1 3
Sabah 19 2 21
Sarawak 49 14 63
Selangor 8 14 22
Terengganu 8 12 20
WP Kuala Lumpur 0 7 7
WP Labuan 1 0 1
Total 165 131 296
271 Non-sanitary landfills and dumpsites
Non-sanitary landfills or also known as tip dumpsites and dumping ground are in
abundance around the world These landfills are often used as burial areas for waste
27
and is closed with some soil when the height of waste reaches a desirable maximum
at the site (Themelis amp Ulloa 2007) These types of landfills are neither engineered
with any liner system leachate treatment ponds nor gas collection facility and pollute
the local environment through bad odour and ground and surface water
contamination In a study by Manfredi et al (2009) open dumpsites in European
countries produce 100 tCO2-eq of LFG for per tonne of wet waste
272 Sanitary landfill
Sanitary landfills are modern landfills which are well-engineered designed operated
monitored and located away from residential areas These landfills are constructed in
accordance with the government regulations to ensure the safety of people and the
environment Among the common regulations administered for a sanitary landfill are
location restriction artificial liner requirements leachate collection and removal
systems gas collection and control system groundwater monitoring system as well
as closure and post closure requirement for the landfill (USEPA 2012) Barton et al
(2008) concluded that sanitary landfills in developing countries could produce up to
148 tCO2ndasheq of LFG for per tonne of wet waste Figure 24 shows a sanitary landfill
28
Figure 24 A sanitary landfill (USEPA 2012)
28 Landfill Output
The organic compounds in the MSW are converted to gaseous or liquid states by
undergoing various chemical and biological transformation (Wang et al 2012) The
decomposition of MSW with the presence of rain water produces landfill gas (LFG)
leachate and other inert solid waste as the primary output Organics in the solid waste
decomposes to produce LFG which contains CH4 CO2 and other trace amounts of
toxic substances (Park amp Shin 2001) Conversely landfills are also known as long-
term sink for carbon sources (Bogner et al 2007) Previous studies by Bogner (1992)
and Barlaz (1998) estimates that a minimum of 50 of the organics landfilled is not
converted to LFG but still remains in the landfill This condition is due to the presence
of inert organics slowly degrading cellulose and hemicellulose and biologically
29
recalcitrant (lignin) constituents within the MSW landfilled (Polettini 2012 Bogner
et al 2007)
29 Landfill gas
291 Landfill gas generation
The MSW buried in landfills are subjected to physical chemical and biological
processes in which the biodegradable fractions decompose in an anaerobic condition
through a complex series of microbial and abiotic reactions (Wangyao et al 2010)
Accordingly the biodegradation of organic waste takes place in five stages and leads
to the production of landfill gas (LFG) The 5 stages are (1) aerobic (hydrolysis and
aerobic degradation converting ready degradable carbohydrates to simple sugars
carbon dioxide (CO2) and water (H2O)) (2) acidogenic (hydrolysis and fermentation
of simple sugars to solute volatile acids) (3) acetogenic (conversion of soluble acids
to acetic acids hydrogen (H2) and CO2) (4) methanogenic (methane (CH4) generation
bacteria metabolizes acetate and forms CH4 and CO2 ndash LFG) (5) aerobic (oxidation of
CH4 with the re-establishment of aerobic conditions)(Couth et al 2011 Environment
Agency 2004) The stages above can be simplified in a formula to represent the
maximum amount of LFG generation as below (Nickolas amp Priscilla 2007)
Figure 25 shows the flow chart of the process
30
Waste organic fraction
Hydrolysis
Aerobic degradation
Hydrolysis and
Fermentation
Acetogenesis
Methanogenesis
Oxidation
CO2H2O
Organic acid
H2CO2H2OA
mmoniacal
nitrogen
Acetic acid
H2CO2
CH4CO2
CO2
Processes Products Gases Leachate
Stage I
Aerobic Aerobic
Anaerobic Anaerobic
Stage II
Stage III
Stage IV
Anaerobic Anaerobic
Aerobic Aerobic
Stage V
292 LFG Composition
Abichou et al(2004) and Humer amp Lechner (1999) denoted that the biological
decomposition of one tonne of MSW will produce approximately 160 msup3 to 250msup3 of
LFG LFG is composed by a mixture of gases compound as shown in Table 25 In
general more than 50 of the LFG is CH4 followed by CO2 between 40 to 60 and
Figure 25 The major stages of waste degradation in landfills (Williams 2005)
31
other trace amounts of various chemical compounds (Hegde et al 2003) Although
CO2 is produced in landfill it is said to have neutral greenhouse effect due to its
biogenic origin Its generation in a landfill is also negligible compared to other CO2
producing sectors such as industry energy and transportation (Polettini 2012)
Table 25 The composition and characteristics of LFG (ATSDR 2001
Tchobanoglous et al 1993)
Component Volume () Characteristics
CH4 45 - 60 Is colourless odourless and naturally produced
gas
CO2 40 - 60 Is colourless odourless and slightly acidic
Nitrogen (N2) 2 - 5 Is colourless odourless and tasteless The major
contributor to atmospheric gas (79)
Oxygen(O2) 01 - 1 Is colourless odourless and tasteless The
second major contributor to atmospheric gas
(21)
Ammonia (NH3) 01 - 1 Is a colourless gas with a pungent odour
Non-methane organic
compounds
(NMOCs)
001 ndash 06 Is an organic compound that forms naturally or
through synthetic chemical processes
Sulphides 0 - 1 Is a naturally occurring gas with a smell like
rotten-egg
Hydrogen (H2) 0 ndash 02 Is an odourless and colourless gas
Carbon Monoxide 0 ndash 02 Is an odourless and colourless gas
Inversely CH4 is a more significant GHG in the landfill Given a time horizon of 100
years CH4 has a global warming potential of 25 which means it is capable of
32
absorbing and trapping infrared radiation 25 times more as compared to CO2 and has
a longer residence time in the atmosphere (Pachauri amp Reisinger 2007) Globally
CH4 from landfills represent 12 of the total anthropogenic CH4 emission (World
Bank 2012) and the estimated release is between 35 and 69 Tg (CH4) y-1
(Bogner et
al 2007) In a separate report by IPCC (2013) landfills are responsible for almost
half of the CH4 emissions attributed by the MSW in 2010 In Malaysia where almost
85 of the daily generated MSW is landfilled 47 of national CH4 average is from
landfills (Agamuthu amp Fauziah 2012 NC2-Malaysia 2010)
293 Factors Influencing gas generation
The rate and volume of the LFG generated in landfills are influenced by several
factors According to Agamuthu (2001) the rates of LFG production depend on size
and composition of solid waste age of solid waste and landfill moisture content of
waste temperature conditions in landfill quantity and quality of nutrients organic
content of refuse pH and alkalinity of liquids in the landfill and presence of toxic and
hazardous materials in landfills Some of the factors are described further below
a) Waste composition The bacteria within the landfills feed on the organic
matter while decomposing The optimum ratio of organic matter (expressed as
chemical oxygen demand (COD) nitrogen (N) and phosphorous (P) is
100044008 (Christensen et al 1996) In addition nutrients and metal
supplements have a positive effect on the LFG production rate (Isci amp Demier
33
2007) Gas generation is also increased by the presence of putrescible
materials (Christensen et al 1996)
b) Age of refuse waste buried in the landfill within the recent years (less than
10 years) Peak gas production occurs between 5 to 7 years after the waste is
buried However small quantities of LFG may continuously be emitted from a
closed landfill for 50 or more years (ATSDR 2001)
c) Presence of oxygen O2 is considered as inhibiting for CH4 formation The
absence of O2 is important for the anaerobic bacteria to grow and convert solid
carbon to CH4 and CO2 (Christensen et al 1996)
d) Moisture content Rees (1980) had summarized that the LFG production rate
increases between 25 to 60 water content The increase of water content
limits O2 transport and facilitates CH4 production However saturated
moisture content hinders CH4 production (Christensen et al 1996 Rees
1980) While a moisture content of 40 or higher based on wet waste
promotes maximum gas production (ATSDR 2001)
e) Temperature Like many other microbial processes CH4 formation is highly
affected by temperature The warmer the temperature the higher the bacterial
activity which in turn increases the rate of LFG production At elevated
temperatures the CH4 production is more rigorous and produces more heat as
34
such is self-enhancing During the decomposition process the bacterial
releases heat which stabilizes the temperature of between 25˚C to 45˚C
(ATSDR 2001)
f) pH The methanogenic bacteria which produces CH4 as a metabolic by-
product operates efficiently only within a narrow pH range of 6 to 8
(Abushamamala et al 2009) The methanogenic ecosystem in the landfill is
rather delicate and a balanced relation between bacterial groups is crucial for
good CH4 production (Christensen et al 1996)
210 Impact of landfill gas emission
LFG contains H2 and CO2 in the initial phase of LFG production from the waste
degradation process but at the final stage it is mainly a mixture of CH4 and CO2
(Williams 2005) All these gases have generated several impacts to the environment
as well as human The impacts are felt at different scales of radius depending on its
severity as shown in Figure 26
35
2101 Greenhouse effect and global warming
At the end of the 20th
century and during the industrial era the concentration of the
global GHG(s) such as CO2 CH4 and N2O showed major hikes The CH4
concentration generally showed an increasing trend since pre-industrial years (Figure
27a) But a more comprehensive derivation magnified a decreasing growth rate of
CH4 from early 1980 to 1998 a stable growth rate period between 1999 and 2006 and
an increasing growth rate thereafter from 2007 to 2011 (Figure 27b) (IPCC 2013
Dlugokenly et al 2009 Rigby et al 2008) The current contribution of CH4 to
climate change forcing is 18 of the total radiative forcing by all long-lived GHG
Figure 26 Different scales of landfill effects (Scheutz et al 2009
Luning amp Tent 1993)
36
(Foster et al 2007) Radiative forcing denotes to a measure of energy balance of the
Earth-atmosphere system when factors that affect the climate are altered naturally or
by human
In a report by World Bank (2012) the GHG emissions from MSW have emerged as a
major concern as post-consumer waste is estimated to generate almost 5 that is
about 1460 metric ton CO2-eq of the total global GHG emissions Whereas the global
CH4 emissions from landfills are estimated to be between 500 to 800 metric ton CO2-
eq per year (USEPA 2006 Monni et al 2006 Bogner amp Mattews 2003)
Figure 27 Global average of CH4 from 1978 to 2011 and Figure 28 Instantaneous growth
rate of globally averaged atmospheric CH4 for the same period line colours represents
green-quarterly average red-monthly average blue-quasi weekly average (IPCC 2013
Dlugokenly et al 2009 Rigby et al 2008)
37
2102 Odour and weather impact
The odour from landfills caused by secondary emissions is a growing concern to the
area surrounding the landfill Since both CH4 and CO2 are odourless the stench
smells from the landfills often originate from other principal components of LFG such
as H2S and organic sulphur compounds (mercaptanes) (Sitiaishah 2011) Similarly in
a study by Bertacchi et al (1997) the main cause of odour in an Italian landfill was
identified as dimethyl sulphide and carbon sulphite In a case study done at Bisasar
Road Landfill in Durban South Africa the meteorological parameter such as
temperature relative humidity and rainfall were evaluated against the odour
complaint by the surrounding residents The number of complains had increased
during October to January (summer months) when the weather condition was hot
humid and wet (Stretch et al 2001) These results are shown in Figure 29
Figure 29 Temporal distribution of odour complaints and selected weather conditions
from January 1997 to February 2001 at Bisasar Road Landfill Weather data is not to scale
(Stretch et al 2001)
38
2103 Groundwater pollution
Landfill gas (LFG) migrating to the unsaturated zone surrounding the landfill is
exposed to infiltrating water The infiltrating of water is caused by rainfall water
present in the waste itself and water from biodegradation of waste CO2 and CH4 are
water-soluble (the solubility of CO2 is 2320 mg l-1
and only 30 mg l-1
for CH4 at
10˚C) Besides LFG leachate produced by the landfill also contains large amount of
contaminants such as heavy metals which are likely to cause groundwater pollution
In a study by Bundela et al (2012) in Jabalpur India the physico-chemical analysis
of groundwater adjacent to the landfill found that the total dissolved solids (TDS)
varied between 546 mgL to 907 mgL much higher than the permissible level of
India Therefore an engineered landfill with sound leachate removal and treatment
pond will be the best option to cater this sort of problem
211 Landfill CH4 mass balance controlling processes and factors
The landfill CH4 mass balance and quantity of CH4 emitted from landfills are affected
by many different processes It is important that the mass balance must be well
understood before a landfill is designed and properly engineered The processes of
CH4 mass balance are summarized in Figure 210 which shows the migration of CH4
through lateral direction recovery and emission
39
In an earlier study done by Bogner amp Spokas (1993) CH4 mass balance in the landfills
was expressed by the following equation
(all units = mass t-1
)
The CH4 mass balance associates CH4 generation to CH4 transport and microbial CH4
oxidation terms Lateral migration is usually qualitatively monitored at most landfill
sites to some extent using gas probes placed around the landfill perimeter The factors
affecting the transport processes of LFG leading to gas emission or migration in a
landfill are summarized in Table 26 Both ambient and internal factors greatly
Figure 210 Landfill CH4 balance
Lateral migration
CH4 emission
CH4 recovered
Gas well CH4
CO2
Landfill gas
O2 + CH4 = CO2
40
influence the LFG transfer processes Therefore it is well documented that landfill
CH4 emission and migration is controlled by a combination of factors and processes
Table 26 Factors affecting the LFG transport in a landfill (Scheutz et al 2009)
Factors
Meteorological conditions SoilColor conditions Waste amp landfill
conditions
Barometric pressure
Precipitation
Temperature
Wind
Cracks
Permeability
Diffusivity
Porosity
Moisture content
Organic content
CH4 oxidation capacity
Gas production rate
Internal barriers
Gas vents
Lateral Migration
Area
212 Quantification and estimation of LFG
LFG generation rates are currently estimated using mathematical models The input
parameters for these models are amount of waste landfilled for the calculated years
and in most models also a specific composition of the waste Most models calculates
CH4 generation potentials (Lo) degradable organic carbon (DOC) reaction constant
(k) and subsequently the CH4 generation released throughout the years However
some models consider the degradation of waste over the years or decade while some
do not Among the models widely used are the IPCC model the TNO-model the
41
GasSim model the LandGEM model the Alvalzorg-model and the French E-PRTR
model (Oonk 2010)
2121 The IPCC Waste Model
The LFG generation can be modelled empirically using zero-order first-order or
second-order generation model (Beh 2013) However studies have proved that
higher order model have near accuracies to the measured data (Amini et al 2012
Oonk 2010) Generally the first-order models are preferred as the second order
models are more complicated and are not justified by increase in accuracy (Oonk et
al 1994) The IPCC Model or better known as the IPCC Waste Model is based on a
FOD method In this model it is assumed that the degradable organic component in
the waste decays slowly for a few years or even decades During this process the
LFG containing mainly CH4 and CO2 is formed The rate of CH4 production depends
solely on the amount of carbon remaining in the waste provided the conditions within
a landfill remains constant (IPCC 2006) This model has a three tier hierarchy to
calculate estimates of CH4 emissions from solid waste disposal sites (Jensen amp
Pipatti 2006) The higher tier with good quality data estimates more accurate results
The tiers are explained further in Table 27 The tier three calculations are used if
countryrsquos specific data are available The main uncertainties within the model arise
due to the parameter used in this model rather than the method used
42
Table 27 The 3 tiers of the IPCC Waste Model
Tier Description
1 Estimation is based the IPCC FOD method using mainly default data and default
parameter
2 Uses IPCC FOD method and some default parameter and historical waste data
3 Methods are based on good quality country specific data and either uses FOD
methods with
i Nationally developed key-parameter
ii Empirical country-specific parameter with key parameter like half-life
and either methane generation potential (Lo) or DOC content in waste
and the putrescible fraction of DOC (known as DOCf)
This freeware model can be downloaded from the IPCC website and the main input
parameters are amount of waste and waste composition This model is used to
calculate the specific amount of CH4 from the landfill and accommodates four
different climate regions wet boreal or temperate dry boreal or temperate wet
tropical and dry tropical The climate region chosen determines the key parameters
used within the model such as half-life decay rate and degradable organic carbon
The equation used to calculate CH4 emissions in this model is as follow
Where the final amount of CH4 emitted depends on the amount of CH4 recovered and
oxidized by the cover layer (IPCC 2006) A number of studies have specifically
focused on the use of this model which have been carried out in many countries to
obtain a regional and national level CH4 emission estimation (Penteado et al 2012
Abushammala et al 2012 Couth et al 2011 Wangyao et al 2010 Machado et al
2009 Weitz et al 2008 Jha et al 2008)
43
2122 The TNO-Model
The Netherlands Organisation of Applied Scientific Research model or in short The
TNO ndash model describes the LFG generation as a function of amount of waste
deposited from different organics (household waste industrial waste etc) The
degraded organic carbon from waste is used to calculate the LFG produced This
single phase model was used by the Dutch to calculate and report the national
averages of CH4 emission In studies done by Oonk et al (1994) and Scharff amp
Jacobs (2006) CH4 and CO2 measurements from landfills were used to validate the
TNO-model Finally to calculate the CH4 production the LFG generated using the
TNO-model is multiplied with CH4 concentration of 50 and volumetric mass of
714g CH4 m-3
(Scharff amp Jacobs 2006) The formula for the TNO-model is as follow
(Thompson et al 2009)
Where
Q is CH4 production [kty]
DOCf is the fraction of assimilated DOC
M is waste generation [Mty]
DOC is the degradable organic carbon [kgtonne]
k is the decay rate [y-1
]
t is te time of waste disposal [y]
187 is the model multiplication factor
44
2123 The GasSim model
The GasSim model was developed for the Environment Agency of England and
Wales as a risk assessment tool to be used to evaluate the impact of LFG (Oonk
2010) This model quantifies LFG related problems within a landfill ranging from the
CH4 emissions the effects of utilisation of LFG on local air quality and LFG
migration via subsoil to adjacent buildings (Oonk 2010) The GasSim model does not
provide the complete set of equations Calculation modules within the program are
protected from sharing which makes it difficult to be used without purchasing the
software At present the LFG generated is based on the UK Waste Statistics The
principal input for this model is the amount of waste in megagrams (Mg) with the
specific breakdown of the waste into different categories and carbon content (Scharff
amp Jacobs 2006) The basic equation for this model is
2124 The LandGEM
The Landfill Gas Emission model or LandGEM was developed and widely used by
the United States Environment Protection Agency (USEPA) to calculate the LFG
emission from solid waste based on the USEPA standards The model uses the mass
of waste deposited and CH4 generation capacity to determine the mass of CH4 that is
being generated Mathematically LandGEM can be described using the following
formula
45
Where
QCH4 is CH4 emission rate [m3CH4y
-1]
k is CH4 generation constant [y-1
]
L0 is CH4 generation potential [m3CH4Mg waste
-1]
Mi is mass of waste in ith section [Mg]
Ti is age of the ith increment or section [y-1
]
Similar to the IPCC model the LandGEM is based on the FOD method and can be
used with the site specific data or default parameter in the absence of site-specific data
(USEPA 2004) This model too has been widely used by many researchers to
quantify the amount of CH4 generated in landfills (Sormunen et al 2013 Amini et
al 2012 Bella et al 2011 Kamalan et al2011 Tolaymat et al 2010 Cruz et al
2010 Thompson et al 2009 Scharff amp Jacobs 2006)
2125 The Afvalzorg ndash model
This model was developed by NV Afvalzorg in the Netherlands and is based on
combination of literature and own experiences with landfill gas generation (Oonk
2010) In this multi-phase model eight waste categories and three fractions were
distinguished (Scharff amp Jacobs 2006) For each fraction LFG production is
calculated separately The following equation describes the Afvalzorg model (Scharff
amp Jacobs 2006)
46
Where
αt is LFG production at given time [m3LFG y
-1]
ς dissimilation factor
i is waste fraction with degradation rate k1i [kg i kg-1
waste]
c is conversion factor
A is amount of waste in place [Mg]
C0 amount of organic matter in waste [kg per Mg of waste]
k1i is degradation rate constant of fraction i [y-1
]
t is time elapsed since depositing [y]
2126 The French E-PRTR or EPER model
The European Pollution Release and Transfer Register (E-PRTR) is the new Europe-
wide register that provides easy access to environmental data from industrial facilities
in the EU and few other places This register replaces the previous European Pollutant
Emission Register (EPER) Both the EPER and E-PRTR Protocols were used to
determine the pollutant release in the air This model gives two approaches to estimate
CH4 emissions from landfills (i) by using the CH4 emission estimates from LFG
recovery in the landfill or (ii) by using a multiphase model (Oonk 2010) The formula
for this model is as follow (Kamalan et al 2011 Oonk 2010 Scharff amp Jacobs
2006)
47
Where
FECH4 is annual CH4 production [m3 CH4 y
-1]
FE0 is CH4 generation potential [m3 CH4 Mg waste
-1]
pi is waste fraction with degradation rate ki [kgi kg-1
]
ki is degradation rate of fraction i [y-1
]
t is age of waste [y]
Ai is normalization factor
2127 Comparison of models for CH4 generation
All the models above are compared using the CH4 generation potential as shown in
Table 28
Table 28 Comparisons of models for CH4 generation potential L0 (kg CH4 per tonne waste)
and half-lives for biodegradation for household waste (HHW) or MSW (Oonk 2010)
Model L0 (kgtonne) Half-life (year) remark
IPCC-model 63 12-23 (slow)
7 (moderate)
4 (fast degradable)
MSW Europe
TNO-model 60 7 Dutch HHW
GasSim 51 15 (slow)
9 (moderate)
6 (fast degradable)
UK HHW
LandGEM 122
72
14 (conventional)
35 (arid)
MSW USA
Afvalzorg 39-45 23 (slow)
7 (moderate)
3 (fast degradable)
Dutch HHW
E-PRTR (French) 55 5-10 France HHW
213 Validation of Model Performance
Models used to estimate the amount of LFG especially CH4 emission always needs to
be verified and validated for its persistency and accuracy The comparison between
48
observations and predicted CH4 emission concentration was performed by applying
statistical measures of error The measures used reflected different aspect of spatial
distribution of mean concentration and the characteristics of the concentration field
(Cervone amp Franzese 2010) The error function analyses (EFA) that are commonly
used are the fractional bias root mean square normalized root mean square and
geometric variance and correlation functions Further details of this analysis are
discussed in Section 318
214 LFG Collection and Utilization
It is important that the LFG generated at landfills should be collected and utilized to
avoid environmental hazard as well as health risk Besides the potential threats the
LFG collected could be beneficial and in the case of large landfills an income
generator In most countries regulatory requirements have urged the landfill owners
to install a proper LFG control technology (ATSDR 2001) Control technologies are
often installed in landfills to collect control and treat gases and use gases to benefit
the community There are two types of gas collection system (1) the passive gas
collection system and (2) the active gas collection system A passive gas collection
system relies on pressure or concentration gradient to vent LFG into the atmosphere
or a control system Collection wells with vertical vents and gravel trenches are used
to collect the LFG either during the active operation of landfill or after closure
(ATSDR 2001)
49
Whereas in an active system it includes vacuums and pumps to move gas out of the
landfill and piping that connects the collection wells to the vacuum Vacuums or
pumps pull gas from the landfill by creating low pressure within the collection wells
The active system basically consists of vertical gas wells and horizontal collectors
Table 29 shows the comparison between the two collection systems
Table 29 Comparison between passive and active LFG collection system (ATSDR 2001)
Passive Active
Initial amp operating cost low high
Income low high
Pressure gradient positive negative
Gas collection inefficient Efficient and functions with
various gas system
Capacity minimal maximum
In a case study done in Thailand among three different landfill types namely semi-
aerobic anaerobic and gas to energy landfill showed that the gas to energy landfill
with active LFG collection systems had a higher operating as well as highest net
present value (NPV profit) (Pattharathanon et al 2012) The gas to energy landfill
had a NPV of 50 Thai Baht for every tonnes of MSW in one day while the semi
aerobic and anaerobic landfills had NPVs of 5-10 Thai Baht for every tonne of MSW
per day (Pattharathanon et al 2012)
50
In the USA LFG is the largest contributor to the man-made CH4 emission
contributing to almost 40 of the total CH4 emission each year (USEPA 2004)
Several landfills in the USA have reported collecting about 100Nm3 of CH4 per ton of
MSW landfilled in a given year (Themelis amp Ulloa 2007) Adding on to this a total
of 912000kW or approximately 8 billion kWhannum of electricity was generated by
295 LFG recovery facilities in the USA Generally the efficiency of LFG recovery
system in a landfill is between 50-60 (Boumlrjesson et al 2007) but with the state of
art CH4 control system the LFG recoveries can rise to about 97 (Spokas et al
2006)
Likewise LFG could be used as an alternative fuel source Shrestha et al (2012)
reported that LFG has about half the heating value at 16785 ndash 20495 kJm3 (450 to
550 Btuft3) as compared to 35406 kJm
3 (950 Btuft
3) of natural gas It is also a
much cheaper fuel source than natural gas Thus LFG can be utilized as an alternative
energy source which reduces the risk of explosion within a landfill provides financial
benefits for the community conserves other energy resources and potentially reduces
the risk of global climate change (ATSDR 2001) Figure 211 illustrates the
potential usage of LFG collected from landfills as fuel for combustion as well as for
power generation Where as in smaller landfills where such utilization procedures are
not applicable the LFG is flared to become CO2 to reduce the global warming input
of CH4 through direct release
51
Figure 211 LFG collection and utilization system
215 Surface emission of landfill gas
The surface emission of LFG from landfill resources are through diffusion advection
via Darcy Flow and wind induced advection (Scheutz et al 2009) The diffusion
mechanism is caused by LFG concentration variations in soil while advective
transport is due to the pressure gradient The pressure gradient between landfill and
the atmosphere induces further LFG emission through advection Thus without
proper LFG control technologies the landfills are significant contributors to the
atmospheric load of GHG However before any LFG control system is installed it is
important to quantify the amount of CH4 that is being generated and emitted from the
surface of the landfill into the atmosphere Till-to-date there have been numerous
field studies undertaken worldwide to measure the CH4 emissions from landfills
52
through CH4 fluxes The fluxes are normally reported as CH4 emission rate per unit
area
While in a separate study by Bogner et al (1997) the direct field measurements of
landfill CH4 emissions at small scale (lt1m2) varied over seven order of magnitudes
(0001 - gt1000g CH4m2day) This difference in magnitude results from variation in
waste composition cover materials soil moisture temperature and other eminent
variables (Bogner et al 2007) Therefore it can be said that the spatial variability of
CH4 emissions is higher than the temporal variability
2151 Methods used to measure surface emission of CH4 from landfills
Taking into consideration the spatial and temporal variability of CH4 surface emission
from landfills several methods to measure CH4 fluxes from landfills have been
developed tested and adapted (Bogner et al 2007) However there is no single
method that is widely recognized or preferred to measure the annual average of CH4
emissions (Oonk 2010) Normally the choice of measurement is dependent upon the
purpose of the measurement desired scale cost and the available technology The
methods are divided into 3 categories (1) above ground methods (2) ground level
methods and (3) below ground methods All these methods have their uniqueness as
well as advantages and disadvantages Table 210 summarizes the types of
measurement methods commonly used to measure the surface emission of CH4
including its advantages and limitations
53
Table 210 Types of measurement methods used to measure surface emission of CH4 (Scheutz et al 2009)
Application Status and references for method Advantages Disadvantages
Static chambers
Single point measurements for chamber
deployed at surface for variable time periods
(usually less than 1 h) Measures diffusional
flux based on change of gas concentration
within chamber vs time
Most common technique for landfill
emissions Field validated for many
terrestrial ecosystems and landfill settings
(Rolston amp Klute 1986)
A technique suitable for both positive
and negative fluxes Able to quantify
very low fluxes Simple to deploy
with supporting analytical capability
(Gas chromatography detector)
It is labour and time intensive
Appropriate geostatistical techniques
are need for larger measurement area
Ay cause temporary disturbance of
surface soil
Dynamic chambers
Single point measurements at ground surface
using a chamber which continuously flushed
with air or a flux gas Measures flux based on
the gas flow and difference between
incoming and outgoing chamber CH4
concentrations
A common technique which has been field
validated for terrestrial ecosystems and
landfills(Rolston amp Klute 1986)
Similar advantages as static chambers
except it cannot measure the negative
fluxes
Same disadvantages as static chambers
Not able to quantify very low fluxes
because of dilution of chamber gas with
flux gas
Soil core measurements
Soil collected to determine bacterial activity
Soil sample is exposed to high concentration
of CH4 and decrease over time is measured
Also measures oxidation capacity of soil
Measurements are done on ground surface
CH4 and CO2 concentration gradients in
soil are indication of diffusion of gases
through the layer (Bogner etal 1995)
Gives the fundamental steps leading
to emissions
It has a very low spatial temporal
resolution and does not take into
account emissions caused by
convection Labor-intensive too
Field flame ionization detector (FID)
technique
Measures the atmospheric CH4 at a point
directly above the landfill surface
Widely used
Easy and simple to be practised
Gradient techniques
Measurement of below-ground gas
concentration and pressure gradients with
calculation of flux using equations for
diffusional and pressure-driven flux
Limited landfill field measurements but the
basis for many transport models(Glinski amp
Stepniewski 1985)
It is used to measure the relative
contribution of convective flux
diffusion and the influence of short
term changes of barometric pressure
wind driven flux and passing storm
fronts
When there a cover soil and variable
saturation in waste the temporal points
are often difficult to interpret
54
Mass Balance method
Measurements of CH4 fluxes before and after the landfill is done using two imaginary vertical planes CH4 flux is measured as a product of wind velocity at each point
Product of wind velocity and difference in
CH4 concentration is used to calculate CH4
emissions (Oonk 2010)
It is based on a simple and robust
principle It only needs wind direction
and velocity as for emission
calculation
The instruments used are complicated
expensive and less flexible CH4
emission is underestimated at certain
areas like slope
Tracer techniques
Rely on the concurrent measurement of
atmospheric CH4 and a tracer gas (usually
SF6 or N2O) The tracer is released at a
known rate then the rate of CH4 release can
be determined from the ratio of CH4 to tracer
in the downwind plume
A common technique which has been field
validated for terrestrial ecosystems and
landfills(Czepiel et al 1996 Boumlrjesson et
al 2007)
Takes into account the whole landfill
including the edge leakages It gives
an integrated measurement of flux
Not suitable for various topography at
landfill and cannot quantify negative
fluxes Needs tracers gases such as SF6
and N2O which are potent GHG(s)
Micrometeorological techniques
A group of techniques which measure the
turbulent transfer of gases between the land
surface and the lower part of the atmosphere
Rely on tower-mounted fast-response sensors
to measure vertical gradients of wind speed
and direction CH4 concentration and other
variables
Widely used for landscape scale fluxes
from terrestrial ecosystems Has been
sparingly used for landfill CH4 fluxes
(Laurila et al 2005)
Gives an integrated measure of
landscape scale fluxes Best used for
flat terrain It is useful for short-term
and studies under changing
atmospheric conditions
Expensive technique which requires
special equipment and cannot be
applied at various topographies Also
not suitable for negative fluxes (only
uptake of CH4)
Remote sensing and other regional
techniques
Remote sensing techniques rely on tower- or
aircraft-mounted sensors to measure
atmospheric CH4 and other variables Flux is
determined through models andor scaling up
of micrometeorological techniques Regional
techniques encompass both bottom-up and
top-down techniques including inverse
modelling
Used for regional or larger scale
atmospheric studies especially complex
regional air quality studies examining
spatial and temporal variations Robust
methods and models specific for landfill
CH4 not yet field-validated(Modrak et al
2007)
Table 210 (Cont)
55
2152 The flux chamber measurement
The static and dynamic chamber measurement or also known as flux chamber
measurement method were reviewed by numerous researchers through an extensive
body of data gathering (Scheutz et al 2011 2009 Wongyao et al 2010 Ishigaki et
al 2008 Fourie amp Morris 2004 Spokas et al 2003) The operating principals of
chambers are simple and flexible The cost is low and it is also portable It is generally
operated by restricting the volume of air with which the gas exchange occurs to quantify
changes in concentration of gases in the head space (Denmead 2008)
In the static or closed chamber the air circulation in and out of the chamber is hindered
Usually periodic air samples are taken from the head-space with a gas syringe and their
concentration is measured using gas analyzers like gas chromatography While in a
dynamic or flow-through chamber a constant flow of outside air is maintained through
the headspace of the chamber and the difference in concentration between the air
entering and leaving the head space is measured as flux (Denmead 2008) In this study
the closed flux chamber made of plexi glass as discussed in Section 391 was used
In Europe the USA and South Africa the flux chamber measurements were the
predominant method for quantifying surface emission of landfill CH4 (Scheutz et al
2011 Galle et al 2001 Boumlrjesson et al 2000 Boumlrjesson 1997 Czepiel et al 1996)
This method precluded to be inexpensive while still providing meaningful results
56
Disadvantages to this method are normally spatial limitations as well as labor
constrains
In a study by Tregoures et al (1999) seven methods to measure CH4 flux from
landfills were evaluated at French landfill sites with regard to scientific technical and
economic criteria The study found that the chamber methods provided the best overall
measurement strategy in terms of accuracy flexibility and robustness This technique is
also commonly used for CH4 fluxes measurements both before and after placement of
landfill cover layer (Fourie amp Morris 2004) However chambers with small chamber
volume and short gas extracting time (lt3 minute) showed inconsistent CH4 flux
measurement compared to other indirect methods of measurements (Boumlrjesson et al
2000)
Hence suitable chamber volume is required to obtain a representative result Livingston
amp Hutchinson (1995) concluded that flux measurements on sites with large exchange
rate are best served by chambers with large volume to area ratios (VA) typically greater
than 150 Lm-2
Other researchers have scaled the range of ratio between 60 Lm-2
to 300
Lm-2
and with measuring period ranging from 20 to 40 minute (Abushammala et al
2012 Senevirathna et al 2007 Denmead 2008Bogner et al 1997 Reinhart et al
1992)
Chambers are normally made out of stainless steel poly-vinyl chloride (PVC) and fibre-
glass The chamber used in this study was designed according to the specifications
above Details on the design and volume to area ratio are explained further in Section
391
57
216 Meteorological factors influencing the surface emission of LFG
The importance of the meteorological factors influencing the surface emission of
landfill CH4 has been observed on site by various researchers (Wang et al 2012
Czepiel et al 2003 Christophersen et al 2001 Galle et al 2001) In addition to this
gas flux models by Young (19901992) Naster et al (2001) and Poulsen et al (2003)
have used barometric pressure as its key variable
Figure 212 shows a conceptual diagram for LFG flow rate and composition as well as
the connection between atmospheric pressure temperature and other weather
parameters As a result the LFG emission is delicately dependent on the atmospheric
pressure variation which is induced by temperature air intrusion and other
meteorological factors (Gebert amp Groengroeft 2006) The atmospheric pressure
perturbs the LFG pressure gradient in the landfill Therefore when there is positive
LFG pressure gradient CH4 gas emission increases However when a negative LFG
pressure gradient occurs the air is in-fluxed The air influx reduces CH4 to the
atmosphere but increase the potential risk of explosion within a landfill
58
2161 Atmospheric pressure
Czepiel et al (2003) examined the influence of atmospheric pressure on landfill
methane emission from 12 individual emission tests and concluded that the measured
emissions were negatively correlated with surface atmospheric pressure The results
from the test had a 093 correlation coefficient when modelled by linear regression
Figure 213 shows the CH4 emission and pressure relationship from the test (Czepiel et
Auto-oscillation
of air
Δ temperature Δ general weather
station
Δ atmospheric
pressure
[CH4] darr [O2] uarr [CH4] uarr [O2] darr
Air influx Gas emission
Negative (-)
LFG Pressure
Positive (+)
LFG Pressure
Figure 212 Conceptual diagram on the regulation of LFG emission in a
landfill Δ = difference LFG = landfill gas [CH4]= methane concentration
[O2] = oxygen concentration uarr = increase darr = decrease (Gebert amp
Groengroeft 2006)
59
al 2003) The different shapes in the figure represents different period of measurement
while the error bars indicate the coefficient of variation of each measurement
2162 Rainfall
The effect of rainfall on the surface emission of CH4 at landfills had contradicting
evidences In a study at nine solid waste disposal sites in Thailand it was found that
CH4 emissions during the rainy season were about five to six times higher in magnitude
compared to winter and summer season (Wangyao et al 2010) Comparatively in a
research conducted at the Sudokwon Landfill in South Korea a different reasoning was
Figure 213 CH4 emissions vs atmospheric pressure Solid squares are data from August
1996 solid circles are data from February 1997 and solid triangles are data from March and
April 1997 The error bars represent the coefficient of variation of each measurement The
solid line is the linear regressions of these data with its equation of the regression line and r2
Source Czepiel et al (2003)
60
given to the higher CH4 emissions during the rainy season (Park amp Shin 2001) Due to
much ground water content during the rainy season the surface pores at the landfill are
blocked Thus this accelerated the CH4 flux through the remaining open pores
However when it was a sunny day CH4 is easily released through many pores on the
surface and eventually escapes to the atmosphere (Park amp Shin 2001) So
quantitatively more CH4 is emitted through the surface during the hotsunny days
2 16 3 Temperature
In general the thermal regime of landfills is controlled by climatic and operational
conditions of a landfill The temperature in the landfill plays a key role in determining
the long-term potential of LFG production and emissions Wang et al (2012)
concluded that high temperature (30˚C to 40˚C) accelerated the waste degradation and
gas generation thus increasing the higher possibility of surface emissions of CH4 In an
earlier study by Park amp Shin (2001) they had examined the diurnal and seasonal
variation of CH4 from landfills Results from the diurnal variation concluded that the
surface CH4 emission was scarce during the minimum temperature of the day and rose
to a peak when the temperature was at a maximum Figure 214 shows the variation of
flux rate according to time of the day A significant peak of LFG was generally obtained
during the hottest time of the day which is around 2pm (Park amp Shin 2001) Viewing
the recorded of the seasonal variation they summarized that the CH4 flux rate decreased
from summer to winter
61
The influence of ambient temperature on the LFG emission was studied by researchers
in the past (James et al 2008 Yesiller et al 2008 Einola et al 2007 Townsend et al
1996 Attal et al 1992) and was mostly concentrated in temperate countries like
Alaska British Columbia Michigan Finland and New Mexico Alternatively Robinson
(2007) found that the rapid transition from acetogenic to the methanogenic phase of the
landfills in the warmer climates were two to three times faster than that of the landfills
in temperate countries Blakey et al (1997) had summarized that temperature is an
important factor which affects the CH4 content in LFG So it is important for landfills to
operate under optimum temperature for faster LFG production and refuse stabilization
(Wang e al 2012)
Figure 214 Variation of LFG flux according to the time of the day (Park amp
Shin 2001)
62
217 Landfill cover
The two main recommendations put forward by the IPCC as strategies for potential
mitigation of CH4 from the waste sector are (1) the enhancement of landfill CH4
recovery and utilization and (2) the optimization of methanotrophic CH4 oxidation in
landfill cover soils and biofilter (Polettini 2012 Huber-Humer 2011 IPCC 2007) The
former strategy are often adapted in most of the larger landfills while the latter strategy
is a common practice in smaller and older landfills which do not produce much LFG for
gas recovery and utilization (Chanton et al 2011 Stern et al 2007) However a
landfill cover is an essential mitigation practice in both larger and small landfills as an
effort to reduce lateral migration of CH4 from the landfill cover Therefore the landfill
cover soil acts as the environmental interface between the waste layer and atmosphere
(Jing et al 2011) Landfill cover with the potential microbial activities from
methanotrophs has been frequently verified in the past years (Huber-Humer et al 2008
Scheutz et al 2009) and the following benefits were identified
a) reduction of gas emissions especially CH4
b) protection of the sealing element (eg capillary barrier)
c) growth of vegetation ability of root penetration and sustainable nutrient supply
d) optimization of water balance and water holding capacity
e) prevention of direct contact between harmful substances and environment
f) stability especially at long and steep slopes
63
2171 Different types of cover material
In a review by Scheutz et al (2009) different types of cover materials had been used as
the landfill cover to obtain maximum CH4 oxidation capacity to reduce the impact of
CH4 emission to the environment and health Each of these materials was studied in the
laboratory using the incubation experiments (batch test) or in continuous gas flow
system (packed column test) to simulate and control the external factors involved in the
actual environment Among the materials used were sand coarse sand humid soil clay
landfill soil and waste soil from landfill reactor The materials tested were later applied
to field studies to evaluate its actual performance in CH4 oxidation It was noted that in
both tests the CH4 oxidation rate in landfill cover soil has been more than 100 microg CH4
g-1
h-1
and 200 g CH4 m-2
day-1
respectively (Scheutz et al 2009)
2172 Biocover
In the 2007 IPCC AR4 report on climate change mitigation efforts biocovers and
biofilters were listed as the key mitigation technologies and practices to reduce GHG
emissions from landfills (Bogner et al 2007) Biocovers are organic filter material
which supports the growth of methanotrophs for CH4 oxidation when placed upon a gas
distribution layer made of gravel (Pedersen et al 2011)
Biocovers are normally rich in organic matter and from previous studies it is evident
that this condition enhanced the microbial CH4 oxidation in landfill cover soil compared
to the use of pure clay cover (He amp Ruan 2008 Stern et al 2007 Abichou et al
2006) He et al (2008) established that compared to a clay soil biocovers made from
64
organic waste products like compost could reduce CH4 emission to the atmosphere by
about 374 kg CH4 per m2 annually The biocover is routinely spread over a certain
level of depth above the waste layer to act as a medium for CH4 oxidation
218 Methane oxidation in landfill cover
Scheutz et al (2009) reported that around 20cm to 40cm below the surface in zones
where vertical profiles of CH4 and O2 overlap the CH4 oxidation is at its greatest CH4
oxidation occurs at the interface of aerobic and anaerobic zones where CH4 is generated
in anaerobic regions below and methane uptake occurs in aerobic zones above The
first experiment to quantify methane oxidation in landfill cover was done by Whalen et
al (1990) using laboratory batch experiments 45g CH4msup2d ( = 63L CH4msup2d) was
rapidly oxidized in a landfill topsoil in a closed municipal solid waste landfill where the
CH4 concentration was between 1 ppm to 10000 ppm Capacity for CH4 oxidation was
observed in landfill cover soil in column experiments with rates as high as gt200 g
CH4msup2d (Scheutz et al 2003 DeVisscher et al 1999) High methane oxidation
capacity could be found in porous coarse and organic-rich substrates (Croft and
Emberton 1989)
219 Methanotrophic activity in landfill cover
Methanotrophs are a physical group of bacteria that are unique in their ability to utilize
CH4 as carbon and energy source Whalen et al (1990) was the first to recognize the
65
importance of methanotrophs in landfill soils followed by a more comprehensive review
on the properties of methanotrophs by Hanson amp Hanson (1996) The former had
estimated that methanotrophs were able to convert about 50 of the CH4 emitted from
the landfill surface while the latter was able to define the characteristics of the
methanotrophs and narrate the complete pathway for the microbial oxidation of CH4 to
CO2 Figure 215 shows the pathway for the microbial oxidation including the
intermediate steps of CH4 oxidation into methanol then methanol into formaldehyde
(CHOH) the subsequent oxidation of formaldehyde to formate (CHOOH) and finally
into CO2
220 Factors influencing methanotrophic activity in landfill cover
There are a number of factors that influenced the methanotrophic activity in the landfill
cover The most important factors are temperature moisture content pH CH4
Figure 215 The pathway for methane oxidation and assimilation of formaldehyde by
Methanotrophs (Hanson amp Hanson 1996 and Scheutz et al2009)
66
concentration O2 supply organic content and nutrients (He amp Ruan 2008 Einola et al
2007 Hanson amp Hanson 1996) Thus these parameters are very important in
controlling CH4 oxidation in a landfill Hanson amp Hanson (1996) have also observed
that a shift in any of these environmental stimuli response to changes in the
methanotroph population in the cover soil
2201 Temperature
Temperature is one of the most important element for the methanotropic activity in the
cover soil The optimum temperature helps to maximize CH4 oxidation with addition to
construct a better landfill cover Since most methanotrophs are mesophiles the optimum
temperature range for CH4 oxidation in soil environment was around 25˚C to 35˚C
(Scheutz et al 2009 Hanson amp Hanson 1996) Einola et al (2007) also reported
similar optimum temperature which ranged from 20˚C to 38˚C While in temperate
countries during winter when the atmospheric temperature is between 5˚C to 10˚C CH4
oxidation is reduced significantly or even reaches a plateau The Q10 describes the
value for number of times the oxidation rate increases when temperature is increased by
10˚C at temperature below the optimum temperature Higher Q10 value indicates higher
CH4 oxidation For temperatures ranging from 10˚C to 30˚C the Q10 value was
observed exponentially between 17 to 41 suggesting that mesophilic methanotrophs
are the main consumer of CH4 in the biocover soil (Scheutz et al 2009 Park et al
2005 Scheutz amp Kjeldsen 2004 Czepiel et al 1996)
67
2202 Moisture Content
The moisture content typically follows a parabolic curve on the CH4 oxidation rate in
the cover soil This indicates that the CH4 oxidation is reduced at both very low and
high moisture content of the cover (Scheutz et al 2009 Einola et al 2007 Park et
al 2005 Scheutz amp Kjeldsen 2004) Since moisture content within the soil is the main
transport medium of the nutrients for microbial activity it is an essential factor for CH4
oxidation Besides microbial activity the optimum soil moisture content is also
important to maximize gas phase molecular diffusion of LFG In addition to this soil
texture pore size distribution and water retention capacity of the soil also aide the
gaseous transport From previous literatures the optimum soil moisture content for
landfill cover soils ranged between 10 to 20 of wet weight basis and 45 to 110
of dry weight basis ( Scheutz et al 2009 Mor et al 2006 Czepiel et al 1996 Whalen
et al 1990) The moisture content of the cover soil was closely related to the
temperature range of the cover soil (Einola et al 2007)
2203 pH
Previous studies suggest that the optimum pH for CH4 in the cover soil was between pH
55 and pH 75 (Scheutz et al 2009 Scheutz amp Kjeldsen 2004) This pH range
maximizes the growth of methanotrophs and is in consistent with the pure cultures of
methanotrophs by Hanson amp Hanson (1996) Similar results of pH range were also
presented by Navarani (2009) Sitiaishah (2011) and Jayanthi (2013) for maximum CH4
oxidation According to Pawloska (1999) no significant methanotropic activity was
observed between pH 761 and pH 889 The pH of the cover material used in the
68
studies were lowered using acid substances and raised using lime for studying the
optimum pH for methanotrophic activities for maximum CH4 oxidation The pH used
was from pH 5 to pH 8
2204 Methane concentration
The response of CH4 oxidation within cover material or soil varies with the CH4
concentration The vertical profile of the cover material is exposed to different amount
of CH4 The deepest layer of the landfill cover will be exposed to the highest amount of
CH4 (He amp Ruan 2008) Previous studies by Jayanthi (2013) Navarani (2009) and
Perdikea et al (2008) showed that cover material between the 40 to 60 cm thickness is
sufficient for CH4 oxidation Therefore it is essential for the cover material to be
implanted to a certain depth to produce maximum CH4 oxidation Cover material which
are too thick or too thin are not cost effective and a waste of resources It is important
to the CH4 content in the LFG for effective cover material to be applied Maximum CH4
oxidation is said to occur when suitable environment exists with the presence of
methanotrophic bacteria optimum O2 and CH4 ratio and good retention time (Jayanthi
2013)
2205 Oxygen supply
Oxygen is required to oxidize CH4 produced by the methanotrophs The stoichiometry
equation below states that two molecules of O2 per molecule of CH4 are needed for
microbial CH4 oxidation as shown below
69
However in most of the landfills O2 penetration depth will often be the limiting factor
of CH4 oxidation process In relation to this soil texture and composition pore size and
porosity are important parameter to aide this process However O2 supply into the cover
soil also deprived from CH4 when landfills use low permeable cover to hinder rainfall
infiltration and subsequent leachate production (Scheutz et al 2009) In a study by
Wilshusen et al (2004) it was established that an O2 range between 045 to 20
supported maximum CH4 oxidation
2206 Organic content and nutrient
Huber-Humer et al (2009) recommended the minimum organic content in any
biocover or cover material to be 15 of its dried mass or weight This value was used
as a threshold criterion to access the performance of different biocover or cover material
used in CH4 oxidation (Pedersen et al 2011 Huber-Humer et al 2009) Another
important factor is the availability of nutrients such as N in the cover material N
specifically inorganic N in the form of ammonia (NH4+) and nitrate (NO3
-) helps to
stimulate or inhibit CH4 while oxidizing it in the cover material (Scheutz et al 2009)
221 Organic waste as Biocover
Many researches have used various materials as biocover for CH4 oxidation in landfills
Sand clay and soil are among the commonly used materials as it is easily available to
the landfill operators Although these materials have been good landfill caps but CH4
70
oxidation rate remains low in some cases This result emphasized the importance of
texture pore size and porosity of the cover material for the enhancement of microbial
CH4 oxidation (Rachor et al 2011 Maurice amp Lagerkvist 2004)
The use of organic waste such as compost as a biocover material has been given due
importance for its high CH4 oxidation rate in a landfill cover Among the organic waste
commonly use a direct or supplementary material for landfill covers are food waste
agricultural waste garden waste animal manure and sewage sludge This sort of
manipulation of landfill covers or better known as engineered materials provides a
promisingly complementary strategy for the control of CH4 emission
2211 Compost
Compost is mixture of organic residue and soil or organic residue only that has been
piled moistened and have undergone aerobic biological decomposition Compost is
normally made from residues of garden waste agricultural waste and animal manure
Compost is normally rich in organic matter and a suitable medium for methanotroph
activities A number of studies by Abichou et al (2006) Stern et al (2007) and He et
al (2008) also concluded that compost rich in organic matter showed better microbial
CH4 oxidation compared to pure clay cover While in year 1999 and 2001 researches
done by Humer amp Lechner (who studied compost made from MSW and sewage sludge
as a cover material) discovered that 100 CH4 oxidation was possible with the use of
these materials Furthermore engineered biocovers like this have been known to
71
effectively perform multiple annual cycles of CH4 oxidation in northern temperate
climates (Huber-Humer 2004)
In separate studies performed by Navarani (2009) Sitiaishah (2011) and Jayanthi
(2013) the performance of compost made from grass clippings and cow manure were
examined in laboratory scale batch and packed column test for CH4 oxidation rate All
compost used showed 100 CH4 oxidation capacity varying only in the number of days
for the maximum CH4 oxidation Therefore this proves that compost is an effective
cover material for CH4 oxidation
222 Response Surface Modeling
Response Surface Modelling (RSM) is used to design the best combination of
experiments needed to choose the optimum parameters without carrying out large
number of experiments to save time and resources (Guo et al 2009 Bhunia amp
Ghangrekar 2008) This method which uses the mathematical modelling and
optimization studies using a three-factor three-level Box-Behnken experimental design
for excellent predictability and fewer experiments compared to other designs
(Yetilmezsoy et al2009) In this study the experimental design was applied to
determine optimum pH moisture content and temperature to determine the optimum
parameter required for maximum CH4 oxidation within the biocover material
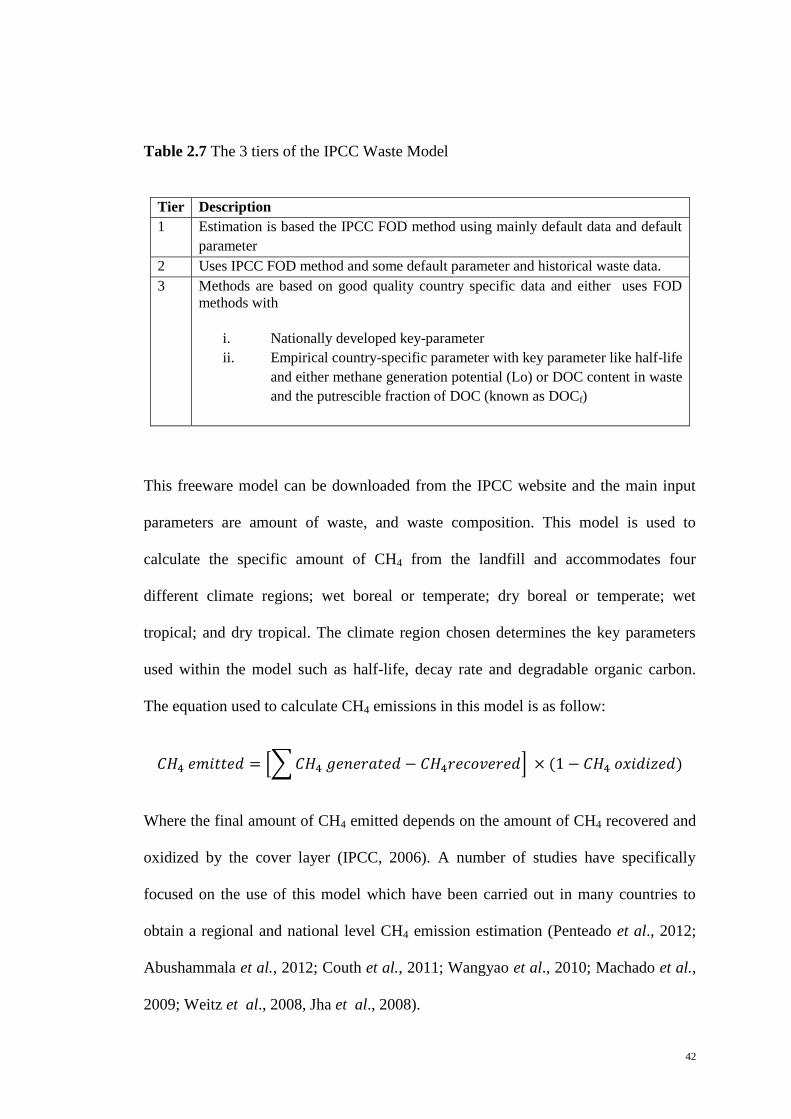
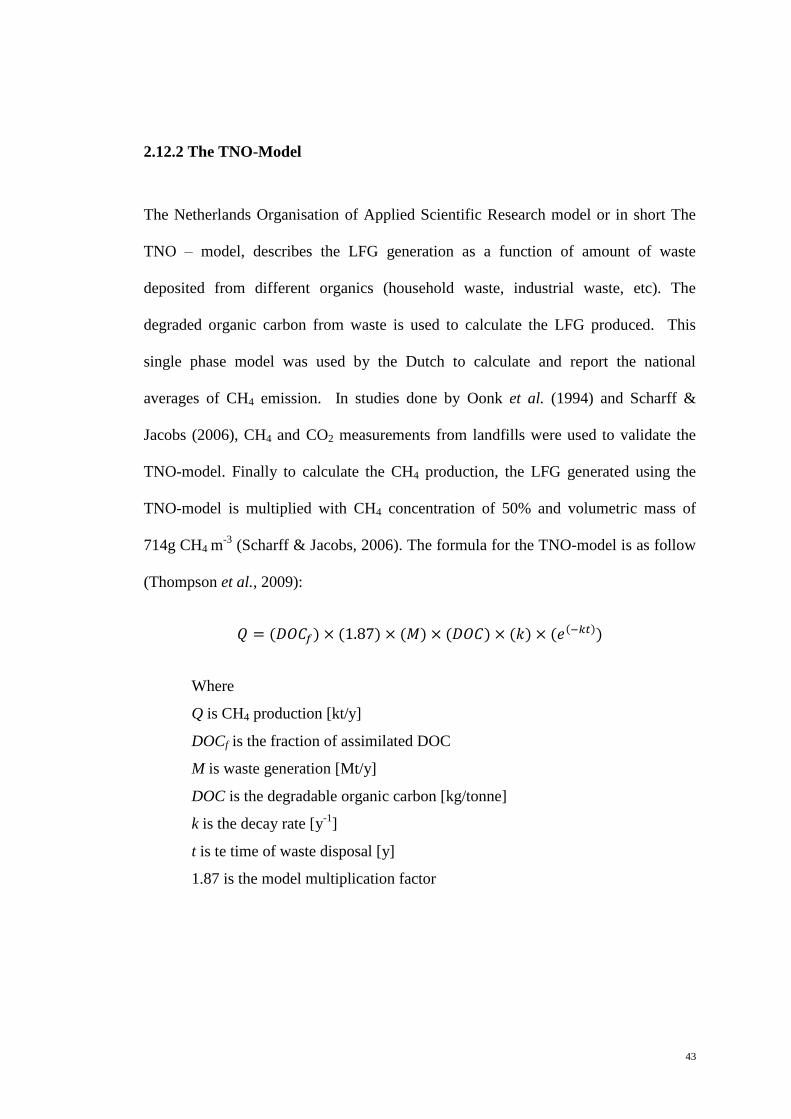
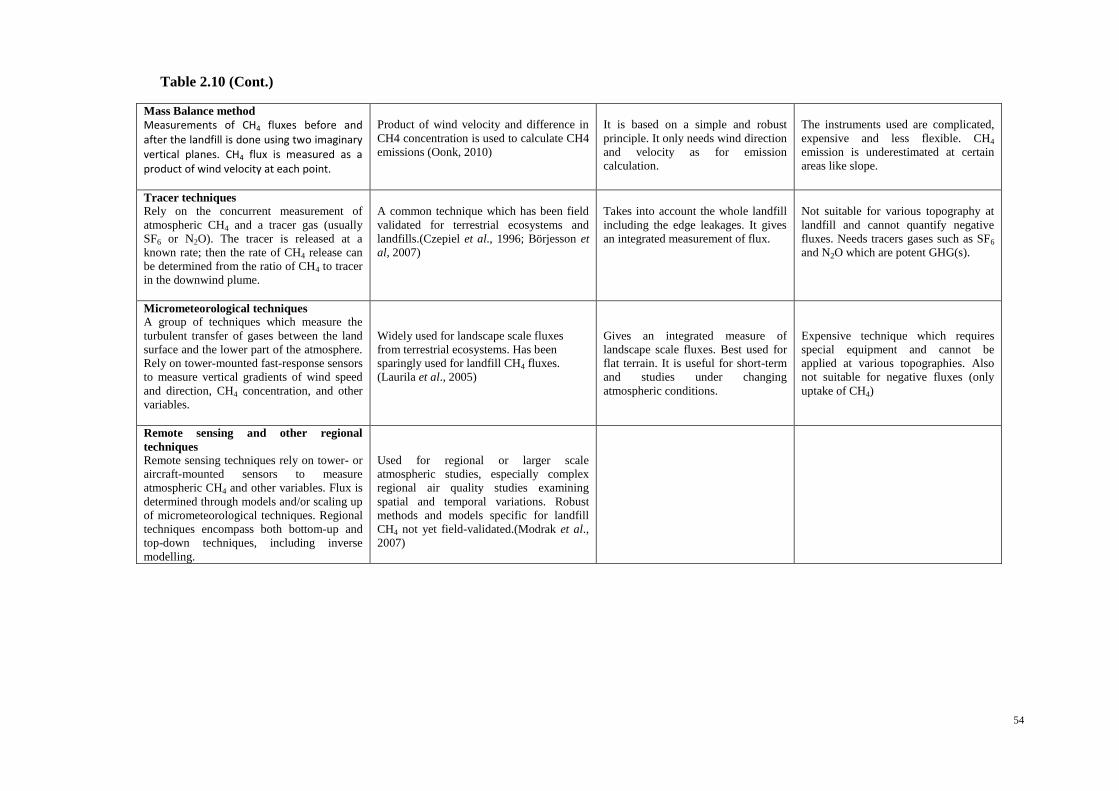
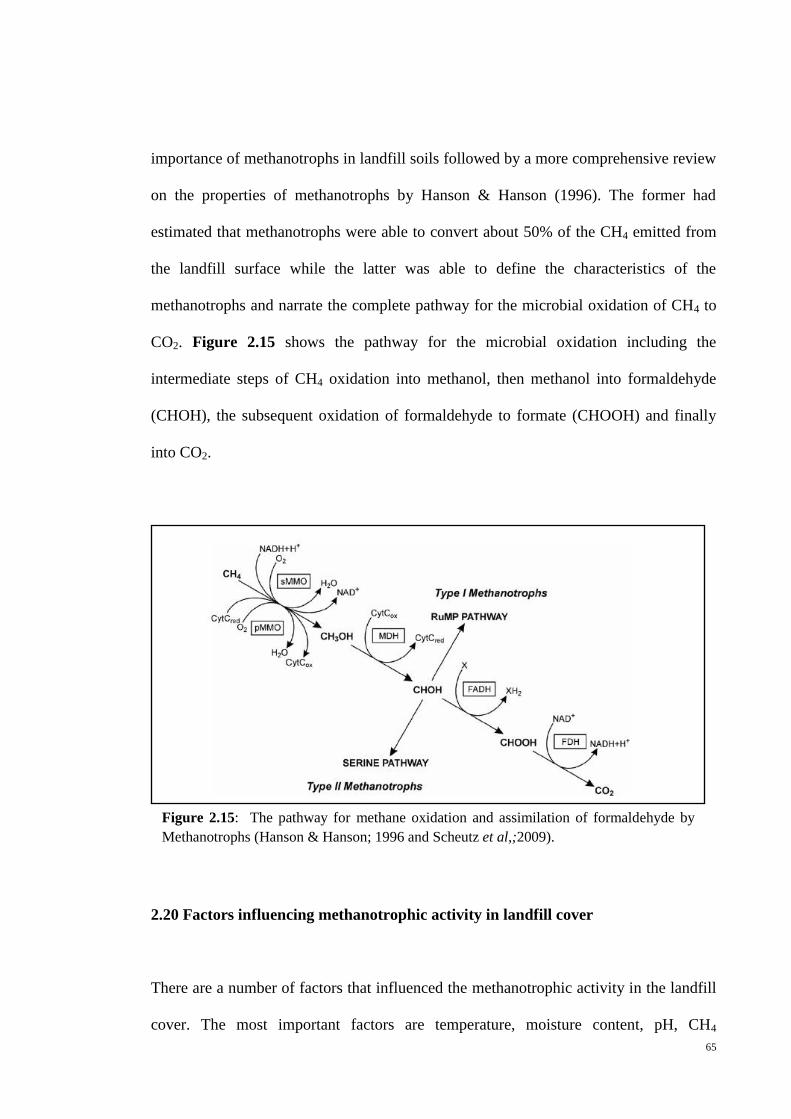