Embed Size (px)
Citation preview
32
Chapter 2: Literature survey
4.1. Introduction
In component based software development, selection of suitable components at a proper
time is a prerequisite to achieve objectives of improved product quality within time and
budget constraints. Component evaluation is a critical activity in the component selection
process. A component has to be evaluated technically (functionality and quality) as well as
non-technically (cost, vendor support) (Brereton and Budgen, 2000). Several component
quality attributes such as reusability, and maintainability depend upon the structural
properties of its design (Cai et al., 2000). One method of component evaluation is to
evaluate its design for various concepts such as complexity, coupling, and cohesion.
Software metrics are useful in many ways to create quality software products within
budget and time constraints. They help in project estimation and progress monitoring,
evaluation of work products, process improvement, and experimental validation of best
practices (Grady, 1994). Here the focus is on product metrics. This chapter presents a
review of metrics in two paradigms of software development that encourage software
reuse: component based software development, and object oriented software development.
4.2. CBSE Metrics
Existing software reuse metrics may be divided into two main categories (Mascena et al.,
2005): Economics Oriented Reuse Metrics and Models (EORM), and software Structure
Oriented Reuse Metrics (SORM). Economics oriented metrics and models aim to assess
the impacts of reuse programs in organizations and are associated with return on
investment (ROI) models. Whereas software structure oriented reuse metrics are generally
concerned with what is being reused and how it is being reused from a technical
standpoint.
Poulin suggests that in CBSE, metrics can be used to assess productivity (development
time/size), quality (defect density), product stability (number of open change requests),
program design and coding (SLOC, and CK-metrics), performance (response time, and
throughput), and reuse (reuse percent, and cost/benefit of reuse) (Poulin, 2001). Software
reuse metrics (Mili et al., 2002; Frakes and Terry, 1996) may be divided into five main
categories-
33
• Metrics which measure the extent of reuse within a software application,
• Metrics which measure the consequences (cost/benefits) of reuse in an application,
• Reuse library (repository) metrics and
• Metrics which measure the ability to use a software component in a context other
than that for which it was originally developed also known as reusability metrics.
• Metrics to evaluate quality of a reuse based application.
The first category aims at measuring the extent of reuse of already existing parts. One
commonly used metric is the reuse level metric defined as
Reuse level = Number of items reused /Total number of items in a program, where
item depends on the level of granularity chosen for program elements such as LOC,
methods, Classes, Packages, Files etc.
An example of the second category of metrics is the Rb metric designed to measure benefit
associated with reuse within a system S. Rb is defined as
Rb = (Cnoreuse-Creuse) / Cnoreuse, where Creuse is the cost of developing S without reuse,
Creuse is the cost of developing S with reuse. Rb(S) takes values between [0, 1].
Another category of metrics related to reuse are reuse library metrics. In order to be useful,
a reuse library must support the component search and retrieval activities efficiently. A
reuse library can be evaluated using metrics like efficiency (memory storage, retrieval
speed), quality of assets (time in use, reuse statistics).
Another important reuse measurement area concerns the estimation of reusability of a
component which is the focus of study of this research. Such metrics are potentially useful
in two key areas of reuse – reuse design and re-engineering for reuse since they guide how
parts should be designed to make them more reusable (Frakes and Terry, 1996; Almeida et
al., 2007). A component which satisfies general requirements of a domain is more
reusable. An example is a component which can sort a list of any type of data (numbers,
strings etc), in any order (ascending, descending). Such component is more reusable than a
component which can sort numbers only in ascending order.
Poulin gives a list of empirical studies, which use structural attributes of a program to
predict its reusability (Poulin, 1994). Different sets of attributes have been used for
reusability prediction such as number of Lines of Code (LOC), Comment to Code Ratio,
Code Complexity etc. (Selby, 2005). This research work focuses on object oriented
software components to evaluate deign of software components which are reused.
34
4.2.1. System Level Metrics
4.2.1.1. Sedigh-Ali et al.’s (2001) Metric suite – Sedigh-Ali et al. classify metrics for
component based systems in three categories: management, requirements, and quality.
Management related metrics include cost of product, time to market, maturity of software
development environment, and Software resource utilization. Requirement related metrics
include: requirement conformance, and requirements stability. Quality related metrics
include: adaptability, complexity of interfaces, integration test coverage, end-to-end test
coverage, cumulative number of detected faults, reliability, and customer satisfaction.
These metrics are just general ideas. There is no formal specification or validation for the
metrics.
2.2.1.2. Alhazbi’s (2004) Complexity Metric – In a component based system,
complexity results from dependencies in components of the system. This metric uses inter
component dependency information to measure complexity of a component based system.
Definition of the metric is based on the concept of Component Dependency Graph (CDC)
(Li, 2006), whose vertices represent components, and edges represent the dependencies
between components. The CDC is represented in matrix form, the adjacency matrix DM,
with cells of the matrix containing a 1 if dependency exists in the corresponding
component pair and otherwise a 0. Another matrix is created, called DIM, in which each
cell contains the number of paths between different components in the graph. Dependency
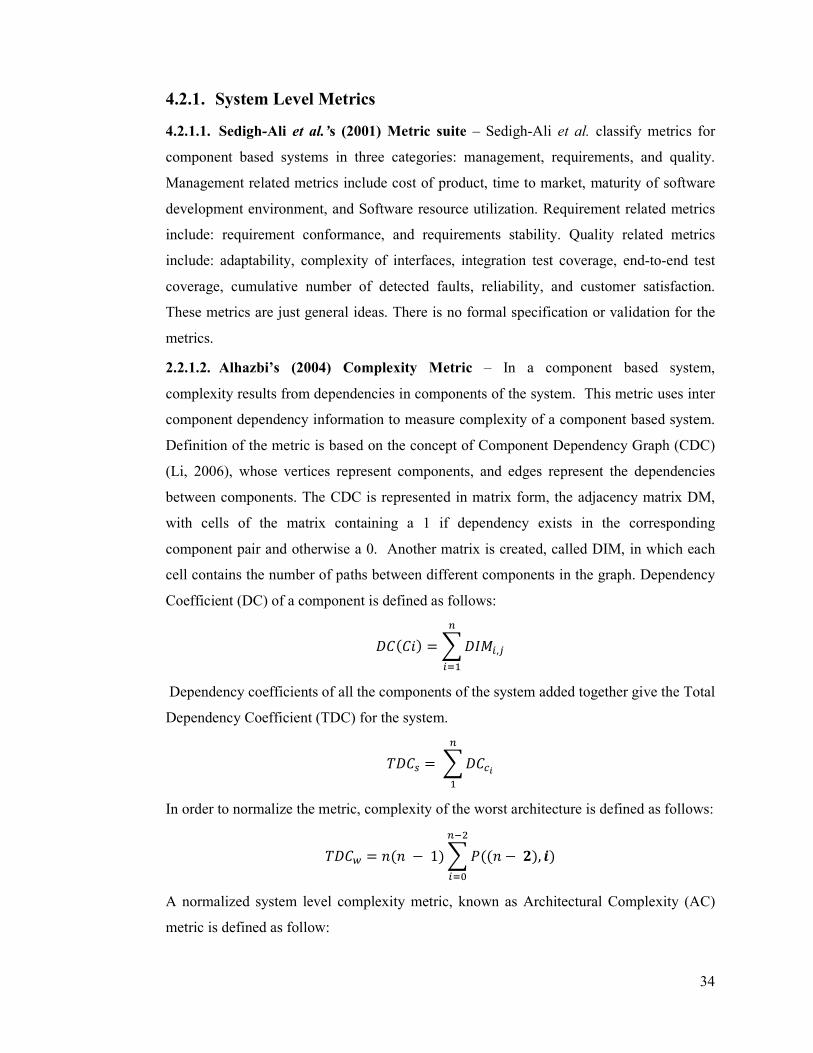
Coefficient (DC) of a component is defined as follows:
������ = � ��,�
��
Dependency coefficients of all the components of the system added together give the Total
Dependency Coefficient (TDC) for the system.
���� = � ���� �
In order to normalize the metric, complexity of the worst architecture is defined as follows:
���� = ��� − 1� � ���� − ��, �� ����
A normalized system level complexity metric, known as Architectural Complexity (AC)
metric is defined as follow:
35
��� = ��������
However, there is no validation study for this metric.
2.2.1.3. Salman’s (2006) System Complexity Metric - Salman adopted the definition of
component based software given by Szyperski (1999). Several metrics are defined to
measure a component based system mainly focusing on its structural complexity. Main
attributes that determine complexity of structure of a component based system are
identified as: components, connectors, interfaces, and composition tree. The metrics are
discussed below:
a. Component Metrics –
� Total Number of Components (TNC) in a system.
� Average Number of Methods per Component (ANMC) – It is calculated by
dividing the total number of methods implemented in all the components by the
total number of components.
� Total Number of Implemented Components (TNIC)
b. Connector Metrics –
� Total Number of Links (TNL) – total number of links in the design of a system.
� Average number of links between components (ANLC)
� Average number of links per interface (ANLI)
c. Interface Metrics –
� Average number of links per interface (ANLI).
� Average number of interfaces per component (ANIC).
d. Composition Tree Metrics –
� Average number of interfaces per component (ANIC).
� Width of the composition tree (WCT).
Metric set is validated using a set of properties adopted from the existing proposals
(Weyuker, 1988). An empirical validation of the metrics, on software projects developed
by students, reported metrics as significant indicators of product quality: maintainability
and integrability.
2.2.1.4. -arasimhan and Hendradjaya’s (2007) metric suite - The metric suit proposed
by Narasimhan and Hendradjaya includes static and dynamic metrics to measure
36
complexity and criticality of a component based system. The metric suite has two static
metrics to measure complexity: component Packing Density (CPD), and Component
Interaction Density (CID). CPD is the ratio of sum of constituents of all components to the
total number of components in the system. Types of constituents are LOC, classes, or
modules. A system with high value of CPD is a complex system. Interaction density of a
component is defined as the ratio of actual number of interfaces utilized to the total number
of interfaces made available by the component to the system. Average Interaction Density
(AID) is the average of interaction densities of all components in the system.
The metric set has four static metrics to measure criticality: Link Criticality, Bridge
Criticality, Inheritance Criticality, and Size Criticality. Link Criticality metrics measure the
number of components whose number of links with other components in the system exceed
a threshold value. Bridge criticality metric counts the number of bridge components in the
system. Inheritance criticality metrics count the number of root components in the system.
Size criticality metric counts the number of components whose size exceeds a threshold
value. An overall criticality metric, obtained by adding the four types of criticality metrics,
indicates the criticality level of the system.
The triangular metric in the static category combines the CPD, CID and criticality metrics
and helps to classify software systems.
The dynamic metrics in the metric suit are: Number of cycles, Active component, Average
number of active components, Active Component Density, Average Active component
Density, and Peak number of Active components.
The authors validated the metrics theoretically using Weyuker’s (1988) properties and also
proposed a framework which establishes a link between these metrics and the quality
factors defined in McCall’s (1976) quality model.
2.2.1.5. Gill and Balkishan’s (2008) complexity metric – A large number of
dependencies among components of a system raise its level of complexity. Authors
propose dependency oriented metrics to measure complexity of CBS. They classify
dependencies in components of a component based system in two categories: internal
dependencies (intra-component), and external dependencies (inter-component). Using the
concept of external dependencies, they define two metrics for black box components:
Component Dependency Metric (CDM), and Component Interaction Dependency Metric
(CIDM). A brief description of the metrics follows:
37
a. Component Dependency Metric (CDM) – it measures the dependencies that a
component has with other components in the system. A dependency graph for a
component based system contains n nodes corresponding to n components in the system
and e number of edges corresponding to dependencies in these components. An
adjacency matrix (of the order n x n) represents the dependency graph between, with a 1
in (i, j)th
cell if there is a path from ith component to jth component. Dependency of an
ith
component denoted by Di is the sum of paths from ith
component to all other
components in the system (taken in pairs). Component Dependency Metric for a system
is the sum of dependencies of all components in the system.
b. Component interaction Dependency Metric (CIDM) - it is the ratio of number of direct
interactions between component pairs to the total number of components in a system.
The paper also describes calculation of metrics by applying them to some hypothetical
cases. There is no theoretical/empirical study of the metrics.
2.2.1.6. Wei et al.’s metrics (2009) for component based software architecture –
Metrics have been defined to evaluate the structure of a component based software system
at architecture level in order to predict the properties (such as risk analysis, maintenance
effort) of the system before it is built. Wei et al. define a component assembly graph to
represent the architecture of a component based software system at a higher level of
abstraction. Metrics are defined using the Component Assembly Graph:
a. Size of the Architecture- It counts the number of components in the architecture of a
component based software system. It is denoted by N and is defined as N=|V|, where V
is the set of components in an architecture.
b. Component Density of Architecture – The degree of a component (or a node in a
Component Assembly Graph) is defined as the number of components connected to the
component and is denoted by ∆i. The Degree of architecture is denoted by ∆ and is
defined as maximum of the degrees of components in the architecture. Component
Density of Architecture is the average degree of a component in the architecture.
c. Average Distance of Architecture – The Average Distance of Architecture is the
average distance between components in the architecture. Distance between any two
components in a component assembly graph of architecture is the number of connectors
on the shortest path between them, and is denoted by d(x, y). The Diameter of
architecture is the maximum of the inter-component distances. Average Distance of
Architecture for a component system is defined by:
38
= ∑ ��"�#� − #
Pi is the number of shortest paths of length i between any two pairs of components.
4.2.2. Component Level Metrics
4.2.2.1. Cho et al.’s (2001) component metrics to measure component quality –Authors
suggest metrics to measure a component’s quality in terms of its complexity,
customizability, and reusability.
a. Component Complexity Metric – this metric takes into account 4 types of complexity
metrics: Component Plain Complexity (CPC), Component Static Complexity (CSC),
Component Dynamic Complexity (CDC), and Component Cyclomatic Complexity
(CCC). The CPC metric is the sum of elements of the component (classes, abstract
classes, and interfaces), added complexity of all classes, and added complexity of all
methods of the classes. The CSC metric measures the complexity of internal structure of
a component. It is the weighted sum of different types of relationships in a component.
The CDC metric focuses on the complexity of message passing occurring internally in a
component. Unlike other metrics which are available at design stage, the CCC metric is
available after implementation. It is similar to the CPC metric, only with a difference
that it uses McCabe’s complexity metric to measure complexity of method of a class.
b. Component Customization Metric – It measures the variability of the methods in a
component’s interface. Metric is the ratio of number of methods for customization to
the total number of methods declared in all the interfaces of the component.
c. Component Reusability Metric – it measures the reusability of a component at design
phase of the component development process. The metric, component reusability (CR),
is calculated as ratio of sum of interface methods providing commonality functions in a
domain to the total number of interface methods in a component.
The way to calculate these metrics have been demonstrated using an application from the
banking domain. The metrics are believed to indicate some properties of a software
component such as understandability, maintainability, and reusability. However, there is no
empirical study to confirm these claims.
4.2.2.2. Washizaki et al.’s (2003) metrics set for JAVA components - Washizaki et al.
define a set of metrics to measure the reusability property of blackbox components which
are compliant to Java Beans Component model. They define 5 metrics for measuring
39
different attributes that contribute to the reusability of a software component: existence of
meta-information, observability, customizability, and external dependency. The proposed
metric set includes:
a. EMI (Existence of Meta-Information) – this is a binary metric. It takes a value one if the
BeanInfo class is provided for a JavaBean component, otherwise it is zero. Presence of
BeanInfo class increases the understandability of a component.
b. RCO (Rate of Component Observability) – It is a percentage of readable properties to
the number of fields available in implementation of the Façade class of a component.
However if the Façade class does not contain any fields, then value of the metric is zero.
High rate of RCO indicates that it is easy to understand the component from its outside
behaviour.
c. RCC (Rate of component Customizability) – It is a percentage of, writable properties to
the number of fields available in implementation of the Façade class of a component.
However if the Façade class does not contain any fields, then metric value is zero. RCO
indicates the ease with which a component can be customized for use.
d. SCCr (Self-Completeness of Component’s Return Value) - It is the percentage of
business methods without any return value in all business methods implemented within
a component. In the absence of any business method the metric takes value one. High
value of the metric indicates a low level of external dependency of the component
which makes it easily portable.
e. SCCp (Self-Completeness of Component’s Parameter) - It is the percentage of business
methods without any parameters in all business methods implemented within a
component. In the absence of any business method the metric takes value one. This
metric also measures the degree of external dependency of a component. High value of
the metric shows high degree of self-completeness of the component.
Then they define a composite metric, Component Overall Reusability (COR), to measure
reusability using the metrics from this set of 5 metrics. The metrics chosen are EMI, RCC,
and SCCr. The metrics are combined on the basis of a reusability model which assumes
that reusability consists of understandability, adaptability, and portability.
The metric COR is defined as:
�$% = 1.76 )*+,�-� + )/00�-� + )1002�-�3 − 1.25
40
Where value of each Vi(c) =1, if value of the corresponding metric lies in its lower and
upper confidence limits, otherwise it is zero.
The metrics are validated using the JavaBeans Components available at www.JARS.com.
RCO and RCC were found to be highly positively correlated with each other. SCCr and
SCCp were moderately positively correlated with each other. They also evaluated
usefulness of RCO, RCC and COR as predictors of component reusability.
2.2.2.3. Ardimento et al.’s (2004) metrics - Ardimento et al. study the impact of
characteristics of individual components on the quality of the component based systems in
which they are integrated. Some characteristics of the components are: Adequateness of
the component with respect to the target system; Costs required for training people while
using the component; Familiarity of the working team with the component; Level of
support provided by the component’s vendor.
a. Adequateness is further based on these metrics:
� Functional Coverage- It is the percentage of the component based system’s
functionalities provided by the component. Assume Funi represents the functionalities
provided by the ith component to the system, and TotFunCBS represents the total
functionality provided by the system itself. Then functional coverage of the ith
component is calculated as follows:
67�_�9: = 67��9;67��<=
Fun_Covi may take value equal to 1, less than 1, or greater than 1. A value less than one
indicates that some of the functionalities of the system are not covered by the
components of the system. A value more than one indicates overlapping functionality of
the constituent components of the system.
� Compliance – This metric measures the effective usage of the component in the
system. If the functionality made available by the component to the system (through
public interface) is utilized fully, then compliance of the component is good. It is
calculated as follows:
�9>?@� = 67��9;A@67��9>?@ Here Funi is the functionality that is actually provided by the component and
TotalFunCompli is the functionality that the ith component has made available to the
system.
41
b. Training Time (TT) – TT is the time required to train the people to use the component.
Less training is needed for easily reusable components. Normalized value of the metric
for the ith component is calculated:
#�� = ��∑ �� �
c. Familiarity – It is the level to which software developers understand the component
through their previous experiences. It is measured on an ordinal scale with low, medium
and high levels.
d. Support – It measures the support provided by the vendor in form of documents (off-
line and on-line), and discussion groups, forums etc. this metric is also measured on
ordinal scale with low, medium, and high levels.
Authors collected the data for these metrics from 3 component based systems. Metrics data
was correlated with an external metric known as Mean Maintenance Effort (MME). MME
is the effort spent by the maintainer of the application (not the component provider) to
satisfy maintenance requests in the ith
component and is calculated as:
B = ∑ B�C����
Where MEj is the effort required for managing jth
maintenance request and m is the total
number of maintenance requests. Total number of components in the system is n. Unit of
measurement is person days, where a day has eight working hours.
The Normalized value of MMEi is calculated as follows:
#B = B∑ B �
The independence of characterization metrics is established through statistical analysis.
Then correlation between all the characterization metrics and NMME is studied. The
results show that all the characterization metrics are correlated with NMME, except for
Familiarity and Compliance.
2.2.2.4. Choi et al.’s (2004) component cohesion and coupling Metrics – Authors define
a metric to measure cohesiveness of an object oriented component. They consider the
dynamic dependency relationships between classes as indicators of high cohesion of the
component. CoHesion of Component (CHC) is defined as:
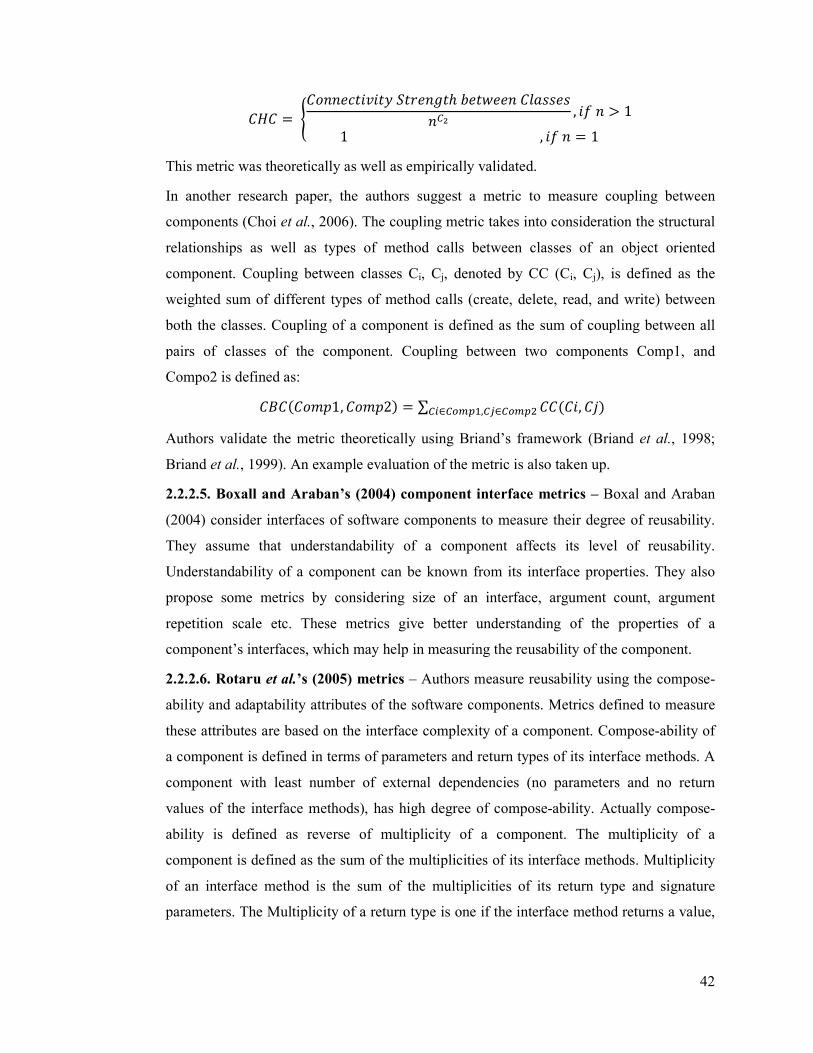
42
�D� = E�9��F-;�:�;G =;HF�I;ℎ KF;LFF� �@AMMFM�0N , �O � > 11 , �O � = 1 Q This metric was theoretically as well as empirically validated.
In another research paper, the authors suggest a metric to measure coupling between
components (Choi et al., 2006). The coupling metric takes into consideration the structural
relationships as well as types of method calls between classes of an object oriented
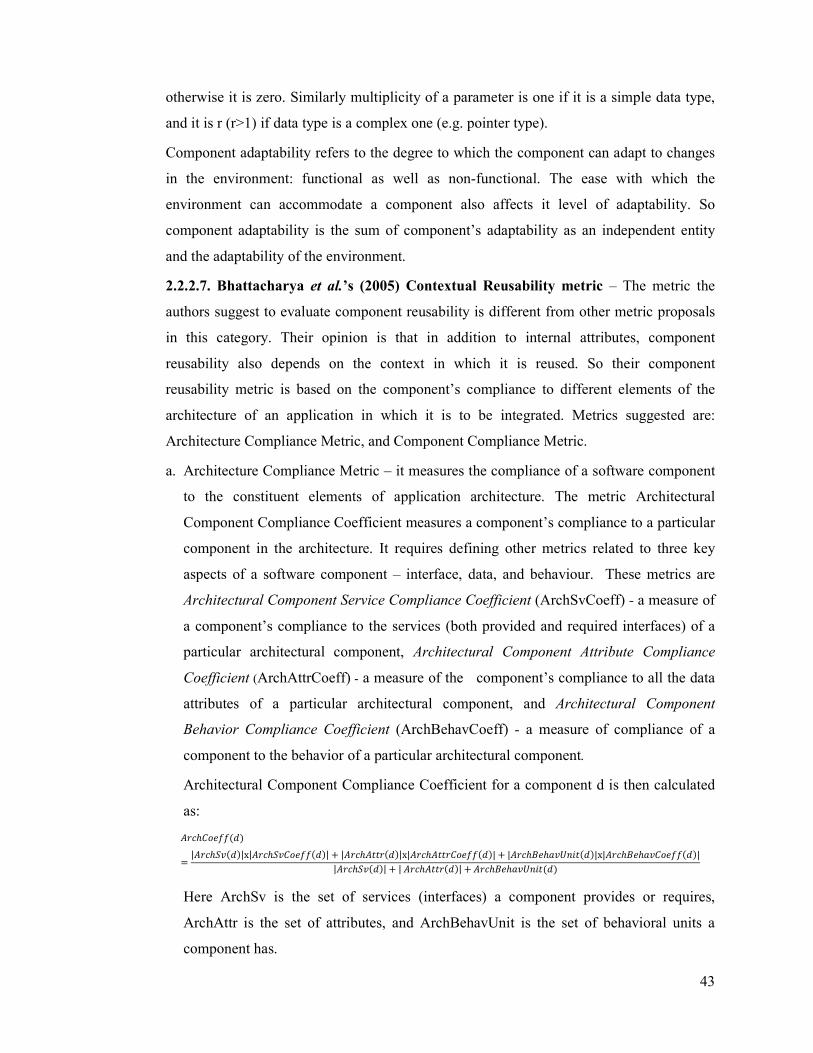
component. Coupling between classes Ci, Cj, denoted by CC (Ci, Cj), is defined as the
weighted sum of different types of method calls (create, delete, read, and write) between
both the classes. Coupling of a component is defined as the sum of coupling between all
pairs of classes of the component. Coupling between two components Comp1, and
Compo2 is defined as:
�<���9>?1, �9>?2� = ∑ �����, �R�0∈0TCU�,0�∈0TCU�
Authors validate the metric theoretically using Briand’s framework (Briand et al., 1998;
Briand et al., 1999). An example evaluation of the metric is also taken up.
2.2.2.5. Boxall and Araban’s (2004) component interface metrics – Boxal and Araban
(2004) consider interfaces of software components to measure their degree of reusability.
They assume that understandability of a component affects its level of reusability.
Understandability of a component can be known from its interface properties. They also
propose some metrics by considering size of an interface, argument count, argument
repetition scale etc. These metrics give better understanding of the properties of a
component’s interfaces, which may help in measuring the reusability of the component.
2.2.2.6. Rotaru et al.’s (2005) metrics – Authors measure reusability using the compose-
ability and adaptability attributes of the software components. Metrics defined to measure
these attributes are based on the interface complexity of a component. Compose-ability of
a component is defined in terms of parameters and return types of its interface methods. A
component with least number of external dependencies (no parameters and no return
values of the interface methods), has high degree of compose-ability. Actually compose-
ability is defined as reverse of multiplicity of a component. The multiplicity of a
component is defined as the sum of the multiplicities of its interface methods. Multiplicity
of an interface method is the sum of the multiplicities of its return type and signature
parameters. The Multiplicity of a return type is one if the interface method returns a value,
43
otherwise it is zero. Similarly multiplicity of a parameter is one if it is a simple data type,
and it is r (r>1) if data type is a complex one (e.g. pointer type).
Component adaptability refers to the degree to which the component can adapt to changes
in the environment: functional as well as non-functional. The ease with which the
environment can accommodate a component also affects it level of adaptability. So
component adaptability is the sum of component’s adaptability as an independent entity
and the adaptability of the environment.
2.2.2.7. Bhattacharya et al.’s (2005) Contextual Reusability metric – The metric the
authors suggest to evaluate component reusability is different from other metric proposals
in this category. Their opinion is that in addition to internal attributes, component
reusability also depends on the context in which it is reused. So their component
reusability metric is based on the component’s compliance to different elements of the
architecture of an application in which it is to be integrated. Metrics suggested are:
Architecture Compliance Metric, and Component Compliance Metric.
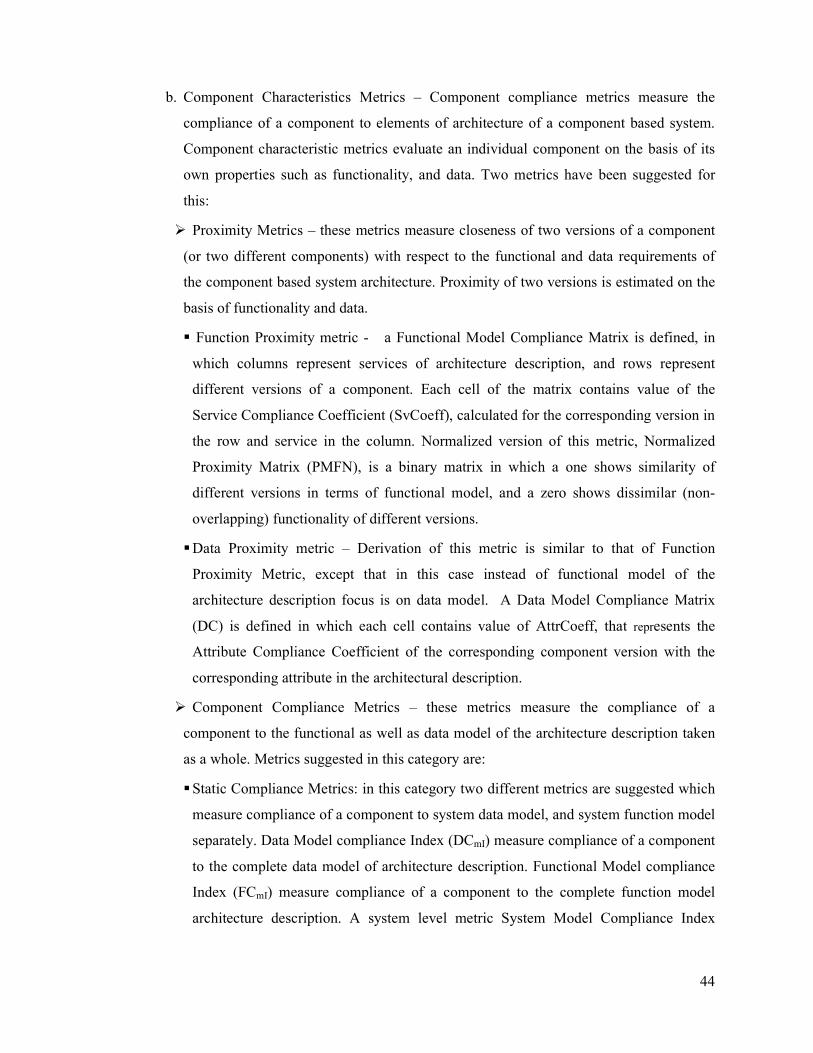
a. Architecture Compliance Metric – it measures the compliance of a software component
to the constituent elements of application architecture. The metric Architectural
Component Compliance Coefficient measures a component’s compliance to a particular
component in the architecture. It requires defining other metrics related to three key
aspects of a software component – interface, data, and behaviour. These metrics are
Architectural Component Service Compliance Coefficient (ArchSvCoeff) - a measure of
a component’s compliance to the services (both provided and required interfaces) of a
particular architectural component, Architectural Component Attribute Compliance
Coefficient (ArchAttrCoeff) - a measure of the component’s compliance to all the data
attributes of a particular architectural component, and Architectural Component
Behavior Compliance Coefficient (ArchBehavCoeff) - a measure of compliance of a
component to the behavior of a particular architectural component.
Architectural Component Compliance Coefficient for a component d is then calculated
as:
�H-ℎ�9FOO� �= |�H-ℎ=:� �|x|�H-ℎ=:�9FOO� �| + |�H-ℎ�;;H� �|x|�H-ℎ�;;H�9FOO� �| + |�H-ℎ<FℎA:X��;� �|x|�H-ℎ<FℎA:�9FOO� �||�H-ℎ=:� �| + | �H-ℎ�;;H� �| + �H-ℎ<FℎA:X��;� �
Here ArchSv is the set of services (interfaces) a component provides or requires,
ArchAttr is the set of attributes, and ArchBehavUnit is the set of behavioral units a
component has.
44
b. Component Characteristics Metrics – Component compliance metrics measure the
compliance of a component to elements of architecture of a component based system.
Component characteristic metrics evaluate an individual component on the basis of its
own properties such as functionality, and data. Two metrics have been suggested for
this:
� Proximity Metrics – these metrics measure closeness of two versions of a component
(or two different components) with respect to the functional and data requirements of
the component based system architecture. Proximity of two versions is estimated on the
basis of functionality and data.
� Function Proximity metric - a Functional Model Compliance Matrix is defined, in
which columns represent services of architecture description, and rows represent
different versions of a component. Each cell of the matrix contains value of the
Service Compliance Coefficient (SvCoeff), calculated for the corresponding version in
the row and service in the column. Normalized version of this metric, Normalized
Proximity Matrix (PMFN), is a binary matrix in which a one shows similarity of
different versions in terms of functional model, and a zero shows dissimilar (non-
overlapping) functionality of different versions.
� Data Proximity metric – Derivation of this metric is similar to that of Function
Proximity Metric, except that in this case instead of functional model of the
architecture description focus is on data model. A Data Model Compliance Matrix
(DC) is defined in which each cell contains value of AttrCoeff, that represents the
Attribute Compliance Coefficient of the corresponding component version with the
corresponding attribute in the architectural description.
� Component Compliance Metrics – these metrics measure the compliance of a
component to the functional as well as data model of the architecture description taken
as a whole. Metrics suggested in this category are:
� Static Compliance Metrics: in this category two different metrics are suggested which
measure compliance of a component to system data model, and system function model
separately. Data Model compliance Index (DCmI) measure compliance of a component
to the complete data model of architecture description. Functional Model compliance
Index (FCmI) measure compliance of a component to the complete function model
architecture description. A system level metric System Model Compliance Index
45
(SysCmI), measures overall compliance of a component to the system’s requirements
(both function and data). It is computed by taking average of FCmI and DCmI.
� Component Evolution Metrics: Component Evolution metrics measure the percent
change in a component’s compliance as it evolves. Percent change in data model
compliance is measured by Data Model Compliance Evolution Index (DMcE), and
percent change in function model compliance is measured by Function Model
Compliance Evolution Index (FMcE). The System Model Compliance Evolution
Index (SysCmE), computes the percent change in a component’s compliance (as it
evolves) to overall requirements of architecture description.
The metric set is evaluated using a sample system only. Its validation on an industrial
strength system is still pending.
2.2.2.8. Wu et al.’s (2008) metrics for reuse evaluation of open source components -
Wu et al. propose metrics to evaluate reusability of a component for a particular context.
They use usage and dependency model to understand the interaction complexity of a
component with its usage context. Three metrics are suggested to measure the interaction
complexity of a component in its usage context.
a. Component Usage Strength (CUS) – it measures the extent to which the component is
used. It is measured by taking sum of the ratios of static occurrence to dynamic
occurrences of all interfaces of the component.
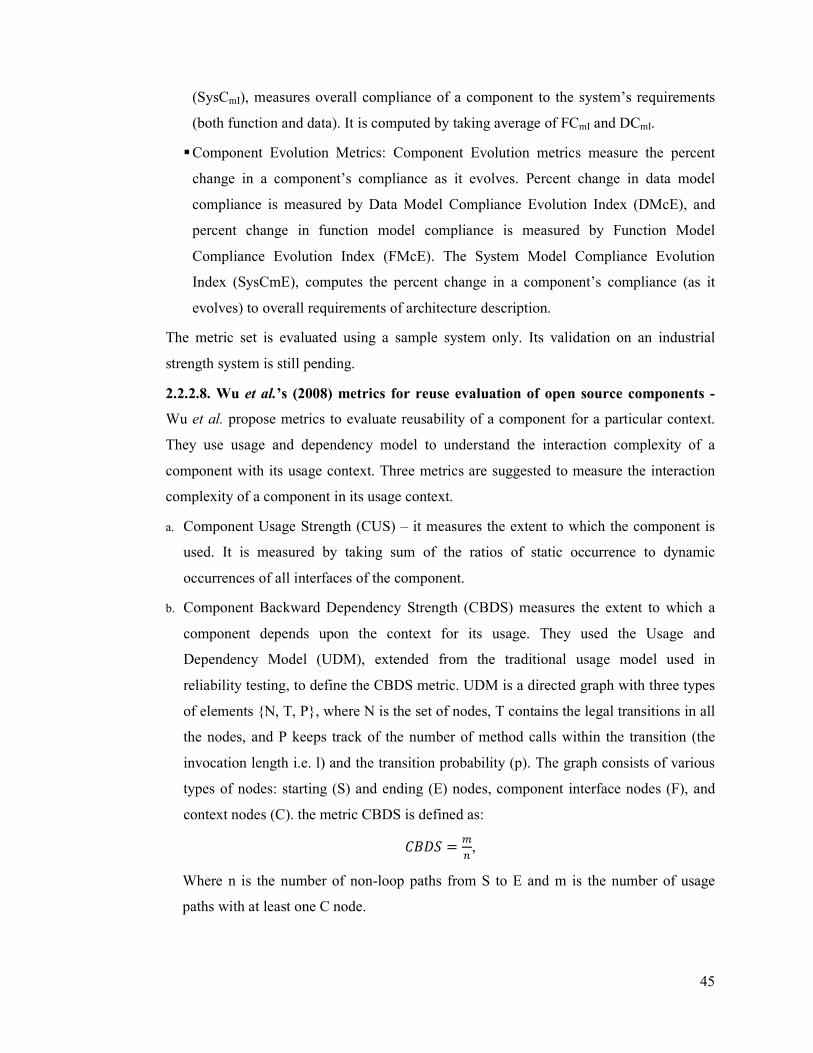
b. Component Backward Dependency Strength (CBDS) measures the extent to which a
component depends upon the context for its usage. They used the Usage and
Dependency Model (UDM), extended from the traditional usage model used in
reliability testing, to define the CBDS metric. UDM is a directed graph with three types
of elements {N, T, P}, where N is the set of nodes, T contains the legal transitions in all
the nodes, and P keeps track of the number of method calls within the transition (the
invocation length i.e. l) and the transition probability (p). The graph consists of various
types of nodes: starting (S) and ending (E) nodes, component interface nodes (F), and
context nodes (C). the metric CBDS is defined as:
�<�= = C ,
Where n is the number of non-loop paths from S to E and m is the number of usage
paths with at least one C node.
46
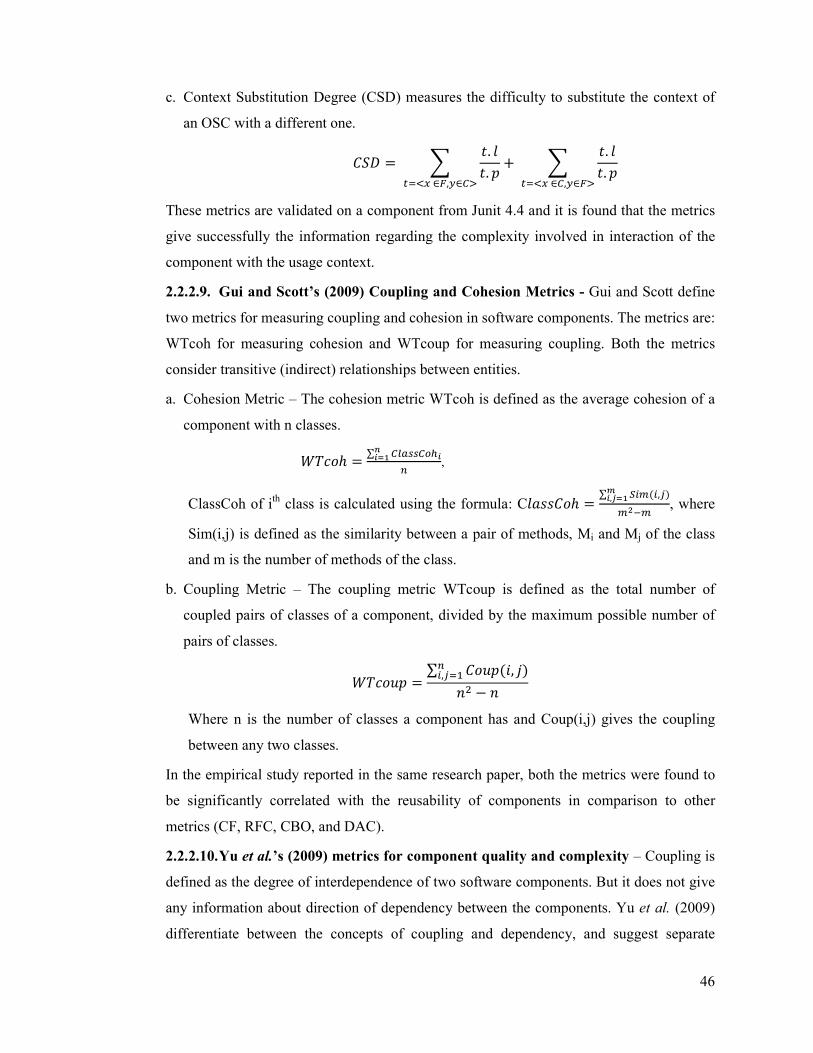
c. Context Substitution Degree (CSD) measures the difficulty to substitute the context of
an OSC with a different one.
�=� = � ;. @;. ?Y�Z[ ∈\,]∈0^ + � ;. @;. ?Y�Z[ ∈0,]∈\^
These metrics are validated on a component from Junit 4.4 and it is found that the metrics
give successfully the information regarding the complexity involved in interaction of the
component with the usage context.
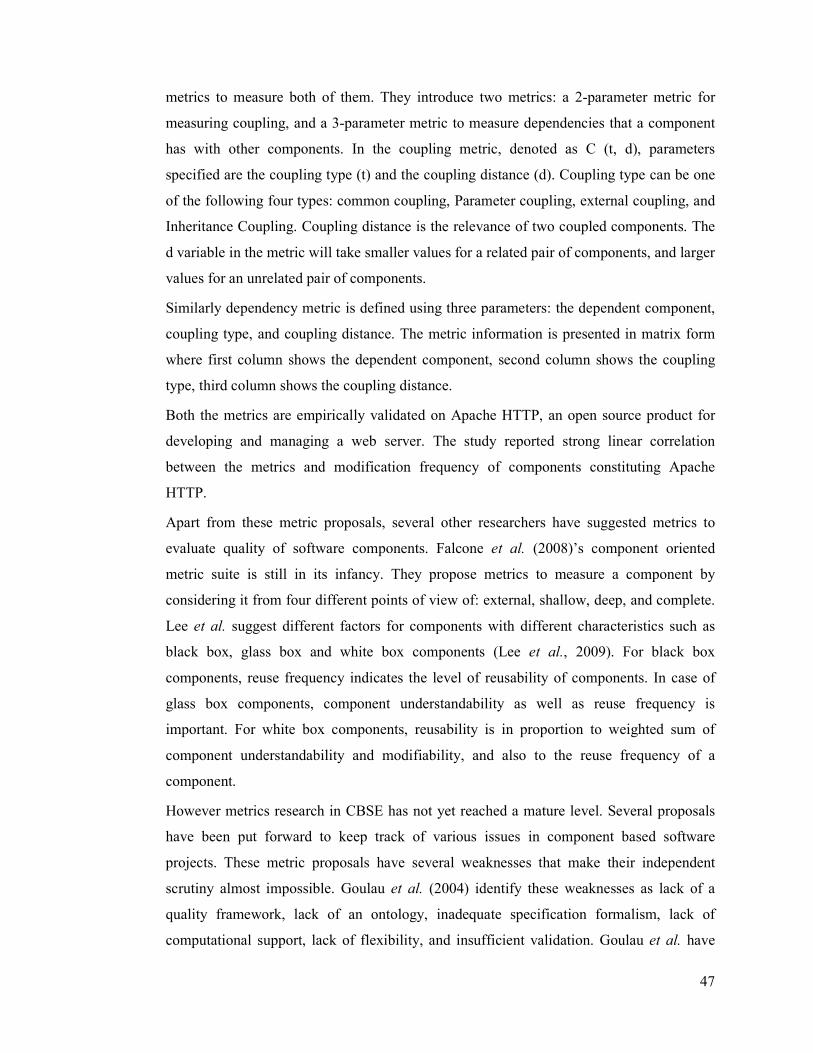
2.2.2.9. Gui and Scott’s (2009) Coupling and Cohesion Metrics - Gui and Scott define
two metrics for measuring coupling and cohesion in software components. The metrics are:
WTcoh for measuring cohesion and WTcoup for measuring coupling. Both the metrics
consider transitive (indirect) relationships between entities.
a. Cohesion Metric – The cohesion metric WTcoh is defined as the average cohesion of a
component with n classes.
_�-9ℎ = ∑ 0`a��0Tb�c�de ,
ClassCoh of ith
class is calculated using the formula: C@AMM�9ℎ = ∑ 1C�,��f�,gdeCN�C , where
Sim(i,j) is defined as the similarity between a pair of methods, Mi and Mj of the class
and m is the number of methods of the class.
b. Coupling Metric – The coupling metric WTcoup is defined as the total number of
coupled pairs of classes of a component, divided by the maximum possible number of
pairs of classes.
_�-97? = ∑ �97?��, R� ,����� − �
Where n is the number of classes a component has and Coup(i,j) gives the coupling
between any two classes.
In the empirical study reported in the same research paper, both the metrics were found to
be significantly correlated with the reusability of components in comparison to other
metrics (CF, RFC, CBO, and DAC).
2.2.2.10. Yu et al.’s (2009) metrics for component quality and complexity – Coupling is
defined as the degree of interdependence of two software components. But it does not give
any information about direction of dependency between the components. Yu et al. (2009)
differentiate between the concepts of coupling and dependency, and suggest separate
47
metrics to measure both of them. They introduce two metrics: a 2-parameter metric for
measuring coupling, and a 3-parameter metric to measure dependencies that a component
has with other components. In the coupling metric, denoted as C (t, d), parameters
specified are the coupling type (t) and the coupling distance (d). Coupling type can be one
of the following four types: common coupling, Parameter coupling, external coupling, and
Inheritance Coupling. Coupling distance is the relevance of two coupled components. The
d variable in the metric will take smaller values for a related pair of components, and larger
values for an unrelated pair of components.
Similarly dependency metric is defined using three parameters: the dependent component,
coupling type, and coupling distance. The metric information is presented in matrix form
where first column shows the dependent component, second column shows the coupling
type, third column shows the coupling distance.
Both the metrics are empirically validated on Apache HTTP, an open source product for
developing and managing a web server. The study reported strong linear correlation
between the metrics and modification frequency of components constituting Apache
HTTP.
Apart from these metric proposals, several other researchers have suggested metrics to
evaluate quality of software components. Falcone et al. (2008)’s component oriented
metric suite is still in its infancy. They propose metrics to measure a component by
considering it from four different points of view of: external, shallow, deep, and complete.
Lee et al. suggest different factors for components with different characteristics such as
black box, glass box and white box components (Lee et al., 2009). For black box
components, reuse frequency indicates the level of reusability of components. In case of
glass box components, component understandability as well as reuse frequency is
important. For white box components, reusability is in proportion to weighted sum of
component understandability and modifiability, and also to the reuse frequency of a
component.
However metrics research in CBSE has not yet reached a mature level. Several proposals
have been put forward to keep track of various issues in component based software
projects. These metric proposals have several weaknesses that make their independent
scrutiny almost impossible. Goulau et al. (2004) identify these weaknesses as lack of a
quality framework, lack of an ontology, inadequate specification formalism, lack of
computational support, lack of flexibility, and insufficient validation. Goulau et al. have
48
attempted to formalize some metrics proposed for component based systems using
CORBA Component Model (CCM) as the basic framework and OCL as the metric
definition language.
Component level metrics discussed in this section fall into two categories: component
interface related metrics, and component structure related metrics. Metrics in the former
category are collected from information available in component interfaces and are
applicable to black box components (Washizaki et al., 2003). In the latter category, metrics
are collected from internal structure (design or code) of a component (Gui and Scott, 2009;
Choi et al., 2004; Wu et al., 2007) and are applicable to white box components only.
Researchers define metrics for internal structure in light of the guidelines prescribed for
designing reusable components. Poulin et al. discusses several internal properties of the
structure of a program that make it reusable (Poulin, 1994). Modern technologies such as
object oriented software development concentrate on building reusable artifacts from the
early stages of life cycle rather than at later stages (Fauzi et al., 2004). Object oriented
programming provides features to build generic software components which can be reused
in multiple applications with little or no modification (Sametinger, 1997). The application
of object-oriented design-principles like modularity, abstraction, and de-coupling ("good
design") lead to better maintainability and reusability. However, the object-oriented
paradigm alone does not guarantee good design. Developers have to understand design
principles and to check whether those have been obeyed. Software components designed
using object oriented principles are flexible and easily extensible. This research focuses on
internal properties of object oriented software that considerably contribute towards its
reusability, and maintainability. Next section discusses the basic concepts of object
oriented paradigm and also presents a review of empirical studies that establish a link
between internal properties of software (such as complexity, coupling, and cohesion) and
external quality factors (such as understandability, and maintainability etc.).
4.3. Object Oriented Paradigm
A good object oriented design is about building a class model which retains the conceptual
clarity of the domain. Such a model is easy to design and therefore easy to modify as well
(Pooley and Stevens, 1999). A major benefit of object oriented design is that it facilitates
creation of reusable software components. Object oriented components can be reused as is,
or modified using sub classing facilities. Adoption of the Object-Oriented paradigm is
49
expected to help produce better and cheaper software. The main structural mechanisms of
this paradigm, namely, abstraction, inheritance, encapsulation, information hiding,
polymorphism, coupling, and cohesion are the keys to foster reuse and achieve easier
maintainability. A brief discussion of these mechanisms follows in the next paragraphs:
2.3.1. Abstraction
Abstraction means to hide unnecessary details. The concept of abstraction is used to
simplify the description/specification of a system by focusing only on details of major
concern while suppressing others. It helps in managing the complexity of a system.
Abstraction increases readability and ease of understanding the system. Abstraction is a
relative notion and varies with the domain and view of the system. The characteristics that
are relevant in a particular context may be irrelevant in another one. Abstraction is
implemented in three different forms- division into parts, specialization, and multiple
views (Budd, 2001). Division into parts is the application of principle of ‘divide and
conquer’. A complex system is divided into subsystems and subsystems are further divided
into subsystems and so on till a finer level of detail is not reached. Then solution is first
sought for the subsystems and then for the system itself. In specialization, the system is
organized into a hierarchical structure in which layers at the lower levels need to be
understood first in order to understand layers at a higher level. Third form of abstraction is
to have multiple views of a system. Each view emphasizes a different aspect of the system.
All views when put together provide a global view of the system.
Papajorgji et al. (2005) discuss 4 principles of abstraction - Classification/instantiation,
aggregation/decomposition, generalization/specialization and grouping/individualization.
Classification refers to grouping similar items in the problem domain into a category or a
class. Instantiation is just opposite to classification. It means to create instances of a class
which completely describe the properties of the class. Aggregation/decomposition
principle considers the system components to have whole/part relationships with one
another. Generalization/specialization principle organizes the components of a system in
the form of a hierarchy. Common attributes in components at one level are placed at a
higher level so that all the components can inherit the common properties. A hierarchy can
be created from top-down or bottom up. In top down approach, the existing components
are specialized to realize concrete components with fine details. In bottom up approach,
generalized components are created from the existing components by extracting their
common attributes. The last abstraction principle grouping/ individualization refer to
50
putting together the component of a system in one group not only because of their
similarities but due to several other reasons. Individualization is then to pick up one
component from the group on the basis of some specific criteria.
2.3.2. Encapsulation and Information Hiding
Encapsulation is the concept that different people interpret in different ways. A search for
“Encapsulation” on Wikipedia reveals that the word gets different meaning in different
application domains such as medicine, electronics, and material science. Basically it is
used in two forms: encapsulation is seen either as a grouping mechanism or as a protection
mechanism.
In object oriented paradigm, encapsulation means grouping data structures with the
methods that manipulate them (Paul Rogers, 2001; Connolly and Begg, 2005). Another
school of thought understands it as a language mechanism for restricting access to some of
the class object’s members (i.e. information hiding) (Benjamin, 2002; Mitchell, 2003).
The third school of thought refers to encapsulation as a combination of both these notions:
a grouping mechanism as well as a protection mechanism (Scott, 2006; Dale and Weems,
2007). Some of the programming languages interpret encapsulation also as a combination
of grouping and hiding information. In Smalltalk, class members are by default not visible
outside. However in C++ and JAVA, the programmer has the freedom to decide on the
outside visibility of the class members. Anyway, encapsulation paves the way for
information hiding. Encapsulation helps in keeping the things belonging to an entity/part
together. It helps in separating the concerns. But it is advised that parts of a complex
system should not depend on the internal details of one another (Ingalls, 1981). Clients
should access the services of the class through message passing. There is no need to know
internal details/implementation of the class elements. Parnas (1972) introduced the idea of
information hiding. Encapsulation and information hiding both lead to a stable software
design as changes are localized and changes to a class (if it does not affect its behaviour)
do not affect clients of the class. Software becomes flexible and can accommodate changes
easily.
2.3.3. Inheritance
Inheritance is one of the essential features of object orientation. Booch stresses that
programming without inheritance is not “object oriented”. He calls it programming with
abstract data types (Booch, 1994). Wegner calls a language, which has no direct support
for inheritance, as object based rather than object oriented (Wegner, 1987).
51
Inheritance is the relationship between two or more classes in which definition of a new
class is based on the definition of existing classes. The existing class is called the
super/parent/base class and the newly defined class is called the subclass/child/derived
class. A subclass inherits features from its super class and adds new features to refine the
definition of the super class. Inheritance represents ‘is a kind of’ relationship so an instance
of a sub class is also an instance of its super class. A subclass can also respond to all the
operations to which its super class can respond.
Inheritance has many forms depending on what one wishes to inherit and when and how
the inheritance takes place:
Single Inheritance – Class inheritance refers to defining a new class using definition of
existing classes. In single inheritance a class can inherit features from a single super class
and adds new attributes and operations of its own.
Multiple Inheritance – A class can inherit features from multiple classes i.e. a class can
have multiple super classes. Multiple inheritance suffers from the problem of name
collisions and repeated inheritance (Jalote, 2005). It is difficult to comprehend a design
which involves multiple inheritance (Lorenz and Kidd, 1994).
Partial inheritance – A class can inherit some of the features from the super class and
suppress others which are not required or are not useful. This is called restriction
(Rumbaugh, 2002).
Strict Inheritance – In strict inheritance a class inherits all the features from the super class
and adds new features to specialize. This is the ideal kind of inheritance and it supports the
“is a kind of” relationship in its true sense.
Non-strict Inheritance – It is a special type of partial inheritance in which the class does not
have all the features of the super class and some of the inherited features are redefined as
well.
Multilevel Inheritance – In a multilevel inheritance tree structure, a class inherits features
from super classes which are not the direct but indirect super classes of the class. A class S
is called a direct super class of a subclass C if it appears in the list of super classes of the
subclass declaration. However if it is one of the ancestors of the super class then it is an
indirect super class of the class C. Such a class hierarchy in which multiple levels of
inheritance are involved is called multilevel inheritance.
Inheritance reduces redundancy (Armstrong and Mitchell, 1994) in the sense that a
subclass does not have to redefine the properties that it inherits from its super class.
52
Inheritance supports polymorphism (discussed in next section). The concept of inheritance
has some disadvantages as well. Description of a class is not available at one place. It is
distributed in the class hierarchy. One has to look at several places (in super classes of the
class) to understand the class (Leijter et al., 1992). As the super class contains a part of the
definition of the subclass; it results in coupling between the super class and the subclass. It
also violates the encapsulation of the super class. Several problems have been defined in
this regard such as rigidity problem (Seidewitz, 1996), fragile class problem (Pooley and
Stevens, 1999), transmute problem (Coad and Mayfield, 1997), and yo-yo problem (Aksit
and Bergmans, 1992). Inheritance structure, if badly designed, can also compromise
understandability, maintainability, and reusability of the software system (Firesmith, 1995;
Rumbaugh, 1993). Several empirical studies also reported the designers’ indifferent
attitude towards the use of inheritance mechanism (Chidamber, 1991; Biemen and Zhao,
1995; Chidamber, 1998; Cartwright & Shepperd, 2000).
2.3.4. Polymorphism
Polymorphism means many forms. It is the ability to associate more than one
implementation with the same operation. An operation with same name or signature can be
implemented in different ways in different classes. Actual implementation of a given
operation depends on the object class that contains the operation. Polymorphism along
with the concept of abstraction (by means of creating abstract classes) provides a way to
create uniform interface of a class and also helps to impose rules on the way the class can
be extended in future. The object instance that sends the message does not have to bother
about the receiver instance of the message. Same message can be interpreted in different
ways depending upon the receiver object instance. An object oriented design created with
the help of polymorphism is flexible and hence easy to modify/extend in the future as new
methods can be added to existing classes without modifying them. It also reduces
complexity because there is now lesser number of conditional statements. It increases
readability/understandability of a design. However, it is difficult to debug class hierarchies
which involve polymorphism.
The binding of a message (operation call) with its implementation can be decided at
compile-time or at run- time. So polymorphism can be categorized as: Adhoc
Polymorphism and Universal Polymorphism (Cardelli and Wegner, 1985).
Adhoc Polymorphism – Also known as static polymorphism, in this type an operation has
different implementation in different classes and the classes may not be related by class
53
hierarchy. An operation behaves in different ways in different classes. Adhoc
polymorphism is further of two types: overloading and coercion. In overloading same
name is used to denote different operations which may have totally different behaviour in
different context. The operation that will respond to a message is decided at compile time.
Coercion allows the user to pass any kind of parameters to operations of a class which is
polymorphic. The coercion mechanism takes care to convert the parameter type passed to
the operation to the type that the operation expects.
Universal Polymorphism – Also known as dynamic polymorphism or run time
polymorphism. Here an operation defined in a super class can have different
implementation in the subclasses from the same class hierarchy. Universal polymorphism
is further of two types: Parametric Polymorphism and Inclusion Polymorphism. Parametric
polymorphism helps to create a class definition which can handle any type of data. Unlike
method overloading or conversion which can accommodate only finite number of data
types, parametric polymorphism can handle literally any kind of data type including user-
defined data types. A class is said to support inclusion polymorphism, if a method member
of the class can be passed an argument, which either is of the same class type as the
parameter is or is a subtype of the parameter’s class type. This is also called Object
Polymorphism (Smith and Robinson, 1990).
2.3.5. Modularity
Modularity is a way of managing complexity. It is achieved by breaking a monolithic
program into smaller and manageable components or modules in such a way that there is
minimal interaction between the modules and maximal interaction within the modules. So
modularity is based on the principle of divide-and-conquer. Modularization of a program is
based on three criteria –low complexity (small modules), loose coupling (interaction
between modules), and high cohesion (interaction within modules). Modularity reduces
maintenance effort (Schach, 2004) and increases reliability and reusability of the program.
In object oriented paradigm, a class is the basic building block. So the concept of
modularity refers to a class as the basic unit of consideration. Next paragraphs elaborate on
the concepts of complexity, coupling, and cohesion.
2.3.5.1. Complexity
54
Conventionally complexity of a program has been associated with the number of operands
and operators (Halstead, 1977), or the number of predicates (cyclomatic complexity) it
contains (McCabe, 1978). A program with a large number of operands and operators, or
for that matter with a large number of predicates (decision statements) is stated to be more
complex. It is difficult to understand, modify, and reuse such a program. Object oriented
paradigm strives to reduce the complexity by using various concepts such as inheritance,
aggregation, encapsulation, and polymorphism. In this paradigm, complexity of a class is
defined as the sum of the complexity of its attributes and member functions (Fothi et al.,
2003).
2.3.5.2. Coupling
In any system, components of the system cannot exist in isolation. They have to depend
upon one another in order to support the behaviour of the system. Coupling refers to the
inter-dependencies in components of the system. Classes depend upon one another to
provide functionality of the system. Two classes are said to be tightly (loosely) coupled if
they depend highly (lowly) upon details of each other. A Loosely coupled class is easy to
understand, and change because understanding such a class does not require understanding
many other related classes and changing such a class does not have any impact on many
other classes. It is also easy to reuse such a class. So loose coupling between classes
improves maintainability and reusability of the system.
In object oriented approach, classes can be coupled through different types of relationships.
These relationships between classes are (Booch, 1997): dependency, generalization, and
association. Dependency relationship creates a link in two classes in which one class uses
the other as a parameter in the signature of an operation. Generalization-specialization is a
parent-child relationship in which the children inherit the structure and behaviour from
their parents. All classes in an inheritance hierarchy refer to properties of a single object.
An association relationship links two classes as a unidirectional or bidirectional
association. In the unidirectional association, one class is referencing the other, whereas in
the bidirectional association each class is referencing every other class in a bidirectional
manner.
2.3.5.3. Cohesion
Yourdon and Constantine (1979) acquired the notion of cohesion from sociology and
applied it to software designed with structured design methodology. In that context,
cohesion of a module represents how tightly the internal elements of a module are bound to
55
one-another. The strongest form of cohesion is the functional cohesion, in which all the
elements of a module are related to one-another to perform a single function. As a module
is in structured design, a class is the basic building block in object oriented design. So
notion of cohesion of a module is extended to cohesion of a class as well. Cohesion, in
object oriented terms, refers to the relatedness of members of a class. A class with a high
degree of cohesion implements only one specific concept. However, a class with low
cohesion performs many unrelated tasks. Such a class is difficult to understand, reuse, and
maintain as well.
4.4. Object Oriented Metrics
Software metrics are useful to monitor and control the progress of a project and also to
determine and indicate the quality of the end product. Several metrics have been defined
for measuring the structural properties of an object oriented software product. Peter
Rosner states that object-oriented metrics are used mainly to understand the extent to
which the concepts of object orientation are realized in a system (Rosner, 2006). Object
oriented metrics are applicable at different levels of granularity such as class, package, and
system level. This section discusses metrics defined at these three levels.
4.4.1. Class Level Metrics
4.4.1.1. Chidamber and Kemerer’s MOOSE Metrics Suite
Chidamber and Kemerer originally defined the C&K metrics suite (also referred to as
MOOSE – Metrics for Object Oriented Software Engineering) in their 1991 paper
(Chidamber and Kemerer, 1991). In 1994, they published another paper containing revised
definitions of some of the metrics (Chidamber and Kemerer, 1994). MOOSE metric suite
contains 6 metrics to measure different aspects of object orientation such as complexity,
coupling, cohesion, and inheritance.
a. Weighted Methods per Class (WMC): This metric measures the complexity of an
individual class. Metric value is obtained by computing weighted sum of complexities
of methods of a class. Two different weighting functions are considered: one uses the
nominal weight of 1 for each method, and hence measures the number of methods only
(Basili et al., 1996; Tang et al., 1999), the second uses cyclomatic complexity metric
(McCabe, 1976) to measure complexity of a method (Li and Henry, 1993). Briand et al.
(1996) name these metric variations as WMC-1, and WMC-MCC respectively.
56
b. Depth of inheritance tree of a class (DIT): It is defined as the length of the longest
path from the class to the root of the inheritance tree. Intuitively, the deeper a class is in
the inheritance tree; the harder it might be to understand the class. Also it is difficult to
predict its behavior due to interaction between the inherited features and new features.
However, larger is the level of DIT, more is the potential of reuse of inherited methods.
c. -umber of children (-OC): It represents the number of immediate subclasses that
inherit directly from the current class. Non-zero value of NOC for a program indicates
that designers have utilized the concept of reuse (through inheritance). However, high
values may indicate an inappropriate abstraction in the design as a class with a large
number of children has to provide more generic service to support all the children. This
tends to introduce more complexity into the parent class and also makes it less cohesive.
A class with a large NOC demands more testing effort as it has influence on many other
classes in the system.
d. Coupling between objects (CBO): This provides the number of other classes that are
coupled to the class. A class is coupled to another if it uses the member functions and/or
instance variables of the other class. Excessive inter class coupling inhibits reuse of
individual classes. Classes coupled with a large number of classes are very sensitive to
change, which makes maintenance of the design very difficult. Testing effort for such
classes is also high.
e. Response for a class (RFC): This gives the number of methods that can potentially be
executed in response to a message received by an object of that class. The larger is the
number of methods that could potentially respond to a message, the greater the
complexity of that class.
f. Lack of Cohesion of Methods (LCOM): This metric is intended to measure the lack
of cohesion in the methods of a class. The LCOM is a count of the number of non-
similar method pairs, in terms of attribute usage, minus the count of similar method
pairs. Different attributes occurring in different methods of a class indicate that methods
do not process related information. The class as a whole is performing multiple
unrelated tasks. Such a class lacks cohesion. A class with low cohesion is also not fit for
reuse.
2.4.1.2. Li and Henry’s Metric Set
Li and Henry (Li and Henry, 1993) revised the metric suite proposed by Chidamber –
Kemerer (1991). The revised metric set is defined below:
57
a. -umber of Ancestor Classes (-AC) and number of Descendent Classes (-DC)
These metrics extend the inheritance related metrics given in the CK-Metric suite: DIT
and NOC. DIT measures the number of classes along the longest route to the root class
of the hierarchy and NOC counts the number of immediate subclasses. NAC counts the
number of ancestors of the class. NAC and DIT will take same value in case of single
inheritance and different values in case of multiple inheritance. The Number of
Descendent Classes (NDC) metric counts the descendent classes a class has in the
hierarchy tree.
b. -umber of Local Methods (-LM) and Class Method complexity (CMC) – NLM
counts the number of methods local to a class. CMC measures the combined complexity
of all the methods of a class. The CMC metric is identical to the WMC-1 metric.
c. Coupling through Inheritance, Coupling Through Abstraction (CTA), and
Coupling Through Message Passing (CTM) – Li and Henry elaborate on different
forms of coupling between classes: coupling through inheritance, coupling through
abstract data types, and coupling through message passing. They argue that coupling
through inheritance can be measured using NAC and NDC metrics separately, or a
combination of both. For the last two coupling forms, they suggest two metrics CTA
and CTM respectively.
d. Size1 and Size2 metrics - SIZE1 and SIZE2 both measure size of a class. SIZE1 of a
class is the number of methods and attributes defined (non-inherited) in the class. SIZE2
of a class is defined as the number of semicolons in the class.
Later on, Li (1998) renamed NLM, CMC, CTA, and CTM metrics as NOM, WMC, DAC,
and MPC respectively.
2.4.1.3. Briand’s Coupling Framework
Briand et al. (1999) define a framework of coupling metrics which consider coupling
between classes from 3 different points of view: direction of coupling (Import or Export),
type of relationship (Inheritance, Friendship, or nOne of these two), and types of
interaction between classes (Class-Attribute (CA) interaction, Class-Method (CM)
Interaction, and Method-Method (MM) Interaction).
The metrics defined in this framework are outlined below:
a. Metrics based on Class-Attribute Interaction
58
a.1. Import Coupling – The metric counts the classes which the current class uses as
attributes.
a.1.1. Inverse Friend CA Import Coupling (IFCAIC) – Only those classes are
considered which have declared this class as their friend.
a.1.2. Ancestors CA Import Coupling (ACAIC) – The metric counts the classes in
the ancestor set of the current class, which this class uses as attributes.
a.1.3. Others CA Import Coupling (OCAIC) – this metric counts the classes not
considered in the friend or inheritance relationship types.
a.2. Export Coupling – the metric counts the classes which use the current class as an
attribute.
a.2.1. Friends CA Export Coupling (FCAEC) – Only friend classes of the current
class are considered.
a.2.2. Descendents CA Export Coupling (DCAEC) – Only the descendents of the
current class in the hierarchy tree are considered.
a.2.3. Others CA Export Coupling (OCAIC) – Classes not related to the current
class through inheritance or friend relationship are considered.
b. Metrics Based on Class-Method Interaction
b.1. Import Coupling - The metric counts the classes, which the methods of the current
class are referring to.
b.1.1. Inverse Friend CM Import Coupling – IFCMIC- The current class also has
to be a friend of the counted classes.
b.1.2. Ancestors CM Import Coupling – ACMIC – the metric counts the ancestor
classes of the current class.
b.1.3. Others CM Import Coupling – OCMIC- It considers only those classes
which are not related to the class though inheritance or friend
relationships.
b.2. Export Coupling – The metric counts the classes, whose methods are referring to
the current class.
b.2.1. Friend CM Export Coupling – FCMEC – Only friend classes of the class are
taken into account.
59
b.2.2. Descendents CM Export Coupling – DCMEC – Counts the classes from the
set of descendents of the current class.
b.2.3. Others CM Export Coupling – OCMEC – Counts the classes not related to
the class through inheritance or friendship relationship.
c. Metrics Based On Method-Method Interaction
c.1. Import Coupling - these metrics count the classes, whose methods either invoke
methods from the current class or receive them as parameters.
c.1.1. Inverse Friend MM Import Coupling – IFMMIC- The metric counts the
classes of which the current class is a friend.
c.1.2. Ancestors MM Import Coupling – AMMIC – the metric counts the classes
from the set of ancestors of the current class.
c.1.3. Others MM Import Coupling – OMMIC- It considers only the classes which
are not related to the class though inheritance or friend relationships.
c.2. Export Coupling- These metrics count the classes whose methods, methods of the
current class either invoke or receive as parameters.
c.2.1. Friends MM Export Coupling – FMMEC – the metric counts only the
classes which are friends of the current class.
c.2.2. Descendents MM Export Coupling – DMMEC – the metric considers only
the descendents of the current class in the class hierarchy.
c.2.3. Others MM Export Coupling – OMMEC - classes not having inheritance or
friend relationship with the current class are considered here.
2.4.1.4. Bansiya’s QMOOD metric suite
Another popular metric suite in this category is the QMOOD metric suite proposed by
Bansiya and Davis (2002). This metric suite contains metrics defined at system level as
well as at class level.
a. Design Size in Classes (DSC) – The metric counts the total number of classes in
the design. It tells the size of a design. Larger is the size of the software, more
difficult it is to understand, and reuse it.
b. -umber of Hierarchies (-OH) – A group of classes related to one another
through inheritance relationships form a hierarchy. They together implement one of
the concepts of the solution, or support some functionality of the software program.
60
Counting such hierarchies gives an idea of the number of concepts implemented, or
amount of functionality provided by the software program.
c. Average -umber of Ancestors (A-A) – It counts the average number of classes
from which the current class inherits properties.
d. Data Access Metric (DAM) – It is the ratio of the hidden attributes of a class to
the total number of attributes defined in the class.
e. Measure of Functional Modularity (MFM) – It is the deviation of the size of the
current class from the average size of a class in the software program. Size is
measured by number of methods of a class.
f. Direct Class Coupling (DSC) – it gives the count of classes which are coupled to
the current class. It considers coupling through message passing or through
attribute declarations.
g. Cohesion among Methods in a Class (CAMC) – It measures the relatedness of
methods of a class using the information available in their parameter types. It is
assumed that methods which use same parameter types process related information.
h. Measure of Aggregation (MOA) – It measures the use of aggregation relationship
in the design of a software program. An aggregation is identified when a class
declares its attributes of user defined types. This metric counts the aggregation
relationships a class has with other classes in a software program.
i. Measure of Functional Abstraction (MFA) – It is the ratio of the number of
methods inherited to the total number of methods accessible by a class.
j. -umber of Polymorphic Methods (-PM) – This metric is a count of methods
that exhibit polymorphic behaviour.
k. Class Interface Size (CIS) – It is a count of public methods of a class.
l. -umber of Methods (-OM) – It counts all the methods defined in a class.
2.4.1.5. Other Metrics
Besides the popular metrics suits discussed above, there are several other metrics that have
been defined at class level. Lorenz and Kidd (1994) defined metrics at design level for
measuring class size, class inheritance, class internals, and class externals. Henderson-
Sellers (1996) defined metrics for measuring coupling (fan-out), and complexity of a class.
Several metrics for measuring class cohesion exist. Cohesion is measured at two stages of
the life cycle: Design and code. Code level cohesion metrics are: LCOM1(Chidamber91),
61
LCOM2(Chidamber), LCOM3, LCOM4, and C (Hitz and Motenzri), TCC and LCC
(Bieman and Kang), LCOM5 (Henderson-sellers), RCI (Briand, 1997), CBMC (Chae,
2000), LCCD, LCCI (Badri and Badri, 2004), CC(X) (Bonja and Kidanmariam, 2006),
(Cox, Etzcorn, 2006), SCOM (Fernadez, 2006), ELCOM (Makela, 2007) , C3(Marcaus,
2008). Woo et al. revised the definitions of the existing variations of LCOM metrics by
considering the impact of write interactions between class members (Woo et al., 2009).
Design level class cohesion metrics include CAMC (Bansiya, 1999), NHD and SNHD
(Counsell et al., 2006), and SCI (Dallal et al., 2009).
Some researchers have proposed spatial measures for object oriented software, which
capture the spatial abilities needed to understand the working of software. Deuce et al
introduce two types of metrics in this category (Deuce, 1999): function-related and
inheritance-related. Function-related metric measures how close the definition of a method
member is to its declaration in the class. Inheritance-related metrics are two in number:
class relation metric and object relation metric. Class relation metric measures distance
(measured in LOC) of a derived class from its base class. Object relation metric measures
usage of objects of other classes within a class. Chhabra et al. (2004) propose spatial
metrics in two categories: Class Spatial Complexity, and Object Spatial Complexity. Class
Spatial Complexity is measured using two metrics: Class Attribute Spatial Complexity, and
Class Method Spatial Complexity. Similarly Object Spatial Complexity is measured by
Object Definition complexity, and Object Member Usage Complexity.
2.4.2. Package Level Metrics
In object oriented terminology, a package is a collection of classes. Robert Martin has
defined some metrics to evaluate design of packages (Martin, 2003). This section briefly
describes the metrics.
a. Relation Cohesion
Cohesion metrics measure relatedness of elements of a class/package/system. High
cohesion value indicates that related elements are put at one place, whereas low cohesion
indicates that the class/package contains unrelated elements and need to be split further.
The cohesion metric is called Relation Cohesion denoted by H. H is defined as the average
number of internal relationships. Let R be the number of type (class/interface) relationships
that are internal to this package (i.e. do not connect to types outside the package). Let N be
the total number of types within the package,
H=(R+1)/N
62
The extra 1 in the formula prevents H=0 when N=1. The relation cohesion represents
relationships that types (classes and interfaces) within a package have with each other.
b. Abstractness
This metric measures the degree of abstraction of a package. Abstractness is defined as
Abstractness (A) = Number of Abstract classes/ Total number of classes in a package.
The metric can take values in the range [0, 1].
c. Instability
Stability of a package is measured by counting the packages that interact with the package.
Three metrics are defined to measure inter dependencies of packages.
Afferent Coupling: The number of classes outside this package that depend upon classes
within this package. It is an indicator of responsibility of the package.
Efferent Coupling: The number of classes inside this package that depend upon classes
outside this package. It is an indicator of independence of the package.
Instability: Instability is defined in terms of the above two metrics
I= Ce/ (Ce+Ca).
This metric is an indicator of a package’s resilience to change. I=0 indicates a maximally
stable package and I=1 indicates a maximally instable package.
d. Distance from the Main Sequence
Also known as the D Metric defines the relationship between abstractness and instability.
Both the metrics abstractness (A) and Instability (I) has a range [0, 1]. D-metric is defined
as D= |(A+I-1)/2|. It measures the perpendicular distance of a package from the main
sequence. Given this metric, a design can be analyzed for its conformance to the main
sequence. Packages with perfect balance of abstraction and instability lie on the main
sequence i.e. D is zero or lies close to zero. Any package that has value near zero for the D
metric is more reusable and less sensitive to change.
2.4.3. System Level Metrics
2.4.3.1. Abreu’s MOOD Metric Suite
Abreu et al. (1996) defined a metric suite to measure the use of object oriented software
mechanisms such as information hiding, inheritance, polymorphism, and coupling, which
are supposed to support the development of quality software. These metrics are
computable at system level. Brief description of the metrics follows:
63
a. Method Hiding Factor (MHF) and Attribute Hiding Factor (AHF) – MHF and
AHF measure the amount of information hidden in the system. A class in the object
oriented paradigm consists of two types of members: attributes and methods. AHF is
the ratio of total number of attributes hidden in all the classes to the total number of
attributes defined in all the classes. Similarly MHF is the ratio of total number of
hidden methods in all the classes to the total number of methods (private and public)
defined in all the classes.
b. Method Inheritance Factor (MIF) and Attribute Inheritance Factor (AIF) – MIF
and AIF measure the extent to which inheritance mechanism is used in the system. AIF
is the ratio of attributes inherited (not overridden) by all the classes to the total number
of attributes (new or inherited but not overridden) available in all the classes.
Similarly, MIF is the ratio of total number of methods inherited (not overridden) by all
the classes to the total number of methods (new or inherited but not overridden)
available in all the classes.
c. Polymorphism Factor (PF) - PF measures the extent to which concept of
polymorphism is utilized. PF is the ratio of possible different polymorphic situations
present in the program to the maximum number of possible different polymorphic
situations (extreme case where all methods are overridden in all classes, leaving of
course the base classes).
d. Coupling Factor (CF) – CF measures the extent to which classes of a program are
coupled to each other. A class C is coupled to another class D, if C makes any
reference to D through message passing, or C contains a reference to a member
(attribute or method) of D. CF is the ratio of actual number of couplings in the classes
to the maximum possible couplings in the classes of the system.
2.5. Object Oriented Metrics Validation Studies
Several studies have been reported that establish a link between object oriented metrics and
error porness of classes. Basili et al. (1996) showed that the WMC, CBO, RFC, DIT, and
NOC metrics were significant predictors of class error proneness. NOC was negatively
significant and LCOM metric was not found significant at all. Briand et al. analyzed CBO,
RFC, and LCOM metrics from CK-metric set and found them as statistically correlated
with fault proneness of classes (Briand et al., 1999). In another experiment, they analyzed
a larger set of metrics including size and CK-metrics suite and found CBO, RFC, DIT, and
LOC as significant predictors. NOC was having negative significance (Briand et al., 2000).
64
They repeated the experiment, and found WMC, CBO as positively significant predictors
(Briand et al., 2001a). DIT had negative significance, and NOC was not at all significant.
Emam et al. (1999) applied a subset of the CK-metrics along with LOC metric to a
telecommunications program (written in C++) and reported WMC, CBO, RFC, and LOC
as the significant predictors of faults in classes. However, none of them was significant
when size was controlled. In another study Emam et al. (2001) used a subset of CK-
metrics and metrics from Briand’s Coupling framework (1999) on a JAVA application and
developed a model to predict the fault proneness of classes in the future releases as well as
to estimate the overall quality of the system. Ping et al. (2002) studied CK-metrics along
with LOC and Fan-in metrics as predictors of not only fault proneness of a class but also
the number of faults it may have. They found that the metrics did extremely well to
identify a fault prone class but only fairly well to predict number of faults present in the
class. Yu et al. (2002) analyzed WMC, NOC, CBO, and RFC metrics from CK-metric
suite along with LCOM (Rosenberg and Hyatt, 1995) and LOC as significant predictors of
fault proneness.
Subramanyam and Krishnan (2003) applied the same metric set as Emam et al.(2001) to
an E-commerce application developed in C++ and JAVA. They found that after controlling
the size, WMC, CBO, and LOC were positively significant and DIT was negatively
significant to predict faults in C++ classes. However for JAVA classes, both WMC and
CBO were negatively significant, DIT was again not significant. Succi et al. (2003)
applied metrics from the CK-metric set, and LOC as the size metric to a commercial
software application and observed RFC, DIT, and NOC as the significant indicators of
classes prone to defects. An experiment conducted by Gyimothi et al. (2005) on open
source software showed, except NOC, all other CK-metrics along with LOC as significant
predictors of fault prone classes. None of these three studies used LCOM metric from the
CK-metric set. Zhou et al. (2006) investigated usefulness of OO metrics for prediction of
fault prone classes taking into account severity of faults as well. The study reported that
CK-Metrics (WMC, CBO, RFC, NOC), LCOM (Rosenberg, 1995), and LOC were all
significant predictors of fault proneness for faults of different severity. DIT was not
significant for any case and NOC showed poor performance in case of high severity faults.
Thwin and Quah (2005) chose metrics from the CK-metrics set, Li and Henry’s metric set,
and Tang et al.(1998)’s metric set to study their significance in predicting the fault
proneness and maintainability of classes in an object oriented program. Janes et al. (2006)
applied CK-metrics to 5 real-time telecommunication software programs and found them
65
as significant predictors of class error proneness. Kanmani et al. (2007) analyzed around
64 object oriented metrics and related them to fault proneness of classes. Li and Shatnawi
(2007) also used object oriented metrics to identify bad smells in classes of software
programs and then validated these bad smells as indicators of class fault proneness
(Olague, 2007). In a recently reported study, Shatnawi et al. (2008) investigated object
oriented metrics to predict class error proneness in the post release evolution of Eclipse, an
open source software. They concluded that metrics can predict the error proneness of
classes in the post release evolution, but prediction capability decreases in the subsequent
evolutions of the software. An extensive amount of empirical studies exist on the use of
metrics as predictors of fault proneness in software systems. A systematic review of these
studies is given in (Catal and Diri, 2009).
Another important aspect studied with the help of object oriented metrics is the prediction
of maintenance effort. In a study of two commercial systems, Li and Henry (1993) studied
the link between CK metrics and the maintenance effort. Binkley et al. (1998) reported that
coupling in classes results in higher maintenance effort and also it gives rise to run-time
failures. Fioravanti et al. (1999) built a prediction model using object oriented metrics to
estimate adaptive maintenance effort. Aggarwal et al. (2006) found all the metrics from the
CK-metrics suite, and MPC, NOM from Li and Henry (1998)’s metric suite as useful
predictors of maintenance effort. In another study, object oriented metrics from Li and
Henry’s metric set were used to build a prediction model for the maintenance effort (Koten
and Gray, 2006).
Some of the studies tried to find a link between the use of inheritance mechanism in an
object oriented application and the effort required to maintain the application. However
the results are not very encouraging. In two separate studies, it is observed that moderate
inheritance depth (of 3 levels) made the maintenance task easier in comparison to 0 or 5-
levels of inheritance depth (Daly et al., 1996, Harrison et al., 2000; Prechelt et al., 2003).
It has been observed in other experiments as well that extensive use of inheritance,
measured by DIT metric, negatively affects the accuracy and time required to perform
maintenance activities (Poels and Dedene, 2001). Cartwright et al. (1998) found positive
correlation in DIT of the CK-metric suite and the number of user reported problems. A
recent study conducted by Nasseri et al.(2008) on an Open Source Software program, to
study the growth of inheritance hierarchies over a period of time, concluded that
developers prefer to make additions or changes at shallow rather than deep levels of
66
hierarchy as they find it difficult to understand deep level hierarchies. They used DIT
(Chidamber and Kemerer, 1994), Specialization Index (Lorenz and Kidd, 1992), and Reuse
Ratio (Henderson-sellers, 1995) as the metrics to measure inheritance.
Apart from fault proneness, and maintenance effort, several other dimensions of quality
have been analyzed using object oriented metrics.
In a study, Chidamber et al. (1998) reported that higher values of CK coupling and
cohesion metrics were associated with reduced productivity and increased rework/design
effort.
Abreu and Melo (1996) studied the relation in metrics from the MOOD metric set with
error density and rework effort. They found CF highly positively correlated with both the
error density as well as rework effort. MHF, MIF, AIF, and POF had negative correlation
with both. However, AHF did not show any significant correlation with any of them.
Sharble and Cohen (1993) used the CK-metric suite (Chidamber and Kemerer, 1991) to
compare two object oriented design methods: data-driven (Smith and Tockey, 1988) and
responsibility-driven (Wirfsbrock et al., 1990). Metric values for data-driven design were
found to be high, they concluded that design developed using responsibility-driven design
strategy is less complex.
Harrison et al. (2000) conducted a theoretical evaluation of the MOOD metrics suite and
concluded that the metrics could be used to provide an overall assessment of a software
system.
Li et al. (2000) studied the evolution of an object oriented system. They used metrics from
the CK-metrics suite (Chidamber and Kemerer, 1994) and Li & Henry’s (1998) metric
suite, and introduced 3 new metrics: System Design Instability (SDI), Class
Implementation Instability (CII), and System Implementation Instability (SII). They found
the metrics as good indicators of project progress.
Deligiannis et al. (2003) did a metrics based analysis to verify whether design heuristics
have been followed while designing the software.
Alshayeb and Li (2003) analyzed effectiveness of CK-metrics (WMC, DIT, and LCOM) as
well as Li & Henry’s metric suite (NLM, DAC, and MPC) in two iterative processes: short
cycled XP iterative process and long cycled framework process. They found that metrics
predict evolution changes in short cycled XP process more effectively than long cycled
framework process.
67
Concas et al. (2008) studied the impact of agile practices on software quality using a subset
of CK-Metrics. They found LCOM, and RFC highly correlated with adoption of agile
practices such as pair programming, refactoring, and test-based development in a web
application project.
Hseuh et al. (2008) used metrics from the QMOOD metric set to evaluate quality of design
patterns.
Quah (2009) collected object oriented metrics from the business tier part of a software
application and used them successfully to predict the readiness of the software for new
release.
2.6. Object Oriented Metrics and Reusability
Relationship of a program’s internal properties with its reusability has been studied several
times. We will discuss these research studies in the chronological order of time.
Caldiera and Basili (1991) emphasize that important factors that determine reusability of a
component are its quality (performance, readability, testability, and ease of modification)
along with its usefulness (variety of functions it provides), and cost (storage and retrieval).
They suggest that reusability can be predicted on the basis of the following metrics:
Halstead’s Volume metric, McCabe’s complexity metric, regularity, and reuse frequency.
Fonash (1993) suggests a set of quantifiable product metrics and measures which can be
used as criteria for differentiating reusable code from non-reusable code components.
Metrics are studied specifically in the context of ADA –code components. He considers
metrics in five categories – General, Quality, Parameterization, Coupling and Cohesion.
General metrics measure code complexity and code size. Quality metrics consider
understandability in terms of comments used and formatting styles. Parameterization
metrics count the number of functional and data parameters in a module. Coupling metrics
take into consideration the amount of references and dependence on other modules.
Cohesion metrics measure the functional and data cohesion. The functional cohesion
metric for a module measures the degree to which each part of the module is necessary to
perform a single function. The data cohesion metric measures the degree to which the
module has a single data type and the associated operations for that type. He applied these
metrics to three groups of software- code components reused with no modifications, code
components reused after extensive modifications and code components developed new for
the application. Statistical analysis results show that significant differences exist between
modules reused without modification and other two groups of code components.
68
The REBOOT (Reuse Based on Object Oriented Techniques) project identifies four
reusability factors: portability, understandability, flexibility, and confidence (Sindre et al.,
1995). These factors are mapped, through a defined criterion, to a set of metrics which
include objective (cyclomatic complexity, fan-in/fan-out, percentage of machine dependent
code, comment ratio etc.), as well as subjective metrics (generality checklist,
documentation checklist, and documentation checklist etc.).
Etzcorn and Davis (1997) suggest that reusability of a component can be measured by the
following factors – modularity, interface, documentation and simplicity (size and
complexity). Some well known object oriented metrics are used to measure these quality
factors. They define four different views of reuse – reusability in the class, reusability in
the hierarchy, reusability in the subsystem and reusability in the original system.
Reusability in the class view measures reusability of a standalone class. Reusability in the
hierarchy and reusability in the subsystem are measured by same set of metrics, which are
collected over several classes. If a class is reused in the original system, it can be predicted
to be reusable in the new system as well. They also analyzed comments in the programs to
extract information on their reusability.
Price et al. (2001) present a technique to analyze and improve the reusability of OO
designs. They define a reusable component as a set of classes which are reused as a group
in future applications. Reusability analysis is based on 8 types of couplings within the
classes of a component. Study of a commercial system confirmed that reusability can be
improved by removing undesired types of couplings as per the guidelines given by the
authors.
Bansiya and Davis (2002) develop a Quality Model for Object Oriented Design (QMOOD)
which maps the design quality attributes to a set of design metrics. The set of design
quality attributes identified are: functionality, understandability, effectiveness,
extendibility, reusability, and flexibility. A total of 11 metrics are defined to measure the
properties of design such as size, abstraction, encapsulation, inheritance, hierarchies,
composition, message passing, polymorphism, complexity, coupling, and cohesion. The
design properties are linked to the design attributes considering the positive or negative
impact a design property has on a design attribute. Metric validation indicated metrics as
significant predictors of improvement in the software quality.
69
Lee et al. (2007) analyze a set of metrics for object oriented languages to study the
evolution of open source software from its reusability and maintainability point of view.
They propose 4 desirable features for a software product to be reusable and maintainable
• Coupling from external dependency –
o Requires no separation from any containing code.
o Requires no changes to be used in a new program
o Components do not interface with its environment.
o Low fan-in and fan-out
o Has more calls to low-level system and utility functions.
• Cohesion –
o Component exhibits high cohesion
• Size
o Small
• Complexity
o The lower the values of complexity metrics, the higher the programmer’s
productivity.
o Low module complexity
Sandhu et al. (2009) use CK-Metrics set to predict reusability of C++ code. They conclude
that reusability prediction of this metric set is close to the decisions made by programmers
and repository managers regarding reusability of code components.
Most of the existing studies analyze only a subset of the object oriented concepts to
evaluate quality of design of reusable components. One study takes into account almost all
the important features of object oriented paradigm (Bansiya et al., 2002) but with too much
focus on the implementation language C++. In this research attempt has been made to
consider all the basic concepts of the paradigm and to make the measurements at design
level as general as possible (independent of any implementation language). Metric trends
are analyzed for an industrial strength software component as it evolves over a period of
nine years.
70
2.7. Summary
Software metrics help to measure properties of a program. In this chapter, metrics have
been studied in two reuse oriented paradigms: Component Based Software Development,
and Object Oriented Software Development. Component based software metrics are
discussed at two levels: system level, and component level. Research in component based
software metrics is still immature. No metric proposal (except Washizaki et al. (2003)’s) is
based on any formal component specification format. There is lack of automated metric
collection tools and due to this the number of empirical studies in this area is also very less.
Object oriented paradigm has several concepts such as abstraction, inheritance, information
hiding, polymorphism, coupling, and cohesion that help to make object oriented programs
easily modifiable, and extensible and hence easy to reuse. Object oriented metrics are
discussed at different levels such as system, package, and class level. This chapter also
gives a detailed analysis of the validation studies that indicate object oriented metrics as
significant indicators of software quality attributes such as error proneness, and
maintenance effort. It also mentions the studies which applied object oriented metrics to
evaluate reusable components.