Embed Size (px)
Citation preview

CHAPTER 2
Need and potential for underground disposal – survey of underground mines in Europe
D. Kaliampakos1, A. Mavropoulos2 & M. Menegaki1 1School of Mining & Metallurgical Engineering, National Technical University of Athens, Greece. 2EPEM, Greece.
Abstract This chapter considers the need as well as potential for disposal of hazardous waste in underground mines and provides a comparison between surface and under-ground hazardous waste disposal including typical costs. A survey on underground mines in Europe is provided including some that are currently used or considered for disposal of hazardous waste in the future. The survey shows that the number of deep mines that are suitable for disposal of hazardous waste is large in Europe, especially considering that a certain number of currently used mines are expected to cease their operation in the near future. In particular, 15 EU countries are included in this survey: Austria, Belgium, Denmark, Finland, France, Germany, Greece, Ireland, Italy, Luxembourg, Portugal, Spain, Sweden, Netherlands and UK. This does not mean that the number of suitable mines in other European coun-tries is negligible, but it only indicates that at this moment there is no sufficient data to report. It is expected that the number of suitable underground mines for hazardous waste disposal in Eastern European countries would be quite high, which offers an alternative and affordable way of dealing with hazardous waste in these countries.
2.1 Surface vs. underground hazardous waste disposal facilities
Underground hazardous waste disposal facilities present some significant advan-tages compared to the respective surface installations, which can be summarized
www.witpress.com, ISSN 1755-8336 (on-line) WIT Transactions on State of the Art in Science and Engineering, Vol 26, © 2006 WIT Press
doi:10.2495/978-1-85312-750-2/02
34 DISPOSAL OF HAZARDOUS WASTE IN UNDERGROUND MINES
as follows [1]:
• Underground facilities take advantage of the protection, isolation and security of the site. Proper design and geological siting can provide very low pro-babilities of hazardous substances leakage and of any such leakage to the sur-face environment.
• Underground structures are naturally protected from severe weather (hurri-canes, tornadoes, thunderstorms, and other natural phenomena). Underground structures can also resist structural damage due to floodwaters, although spe-cial isolation provisions are necessary to prevent flooding of the structure itself. Moreover, underground structures have several intrinsic advantages in resisting earthquake motions and they tend to be less affected by surface seismic waves than surface structures [2].
• An underground hazardous waste disposal facility eliminates substantially the visual impacts, which can be of major concern in a surface structure adjacent to residential areas.
• Environmental monitoring is limited mainly to air quality within the working area. Other needs for monitoring (e.g. groundwater quality) can be deter-mined during risk assessment.
• Long-term and after-care monitoring are usually not necessary since the main protection is provided by the geologic medium. On the contrary, in a surface hazardous waste disposal facility the protection measures have limited life-time. Thus the landfill should be always monitored for possible leaks, even after the end of operation.
• During the operation of a surface hazardous waste disposal facility, the main cost drivers are monitoring, wastewater treatment and financial insurance. According to the above-mentioned characteristics of the underground space, operational cost is expected to be cheaper in the case of underground hazard-ous waste disposal.
• Moreover, in the case of an existing underground space, as it is an abandoned underground mine, there are some additional benefits that strengthen hazard-ous waste underground disposal, with the most important being the land cost and construction savings.
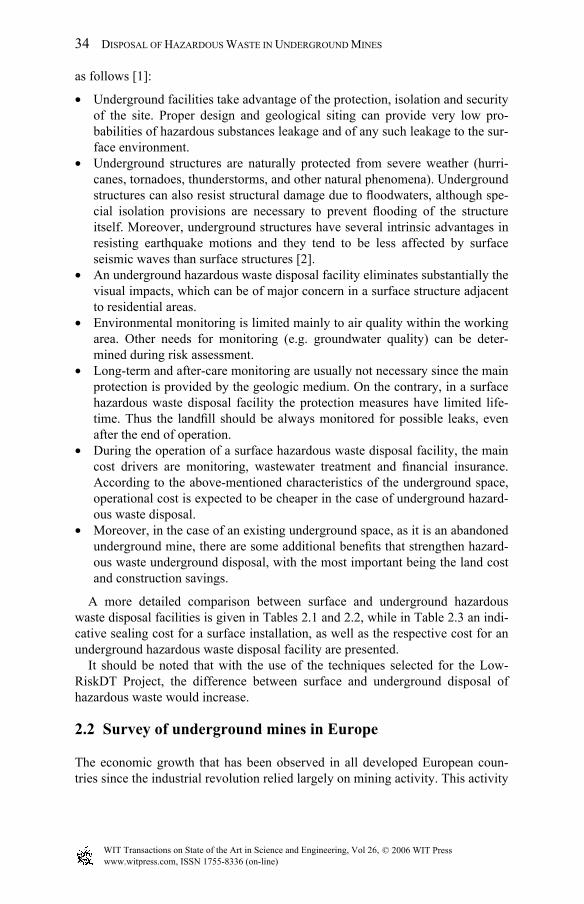
A more detailed comparison between surface and underground hazardous waste disposal facilities is given in Tables 2.1 and 2.2, while in Table 2.3 an indi-cative sealing cost for a surface installation, as well as the respective cost for an underground hazardous waste disposal facility are presented.
It should be noted that with the use of the techniques selected for the Low-RiskDT Project, the difference between surface and underground disposal of hazardous waste would increase.
2.2 Survey of underground mines in Europe
The economic growth that has been observed in all developed European coun-tries since the industrial revolution relied largely on mining activity. This activity
www.witpress.com, ISSN 1755-8336 (on-line) WIT Transactions on State of the Art in Science and Engineering, Vol 26, © 2006 WIT Press

Ta
ble
2.1:
Gen
eral
and
con
stru
ctio
n is
sues
in su
rfac
e vs
. und
ergr
ound
haz
ardo
us w
aste
dis
posa
l fac
ilitie
s.
S
urfa
ce H
W d
ispo
sal f
acili
ty
Und
ergr
ound
HW
dis
posa
l fac
ility
Gen
eral
issu
es
Ava
ilabi
lity
of sp
ace
Lim
ited
Hun
dred
s of a
band
oned
und
ergr
ound
min
es
may
be
suita
ble.
Si
tting
V
ery
diffi
cult
due
to te
chni
cal a
nd
soci
al is
sues
. Ea
sier
Lice
nsin
g D
ifficu
lt D
epen
ds o
n co
untry
.
Con
stru
ctio
n is
sues
5 m
artific
ial g
eolo
gica
l bar
rier o
r eq
uiva
lent
bar
rier (
99/3
1 EC
) be
low
the
was
te b
ody
Nec
essa
ry
Not
nec
essa
ry, t
he u
se o
f artific
ial b
arrie
rs is
lim
ited
and
it de
pend
s on
risk
asse
ssm
ent.
Leac
hate
col
lect
ion
sy
stem
(LC
S)
Nec
essa
ry, b
ecau
se ra
infa
ll cr
eate
s hug
e qu
antit
ies o
f pol
lute
d le
acha
te. N
orm
ally
LC
S co
nstit
utes
of e
xten
ded
pipi
ng a
nd
drai
nage
laye
r.
Not
nec
essa
ry if
wat
er d
oes n
ot e
nter
the
was
te b
ody.
A k
ind
of L
CS
shou
ld b
e co
nstru
cted
for p
oten
tial l
eaks
.
Was
tew
ater
trea
tmen
t N
eces
sary
. Tre
atm
ent l
evel
dep
ends
on
loca
l con
ditio
ns a
nd p
oten
tial i
mpa
cts
at w
ater
tabl
es a
nd m
ost o
f the
tim
es
shou
ld b
e a
third
leve
l one
.
Mos
t of t
he ti
me,
neg
ligib
le o
r no
was
tew
ater
is
gen
erat
ed. S
afe
stor
age
of w
aste
wat
er a
nd
trans
fer t
o w
aste
wat
er tr
eatm
ent
faci
litie
s is a
n in
dica
ted
solu
tion.
St
orm
wat
er m
anag
emen
t N
eces
sary
, one
of t
he b
asic
com
pone
nts
of d
esig
n an
d co
nstru
ctio
n.
Dep
ends
on
the
unde
rgro
und
min
e co
nditi
ons –
may
als
o be
neg
ligib
le.
NEED AND POTENTIAL FOR UNDERGROUND DISPOSAL 35
www.witpress.com, ISSN 1755-8336 (on-line) WIT Transactions on State of the Art in Science and Engineering, Vol 26, © 2006 WIT Press
Tabl
e 2.
2: O
pera
tiona
l and
cos
t iss
ues i
n su
rfac
e vs
. und
ergr
ound
haz
ardo
us w
aste
dis
posa
l fac
ilitie
s.
Surf
ace
HW
dis
posa
l fac
ility
U
nder
grou
nd H
W d
ispo
sal f
acili
ty
Ope
ratio
nal i
ssue
s
St
abili
ty
Cru
cial
poi
nt fo
r the
was
te b
ody
form
ulat
ion.
C
ruci
al p
oint
for t
he u
nder
grou
nd sp
ace.
En
viro
nmen
tal i
mpa
cts o
f po
ssib
le m
ajor
acc
iden
ts
(SEV
ESO
)
Hig
h im
pact
s to
wat
er a
nd g
roun
d/so
il.
Toxi
c ga
ses e
mis
sion
s are
con
side
red
as a
hig
h le
vel h
azar
d.
Lim
ited
or n
o im
pact
s to
wat
er a
nd g
roun
d/so
il sy
stem
. Tox
ic g
ases
em
issi
ons m
ay c
reat
e
prob
lem
s to
wor
kers
. En
viro
nmen
tal m
onito
ring
Exte
nded
mon
itorin
g is
nec
essa
ry, e
spec
ially
fo
r wat
er a
nd a
ir qu
ality
. The
sens
itivi
ty
of th
e su
rrou
ndin
g ec
osys
tem
and
nat
ural
re
sour
ces d
eter
min
es m
ore
spec
ific
area
s th
at sh
ould
be
mon
itore
d.
Mon
itorin
g is
lim
ited
to a
ir qu
ality
, with
in th
e w
orki
ng a
rea.
Ris
k as
sess
men
t det
erm
ines
oth
er
need
s for
mon
itorin
g.
In si
tu tr
eatm
ent o
ptio
ns
Easi
er
Mor
e di
fficu
lt du
e to
spac
e lim
itatio
ns.
Long
-term
–afte
r-ca
re
mon
itorin
g
All
the
prot
ectio
n m
easu
res h
ave
limite
d
life-
time,
thus
the
landfil
l sho
uld
be a
lway
s m
onito
red
for p
ossi
ble
leak
s, ev
en a
fter t
he
end
of o
pera
tion.
The
mai
n pr
otec
tion
is p
rovi
ded
by th
e us
e of
un
derg
roun
d sp
ace
– th
e de
eper
the
bette
r. A
fter-
care
mon
itorin
g is
not
nec
essa
ry.
Cos
t iss
ues
Con
stru
ctio
n co
st
Artific
ial b
arrie
rs, w
aste
wat
er tr
eatm
ent,
leac
hate
col
lect
ion
syst
em, g
as c
olle
ctio
n an
d tre
atm
ent s
yste
m, s
torm
wat
er
man
agem
ent a
nd e
xcav
atio
ns a
re th
e m
ain
com
pone
nts.
The
com
pone
nts m
ay b
e th
e sa
me,
but
they
will
pr
obab
ly b
e ch
eape
r due
to li
mite
d w
ater
ent
ry
and
utili
zatio
n of
alre
ady
avai
labl
e sp
ace.
Ope
ratio
nal c
ost
Mon
itorin
g, w
aste
wat
er tr
eatm
ent a
nd fi
nanc
ial
insu
ranc
e, a
re th
e m
ain
cost
driv
ers.
It is
exp
ecte
d to
be
chea
per.
36 DISPOSAL OF HAZARDOUS WASTE IN UNDERGROUND MINES
www.witpress.com, ISSN 1755-8336 (on-line) WIT Transactions on State of the Art in Science and Engineering, Vol 26, © 2006 WIT Press

NEED AND POTENTIAL FOR UNDERGROUND DISPOSAL 37
was reflected in a large number of mining exploitations, many of which were underground mines. However, the decline of the mining industry during the last decades has led to the closure of many mining sites throughout most European countries. As a result, there are many abandoned underground mines which most of the times remain inactive and practically useless. In addition, due to the continuous decline of the mining industry, a large proportion of the remaining underground mines are expected to cease their operation in the near future [3, 4]. These mines could also be considered as potential disposal sites.
A profile of the mining activity has been formulated for all the 15 EU coun-tries [5]. The profile consists of some general data concerning mining activities, active mines and mineral production, active and inactive mines etc. Special emphasis has been given to identify the underground mines in order to look for more details. More than 70 underground mines were registered and their main characteristics were recorded. Most mines are located in Germany, Sweden, Finland, and the UK, as expected due to the intense mining activity in these countries (Fig. 2.1).
In addition, an inventory of inactive underground mines, presently used as waste disposal sites, has been carried out.
Both of the previous results are presented hereinafter.
Table 2.3: Typical sealing cost in surface and underground hazardous waste disposal facilities.
Thickness (m) Quantity Unit
Cost per unit
(euros) Cost per
m2 (euros)
Bottom layer for surface installations
Clay barrier (hydraulic conductivity < 10–9 m/s)
5 8.5 m3 10 85
Geotextile – 1 m2 2 2 HDPE geomembrane
(hydraulic conductivity < 10–9 m/s)
0.002 1 m2 6 6
Geotextile – 1 m2 2 2 Drainage layer 0.5 0.5 m3 5 2.5 Total cost 97.5
Sealing for underground facilities HDPE geomembrane 0.002 1 m2 15 15 Shotcrete 0.1 1 m2 32 32 Total cost 47
www.witpress.com, ISSN 1755-8336 (on-line) WIT Transactions on State of the Art in Science and Engineering, Vol 26, © 2006 WIT Press

38 DISPOSAL OF HAZARDOUS WASTE IN UNDERGROUND MINES
2.3 The profile of mining activity in 15 EU countries
2.3.1 Austria
Although the mining industry has maintained a long tradition in Austria, the metal mining sector is declining, principally due to high operating costs, low ore grades, environmental problems and increased foreign competition. This is not the case with the industrial minerals sector, which produces a number of important minerals. Austria is considered to be a significant world producer of graphite, magnesite and talc [6].
Because of Austria’s long history of minerals exploration and mining tradi-tion, geologic conditions are fairly well known. Future mining activities will most likely be concentrated in industrial minerals, mainly for domestic consump-tion. The chances of finding new and workable base metal deposits are probably remote.
Figure 2.1: Distribution of abandoned underground mines.
www.witpress.com, ISSN 1755-8336 (on-line) WIT Transactions on State of the Art in Science and Engineering, Vol 26, © 2006 WIT Press

NEED AND POTENTIAL FOR UNDERGROUND DISPOSAL 39
No specific information could be retrieved on inactive mines of the country except Schmitzbe coal mine, which closed in 1995, and Trimmelkam, which closed in 1992.
2.3.2 Belgium
Although Belgium has a significant mineral-processing industry, it does not pro-duce minerals as a result of mining activities. In fact, Belgium has no economi-cally exploitable reserves of metal ores or primary energy.
Belgium has a significant industrial minerals sector and is an important pro-ducer of four groups of industrial materials: carbonates, including limestone, dolomite, and whiting; synthetic materials in the form of soda ash and sodium sulphate; silica sand; and construction materials, including a wide range of different types of marble [6].
Following the closure of the last coal mines in 1992, the only mining opera-tions left in Belgium in 1998 were for the production of sand and gravel and the quarrying of stone, principally specialty marbles and the Belgian blue-grey limestone called ‘petit granit’.
Very little information has been retrieved about inactive mines in Belgium. The only abandoned mines found are some coal mines located throughout the country.
2.3.3 Denmark
Denmark’s mineral resources are, mainly, the natural gas and petroleum fields in the North Sea that, together with renewable energy, have made Denmark a net exporter of energy since 1996. Most of the mineral commodities produced in Denmark are exported with the majority shipped to EU countries.
The mining and metal industry works closely with the Ministry of Environ-ment and Energy, the Danish Environmental Protection Agency, local and com-munity governments, and citizen groups to minimize any adverse effects to the environment. Environmental protection is the main focus of the Danish Environmental Protection Agency. A common goal of the steelworks and other industrial concerns is to make use of as much raw material taken into the plant as possible and to maximize the use of any by-products, such as flue dusts.
Denmark has large reserves of non-metallic materials such as chalk, diatoma-ceous earth, limestone, and sand and gravel. Approximately one-third of the bed-rock area in Denmark consists of chalk and limestone. Denmark’s industrial minerals sector is based mainly on these easily accessible materials. Cement, chalk for paper filler, ground limestone and lime, including agricultural and burnt, are produced [7].
As far as sand, gravel and aggregates are concerned, from the mid-1980s to the mid-1990s, the industry was suffering from low prices and fierce competition. However, due to the upswing in the Danish building and construction industry, the industry is now in a healthier shape.
www.witpress.com, ISSN 1755-8336 (on-line) WIT Transactions on State of the Art in Science and Engineering, Vol 26, © 2006 WIT Press

40 DISPOSAL OF HAZARDOUS WASTE IN UNDERGROUND MINES
Denmark is the only commercial producer of moler, which consists of a natural mixture of diatomite and 20–25% bentonite. Moler has a variety of applications, such as industrial absorbers, brake linings, and fertilizers, and is an important ingredient of insulation bricks [6].
No specific information could be retrieved on the inactive mines of the country.
2.3.4 Finland
Mining history in Finland dates back to 1540, when the quarrying of iron ore commenced in the southern part of the country. Since then, about 260 metallic mines have been operated, with the total amount of ore extracted being around 250 Mt. Finnish metallurgical technology and manufacturers of mining equipment are well-known throughout the international mining community. The exploitation of copper, nickel, cobalt, zinc and lead ores as well as chromium, vanadium and iron deposits has provided the raw material base for the country’s metal industry, with significant processing and refining of copper and nickel concentrates at Harjavalta, zinc at Kokkola, chromium at Kemi by the Outokumpu Group and iron at Raahe by Rautaruukki Oy. The major industrial minerals mined in Finland are apatite, talc and, to a lesser extent, limestone [8]. On 1 January 1995, Finland acceded to the EU. At that time, amendments to the Finnish Mining Law concern-ing reciprocity took effect and allowed any individual corporation or foundation having its principal place of business or central administration within the EU, to enjoy the same rights to explore for and exploit mineral deposits as any Finnish citizen or corporation. This encouraged foreign investment and increased explora-tion activities of major and junior companies. Exploration emphasis was given on base metals, diamond, and gold deposits.
There are many inactive mines in Finland. Data are included in the websites of Geological Survey of Finland and Outokumpu Oy, which is the leading company in the country. However, due to the lack of available data it could not be specified whether they are open-pit or underground mines.
2.3.5 France
France is a major European mineral producer. The traditional mineral industries have been in a state of transition a few years ago. In the past, the heavy economic and political involvement of the state was one of the main elements of the national mineral policy. During the last years, efforts have been made to promote the private sector and to reduce the dependence of state-owned companies on subsidies.
The government proceeded with a programme of privatization involving large state-controlled companies to reduce the direct role of the Government in the economy. Among the nine major companies privatized since 1994, the Péchiney Group, Rhône-Poulenc S.A., Société Nationale Elf Aquitaine, and the Usinor Group were included [6].
www.witpress.com, ISSN 1755-8336 (on-line) WIT Transactions on State of the Art in Science and Engineering, Vol 26, © 2006 WIT Press

NEED AND POTENTIAL FOR UNDERGROUND DISPOSAL 41
Several industries, such as bauxite, coal, iron ore, and uranium, have steadily undergone changes during the past few years, especially bauxite, which is no longer mined.
The iron ore basin of northern France stretches from Lorraine northward into Belgium. For many years, the high phosphorus and low iron content of the ore limited its desirability and the production has been declining for several years. Terres Rouges Mine, the last iron ore mine in the Lorraine district, closed in 1998. French bauxite production ceased altogether by the end of 1993. Mining of lead and zinc completely ceased in France. The two working potash mines, Amelie and Staffelfelden, will be closed until the end of 2004 [9]. All underground coal mines were closed in the Midi-Pyrénées region and in the Nord Pas-de-Calais Basin. Mining in La Mure (Isére) and Carmaux (Tarn) ceased in 1997 [6]. Charbonnages de France envisioned the final stoppage of all coal mining in France by 2005.
2.3.6 Germany
The minerals and metals industry, which includes industrial processing, construction, and the mining industry, contributes almost 1% to the GDP. Production in the mining and metals industries depends on a variety of forces, including the availability of materials, as well as the supply and demand. The easing of the worldwide recession is a positive factor for those industries that depend on the exportation of their products. The high costs of production in Germany compared with those of competing foreign producers and the problems caused by trying to balance production between the merged German Democratic Republic and Federal Republic of Germany led to constraint production [6].
The technological standard of German mining operations is world class. Not-withstanding the general contraction of the industry, the production levels of certain minerals remain important, both domestically and on a global scale. For example, lignite ranks 1st in the EU and in the world; marketable rock salt and potash, 1st in the EU and 3rd in the world; and hard coal, 1st in the EU and 11th in the world.
There are a large number of inactive mines located in Germany. It should be specified though that there is not much information about their present condition.
2.3.7 Greece
The mining and metal-processing sectors of the economy of Greece are small but important parts of the national economy. The mining sector’s share of the gross national product is 1.7%. They are highly concentrated, as five mining compa-nies handle approximately 60% of the sector’s turnover. Bauxite is the most important of the Greek mineral commodities. Other important commodities are chromite, gold, iron, lead, nickel, and zinc [6]. Greece is the largest producer of bauxite and nickel in the EU.
Northern Greece is thought to contain a significant amount of exploitable min-eral resources and is receiving more attention with regard to exploration activities.
www.witpress.com, ISSN 1755-8336 (on-line) WIT Transactions on State of the Art in Science and Engineering, Vol 26, © 2006 WIT Press

42 DISPOSAL OF HAZARDOUS WASTE IN UNDERGROUND MINES
In 1998, most activities were directed toward gold. A number of multinational companies, such as Rio Tinto Plc., Normandy Mining Ltd., and Newmont Inc., expressed their interests in Greece’s northern territories [10].
The Kassandra Mines (Skouries and Olympias deposits) in northern Greece have been producing lead, silver, and zinc for more than 30 years. The mines were bought in 1996 by TVX Hellas, an affiliate of TVX Gold Inc. of Canada, with the idea of exploiting the refractory gold ore by incorporating pressure oxidation technology into the ore-processing phase.
To date, the extracted ore could not be processed, due to the opposition of the residents from nearby areas, who were against the operation of a processing plant due to environmental problems.
General Mining & Metallurgical Co. S.A. a ferronickel producer, was the latest state-owned company to be put up for sale by the Greek Government. LARCO was one of the world’s highest cost producers of nickel in ferronickel.
Greece is the world’s second-largest producer of bentonite after the USA. Bentonite is extracted from the island of Milos by open-pit mining. S&B and Mykobar Mining Co. S.A. (acquired by S&B in March 1999) are the major producers and accounted for almost all of the Greek bentonite.
S&B, together with its affiliates, is the largest producer of perlite in the EU. Perlite is extracted from the island of Milos by Otavi Minen Hellas S.A. (pur-chased by S&B in 1998). S&B continued also the production of natural zeolite in northern Greece.
Lava Mining and Quarrying Co. S.A. (LARCO), specializes in industrial min-erals with production of gypsum from the island of Crete, pozzolan from Milos, and pumice from the island of Yali.
Grecian Magnesite S.A. is a leading magnesite producer in the western world and the biggest exporter in the EU. Its open-pit mine is at Yerakini in northern Greece.
The Greek marble industry plays a leading role in the international dimension stone market, as a result of the marble production in almost all areas of the coun-try, its variety of uses and many colours (ash, black, brown, green, pink, red, and multicoloured).
PPC is the major producer of lignite, the predominant fuel in electricity genera-tion in Greece. PPC continued exploration in the basins of Amyntaion, Elasson, Florina, Megalopolis, and Ptolemais. PPC had reserves estimated to be 6.8 billion tons from which 4 billion tons was estimated to be economically recoverable by open-pit mining. Most PPC lignite is produced from the Ptolemais-Amyntaion basin with lesser amounts from the Megalopolis basin.
There are various inactive mines in Greece among which there are four under-ground mines.
2.3.8 Ireland
The exploitation of minerals in Ireland has a long history with small-scale production up to 1969. In that year the large complex lead–silver–zinc–copper–barite Tynagh deposit was discovered and several others followed [11].
www.witpress.com, ISSN 1755-8336 (on-line) WIT Transactions on State of the Art in Science and Engineering, Vol 26, © 2006 WIT Press

NEED AND POTENTIAL FOR UNDERGROUND DISPOSAL 43
Ireland is a major EU producer of zinc and an important producer of alumina, lead, and peat. Although the range of minerals exploited in the country has been limited, exploration activity for new mineral resources is continually increasing, mainly emphasized in gold, lead, and zinc. The country’s mineral-processing industry is small, as is the demand and consumption of mineral products [6].
Today, there are only three active mines in Ireland: the Tara mine, the Galmoy and Lisheen mine.
Industrial mineral production in Ireland is rather low with gypsum and limestone (production of about 1 million tons) being the most important.
There are four inactive mines in Ireland, three of which are underground. There are also two inactive mines, but no information was found on whether they are underground or open-pit.
2.3.9 Italy
Italy is a significant processor of imported raw materials, as well as a significant consumer and exporter of mineral and metal semi-manufactured and finished products. It is the world’s largest producer of pumice and related materials, producing almost one-half of the world’s output, as well as the world’s largest feldspar producer, producing about one-fourth of the world’s output. The country is the world’s eighth and tenth largest producer of crude steel and cement, res-pectively. Italy is also an important producer of dimension stone and marble [6].
Growth in Italy’s mining and extractive industries was marginal in 1998. Among the metallic ores, lead was mined, although production was minimal and decreasing. Most of the output came from the Silius Mine in Sardinia. The small output of zinc ore came from the safety and environmental recovery work in the remaining sites in the Iglesias area of Sardinia.
Industrial mineral production is the most important sector. Italy is the second largest cement producer of the EU, after Germany.
Italcementi-Fabbriche Riunite Cemento S.p.A. is the largest cement producer in Italy with 28 plants and more than 30% of the Italian market.
Italy is famous for its marble, which occurs in many localities and is quarried by hundreds of different companies.
In 1998, production of potash remained suspended. The main reasons were the result of a severe drought that has restricted the availability of process water to the plants and the inability to remove waste material and mine water owing to environmental and ecological concerns. In Sicily, the underground mines that were operating at Pasquasia, Racalmuto, and Realmonte, remained on standby.
Mining of metallic ores is expected to remain at its reduced level because of ore depletion. The metals-processing industry, based primarily on imported stocks, is expected to continue to play an important role in Italy’s economy. Italy is expected to remain a large producer of crude steel and a significant producer of secondary aluminium in the EU.
The industrial minerals quarrying industry and preparation plants are expected to remain significant, especially in the production of barite, cement, clays,
www.witpress.com, ISSN 1755-8336 (on-line) WIT Transactions on State of the Art in Science and Engineering, Vol 26, © 2006 WIT Press

44 DISPOSAL OF HAZARDOUS WASTE IN UNDERGROUND MINES
fluorspar, marble, and talc. Italy is expected to continue to be the world’s leading producer of feldspar, feldspathic minerals, and pumice. The ceramics sector is expected to be important, particularly regarding exports.
2.3.10 Luxembourg
Luxembourg’s mineral industry consists principally of raw materials processing information systems, and trading, among others. The country produces tradition-ally sand and gravel and crushed and dimension stone.
Mining in Luxembourg is represented by small industrial mineral operations that produce material for domestic consumption. These minerals include dolo-mite, limestone, sand and gravel, and slate [6].
ARBED dominates the mineral industry and is involved in producing pig iron, crude steel, and stainless steel, all from imported material. The company special-izes in the production of large architectural steel beams and is involved in other areas of the economy, such as the cement and brick-making industries. ARBED’s domestic and foreign subsidiaries have interests in steel making and steel products, cement, copper foil production, engineering, and mining.
As stated above, mining activity in Luxembourg is very limited and consists of domestic-scale industrial minerals operations. Thus, no specific information could be retrieved on active and inactive mines of the country.
2.3.11 Portugal
Portugal has a long history in the exploitation of metallic minerals starting about 2000 B.C. [6]. The first mining operations took place in ‘gossan’ type oxidation zones (for copper, zinc, lead, gold and silver) and gold-bearing plac-ers. Later, the Romans intensively exploited gold and polymetallic sulphide vein deposits [12].
From a geological point of view, Portugal is a considerably diverse and complex country. More specifically, the Iberian Peninsula is one of the most mineralized areas of Western Europe with a very complex geology. Massive sulphides linked to synorogenic vulcanism in the southwestern part of the Iberian Peninsula are well known internationally. The metallogenic province stretches about 250 km from Seville, Spain, to the southwestern coast of Portugal. On that world famous district a total of 30 deposits (11 in Portugal and 19 in Spain), with more than 1120 Mt, were discovered between 1950 and 1998, averaging 1.2 deposits/2 years, which is an amazing exploration performance index.
Today, Portugal is a significant European mineral producer and one of Europe’s leading copper producers. It is also a major producer of tin, tungsten, uranium and marble.
The Neves-Corvo Mine owned by Somincor and Rio Tinto Ltd. and the Panasqueira tungsten mine of Beralt Tin and Wolfram (Portugal) Ltd. are the two major operations in the metal-mining sector.
www.witpress.com, ISSN 1755-8336 (on-line) WIT Transactions on State of the Art in Science and Engineering, Vol 26, © 2006 WIT Press

NEED AND POTENTIAL FOR UNDERGROUND DISPOSAL 45
In Portugal there is no current gold production. However, a number of depos-its have been identified and considered to be significant. Jales-Tres Minas is the most important gold district in Portugal while Auspex Minerals Ltd., also announced in 1998 that they discovered 13 deposits with potential economic gold mineralization.
Industrial minerals production in Portugal is represented by a variety of mate-rials, most notably ceramics and dimension stone. The dimension stone industry is an important segment of the mining industry in terms of value and trade. Marble is the most valuable of the stone products and accounts for the majority of stone production. The main area for marble mining is the District of Evora. There is a potential for increased production of granite, marble, and slate. In addition, Pirites Alentejanas S.A.R.L. is the country’s largest producer of pyrite.
The present structure of the mineral industry could change in the near future because of significant mining exploration by several foreign companies. Copper, gold, kaolin, lead, lithium, pyrites, and tin are some of the minerals targeted for exploration. The Iberian Pyrite Belt is the prime area for exploration activity and appears to have an above-average potential for success on the basis of district’s record of about 90 documented mineralized deposits, an unusually high number of large sulphide deposits.
According to the Geological and Mining Institute of Portugal, there are numerous inactive mines in Portugal.
2.3.12 Spain
Spain is a significant European producer of non-ferrous precious metals, with some of the most mineralized territories in Western Europe. The main polymetallic deposits, from west to east, include Tharsis, Scotiel, Rio Tinto, and Aznalcollar. There are very few large mines. In terms of value of metallic and non-metallic minerals and quarry products, Spain is a leader among the EU countries. Conse-quently, Spain has one of the highest levels of self-sufficiency, with respect to mineral raw materials, among the EU members. Of a total of approximately 100 mineral products mined, about 18 are produced in significant quantities, such as bentonite, calcinated magnetite, copper, fluorspar, glauberite, iron, lead, mercury, potassic and sepiolitic salts, pyrites, quartz, refractory argillite, sea and rock salt, tin, tungsten, and zinc [6].
Production of many metallic minerals in Spain is insufficient to meet domestic demand, so these must be imported. For most non-metallic minerals, however, production exceeds by far domestic consumption and the surpluses are exported. The economic development of certain regions, such as the Basque Country and Asturias, is based on their mineral wealth. Therefore, mining is an important current and potential source of income in these areas.
Spain is one of the larger coal producers in the EU, with 26 million metric tons per year (Mt/yr) (all types), in 1998. Coal reserves are abundant but difficult to mine. Consequently, cost of production is higher, making Spanish coal less competitive than that of many other countries. The leading producer of soft coal
www.witpress.com, ISSN 1755-8336 (on-line) WIT Transactions on State of the Art in Science and Engineering, Vol 26, © 2006 WIT Press

46 DISPOSAL OF HAZARDOUS WASTE IN UNDERGROUND MINES
is Huelleras del Norte S.A. (Hunosa) and the leading producer of lignite is Empresa Nacional de Electricidad S.A. (Endesa).
Copper is mainly mined at the deposits in Sotiel and Migollas in Huelva, by Navan Resources Ltd. (Almagrera) and by Boliden Apirsa at Aznalcollar (Los Frailes deposit) near Seville.
Gold was being sought in Asturia, northeastern Spain, by Rio Narcea Gold Mines, Ltd., which acquired concessions and permits that previously belonged to the Spanish subsidiary of Anglo-American Corp.
Navan Resources Ltd. inaugurated its new polymetallic (copper, lead, and zinc) Aguas Tenidas Mine near Huelva in November 1997. Aguas Tenidas is the first underground operation to be developed in Spain in several years. The opera-tion supplies Navan’s nearby Almagrera mill and concentrator with 0.8 to 1 Mt/yr of ore. Navan acquired the mill and concentrator, along with three mines, Sotiel, Sotiel Este, and Miggollas, in June 1997.
The principal producer of iron ore was Compania Andaluza de Minas S.A. (CAM), which operated its open-pit mine at Marzuesado (Granada). Mining was halted in October 1996, and the mine remains inactive since the end of 1997.
However, production started at the nearby Los Frailes, one of the biggest open-pit mines in Europe. Ore production at Los Frailes was estimated to be approximately 4 Mt/yr. Los Frailes was closed in early 1998 after a large toxic spill. A waste reservoir ruptured and sent sludge into a nearby river. The spill poisoned some of the areas around the edges of Donana National Park, Europe’s largest nature reserve. Boliden was undertaking remedial actions and safety requirements in order to restart operations as soon as possible.
There are a number of inactive mines in Spain. No specific information could be retrieved on the inactive mines of the country, except that most of them are coal mines.
2.3.13 Sweden
Sweden is endowed with significant deposits of iron ore, certain base metals (copper, lead, and zinc) and several industrial minerals, including dolomite, feld-spar, granite, ilmenite, kaolin, limestone, marble, quartz and wollastonite. The country is well known for the production of high-quality steel. Sweden has developed nuclear and hydroelectric power, since the country must rely heavily on hydrocarbon imports owing to inadequate indigenous resources. After acceding to the EU on 1 January 1995, Sweden liberalized its mineral policy to parallel EU standards. The policy, based on the Swedish Minerals Act, 1992, eliminated laws requiring foreign companies to get special permission for prospecting, annulled the state’s participation in mining enterprises (so-called ‘crown shares’) and revoked all taxes and royalties, except for a 28% corporate tax, one of the lowest in Europe. Furthermore, an exploration permit holder cannot receive an exploration permit until adequate financial and technical capabilities can be proven [6].
The two largest companies in Sweden are Boliden AB, owned by Boliden Ltd, and the government owned Luossavaara-Kiirunavaara AB (LKAB).
www.witpress.com, ISSN 1755-8336 (on-line) WIT Transactions on State of the Art in Science and Engineering, Vol 26, © 2006 WIT Press

NEED AND POTENTIAL FOR UNDERGROUND DISPOSAL 47
Laisvall is the largest lead mine in Europe and it is located in Arjeplog Munici-pality, in northern Sweden, towards the Norwegian border. In January 1999, total proven and probable reserves were 6.8 Mt grading 0.8% zinc, 4.6% lead and 11 g/t silver. Measured and indicated reserves at that time were 3.35 Mt grading 1.2% zinc, 2.0% lead and 9 g/t silver. The company has planned to increase the ore output rate from Laisvall to 2.2 Mt/yr, given regulatory approvals [13].
Located near Hedemora, in the historic Bergslagen mining district of central Sweden, the two mines and common concentrator at Garpenberg comprise the smallest of Boliden’s mining areas. The company bought the Garpenberg mine and mill from AB Zinkgruvor in 1957. The exploration of a silver-rich area to the north during the 1960s led to the development of a second mine, Garpenberg Norra (Garpenberg North).
The open-pit Bjorgdal mine is the largest gold mine in Western Europe. The former owner, Terra Mining AB, was bought by Williams Resources Inc. in 1996. Williams Resources was continuing exploration activities and reported in 1998 that it had increased estimated minable reserves to 8.6 Mt of ore grading an average of 2.32 g/metric ton gold [14].
LKAB has iron ore mines and processing plants in Kiruna and Malmberget, a pelletizing plant in Svappavaara, and harbors at Luleå and Narvik. The company operated close to full capacity in 1997. LKAB’s Malmberget (ore mountain) iron ore mine, located at Gällivare, 75 km from Kiruna, contains some 20 orebodies spread over an underground area of about 5 by 2.5 km. Seven are currently being exploited. Mining began in 1892 and since then over 350 Mt of ore have been produced. Kiruna has the world’s largest underground iron ore mine. The ore-body in Kiruna is an enormous slice of magnetite. It is about four kilometres long, has an average width of 80 m and extends to an estimated depth of around 2 km at an incline of roughly 60°. The main haulage level is at a depth of 1.045 m. Mining of the orebody between levels 1.045 and 775 will continue until about the year 2018. Up to now, about 940 million tons of ore have been extracted from the Kiruna orebody.
The Zinkgruvan Mine, the largest zinc mine in Sweden, is owned by North Mining Svenska AB, a subsidiary of the Australian company, North Limited. Underground mining started in 1857. In the early 1990s, new technology and careful management reduced mining and milling costs to about 50%, converting a high-cost operation to the sixth lowest-cost zinc producer in the Western World by 1993. Currently, the operation is producing about 700,000 t/yr of zinc in concentrate.
The total production of industrial minerals, except aggregates and dimensional stones, in 1997 reached 9 million tons, a level that has been fairly constant dur-ing the 1990s. Limestone products, including dolomite and limestone for cement production, form 90% of the total, while silica sands, quartzite, feldspar, olivine and talc make up for the remaining 10% of the output. Tricorona Mineral AB owns three major mineral deposits, namely graphite, kaolin and wollastonite, of which only the graphite was in production in 1998. Three subsidiaries were formed to handle the development of the deposits, Woxna Graphite AB, Svenska Kaolin AB and Aros Mineral AB respectively [15].
www.witpress.com, ISSN 1755-8336 (on-line) WIT Transactions on State of the Art in Science and Engineering, Vol 26, © 2006 WIT Press
48 DISPOSAL OF HAZARDOUS WASTE IN UNDERGROUND MINES
According to the Swedish authorities on underground exploitation, the total number of abandoned mines is 25 in Northern Sweden and 775 in Central and Southern Sweden.
2.3.14 The Netherlands
In terms of world production, the Netherlands is a modest producer of metallic and non-metallic minerals and mineral products. Production of mineral commodi-ties generally remained the same or dropped slightly in 1998, compared to previ-ous years. The high cost of social benefits contributed to the production costs of Dutch products making them less competitive on the world market. The only min-ing operations left in the Netherlands are the extraction of peat, salt, and sand and gravel. The metal-processing sector relies almost exclusively on imported raw materials [6].
The Netherlands has no commercially exploitable reserves of metal ores. The only active mines that exist in the country extract industrial minerals.
No specific information could be retrieved on inactive mines of the country.
2.3.15 The United Kingdom
Mine production of ferrous and non-ferrous metals in the UK has been declining for the past 20 years as reserves become depleted. Since processing is the basis of a large and economically important mineral industry, significant imports are required to satisfy metallurgical requirements [6].
Operations in the steel sector showed moderate increases as the demand for steel increased. The industrial minerals sector has provided a significant base for expanding the extractive industries, and the balance has shifted away from the metallic mineral sector. Companies had a substantial interest in the production of domestic and foreign industrial minerals, such as aggregates, ball clay, gypsum, and kaolin (china clay).
Production of iron ore is limited to a small amount of hematite ore, mined by Egremont Mining Co. at the Florence Mine in Cumbria. The output goes for pigments and foundry annealing uses, rather than metal production. Primary steel production is based on imported iron ore, mainly from Australia and Brazil.
Activities in gold exploration and development in the UK increased in 1998. Northern Ireland, Scotland, and Wales continued to be the three main areas of exploration by companies. Scotland was the most active area with several explo-ration licenses in effect.
The UK is the leading world producer and exporter of ball clay, as well as the world’s largest exporter and second largest producer, after USA, of kaolin (china clay).
Watts, Blake, Bearne & Co. Plc. (WBB) is the country’s largest producer of ball clay. WBB Devon Clays Ltd. is responsible for the ball clay operations of WBB. The division operates eight open-pits and three underground mines that have a total combined capacity of 500,000 t/yr of crude ball clay.
www.witpress.com, ISSN 1755-8336 (on-line) WIT Transactions on State of the Art in Science and Engineering, Vol 26, © 2006 WIT Press

NEED AND POTENTIAL FOR UNDERGROUND DISPOSAL 49
English China Clays Plc. (ECC) is the largest producer of kaolin and one of the major producers worldwide. Operations are mainly found in the southwestern area of the UK. ECC Ball Clays Ltd. is responsible for the domestic ball clay operations of ECC. The division operates five quarries and three underground mines that have a combined output of 450,000 t/yr of crude ball clay. ECC International Ltd. oper-ates ball clay and kaolin mines and quarries in the Wareham Basin, Dorsetshire; the Bovey Basin, South Devonshire; and the Petrockstowe Basin, North Devonshire. The majority of the production comes from the Bovey Basin.
Fluorspar mining is concentrated in Derbyshire, from the Southern Pennine deposit. The major producer is Laporte Industries Plc., which operates two underground mines and one open-pit mine. The ore is processed at Laporte’s Cavendish Mill near Sheffield.
Durham Industrial Minerals Ltd. was to close five fluorspar mines at Rook-hope in Weardale. Falling prices of fluorspar, Chinese competition, and the strength of the pound were thought to have contributed to the closings [16].
British Gypsum Ltd., a subsidiary of BPB Industries Plc., is the major pro-ducer of gypsum in the UK. The company has mines in Cumbria, Leicestershire, Nottinghamshire, Staffordshire and Sussex that produce about 3 Mt/yr of gypsum. With few exceptions, this material supplies the domestic market.
Cleveland Potash Ltd. (CPL), the only potash producer in the UK, operates the Boulby Mine in Yorkshire. CPL also mines rock salt as a co-product from an under-lying seam in the Boulby Mine. Boulby potash occurs at depths between 1200 and 1500 m in a seam ranging from 0 to 20 m but averaging 7 m in thickness [17].
Most slate mining in the UK occurs in northern Wales; additional mining operations are found in Cornwall and the Lake District. Alfred McAlpine Slate Ltd. is the owner and operator of the Cwt y Bugail, Ffestiniog, and Penrhyn quarries in North Wales. The Penrhyn quarry at Bethesda, measuring 2.415 by 805 m, is considered to be the world’s largest slate quarry and has been in opera-tion for more than 400 years. The company also produces natural slate from its American quarry at Hilltop Slate Inc., New York. Historically, natural slate has been used in roofing applications, but in more recent times, markets have been extended to include interior flooring and windowsills together with ornamental landscapes. McAlpine Slate produces more than one-half of the UK’s entire pro-duction of natural slate. The company exports about two-thirds of its production, mostly to Europe. McAlpine received planning permission to exploit additional reserves at its Penrhyn quarry. The quarry, which covers an area of about 325 hectares (h), will be extended by an additional 45 h. This enlargement will extend the life of the quarry and increase extraction by a further 80 million metric tons of slate at the southern end of the quarry [18].
RJB Mining Plc., the largest coal mining company in the UK and the largest independent coal producer in the EU owns most of the coal mining industry. The largest operation is the underground Selby Complex, consisting of Riccall/ Whitmoor, Stillingfleet Combine and Wistow. There were also 24 small drift mines in operation in 1998. Open-pit mines in production in 1998 totalled 83. RJB Mining owned 16 producing open-pit mines; Celtic Energy Ltd. owned 5 open-pit
www.witpress.com, ISSN 1755-8336 (on-line) WIT Transactions on State of the Art in Science and Engineering, Vol 26, © 2006 WIT Press

50 DISPOSAL OF HAZARDOUS WASTE IN UNDERGROUND MINES
mines; and Scottish Coal Company Ltd. had 11 open-pit mines in Scotland. The remaining open-pit mines were operated by more than 25 other operators.
The UK has been a significant player in the world mining and mineral-processing industries. This has been more the result of an extensive range of companies in the country, with various interests in the international mineral indus-try rather than the domestic mineral industry. This scenario is expected to continue.
Exploration is expected to continue onshore and offshore. Onshore exploration activities will be directed mainly toward precious metals. Offshore exploration interest will continue to be focused on North Sea areas, particularly the areas west of the Shetland Islands, the Central North Sea, and the Southern Gas.
Five large underground mines in the UK ceased operations in the period 1998–2000.
2.4 Inactive underground mines used as waste disposal sites
Although the storage of wastes in inactive underground mines has attracted con-siderable interest in the past twenty years, it could be considered as a fairly recent concept. Salt mines, which usually are excavated by the room and pillar method, are of great interest in view of the possibility of reusing the openings for waste disposal. Some examples of inactive underground mines that have been used as waste repositories are shown in Table 2.4.
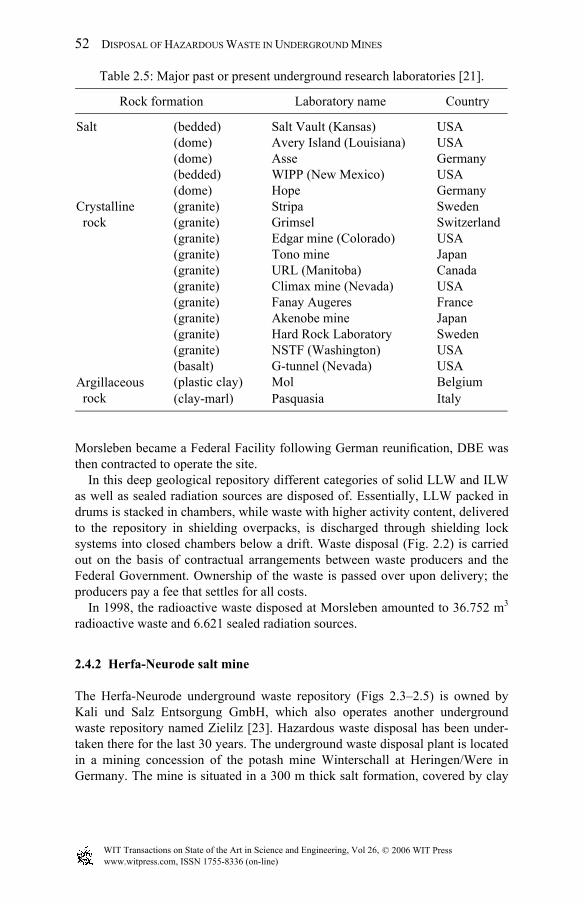
Several studies have been conducted on the feasibility of a deep geological dis-posal site and various geological media have been analysed for their thermal, mechanical and chemical properties. As a result, four underground research labora-tories are currently in operation in Europe: crystalline granite is being investigated at Grimsel (Switzerland) and Stripa (Sweden); the suitability of clay analysed at Mol (Belgium) and a salt formation is being studied at Asse (Germany). Further-more, laboratories are scheduled for the near future or are already under construc-tion, namely in France, Sweden (Aspo) and the UK (Sellafield). It must be specified that both Stripa and Asse are inactive underground mines [20]. Major past or present underground research laboratories are shown in Table 2.5.
The information below is a brief description about underground inactive mines that have been used as waste repositories, underground laboratories and for research purposes related with storage of wastes.
2.4.1 Morsleben salt mine
Morsleben repository is located in the federal state of Saxony-Anhalt [22]. At the site, potassium was mined until the early twenties. Thereafter, rock salt mining went on until 1969. Both the above operations left open cavities with a volume of approximately 10 million m3.
In 1970 the nuclear power plant operator of the former German Democratic Republic bought the mine to convert it into a low-level (LLW) and intermediate-level waste (ILW) repository. After a licensing procedure, waste disposal started in 1978 using rock cavities below the 500 m horizon for waste emplacement.
www.witpress.com, ISSN 1755-8336 (on-line) WIT Transactions on State of the Art in Science and Engineering, Vol 26, © 2006 WIT Press

NEED AND POTENTIAL FOR UNDERGROUND DISPOSAL 51
Tabl
e 2.
4: E
xam
ples
of i
nact
ive
unde
rgro
und
min
es th
at h
ave
been
reus
ed a
s was
te re
posi
torie
s in
Euro
pe [1
9].
N
ame
of m
ine
Type
of
ore
Ty
pe o
f reu
se
Not
es
Ger
man
y B
arte
nsle
ben
min
e Sa
lt St
orag
e of
radi
oact
ive
was
tes
Kon
rad
min
e Ir
on
Stor
age
of ra
dioa
ctiv
e w
aste
s (un
der s
tudy
)
H
eilb
roun
min
e Sa
lt St
orag
e of
fly
ash
was
tes;
stor
age
of a
nhyd
rite
and
clay
con
tam
inat
ed w
ith H
g R
oom
and
pill
ar
K
oche
ndor
f sal
t min
e Sa
lt St
orag
e of
flue
gas
, des
ulph
uriz
atio
n re
sidu
e fr
om
inci
nera
tion
plan
ts a
nd si
liceo
us sl
ags (
unde
r stu
dy)
Roo
m a
nd p
illar
W
alsu
m m
ine
Coa
l St
orag
e of
fly
ash
from
inci
nera
tion
plan
ts in
the
goaf
(und
er st
udy)
Lo
ngw
all m
inin
g
H
aus A
den/
Mon
opol
min
e C
oal
Stor
age
of fl
y as
h fr
om in
cine
ratio
n pl
ants
in th
e go
af (u
nder
stud
y)
Long
wal
l min
ing
Zi
elitz
min
e Po
tash
St
orag
e of
indu
stria
l was
tes
Roo
m a
nd p
illar
M
orsl
eben
min
e S
alt
Stor
age
of ra
dioa
ctiv
e w
aste
s and
seal
ed
radi
atio
n so
urce
s R
oom
and
pill
ar
H
erfa
-Neu
rode
min
e Sa
lt St
orag
e of
haz
ardo
us w
aste
s
Fran
ce
Jose
ph-E
lse
min
e Po
tash
St
orag
e of
indu
stria
l was
tes (
unde
r stu
dy)
Roo
m a
nd p
illar
Italy
C
odan
a m
ine
Gyp
sum
St
orag
e of
indu
stria
l was
tes
Roo
m a
nd p
illar
Bes
ta m
ine
Dol
omite
St
orag
e of
iner
t deb
ris (3
6.00
0 m
3 reus
ed)
Roo
m a
nd p
illar
Rus
sia
Ver
khne
kam
soye
are
a m
ines
Po
tash
St
orag
e of
was
te
Roo
m a
nd p
illar
Slov
enia
V
elen
je m
ine
Coa
l St
orag
e of
fly
ash
(und
er c
onst
ruct
ion)
Lo
ngw
all m
inin
g
UK
W
alsa
ll W
ood
colli
ery
old
min
e C
oal
Stor
age
of c
hem
ical
was
tes (
sinc
e 19
65)
Dud
ley
min
es
Lim
esto
ne
Col
liery
was
te a
nd fl
y as
h pu
mpe
d in
the
void
s fro
m th
e su
rfac
e R
oom
and
pill
ar
G
eost
ow p
roje
ct
Salt
Stor
age
of fl
y as
h fr
om in
cine
ratio
n pl
ants
www.witpress.com, ISSN 1755-8336 (on-line) WIT Transactions on State of the Art in Science and Engineering, Vol 26, © 2006 WIT Press
52 DISPOSAL OF HAZARDOUS WASTE IN UNDERGROUND MINES
Morsleben became a Federal Facility following German reunification, DBE was then contracted to operate the site.
In this deep geological repository different categories of solid LLW and ILW as well as sealed radiation sources are disposed of. Essentially, LLW packed in drums is stacked in chambers, while waste with higher activity content, delivered to the repository in shielding overpacks, is discharged through shielding lock systems into closed chambers below a drift. Waste disposal (Fig. 2.2) is carried out on the basis of contractual arrangements between waste producers and the Federal Government. Ownership of the waste is passed over upon delivery; the producers pay a fee that settles for all costs.
In 1998, the radioactive waste disposed at Morsleben amounted to 36.752 m3 radioactive waste and 6.621 sealed radiation sources.
2.4.2 Herfa-Neurode salt mine
The Herfa-Neurode underground waste repository (Figs 2.3–2.5) is owned by Kali und Salz Entsorgung GmbH, which also operates another underground waste repository named Zielilz [23]. Hazardous waste disposal has been under-taken there for the last 30 years. The underground waste disposal plant is located in a mining concession of the potash mine Winterschall at Heringen/Were in Germany. The mine is situated in a 300 m thick salt formation, covered by clay
Table 2.5: Major past or present underground research laboratories [21].
Rock formation Laboratory name Country
(bedded) Salt Vault (Kansas) USA (dome) Avery Island (Louisiana) USA (dome) Asse Germany (bedded) WIPP (New Mexico) USA
Salt
(dome) Hope Germany (granite) Stripa Sweden (granite) Grimsel Switzerland (granite) Edgar mine (Colorado) USA (granite) Tono mine Japan (granite) URL (Manitoba) Canada (granite) Climax mine (Nevada) USA (granite) Fanay Augeres France (granite) Akenobe mine Japan (granite) Hard Rock Laboratory Sweden (granite) NSTF (Washington) USA
Crystalline rock
(basalt) G-tunnel (Nevada) USA (plastic clay) Mol Belgium Argillaceous
rock (clay-marl) Pasquasia Italy
www.witpress.com, ISSN 1755-8336 (on-line) WIT Transactions on State of the Art in Science and Engineering, Vol 26, © 2006 WIT Press

NEED AND POTENTIAL FOR UNDERGROUND DISPOSAL 53
Figure 2.2: Waste disposal at Morsleben.
Figure 2.3: Surface view of the Herfa-Neurode repository.
www.witpress.com, ISSN 1755-8336 (on-line) WIT Transactions on State of the Art in Science and Engineering, Vol 26, © 2006 WIT Press

54 DISPOSAL OF HAZARDOUS WASTE IN UNDERGROUND MINES
Figure 2.4: Underground view of the Herfa-Neurode repository.
Figure 2.5: Underground view of the Herfa-Neurode repository.
www.witpress.com, ISSN 1755-8336 (on-line) WIT Transactions on State of the Art in Science and Engineering, Vol 26, © 2006 WIT Press

NEED AND POTENTIAL FOR UNDERGROUND DISPOSAL 55
layers, at a depth of about 800 m. Due to the clay layer, the salt deposit is iso-lated against the covering aquiferous layer and has therefore remained almost unchanged for the past 240 million years.
During the extraction of the potash deposits extending over an area of 1200 km2, cavities were formed using the room and pillar mining method, which are now used for the disposal of hazardous waste materials. The underground waste dis-posal plant was admitted in accordance with waste law. The supervisory authority is the Mining Authority, Hessen. In addition to the Waste Act, mining regulations are also involved as far as the operation of the plant is concerned.
The capacity of the plant depends, practically, on the haulage capacity in the Herfa shaft, which has a payload of 7 tons. The annual capacity of the haulage plant is 200,000 tons. The underground cavities permitted by the mining authority for hazardous waste storage are sufficient for 20 more years. The 30% of the waste currently stored come from the local area of Hessen, 50% from other Federal Lands and 20% from foreign countries of Western Europe. The classification of the waste origin, and its percentage share of the total, is as follows:
• residues from the flue gas cleaning of incinerator plants: 30%; • building rubble and earth excavation from demolition and renovation: 25%; • metal-processing industry: 20%; • residues from the chemical industry: 20%; • electrical industry (transformers, capacitors): 5%.
The waste is put together into material groups. Within a material group, wastes which have similar substances are stored together.
2.4.3 Konrad iron mine
Iron ore mining started in the former Konrad mine (Fig. 2.6) in Lower Saxony in the sixties and was phased out for economical reasons in 1976 [22]. At the same year the Konrad site was selected for investigation as a possible repository because of the great depth of the ore horizon, the fact that the mine is extraordi-narily dry and the complete isolation from shallow groundwater by clayish overlying rock.
Results of an extensive survey and evaluation programme led in 1982 to a positive statement regarding the site’s suitability to host a radioactive waste repos-itory. DBE has developed the repository technology, carried out the licensing procedure in cooperation with the government and will later transform the mine into a repository and operate it.
According to the license application, Konrad will be a repository for waste with negligible decay heat. Approximately 90% of the waste volume arising in Germany belongs to this category.
The Konrad repository will consist of 6 emplacement fields at different levels between 800 and 1300 m depth. A net disposal capacity of approximately 650,000 m3 of waste packages will be available. Fig. 2.7 shows a scheme of planned mine operation.
www.witpress.com, ISSN 1755-8336 (on-line) WIT Transactions on State of the Art in Science and Engineering, Vol 26, © 2006 WIT Press

56 DISPOSAL OF HAZARDOUS WASTE IN UNDERGROUND MINES
Figure 2.6: The Konrad mine [24].
Figure 2.7: Scheme of planned mine operation [24].
www.witpress.com, ISSN 1755-8336 (on-line) WIT Transactions on State of the Art in Science and Engineering, Vol 26, © 2006 WIT Press

NEED AND POTENTIAL FOR UNDERGROUND DISPOSAL 57
2.4.4 Stripa iron mine
Mining of Stripa iron mine (Fig. 2.8) dates back to the 15th century. During long periods of time mining occurred only sporadically, with a complete standstill between 1634 and 1771 [25]. Mining ceased in 1976 with a total production of 18 million tons of crude ore – quartz banded hematite. The mining operation ceased because the whole orebody had been mined.
Between 1977 and 1980 a common Swedish-American project (SAC, Swedish American Cooperation) was carried through in Stripa. The project consisted of three main parts:
• heat experiments with simulated waste containers; • evaluation of fissure hydrology; • geophysical measurements.
Extensive information was obtained about mechanical reactions to heat in the con-trol and ground water current in fissures in crystalline rock. The Swedish – American
Figure 2.8: Stripa mine [26].
www.witpress.com, ISSN 1755-8336 (on-line) WIT Transactions on State of the Art in Science and Engineering, Vol 26, © 2006 WIT Press

58 DISPOSAL OF HAZARDOUS WASTE IN UNDERGROUND MINES
Cooperation project attracted international interest and the international Stripa Project began in 1980. The research work was carried out as an independent pro-ject in the OECD Nuclear Energy Agency (NEA). Participating countries were: Finland, France, Japan, Canada, Great Britain, Spain, Switzerland, Sweden, and USA. The research was divided into the following areas:
• detection and mapping of fissure zones; • groundwater conditions and nuclide migration; • examination of bentonite clay for refilling and stopping up.
This part of the research went on up to the end of 1985. A third phase in the research began in 1986 and went on up to 1991. All previously mentioned coun-tries except France and Spain participated in this part. The major aim of the third phase was research about:
• hydrogeology, • chemical transportation, • engineering barriers, • geophysics.
2.4.5 Asse salt mine
Asse salt mine was used as a research laboratory for evaluation purposes (Fig. 2.9) of the salt disposal concept of Germany. The exploitation method used was room and pillar. The depth varies between 490 and 830 m. In 1965, the ownership of the Asse salt mine was transferred to GSF for the purposes of carrying out research
Figure 2.9: Storage of wastes in Asse mine for research purposes [27].
www.witpress.com, ISSN 1755-8336 (on-line) WIT Transactions on State of the Art in Science and Engineering, Vol 26, © 2006 WIT Press

NEED AND POTENTIAL FOR UNDERGROUND DISPOSAL 59
into the safe ultimate disposal of radioactive wastes. Since 1967, LLWs have been emplaced for experimental purposes until 1993, when experiments for the ultimate disposal of radioactive wastes at the Asse mine stopped.
Finally, it should be noted that there are also other underground mines that have been used as waste repositories, as shown in Table 2.4, but no detailed information about their operation is available. For example, chemical wastes have been stored in England since 1965 in an old mine at Walsall Wood colliery, at a depth of about 900 m. The mine is isolated environmentally by a geological graben with clay-filled faults on both sides and shale above.
References
[1] Kaliampakos, D. & Menegaki, M., Hazardous waste repositories in under-ground mines. A possible solution to an ever-pressing problem. Proc. of the 1st Conf. On Sustainable Development & Management of the Subsur-face, Utrecht: Netherlands, 5–7 November 2003.
[2] Carmody, J. & Sterling, R., Underground Space Design: A Guide to Subsurface Utilization and Design for People in Underground Spaces, Van Nostrand Reinhold: New York, 1993.
[3] Kaliampakos, D., Mavropoulos, A. & Damigos D., Reducing risk of expo-sure from hazardous waste repositories, presented at the Environmental Health 2003 Conference, Catania, Italy, 2003.
[4] Kaliampakos, D., Mavropoulos, A. & Prousiotis, J., Abandoned mines as hazardous waste repositories in Europe. Proc. of the 18th Int. Conf. On Solid Waste Technology and Management, Philadelphia, PA, 23–26 March 2003.
[5] National Technical University of Athens (NTUA), Survey of underground mines in Europe. Low Risk Disposal Technology Research project (Ε.Ε. EVGI-CT-2000-00020), Deliverable D1.1, 2000.
[6] United States Geological Survey (USGS), Minerals Information – Europe and Central Eurasia, 2001, URL: http://minerals.usgs.gov/minerals/pubs/ country/europe.html
[7] Knudsen, C., Nordic minerals review – Denmark, Industrial Minerals, No 374, pp. 52–55, November, 1998.
[8] Nurmi, A.P. & Peter, S.-W., Mining and Exploration in Finland, Society for Geology Applied to Mineral Deposits, News, No. 2, November 1996.
[9] Industrial Minerals, France – What next after MDPA has gone?. Industrial Minerals, No. 367, p. 54, April 1998.
[10] Mining and Metals, Tapping into Greece’s mineral treasure chest, February 1998, URL http://www.ana.gr/hermes/1998/feb/mining.htm
[11] Sol, M.V., Peters, S.W.M. & Aiking, H., Toxic Waste Storage Sites in EU Countries, A Preliminary Risk Inventory, IVM Report number: R-99/04, February 1999.
[12] Geological and Mining Institute of Portugal, 2001. [13] Mining Technology, 2000, URL: http://www.mining-technology.com
www.witpress.com, ISSN 1755-8336 (on-line) WIT Transactions on State of the Art in Science and Engineering, Vol 26, © 2006 WIT Press

60 DISPOSAL OF HAZARDOUS WASTE IN UNDERGROUND MINES
[14] Coal age, Bjorkdal gold mine is Europe’s largest, Coal Age, 103(3), p. 38, March 1998.
[15] Beckius, K. & Thomaeus, M., Nordic review – a series of features high-lighting the industrial minerals of Nordic countries. Sweden, Industrial Minerals, No. 374, pp. 52–82, November 1998.
[16] Industrial Minerals, Durham fluorspar mine closures imminent, Industrial Minerals, No. 373, p. 15, October 1998.
[17] Pearson, K., Potash producers. Industrial Minerals, No. 367, p. 57, April 1998.
[18] Industrial Minerals, McAlpine to extend Penrhyn slate quarry, Industrial Minerals, No. 365, p. 30, February 1998.
[19] Peila, D. & Pelizza, S., Civil reuses of underground mine openings: a summary of international experience. Tunnelling and Underground Space Technology, 10(2), pp. 179–191, 1995.
[20] Decamps, F. & Dujacquier, L., Overview of European practices and facili-ties for waste management and disposal. Nuclear Engineering and Design, Elsevier Science S.A., 176, pp. 1–7, 1997.
[21] International Association for Nuclear Energy, 2001, http://www. uilondon.org
[22] DBE mbH, 2000, URL: http://www.dbe.de [23] Kali und Salz, URL: http://www.kalisalz.basf.de [24] Bfs, The Konrad Repository Project, From an Iron Mine to a Repository
for Radioactive Wastes, Salzgitter, 1994. [25] Stripa Mine Service AB, 1999, http://www.stripa.se [26] Lawrence Berkeley National Laboratory, 1997, http://imglib.lbl.gov [27] National Research Center for Environment and Health, 2000, http://www.
gsf.de/Wir_ueber_uns/index_en.phtml
www.witpress.com, ISSN 1755-8336 (on-line) WIT Transactions on State of the Art in Science and Engineering, Vol 26, © 2006 WIT Press

Appendix to Chapter 2
A2.1 Austria
A2.1.1 Active mines and mineral production
Mines in Austria and their annual production for 1998 are shown in Table A2.1.
Table A2.1: Mines in Austria (based on the US Geological Survey).
Mineral Operating companies Name of the mines/
location
Annual production (103 tons)
Coal Graz-Koflacher Eisenbahn und Bergbaugesellschaft GmbH (Government 100%)
Oberdorf Mine 1,200
Graphite Industrie und Bergbaugesellschaft Pryssok & Co KG
Trandorf Mine at Móhldorf 15
Graphite Grafitbergbau Kaiserberg Franz Mayr-Melnhof & Co
Kaisersberg Mine 3
Graphite Grafitbergbau Trieben GmbH Trieben Mine 3 Gypsum Erste Salzburger Gipswerk-
Gesellschaft Christian Moldan KG
Abtenau and Moosegg Mines
300
Gypsum Rigips Austria GmbH Grundlsee, Puchberg, Unterkainisch, and Weisenbach Mines
250
Gypsum Knauf Gesellschaft GmbH Hinterstein Mine 160 Iron ore Voest-Alpine Erzberg GmbH
(Government 100%) Erzberg Mine at Eisenerz 2,000
Magnesite Veitsch-Radex AG Mines at Breitenau, Hochfilzen and Radenthein
600
Magnesite Radex Austria AG (Osterreichische Magnesit AG 100%)
Millstatteralpe Mine 250
Talc Luzenac Naintsch AG Mines at Lassing, Rabenwald, and Weisskirchen, Plants at Oberfeistitz and Weisskirchen
160
Tungsten Wolfram Bergbau und Hόtten GmbH Mittersill
Mine, Salzburg; conversion plant, Bergla
350
www.witpress.com, ISSN 1755-8336 (on-line) WIT Transactions on State of the Art in Science and Engineering, Vol 26, © 2006 WIT Press

214 DISPOSAL OF HAZARDOUS WASTE IN UNDERGROUND MINES
A2.1.2 Inactive mines
No specific information could be retrieved on inactive mines of the country except Schmitzbe coal mine, which closed in 1995, and Trimmelkam, which closed in 1992.
A2.2 Belgium
A2.2.1 Active mines and mineral production
Mineral production in Belgium for the years 1996–1998 is presented in Table A2.2. Table A2.2: Production of industrial minerals in Belgium (based on the US
Geological Survey).
Production (103 tons, unless otherwise specified)
Mineral 1996 1997 1998
Dolomite 3,379 3,466 3,500 Limestone 33,000 30,000 30,000 Petit granite (Belgian
bluestone) (m3) 1,200,000 1,200,000 1,000,000
Sodium sulphate 250 250 250
The country has been an important producer of marble for more than 2000 years. All the marble quarries are in Wallonia. Active mines and quarries in Belgium and their annual production for 1998 are shown in Table A2.3. Table A2.3: Active mines and quarries in Belgium (based on the US Geological
Survey).
Mineral Operating companies Name of the
mines/location
Annual production (103 tons)
Dolomite SA Dolomeuse (Group Lhoist)
Quarry at Marche les Dames
500
Dolomite SA de Marche-les-Dames (Group Lhoist)
Quarries at Namèche 3,000
Dolomite SA Dolomies de Merlemont (Group Lhoist)
Quarry at Philippeville 100
Limestone Carmeuse S.A. (Long View Investment NV)
Mines at Engis 1,850
continued
www.witpress.com, ISSN 1755-8336 (on-line) WIT Transactions on State of the Art in Science and Engineering, Vol 26, © 2006 WIT Press

APPENDIX TO CHAPTER 2 215
Table A2.3: Continued.
Mineral Operating companies Name of the
mines/location
Annual production (103 tons)
Limestone Carmeuse S.A. (Long View Investment NV)
Mines at Frasnes 450
Limestone Carmeuse S.A. (Long View Investment NV)
Mines at Maizeret 850
Limestone Carmeuse S.A. (Long View Investment NV)
Mines at Moha 800
Limestone SA Transcar (Royal Volker Stevin)
Mines at Maizeret 850
A2.2.2 Inactive mines
Very little information has been retrieved about inactive mines in Belgium. The only abandoned mines found are some coal mines, located throughout the coun-try. These mines are presented in Table A2.4.
Table A2.4: Inactive mines in Belgium.
Name
Mineral exploited
Location Dates of Operation
Le Hasard (Cheratte) (underground mine)
Coal Liége 1860s–1977
Blegny-Trembleur Coal Liége Closed until the mid 1980s
Bas Bois Coal Liége Closed until the mid 1980s
Houthalen Coal Kempen Closed until 1992 Winterslag Coal Kempen Closed until 1992 Andre Dumont Coal Waterschei
(Kempen) Closed until 1992
Eisden Coal Kempen Closed until 1992 Kleine Heide Coal Beeringen
(Kempen) Closed until 1992
Voort Coal Zolder (Kempen) Closed until 1992 Monceau-Fontaine 14 Coal Charleroi Closed until the mid
1980s Marcinelle Nord Coal Charleroi Closed until the mid
1980s
continued
www.witpress.com, ISSN 1755-8336 (on-line) WIT Transactions on State of the Art in Science and Engineering, Vol 26, © 2006 WIT Press

216 DISPOSAL OF HAZARDOUS WASTE IN UNDERGROUND MINES
Table A2.4: Continued.
Name
Mineral exploited
Location
Dates of Operation
Bois du Cazier Coal Charleroi Closed until the mid 1980s
St Catherine Coal Charleroi Closed until the mid 1980s
Anderlues Coal Centre Closed until the mid 1980s
St Albert in Ressaix Coal Centre Closed until the mid 1980s
Bois du Luc in Houdeng Aimeries
Coal Centre Closed until the mid 1980s
Note: Due to lack of available information, it is not possible to determine which of the above are underground mines, except ‘Le Hasard’ mine.
A2.3 Denmark
A2.3.1 Active mines and mineral production
Denmark has no known economically exploitable reserves of metallic ores, so the mining activity is concentrated in industrial minerals. Tables A2.5 and A2.6 show the production of industrial minerals and active mines, respectively.
Table A2.5: Production of industrial minerals (based on the US Geological Survey).
Production (tons unless otherwise specified)
Mineral 1996 1997 1998
Chalk 359,378 427,634 425,000 Clays (e) Fire clay 1,800 20 (*) 20 Kaolin 3,000 3,000 2,500 Other 8,050 8,000 6,000 Moler, extracted (thousand
cubic meters) 185 185 185
Lime, hydrated and quicklime 108,628 115,129 116,000 Salt, all forms 600,000 (*) 600,000 (e) 600,000
continued
www.witpress.com, ISSN 1755-8336 (on-line) WIT Transactions on State of the Art in Science and Engineering, Vol 26, © 2006 WIT Press
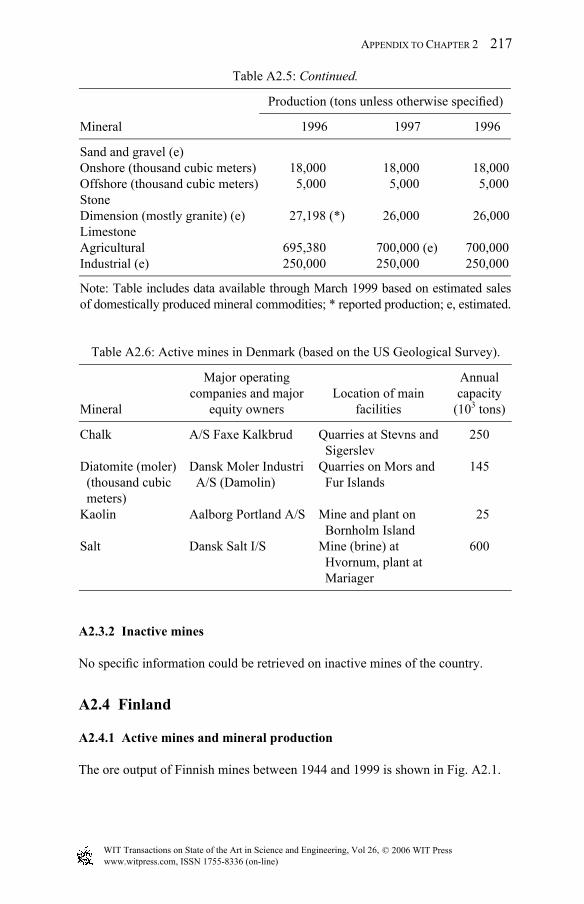
APPENDIX TO CHAPTER 2 217
Table A2.5: Continued.
Production (tons unless otherwise specified)
Mineral 1996 1997 1996
Sand and gravel (e) Onshore (thousand cubic meters) 18,000 18,000 18,000 Offshore (thousand cubic meters) 5,000 5,000 5,000 Stone Dimension (mostly granite) (e) 27,198 (*) 26,000 26,000 Limestone Agricultural 695,380 700,000 (e) 700,000 Industrial (e) 250,000 250,000 250,000
Note: Table includes data available through March 1999 based on estimated sales of domestically produced mineral commodities; * reported production; e, estimated.
Table A2.6: Active mines in Denmark (based on the US Geological Survey).
Mineral
Major operating companies and major
equity owners Location of main
facilities
Annual capacity
(103 tons)
Chalk A/S Faxe Kalkbrud Quarries at Stevns and Sigerslev
250
Diatomite (moler) (thousand cubic meters)
Dansk Moler Industri A/S (Damolin)
Quarries on Mors and Fur Islands
145
Kaolin Aalborg Portland A/S Mine and plant on Bornholm Island
25
Salt Dansk Salt I/S Mine (brine) at Hvornum, plant at Mariager
600
A2.3.2 Inactive mines
No specific information could be retrieved on inactive mines of the country.
A2.4 Finland
A2.4.1 Active mines and mineral production
The ore output of Finnish mines between 1944 and 1999 is shown in Fig. A2.1.
www.witpress.com, ISSN 1755-8336 (on-line) WIT Transactions on State of the Art in Science and Engineering, Vol 26, © 2006 WIT Press

218 DISPOSAL OF HAZARDOUS WASTE IN UNDERGROUND MINES
The metallic ore mines in Finland for 1998 are shown in Table A2.7.
Table A2.7: Metallic ore mines (based on the US Geological Survey).
Mineral
Major operating companies and
major equity owners Location of
main facilities
Annual capacity
(103 tons) Mine type
Chromite Outokumpu Oyj (Government, 40%; Insurance Co., 12.3%)
Mine at Kemi 1,000 OP+UG
Copper: Ore, Cu content
Outokumpu Oyj (Government, 40%; Insurance Co., 12.3%)
Mines at Pyhasalmi, Saattopora, and Hitura
10 UG
Gold: Ore, Au content (tons)
Outokumpu Oyj (Government, 40%; Insurance Co., 12.3%)
Mine at Orivesi 4 UG
Gold: Ore, Au content (tons)
Williams Resources Inc.
Pahtavaara Mine near Sodankyla
3 OP
continued
Figure A2.1: Ore output of Finnish mines between 1944 and 1999 (based on the
Geological Survey of Finland).
www.witpress.com, ISSN 1755-8336 (on-line) WIT Transactions on State of the Art in Science and Engineering, Vol 26, © 2006 WIT Press

APPENDIX TO CHAPTER 2 219
Table A2.7: Continued.
Mineral
Major operating companies and
major equity owners Location of
main facilities
Annual capacity
(103 tons) Mine type
Nickel: Ore, Ni content
Outokumpu Oyj (Government, 40%; Insurance Co., 12.3%)
Mine at Hitura 3 UG
Zinc: Ore, Zn content
Outokumpu Oyj (Government, 40%; Insurance Co., 12.3%)
Mine at Pyhasalmi
25 UG
OP, open-pit; UG, underground mining.
In addition, limestone mines and industrial mineral mines according to the Geological Survey of Finland for 1999 are shown in Tables A2.8 and A2.9, res-pectively.
Table A2.8: Limestone mines (based on the Geological Survey of Finland).
Mine District Mineral Owner Total ore
output (tons) Mine type
Parainen Parainen Lms Partek Nordkalk 1,279,870 OP+UG Ihalainen Lappeenranta Lms, Wol Partek Nordkalk 1,172,826 OP Putkinotko Vampula Dol Partek Nordkalk 151,834 OP+UG Ruokojärvi Kerimäki Lms, Dol Partek Nordkalk 251,838 UG Ryytimaa Vimpeli Dol Partek Nordkalk 184,816 OP Tytyri Lohja Lms Partek Nordkalk 197,367 UG Förby Särkisalo Lms Karl Forsström 170,225 UG Siikainen Siikainen Dol Partek Nordkalk 91,517 OP Sipoo Sipoo Dol, Lms Partek Nordkalk 158,670 UG Kalkkimaa Tornio Dol Saxo Minerals 92,012 OP Ankele Virtasalmi Dol Saxo Minerals 72,078 OP Reetinniemi Paltamo Dol Juuan
Dolomiittikalkki 34,820 OP
Vesterbacka Vimpeli Lms Partek Nordkalk 22,865 OP Mustio Karjaa Lms Partek Nordkalk 20,819 OP Matara Juuka Dol Juuan
Dolomiittikalkki 17,345 OP
Siivikkala Vampula Dol Partek Nordkalkk 14,216 OP Total 3,934,785
Lms, limestone; Wol, wollastonite; Dol, dolomite; OP, open-pit; UG, undergroundmining.
www.witpress.com, ISSN 1755-8336 (on-line) WIT Transactions on State of the Art in Science and Engineering, Vol 26, © 2006 WIT Press

220 DISPOSAL OF HAZARDOUS WASTE IN UNDERGROUND MINES
Table A2.9: Industrial mineral mines (based on the Geological Survey of Finland).
Mine District Mineral Owner
Total ore output
(tons) Mine type
Siilinjärvi Siilinjärvi Ap, Lms Kemira Chemicals 8,818,542 OP Horsmanaho Polvijärvi Tlc, Ni Mondo Minerals 491,651 OP Lahnaslampi Sotkamo Tlc, Ni Mondo Minerals 589,441 OP Kinahmi Nilsiä Qz SP Minerals 182,534 OP Lipasvaara Polvijärvi Tlc, Ni Mondo Minerals 58,013 OP Kemiö Kemiö Qz, Fsp SP Minerals 52,570 OP Ristimaa Tornio Qz Saxo Minerals 54,982 OP Haapaluoma Peräseinäjoki Fsp SP Minerals 0 OP Total 10,247,733
Ap, apatite; Lms, limestone; Tlc, talc; Fsp, feldspar; Qz, quartz; OP, open-pit.
Figure A2.2 shows the location of the major active mines in Finland.
Metallic 1. Pahtavaara: Au 1996- 2. Kemi: Cr 1969- 3. Hitura: Ni, Cu 1970- 4. Pyhäsalmi: Cu, Zn, S 1962- 5. Mullikkoräme: Zn, Cu 1996- 6. Orivesi: Au 1994- Non-metallic 7. Lahnaslampi: Talc, ni 1969- 8. Kinahmi: Quartz 1910- 9. Siilinjärvi: Apatite, limestone, mica 1979- 10. Horsmanaho: Talc, Ni 1980- 11. Ihalainen: Limestone, wollastonite 1910- 12. Sipoo: limestone, dolomite 1939- 13. Förby: limestone 1917- 14. Kemiö: Feldspar, quartz 1966- 15. Parainen: Limestone 1898-
Figure A2.2: Major active mines in Finland (based on the Geological Survey of
Finland).
www.witpress.com, ISSN 1755-8336 (on-line) WIT Transactions on State of the Art in Science and Engineering, Vol 26, © 2006 WIT Press

APPENDIX TO CHAPTER 2 221
Figure A2.3 shows the active and inactive gold mines and the significant proven and prospective gold deposits in Finland, while the industrial mineral mines and quarries in Finland are shown in Fig. A2.4.
Figure A2.3: Active and abandoned gold mines and proven and prospective gold
deposits in Finland (based on the Geological Survey of Finland).
www.witpress.com, ISSN 1755-8336 (on-line) WIT Transactions on State of the Art in Science and Engineering, Vol 26, © 2006 WIT Press

222 DISPOSAL OF HAZARDOUS WASTE IN UNDERGROUND MINES
Figure A2.4: Industrial mineral mines and quarries in Finland (based on the
Geological Survey of Finland).
www.witpress.com, ISSN 1755-8336 (on-line) WIT Transactions on State of the Art in Science and Engineering, Vol 26, © 2006 WIT Press
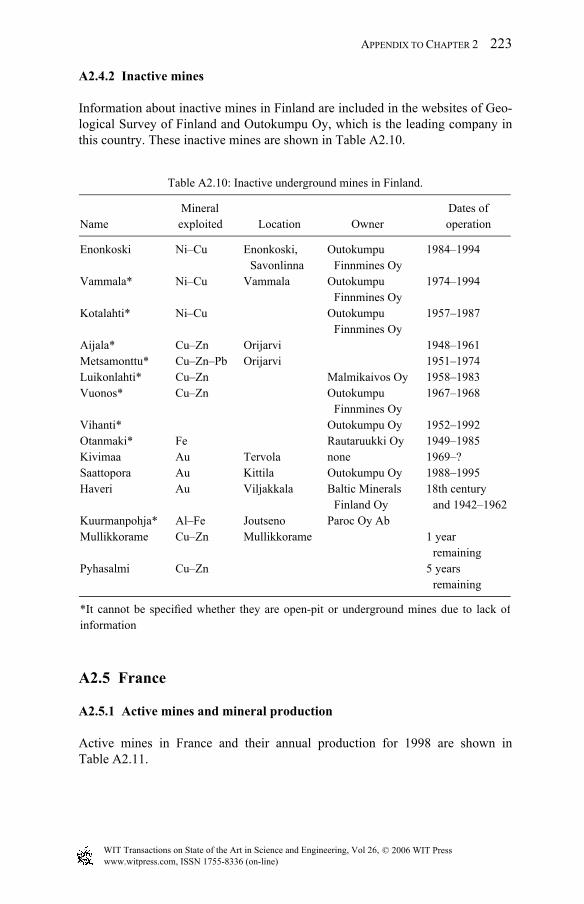
APPENDIX TO CHAPTER 2 223
A2.4.2 Inactive mines
Information about inactive mines in Finland are included in the websites of Geo-logical Survey of Finland and Outokumpu Oy, which is the leading company in this country. These inactive mines are shown in Table A2.10.
Table A2.10: Inactive underground mines in Finland.
Name Mineral exploited Location Owner
Dates of operation
Enonkoski Ni–Cu Enonkoski, Savonlinna
Outokumpu Finnmines Oy
1984–1994
Vammala* Ni–Cu Vammala Outokumpu Finnmines Oy
1974–1994
Kotalahti* Ni–Cu Outokumpu Finnmines Oy
1957–1987
Aijala* Cu–Zn Orijarvi 1948–1961 Metsamonttu* Cu–Zn–Pb Orijarvi 1951–1974 Luikonlahti* Cu–Zn Malmikaivos Oy 1958–1983 Vuonos* Cu–Zn Outokumpu
Finnmines Oy 1967–1968
Vihanti* Outokumpu Oy 1952–1992 Otanmaki* Fe Rautaruukki Oy 1949–1985 Kivimaa Au Tervola none 1969–? Saattopora Au Kittila Outokumpu Oy 1988–1995 Haveri Au Viljakkala Baltic Minerals
Finland Oy 18th century
and 1942–1962 Kuurmanpohja* Al–Fe Joutseno Paroc Oy Ab Mullikkorame Cu–Zn Mullikkorame 1 year
remaining Pyhasalmi Cu–Zn 5 years
remaining
*It cannot be specified whether they are open-pit or underground mines due to lack of information
A2.5 France
A2.5.1 Active mines and mineral production
Active mines in France and their annual production for 1998 are shown in Table A2.11.
www.witpress.com, ISSN 1755-8336 (on-line) WIT Transactions on State of the Art in Science and Engineering, Vol 26, © 2006 WIT Press

224 DISPOSAL OF HAZARDOUS WASTE IN UNDERGROUND MINES
Table A2.11: Mines in France (based on the US Geological Survey).
Mineral Operating companies Name of the
mines/location
Annual production (103 tons)
Andalusite Denain-Anzin Minéraux Refractaire Ceramique (DAMREC)
Glomel Mine, Brittany
75
Barite Barytine de Chaillac Mine and plant at Chaillac, Indre Province
150
Barite Société Industrielle du Centre
Mine at Rossigno, Indre Province
100
Coal Charbonnages de France (CdF), Bassin de Paris
Mines and washeries in middle France
2,500
Coal Charbonnages de France (CdF), Bassin de Nord-Pas-de-Calais
Mines and washeries in northern France
1,000
Coal Charbonnages de France (CdF), Bassin de Lorraine
Mines and washeries in eastern France
9,500
Feldspar Denain-Anzin Minéraux S.A. Mine and plant at St. Chély d’Apcher
55
Fluorspar Société Générale de Recherches et d’Exploitation Minière (SOGEREM)
Mines at Le Burc, Montroc le Moulina, and Trebas
150
Gold Société des Mines du Bourneix (Government)
Mines in the Saint Yrieix la Perche District, Limoges
4,000 (kg)
Gold Mines d’Or de Salsigne (Eltin Co., 51%; Co., 18%; Peter Hambro Plc., 10%)
Ranger Mine near Carcassonne
3,000 (kg)
Gypsum S.A. de Materiel de Construction
Mine at Taverny 1,500
Kaolin La Source Compagnie Minière
Kaolin d’Arvor Mine, Quessoy
300
Potash, K2O Mines de Potasse d’Alsace S.A. (MDPA)
Mines at Amélie, Marie-Louise, and Theodore, in Alsace
10,000
Salt, rock Compagnie des Salins du Midi et des Salines Varangeville de l’Est
Mine at Saint- Nicolas-de-Port
9,000
Talc Talcs de Luzenac S.A. (Rio Tinto Corp., 100%)
Trimons Mine near Ariège, Pyrenees
350,000
Uranium, U3O8
Compagnie Générale des Matières Nucleaires (COGEMA) (Government)
Mines at Limousin, Vendee, and Hérault
1,800
www.witpress.com, ISSN 1755-8336 (on-line) WIT Transactions on State of the Art in Science and Engineering, Vol 26, © 2006 WIT Press

APPENDIX TO CHAPTER 2 225
A2.5.2 Inactive mines
Various inactive mines are presented in Table A2.12.
Table A2.12: Inactive mines in France.
Name Mineral
exploited Location Owner Dates of operation
Ensisheim Coal Charbonnages de France
Ungersheim Coal Charbonnages de France
Rudolphe Coal Charbonnages de France
Marie/ Marie-Louise
Coal Charbonnages de France
Staffelfelden Coal Charbonnages de France
Berrwiller Coal Charbonnages de France
Theodore Coal Charbonnages de France
Schoenensteinbach Coal Charbonnages de France
Amelie Coal Charbonnages de France
Max Coal Charbonnages de France
Joseph/Else Coal Charbonnages de France
La Mure Coal Isére Charbonnages de France
Closed in 1997
Carmaux Coal Tarn Charbonnages de France
Closed in 1997
Saint-Bel Pyrite Saint-Pierre-la-Palud/Rhône
Mines of Mulhouse Potash Terres Rouges Iron Lorraine ARBED S.A. Closed in 1998 Bauxite Var Province Aluminium
Péchiney Société Anonyme des Bauxites et Alumines
Closed in 1993
www.witpress.com, ISSN 1755-8336 (on-line) WIT Transactions on State of the Art in Science and Engineering, Vol 26, © 2006 WIT Press

226 DISPOSAL OF HAZARDOUS WASTE IN UNDERGROUND MINES
A2.6 Germany
A2.6.1 Active mines and mineral production
Production of major minerals in Germany is shown in Table A2.13. Table A2.13: Production of major minerals (based on the European Association
of Mining Industries).
Production (106 unless otherwise specified)
Mineral 1996 1997 1998
Coal 47.9 46.5 41.3 Lignite 187.2 177 166.2 Oil 2.6 2.8 2.9 Natural gas (billion m3) 20.7 20.4 19.9 Potash 34.6 35.9 37.1 Rocksalt 4.9 4.1 n/a Gravel and sand 402 382 370 Quartz and quartz sand 28 28.1 n/a Quartzite 1.2 1.5 n/a Limestone 20.2 21.3 n/a Gypsum 2.6 2.5 n/a Feldspar (103 tons) 359.7 567.3 n/a Pegmatite (103 tons) 319 635.2 n/a Kaolin 1.8 1.8 n/a Bentonite (103 tons) 491.3 511 n/a Graphite (103 tons) 2.6 1 n/a Fluorspar (103 tons) 87.6 58 60.9 Barytes (103 tons) 218 121 210
In addition, major mines in Germany for 1998 are listed in Table A2.14.
Table A2.14: Major mines (based on the US Geological Survey and Industrial Minerals).
Mineral
Major operating companies and major equity
owners Location of main
facilities
Annual capacity
(103 tons)
Bentonite Sόd-Chemie AG Gammelsdorf, Bavaria 500
Chalk Kreidewerke Rugen GmbH
Quarries on Rugen Island 500
continued
www.witpress.com, ISSN 1755-8336 (on-line) WIT Transactions on State of the Art in Science and Engineering, Vol 26, © 2006 WIT Press

APPENDIX TO CHAPTER 2 227
Table A2.14: Continued.
Mineral
Major operating companies and major equity
owners Location of main
facilities
Annual capacity
(103 tons)
Coal, Four companies, about 27 mines, including Total
72,500 Ruhrkohle AG 14 mines in Ruhr region (40,000) anthracite and
bituminous Saarbergwerke AG 5 mines in Saar basin (14,000) Preussag Anthrazit
GmbH Mine at Ibbenburen (2,500)
Gypsum Gebr. Knauf Westdeutsche Gipswerke GmbH
Mines in Bavaria, Hesse, Saarrland, Lower Saxony
2,000
Kaolin Amberger Kaolinwerke GmbH
Mines at Groppendorf, Hirschau, and Sachsen
100
Limestone Harz Kalk GmbH Quarries at Bad Kosen, Rubelaand, and Kaltes Tal
6,000
Lignite Rheinische Braunkohlenwerke AG (Rheinbraun AG)
Surface mines in Rhenish mining area: Garzweiler, Bergheim, Inden, and Hambach
105,000
Lignite Lausitzer Braunkohle AG (LAUBAG)
Surface mines in Lausatian mining area: Janschwalde/ Cottbus-Nord, Welzow-Sud, Nochten/Reichswalde
50,000
Potash Kali und Salz AG Mines (17) at Bergmannssegen-Hugo, Niedersachen-Riedel, Salzdetfurth, Sigmundshall, Hattorf, Neuhof-Ellers, and Wintershall
4,000
Salt (rock) Kali und Salz AG Mines at Bad Friedrichshall-Kochendorf, Braunschweig-Luneburg, Heilbronn, Riedel, Stetten, and Wesel (Borth)
15,000
A2.6.2 Inactive mines
There are a large number of inactive mines located in Germany. Some of them are shown in Tables A2.15–A2.18. It should be specified that there is not much information about their present condition.
www.witpress.com, ISSN 1755-8336 (on-line) WIT Transactions on State of the Art in Science and Engineering, Vol 26, © 2006 WIT Press

228 DISPOSAL OF HAZARDOUS WASTE IN UNDERGROUND MINES
Table A2.15: Inactive underground metal mines.
Name Location/Description Mineral
exploited Dates of operation
Rammelsberg Mine
Goslar Lead, zinc, copper
Closed 1989
Erzbergwerk Grund
Bad Grund (Harz/Lower Saxony), Achenbach, Knesebeck, Wiemannsbucht and Meding Shaft
Lead, zinc Closed 1992
Einheit Mine Elbingerode (Harz/Lower Saxony), 2 shafts
Pyrite Closed 1990
Bernard-Koenen 2 Near Sangerhausen (Mansfeld/Sangerhausen)
Copper Closed 1990
Meggen Mine Lennestadt (North Rhine-Westfalia), Sicilia- und Baro Shafts
Pyrite, lead, zinc, baryte
Closed 1992
Lüderich mine Near Bergisch Gladbach (North Rhine-Westfalia), Haupt and Franziska Shaft
Lead, zinc Closed 1978
Schafberg Shaft Mechernich/Eifel Lead Türk Shaft Schneeberg
(Erzgebirge/Saxony) Silver
Ehrenfriedersdorf Mine
Erzgebirge/Saxony, 2 shafts
Tin Closed 1991
Altenberg Mine Erzgebirge/Saxony Tin Closed 1991 Damme 2 Damme, (Lower Saxony) Iron Malapertus Wetzlar, (Sieg / Lahn-Dill) Iron Lower Saxony, Sieg / Lahn-Dill,
Waldalgesheim (near Bingen), Oberpfalz (Bavaria) (a large number of remaining headgears of former iron mines)
Iron
Table A2.16: Inactive underground salt and potash mines.
Name Location/Description Mineral
exploited Dates of operation
Mariaglück Höfer near Celle (Lower Saxony), shafts: Mariaglück, Habighorst
Salt and potash
continued
www.witpress.com, ISSN 1755-8336 (on-line) WIT Transactions on State of the Art in Science and Engineering, Vol 26, © 2006 WIT Press

APPENDIX TO CHAPTER 2 229
Table A2.16: Continued.
Name Location/Description Mineral exploited
Dates of operation
Niedersachsen-Riedel
Hänigsen near Celle/Lerthe (Lower Saxony), shafts: Niedersachsen (potash) and Riedel I (salt)
Salt and potash
Closed 1997
Bergmannssegen-Hugo
Lerthe (Lower Saxony), shafts: Hugo, Bergmannsegen
Potash Closed 1994
Siegfried Giesen near Hildesheim (Lower Saxony), shaft: Siegfried
Potash
Hildesia-Mathildenhall
Dieckholzen near Hildesheim (Lower Saxony), shafts: Hildesia, Mathildenhall
Potash
Salzdetfurth Near Hildesheim (Lower Saxony), Shafts I, II, III
Potash Closed 1992
Glückauf Sondershausen Südharz (Thüringen), Shafts I, II, IV, V
Potash
Bleicherode Südharz, Südharz (Thüringen), shafts: Von Velsen I/II, Kleinbodungen
Potash
Sollstedt Südharz, Südharz (Thüringen), shafts: Sollstedt, Bernterode I/II
Potash
Bischofferode Südharz, Südharz (Thüringen), shafts: Bischofferode I/II, Neu-Bleicherode
Potash Closed 1993
Springen Werra (Thüringen/Hessen), shafts Springen I, II/III, IV/V
Potash
Alexandershall Werra (Thüringen/Hessen), remaining: Shaft II
Potash
Table A2.17: Inactive underground coal mines.
Name Location Mineral exploited Owner
Dates of operation
Eward/Hugo Ruhr Coal Deutsche Steinkohle AG
Closed 2000
Westfalen Ruhr Coal Deutsche Steinkohle AG
Closed 2000
Gottelborn/ Reden
Saar Coal Deutsche Steinkohle AG
Closed 2000
Wehofen Duisburg Coal
continued
www.witpress.com, ISSN 1755-8336 (on-line) WIT Transactions on State of the Art in Science and Engineering, Vol 26, © 2006 WIT Press
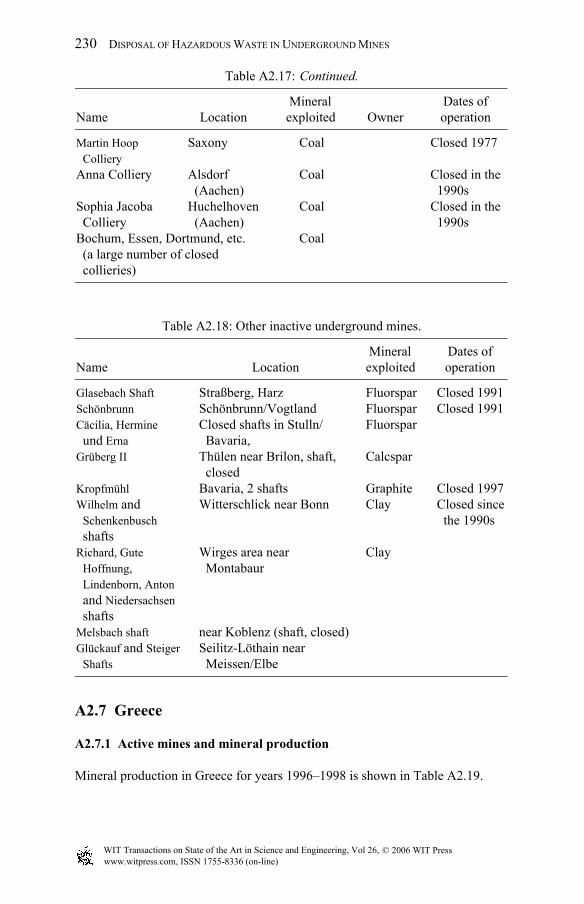
230 DISPOSAL OF HAZARDOUS WASTE IN UNDERGROUND MINES
Table A2.17: Continued.
Name Location Mineral exploited Owner
Dates of operation
Martin Hoop Colliery
Saxony Coal Closed 1977
Anna Colliery Alsdorf (Aachen)
Coal Closed in the 1990s
Sophia Jacoba Colliery
Huchelhoven (Aachen)
Coal Closed in the 1990s
Bochum, Essen, Dortmund, etc. (a large number of closed collieries)
Coal
Table A2.18: Other inactive underground mines.
Name Location Mineral exploited
Dates of operation
Glasebach Shaft Straßberg, Harz Fluorspar Closed 1991 Schönbrunn Schönbrunn/Vogtland Fluorspar Closed 1991 Cäcilia, Hermine
und Erna Closed shafts in Stulln/
Bavaria, Fluorspar
Grüberg II Thülen near Brilon, shaft, closed
Calcspar
Kropfmühl Bavaria, 2 shafts Graphite Closed 1997 Wilhelm and
Schenkenbusch shafts
Witterschlick near Bonn Clay Closed since the 1990s
Richard, Gute Hoffnung, Lindenborn, Anton and Niedersachsen shafts
Wirges area near Montabaur
Clay
Melsbach shaft near Koblenz (shaft, closed) Glückauf and Steiger
Shafts Seilitz-Löthain near
Meissen/Elbe
A2.7 Greece
A2.7.1 Active mines and mineral production
Mineral production in Greece for years 1996–1998 is shown in Table A2.19.
www.witpress.com, ISSN 1755-8336 (on-line) WIT Transactions on State of the Art in Science and Engineering, Vol 26, © 2006 WIT Press

APPENDIX TO CHAPTER 2 231
Table A2.19: Mineral production in Greece (based on the European Association of Mining Industries).
Annual production (103 tons)
Minerals 1996 1997 1998
Alumina 602 584 622 Bauxite 2,452 1,877 1,823 Bentonite, activated and
processed 663 735 800
Lignite 59,738 58,939 60,400 Magnesite 682 623 n/a Magnesia, calcined 119 117 104 Magnesia, dead burned 57 86 100 Nickeliferous ore 2,195 1,887 1,800 Perlite 599 696 n/a PbS concentrate 11.5 26.1 30 ZnS concentrate 13.6 32.6 39
Active mines in Greece and their annual production for 1998 are shown in Table A2.20.
Table A2.20: Active mines in Greece (based on the US Geological Survey).
Mineral Operating companies Name of the
mines/location
Annual production (103 tons)
Bauxite Bauxites Parnasse Mining Co. S.A. (Eliopoulos- Kyriakopoulos Group)
Mines at Fokis 2,000
Bauxite Eleusis Bauxites Mines, S.A. (ELBAUMIN) (National Bank of Greece)
Mines near Drama, Itea, and Fthiotis-Fokis
300
Bauxite Delphi-Distomon S.A.; Hellenic Bauxites of Distomon S.A.; (Aluminium de Grèce S.A.)
Opencast mines at Delphi-Distomon area
500
Bentonite Mykobar Mining Co. S.A. (Silver and Baryte Ores Mining Co. S.A.)
Mines at Adamas, Milos Island
180
Bentonite Silver and Baryte Ores Mining Co. S.A.
Mines at Adamas, Milos Island
500
Bentonite Mediterranean Bentonite Co. S.A. (Industria Chemica Mineraria S.p.A., Italy)
Surface mines on Milos Island
20
continued
www.witpress.com, ISSN 1755-8336 (on-line) WIT Transactions on State of the Art in Science and Engineering, Vol 26, © 2006 WIT Press

232 DISPOSAL OF HAZARDOUS WASTE IN UNDERGROUND MINES
Table A2.20: Continued.
Mineral Operating companies Name of the
mines/location
Annual production (103 tons)
Chromite Financial-Mining-Industrial and Shipping Corp. (FIMISCO) (IRO)
Tsingeli Mines and plant near Volos
25
Gold, Au in concentrate
TVX Hellas (TVX Gold Inc., Canada
Kassandra Mines, Olympiada
25
Gypsum Lava Mining and Quarrying Co. S.A.
Altsi deposit, Crete Island
250
Gypsum Titan Cement Co. S.A. 280 Lead, mine,
Pb in concentrate
TVX Hellas (TVX Gold Inc., Canada)
Kassandra mines (Olympias and Stratoni), northeast Chalkidiki
Lignite Public Power Corporation (Government)
Megalopolis Mine, central Peloponnesus
7,000
Lignite Public Power Corporation (Government)
Ptolemais Mine, near Kozani
28,000
Magnesite, concentrate
Viomagn-Fimisco Ltd. (Violignit S.A., 65%, Alpha Ventures, 35%)
Mines at Gerorema and Kakavos, at Mantoudhi, northern Euboea Island
250
Magnesite Grecian Magnesite S.A. Mine at Yerakini, Chalkidiki
200
Nickel, ore General Mining & Metallurgical Co. S.A. (LARCO) (IRO)
Aghios Ioannis Mines near Larymna
500
Nickel, ore Mines at Euboea 2,500 Perlite Silver and Baryte Ores Mining
Co. S.A. Mines on Kos and
Milos Islands 300
Perlite Otavi Minen Hellas S.A. (Otavi Minen AG, Germany)
Milos Island 150
Perlite Do. Bouras Co. Kos Island 50 Pozzolan
(Santorin earth)
Lava Mining & Quarrying Co. Ltd. (Heracles General Cement Co. S.A.)
Quarries in Milos 350
Pozzolan Titan Cement Co. S.A. 300 Zeolite Silver and Baryte Mining Co. S.A. Mine at Pendalofos 100 Zinc, mined,
Zn in concentrate
TVX Hellas (TVX Gold Inc., Canada)
Kassandra mines (Olympias and Stratoni), northeast Chalkidiki
25
www.witpress.com, ISSN 1755-8336 (on-line) WIT Transactions on State of the Art in Science and Engineering, Vol 26, © 2006 WIT Press

APPENDIX TO CHAPTER 2 233
The Greek marble industry plays a leading role in the international dimension stone market, as a result of the marble production in almost all areas of the coun-try, its variety of uses and many colours (ash, black, brown, green, pink, red, and multicoloured) (Fig. A2.5).
PPC is the major producer of lignite, the predominant fuel in electricity
generation in Greece. PPC continued exploration in the basins of Amyntaion, Elasson, Florina, Megalopolis, and Ptolemais. PPC had reserves estimated to be 6.8 billion tons from which 4 billion tons was estimated to be economically recoverable by open pit mining. Most PPC lignite is produced from the Ptolemais-Amyntaion basin with lesser amounts from the Megalopolis basin (Fig. A2.6).
A2.7.2 Inactive mines
Various inactive mines in Greece are presented in Table A2.21.
MARBLE TYPE
AlabasterGreenVaricolouredGrey-BlackRedWhitish to Grey
Figure A2.5: Location of marble deposits in Greece.
www.witpress.com, ISSN 1755-8336 (on-line) WIT Transactions on State of the Art in Science and Engineering, Vol 26, © 2006 WIT Press
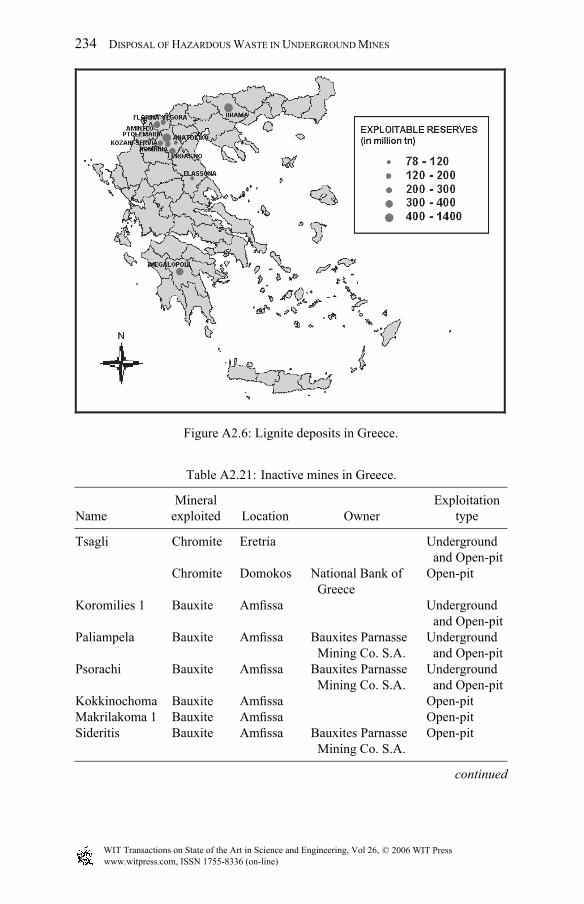
234 DISPOSAL OF HAZARDOUS WASTE IN UNDERGROUND MINES
Table A2.21: Inactive mines in Greece.
Name Mineral
exploited Location Owner Exploitation
type
Tsagli Chromite Eretria Underground and Open-pit
Chromite Domokos National Bank of Greece
Open-pit
Koromilies 1 Bauxite Amfissa Underground and Open-pit
Paliampela Bauxite Amfissa Bauxites Parnasse Mining Co. S.A.
Underground and Open-pit
Psorachi Bauxite Amfissa Bauxites Parnasse Mining Co. S.A.
Underground and Open-pit
Kokkinochoma Bauxite Amfissa Open-pit Makrilakoma 1 Bauxite Amfissa Open-pit Sideritis Bauxite Amfissa Bauxites Parnasse
Mining Co. S.A. Open-pit
continued
Figure A2.6: Lignite deposits in Greece.
www.witpress.com, ISSN 1755-8336 (on-line) WIT Transactions on State of the Art in Science and Engineering, Vol 26, © 2006 WIT Press

APPENDIX TO CHAPTER 2 235
Table A2.21: Continued.
Name Mineral exploited Location Owner
Exploitation type
Stifari Bauxite Amfissa Bauxites Parnasse Mining Co. S.A.
Open-pit
Koromilies 2 Bauxite Amfissa Open-pit Koromilies 3 Bauxite Amfissa Open-pit Makrilakoma 2 Bauxite Amfissa Open-pit Zidani Asbestos Kozani Hellenic Mineral
Mining Co. S.A. Open-pit
A2.8 Ireland
A2.8.1 Active mines and mineral production
Table A2.22 shows the mineral production in Ireland for the years 1996–1998.
Table A2.22: Mineral production in Ireland (based on the European Association
of Mining Industries).
Production (103 tons unless otherwise specified)
Mineral 1996 1997 1998
Lead (metal in concentrate) 45.3 45 35.9 Zinc (metal in concentrate) 164.5 193 177.2 Silver (’000 kg in lead
concentrate) 14.7 13.3 10.8
Gypsum 422.8 477 500 Alumina 1,233.5 1,272.8 1300 Natural gas (billion m3) 2.74 2.42 1.79
Today, there are only three active mines in Ireland: the Tara Mine, the Galmoy
and Lisheen Mine (Table A2.23).
Table A2.23: Irish-based metal mines (based on Dhonau N.B.).
Name Minerals Dates of operation Type of mine
Navan Zn, Pb 1977 to at least 2010 Underground Galmoy Zn, Pb 1997 to at least 2012 Underground Lisheen Zn, Pb 1999 to at least 2015 Underground
www.witpress.com, ISSN 1755-8336 (on-line) WIT Transactions on State of the Art in Science and Engineering, Vol 26, © 2006 WIT Press
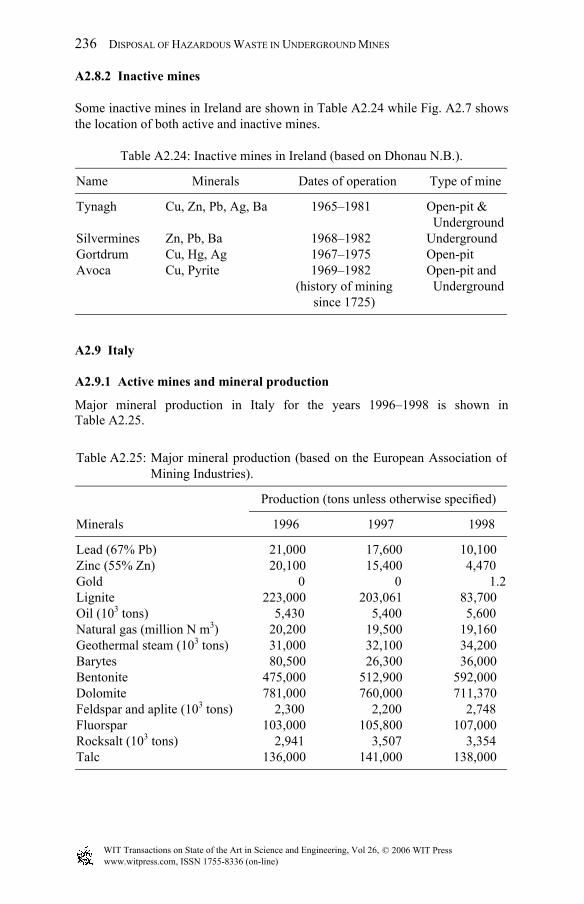
236 DISPOSAL OF HAZARDOUS WASTE IN UNDERGROUND MINES
A2.8.2 Inactive mines
Some inactive mines in Ireland are shown in Table A2.24 while Fig. A2.7 shows the location of both active and inactive mines.
Table A2.24: Inactive mines in Ireland (based on Dhonau N.B.).
Name Minerals Dates of operation Type of mine
Tynagh Cu, Zn, Pb, Ag, Ba 1965–1981 Open-pit & Underground
Silvermines Zn, Pb, Ba 1968–1982 Underground Gortdrum Cu, Hg, Ag 1967–1975 Open-pit Avoca Cu, Pyrite 1969–1982
(history of mining since 1725)
Open-pit and Underground
A2.9 Italy
A2.9.1 Active mines and mineral production
Major mineral production in Italy for the years 1996–1998 is shown in Table A2.25.
Table A2.25: Major mineral production (based on the European Association of
Mining Industries).
Production (tons unless otherwise specified)
Minerals 1996 1997 1998
Lead (67% Pb) 21,000 17,600 10,100 Zinc (55% Zn) 20,100 15,400 4,470 Gold 0 0 1.2 Lignite 223,000 203,061 83,700 Oil (103 tons) 5,430 5,400 5,600 Natural gas (million N m3) 20,200 19,500 19,160 Geothermal steam (103 tons) 31,000 32,100 34,200 Barytes 80,500 26,300 36,000 Bentonite 475,000 512,900 592,000 Dolomite 781,000 760,000 711,370 Feldspar and aplite (103 tons) 2,300 2,200 2,748 Fluorspar 103,000 105,800 107,000 Rocksalt (103 tons) 2,941 3,507 3,354 Talc 136,000 141,000 138,000
www.witpress.com, ISSN 1755-8336 (on-line) WIT Transactions on State of the Art in Science and Engineering, Vol 26, © 2006 WIT Press
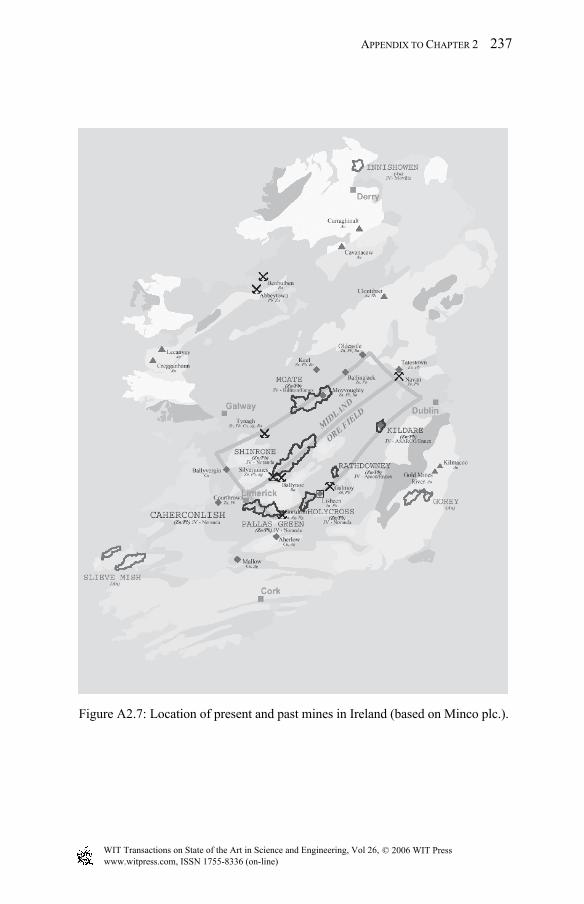
APPENDIX TO CHAPTER 2 237
Figure A2.7: Location of present and past mines in Ireland (based on Minco plc.).
www.witpress.com, ISSN 1755-8336 (on-line) WIT Transactions on State of the Art in Science and Engineering, Vol 26, © 2006 WIT Press

238 DISPOSAL OF HAZARDOUS WASTE IN UNDERGROUND MINES
Active mines in Italy are shown in Table A2.26.
Table A2.26: Active mines (based on the US Geological Survey and Industrial Minerals).
Mineral
Major operating companies and major
equity owners Location of
main facilities
Annual capacity
(103 tons)
Asbestos Amiantifera di Balangero S.p.A.
Mine at Balangero, near Turin
100
Barite Bariosarda S.p.A (Ente Mineraria Sarda)
Mines at Barega and Mont ’Ega, Sardinia
100
Barite Edem S.p.A. (Government)
Mines at Val di Castello, Lucca
20
Barite Edemsarda S.p.A. (Soc. Imprese Industriali)
Mines at Su Benatzu, Sto Stefano, and Peppixeddu, Sardinia
20
Barite Mineraria Baritina S.p.A
Mines at Marigolek, Monte Elto, and Primaluna, near Milan
20
Bauxite Sardabauxiti S.p.A. (Government)
Mine at Olmedo, Sardinia 350
Bentonite Industria Chimica Carlo Laviosa S.p.A
Mines and plant on Sardinia Island, and a plant near Pisa
250
Calcium carbonate
Omya S.p.A. Mine and plant at Carrara, Nocera
Over 500 (1994)
Feldspar Maffei S.p.A. Surface mines at Pinzolo, Sondalo, and Campiglia Marittima; underground mine at Vipiteno
(200) (300)
Feldspar Miniera di Fragne S.p.A.
Surface mine at Alagna Valsesia
(60)
Feldspar Sabbie Silicee Fossanova S.P.A. (Sasifo)
Surface mine at Fossanova
(30)
Gold Gold Mines of Sardinia Ltd. 70%, Government 30%
Furtei Mine near Cagliaria, Sardinia
1,400 (kg)
Lead–zinc, ore
Enirisorse S.p.A. (Government)
Mines at Masua, Monteponi, and Sardinia
60
Lignite Ente Nazional per l’Energia Electtrica (ENEL)
Surface mines at Pietrafitta and Santa Barbara
1,500
continued
www.witpress.com, ISSN 1755-8336 (on-line) WIT Transactions on State of the Art in Science and Engineering, Vol 26, © 2006 WIT Press

APPENDIX TO CHAPTER 2 239
Table A2.26: Continued.
Mineral
Major operating companies and major
equity owners Location of
main facilities
Annual capacity
(103 tons)
Marble A number of companies, largest of which include: Mineraria Marittima Srl
Quarries in the Carrara and Massa areas
2,000
Olivine Nuova Cives Srl. Mine and processing at Vidracco, Piemonte
300
Potash ore Industria Sali Otassici e Affini per Aziono S.p.A.
Underground mines at Corvillo, Pasquasia, Racalmuto, and San Cataldo, in Sicily
1,300
Potash ore Sta Italiana Sali Alcalini S.p.A. (Italkali)
Underground mines at Casteltermini and Pasquasia, Sicily
700
Pumice Pumex S.p.A. Quarry, Lipari Island, north of Sicily
600
Pumice Europumice Srl Pian di Valle, La Collina, Le Mandarie and S Giovanni delle Contee
150
Pyrite Nuova Solmine S.p.A. Underground mines at Campiano and Niccioleta
900
Salt, rock Sta Italiana Sali Alcalini S.p.A. (Italkahi)
Underground mines at Petralia, Racalmuto, and Realmonte, Sicily
4,000
Salt, rock Solvay S.p.A. Underground mines at Buriano, Pontteginori, and Querceto, Tuscany
2,000
Talc Luzenac Val Chisone S.p.A.
Mines at Pinerolo, near Turin, and at Orani, Sardinia
120
Talc Talco Sardegna S.p.A. Mine at Orani, Sardinia 20
A2.9.2 Inactive mines
Some inactive mines in Italy are presented in Table A2.27.
www.witpress.com, ISSN 1755-8336 (on-line) WIT Transactions on State of the Art in Science and Engineering, Vol 26, © 2006 WIT Press
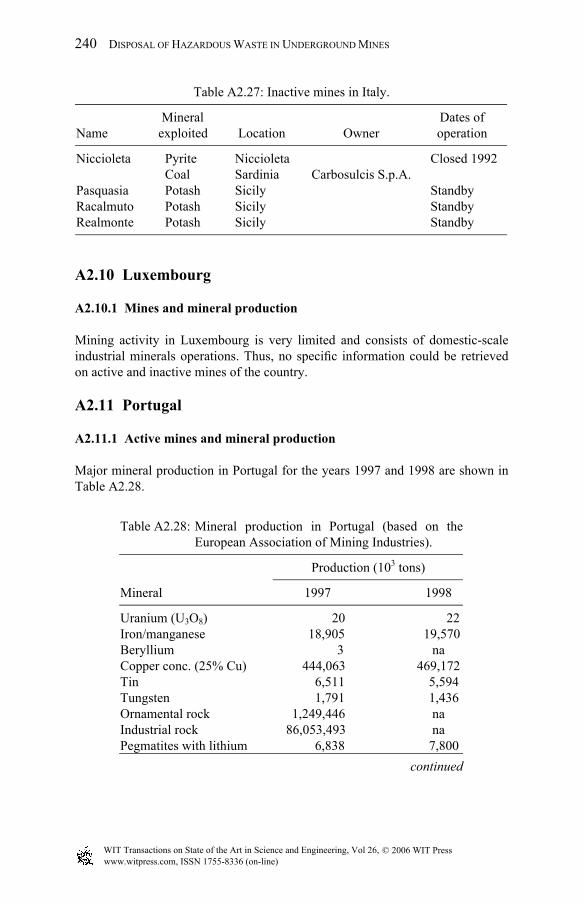
240 DISPOSAL OF HAZARDOUS WASTE IN UNDERGROUND MINES
Table A2.27: Inactive mines in Italy.
Name Mineral exploited Location Owner
Dates of operation
Niccioleta Pyrite Niccioleta Closed 1992 Coal Sardinia Carbosulcis S.p.A. Pasquasia Potash Sicily Standby Racalmuto Potash Sicily Standby Realmonte Potash Sicily Standby
A2.10 Luxembourg
A2.10.1 Mines and mineral production
Mining activity in Luxembourg is very limited and consists of domestic-scale industrial minerals operations. Thus, no specific information could be retrieved on active and inactive mines of the country.
A2.11 Portugal
A2.11.1 Active mines and mineral production
Major mineral production in Portugal for the years 1997 and 1998 are shown in Table A2.28.
Table A2.28: Mineral production in Portugal (based on the
European Association of Mining Industries).
Production (103 tons)
Mineral 1997 1998
Uranium (U3O8) 20 22 Iron/manganese 18,905 19,570 Beryllium 3 na Copper conc. (25% Cu) 444,063 469,172 Tin 6,511 5,594 Tungsten 1,791 1,436 Ornamental rock 1,249,446 na Industrial rock 86,053,493 na Pegmatites with lithium 6,838 7,800
continued
www.witpress.com, ISSN 1755-8336 (on-line) WIT Transactions on State of the Art in Science and Engineering, Vol 26, © 2006 WIT Press

APPENDIX TO CHAPTER 2 241
Table A2.28: Continued.
Production (103 tons)
Mineral 1997 1998
Salt 595,997 580,209 Feldspathic sands 8,550 9,000 Quartz 9,177 9,000 Feldspar 81,597 80,000 Diatomite 1,540 1,525 Pegmatites (mixed
quartz and feldspar) 6,200 6,000
Talc 8,236 8,400
In addition, Fig. A2.8 shows the location of active metallic mines for 1998. Information about the major ones is shown in Table A2.29.
Table A2.29: Major mines in Portugal (based on the US Geological Survey).
Mineral
Major operating companies and
major equity owners Location of
facilities
Annual capacity
(103 tons)
Copper Sociedade Mineira de Neves-Corvo S.A. (Somincor) (Government, 51%; Rio Tinto Ltd., 49%)
Neves-Corvo Mine near Castro Verde
500
Diatomite Sociedade Anglo-Portugesa de Diatomite Lda.
Mines at Obidos and Rolica
5
Feldspar A.J. da Fonseca Lda. Seixigal Quarry, Chaves
10
Tin Somincor (Government, 51%; Rio Tinto Ltd., 49%)
Neves-Corvo Mine near Castro Verde
5
Tungsten Beralt Tin and Wolfram (Portugal) Ltd. (Avocet Mining Plc. 100%)
Panasqueira Mine and plant at Barroca Grande
1,600
Uranium tons Empresa Nacional de Uranio S.A. (Government 100%)
Mines at Guargia, plant at Urgeirica
150
www.witpress.com, ISSN 1755-8336 (on-line) WIT Transactions on State of the Art in Science and Engineering, Vol 26, © 2006 WIT Press

242 DISPOSAL OF HAZARDOUS WASTE IN UNDERGROUND MINES
Figure A2.8: Active metallic mines in Portugal (based on the Geological and
Mining Institute of Portugal).
www.witpress.com, ISSN 1755-8336 (on-line) WIT Transactions on State of the Art in Science and Engineering, Vol 26, © 2006 WIT Press

APPENDIX TO CHAPTER 2 243
Portugal’s active industrial mineral mines in 1998 are shown in Fig. A2.9.
Figure A2.9: Active industrial mineral mines (based on the Geological and
Mining Institute of Portugal).
www.witpress.com, ISSN 1755-8336 (on-line) WIT Transactions on State of the Art in Science and Engineering, Vol 26, © 2006 WIT Press

244 DISPOSAL OF HAZARDOUS WASTE IN UNDERGROUND MINES
A2.11.2 Inactive mines
The location of some of the country’s inactive mines is presented in Fig. A2.10.
A2.12 Spain
A2.12.1 Active mines and mineral production
The mineral production of Spain, from 1996 to 1998, is shown in Table A2.30.
Figure A2.10: Inactive mines (based on the Geological and Mining Institute of
Portugal).
www.witpress.com, ISSN 1755-8336 (on-line) WIT Transactions on State of the Art in Science and Engineering, Vol 26, © 2006 WIT Press

APPENDIX TO CHAPTER 2 245
Table A2.30: Mineral production in Spain (based on the European Association of Mining Industries).
Production (103 tons unless otherwise specified)
Mineral 1996 1997 1998
Non-metallic minerals Fluorspar (CaF2) 117 120 124 Potash (K2O) 680 639 585 Salt 3,435 3,548 3,620 Quartz 1,438 1,460 1,480 Special clays 1,042 1,460 1,480 Magnesite (MgO) 200 171 170 Sodium sulphate (Na2SO4) 859 925 1,001 Celestite (SrSO4) 115 95 111 Washed kaolin 318 296 310 Feldspar 415 398 430 Calcium carbonate 1,650 1,750 1,880 Metallic minerals Iron 1,263 58 52 Pyrite 1,042 993 868 Copper (metal content) 38.4 38.4 37.2 Zinc (metal content) 145 147 128 Lead 24 23 19 Gold (kg) (metal content) 2,763 1,824 3,295 Silver (tons) (metal content) 103 66 25 Mercury (tons) (metal content) 861 389 672 Tin (tons) (metal content) 2 4 5 Energy minerals Anthracite 6,440 6,678 6,393 Coal 7,195 7,200 6,004 Black lignite 4,071 4,115 3,925 Brown lignite 9,585 8,462 9,750 Oil 513 380 535 Natural gas (million m2) 466 178 112 Uranium (tons U3O8) 346 350 351
In addition, active mines in Spain and their production for 1997 are shown in Table A2.31.
www.witpress.com, ISSN 1755-8336 (on-line) WIT Transactions on State of the Art in Science and Engineering, Vol 26, © 2006 WIT Press
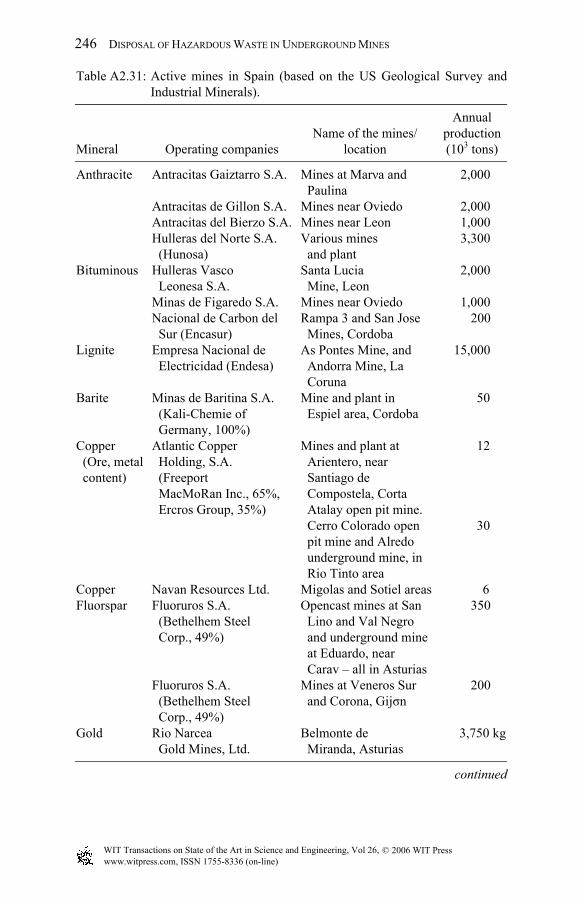
246 DISPOSAL OF HAZARDOUS WASTE IN UNDERGROUND MINES
Table A2.31: Active mines in Spain (based on the US Geological Survey and Industrial Minerals).
Mineral Operating companies Name of the mines/
location
Annual production (103 tons)
Antracitas Gaiztarro S.A. Mines at Marνa and Paulina
2,000
Antracitas de Gillon S.A. Mines near Oviedo 2,000
Anthracite
Antracitas del Bierzo S.A. Mines near Leon 1,000 Hulleras del Norte S.A.
(Hunosa) Various mines
and plant 3,300
Bituminous Hulleras Vasco Leonesa S.A.
Santa Lucia Mine, Leon
2,000
Minas de Figaredo S.A. Mines near Oviedo 1,000 Nacional de Carbon del
Sur (Encasur) Rampa 3 and San Jose
Mines, Cordoba 200
Lignite Empresa Nacional de Electricidad (Endesa)
As Pontes Mine, and Andorra Mine, La Coruna
15,000
Barite Minas de Baritina S.A. (Kali-Chemie of Germany, 100%)
Mine and plant in Espiel area, Cordoba
50
Copper (Ore, metal content)
Atlantic Copper Holding, S.A. (Freeport MacMoRan Inc., 65%, Ercros Group, 35%)
Mines and plant at Arientero, near Santiago de Compostela, Corta Atalay open pit mine. Cerro Colorado open pit mine and Alredo underground mine, in Rio Tinto area
12
30
Copper Navan Resources Ltd. Migolas and Sotiel areas 6 Fluoruros S.A.
(Bethelhem Steel Corp., 49%)
Opencast mines at San Lino and Val Negro and underground mine at Eduardo, near Carav – all in Asturias
350 Fluorspar
Fluoruros S.A. (Bethelhem Steel Corp., 49%)
Mines at Veneros Sur and Corona, Gijσn
200
Gold Rio Narcea Gold Mines, Ltd.
Belmonte de Miranda, Asturias
3,750 kg
continued
www.witpress.com, ISSN 1755-8336 (on-line) WIT Transactions on State of the Art in Science and Engineering, Vol 26, © 2006 WIT Press

APPENDIX TO CHAPTER 2 247
Table A2.31: Continued.
Mineral Operating companies Name of the mines/
location
Annual production (103 tons)
Compania Andaluza de Minas S.A. (Mokta, 62%)
Mine at Alquife, Granada
4,000
Altos Hornos de Vizcaya S.A. (U.S. Steel, 25%)
Nine mines in Province of Vizcaya
4,000
Compania Minera Siderugica de Ponferrada S.A.
Eight mines in Province of Leon
3,000
Iron ore
Minera del Andevalo S.A.
Opencast mine at Coba, Huelba
2,000
Sociedad Minera y Metalurgica de Penarroya Espana S.A. (Penarroya, France 90%)
Opencast mine at Montos de Los Azules, near Union Murcia
25
Exploracion Minera International Espana S.A. (EXMINESA)
Underground mine at Rubiales, Lugo
16
Lead ore
Boliden Apirsa SL Opencast mine Los Frailes, near Seville
48
Magnesitas de Rubian S.A.
Mines and plant near Sarria, south of Lugo
220 Magnesite
Magnesitas Navarras S.A.
Mine in Eugui, Navarra
400
Mercury Minas de Almaden y Arrayanes S.A., (Government, 100%)
Mine and smelter at Almaden
70,000 flasks
Potasas de Navarra S.A. Mines and plant near Pamplona
300
Iberpotasas S.A. Underground mine at Suria
656
Potash, ore
Union Explosivos Rio Tinto S.A.
Mines at Balsareny/ Sallent and Cardona
2,000
Compania Espanola de Mines de Tharsis
Mines at Tharsis and Zarza, near Seville
1,300 Pyrite
Rio Tinto Minera S.A. Unνon Explosivos (Rio Tinto, 75%; Rio Tinto Zinc, 25%)
Mines and plant at Rio Tinto, near Seville
900
continued
www.witpress.com, ISSN 1755-8336 (on-line) WIT Transactions on State of the Art in Science and Engineering, Vol 26, © 2006 WIT Press

248 DISPOSAL OF HAZARDOUS WASTE IN UNDERGROUND MINES
Table A2.31: Continued.
Mineral Operating companies Name of the mines/
location
Annual production (103 tons)
Tolsa S.A. Mine and plant at Vicalvaro, near Toledo
100 Sepiolite
Silicatos-Anglo- Ingleses S.A.
Mine and plant at Villecas near Madrid
200
Uranium, U3O8
Empresa Nacional del Uranio (Enusa), (Government,100%)
Mines and plant near Ciudad Real
Metric tons
Asturiana de Zinc S.A. (Azsa)
Reocin mines and plants near Torrelavega, Santander
500
Boliden Apirsa SL Opencast mine Los Frailes, near Seville
125
Exploracion Minera International Espana S.A. (EXMINESA)
Underground mine at Rubiales, Lugo
500
Zinc Ore
Sociedad Minera y Metalurgica de Penarroya-Espana S.A.
Mines and plants at Montos de los Azules y Sierra de Lujar, San Agustin
200
A2.12.2 Inactive mines
No specific information could be retrieved on inactive mines of the country, except those presented in Table A2.32.
www.witpress.com, ISSN 1755-8336 (on-line) WIT Transactions on State of the Art in Science and Engineering, Vol 26, © 2006 WIT Press

APPENDIX TO CHAPTER 2 249
Figure A2.11: Locations of major mining sites and most dangerous tailing ponds
in Spain. Key to mines: (1) Los Frailes, (2) Aznalcollar, (3) Tharsis,(4) Sotiel Coronada, (5) Rio Tinto, (6) A Coruρa, (7) Belmonte deMiranda, (8) San Juan de Nieva, (9) Mutiloa, (10) Almonaster LaReal, (11) Filon sur, (12) Castuera, (13) Rielves, (14) Morille, (15)Xinzo de Limia, (16) Catoira, (17) So-brado, (18) Toreno, (19)Soto y Amio, (20) Carrocera, (21) Avilιz, (22) Guardo, (23) Muda,(24) Camaleρo, (25) Udias, (26) Suances, (27) Camargo, (28)Maestu, (29) Miranda de Ebro, (30) Valle de Oca, (31) Ibeas deJuarros, (32) Alfaro, (33) Qiarzun, (34) Vilaller, (35) Osor, (36)Bellmunt, (37) Onteniente, (38) Cartegena, (39) Mazar-ron, (40)Cuevad de Almanzora, (41) Nνjar, (42) Almocita, (43) Berja, (44)La Caro-lina, (45) Alcarecejos, (46) Mestanza, (47) Villamayor deCalatrava, (48) Abenojar, (49) Marbella.
www.witpress.com, ISSN 1755-8336 (on-line) WIT Transactions on State of the Art in Science and Engineering, Vol 26, © 2006 WIT Press

250 DISPOSAL OF HAZARDOUS WASTE IN UNDERGROUND MINES
Table A2.32: Inactive mines in Spain.
Name Mineral exploited Location Owner
Dates of operation
Pb-Zn Underground operation at Reocin
Asturiana de Zinc S.A. (Azsa)
Production is expected to cease in 2003
Troya Pb-Zn The Basque Country, Northern Spain
Exminesa (Exploración Minera Internacional España S.A.)
Fluorspar Villabona, near Gijon
Closed in 1992
Aznalcollar Pb-Zn Open pit mine at Seville
Boliden Apirsa SL
Operation terminated in 1996
Lieres* Coal Nalon, Asturias Closed in 1999 Mosquitera* Coal Nalon, Asturias San Vicente* Coal Nalon, Asturias Entrego* Coal Nalon, Asturias San Mames,
Cerezal* Coal Nalon, Asturias
Olloniego* Coal Caudal, Asturias Barredo* Coal Caudal, Asturias Polio* Coal Caudal, Asturias San Victor* Coal Caudal, Asturias Santa Barbara* Coal Caudal, Asturias Entrago* Coal Near Oviedo,
Asturias Closed in the
1990s Herrera Coal Sabero, Asturias
*It cannot be specified whether they are open-pit or underground mines due to lack of information.
A2.13 Sweden
A2.13.1 Active mines and mineral production
Figure A2.12 shows the location of active mines in Sweden and Table A2.33 shows mineral production in Sweden for years 1996–1998.
www.witpress.com, ISSN 1755-8336 (on-line) WIT Transactions on State of the Art in Science and Engineering, Vol 26, © 2006 WIT Press

APPENDIX TO CHAPTER 2 251
Name of deposit Operator MetalProduction (103
tons/year) Type
1. Kiruna LKAB Fe 20,000 U2. Pahtohavare (RC) Viscaria AB Cu, Au 290 U3. Viscaria (RC) Viscaria AB Cu 600 U4. Malmberget Viscaria AB Fe 12,000 U5. Aitik Boliden AB Cu, (Au) 18,000 O6. Laisvall Boliden AB Pb, (Zn) 1,950 U7. Kristineberg Boliden AB Cu, Zn, Pb, Au, Ag 560 U8. Kedtrask (IM) Boliden AB Zn 130 O9. Petiknas Boliden AB 440 U10. Renstrom Boliden AB 174 U11. Kankberg (IM) Boliden AB
Cu, Zn, Pb, Au, Ag113 U
12. ?kulla Ostra (RC) Boliden AB Au, Cu, Ag 130 O13. Langdal (RC) Boliden AB Cu, Zn, Pb, Au, Ag 229 O
14. Bjorkdal (RC)Williams
Resources Inc.Au 1,000 O
15.Akerberg (IM) Boliden AB Au 160 U16. Garpenberg Boliden AB Cu, Zn, Pb 930 U
17.Zinkgruvan North Ltd. Zn, Pb, Ag 690 U
RC, recently closed; IM, intermittently mined; O, open-pit; U, underground. Figure A2.12: Active mines in Sweden (based on the Geological Survey of
Sweden).
www.witpress.com, ISSN 1755-8336 (on-line) WIT Transactions on State of the Art in Science and Engineering, Vol 26, © 2006 WIT Press

252 DISPOSAL OF HAZARDOUS WASTE IN UNDERGROUND MINES
Production of Swedish industrial minerals in 1997 is shown in Table A2.34 while major industrial mineral mines are shown in Table A2.35.
Table A2.33: Production of minerals in Sweden (based on European Association of Mining Industries).
Production (103 tons unless otherwise specified)
Mineral 1996 1997 1998
Iron ore products 21,228 21,893 20,930 Processed sulphide ores 24,902 23,895 24,182 Copper concentrate 269 315 270 Lead concentrate 136 146 155 Zinc concentrate 292 284 297 Gold in concentrate (tons) 6.1 6.7 5.9
Table A2.34: Production of Swedish industrial minerals in1997 (based on Industrial Minerals).
Mineral Production (103 tons)
Dolomite, limestone, lime 8,000 Silica sand, quartz 375 Quartzite 260 Clays 200 Diabase 115 Olivine 100 Feldspar, talc, graphite, etc. 80
Table A2.35: Major industrial mineral mines (based on the US Geological
Survey and Industrial Minerals).
Mineral Major operating companies
and major equity owners Location of main
facilities
Annual capacity
(103 tons)
Feldspar Berglings Malm & Mineral AB (Omya GmbH)
Mines at Beckegruvan, Hojderna, and Limbergsbo
50
Feldspar Forshammar Mineral AB (Cape Minerals AS)
Mines at Limberget and Riddarhyttan
30
Feldspar Larsbo Kalk AB (Pluess-Staufer AB)
Mines at Glanshamar and Larsbo
20
Graphite Woxna Graphite AB (Tricorona Mineral AB, 100%)
Mine and plant at Kringeltjärn, Woxna
20
continued
www.witpress.com, ISSN 1755-8336 (on-line) WIT Transactions on State of the Art in Science and Engineering, Vol 26, © 2006 WIT Press

APPENDIX TO CHAPTER 2 253
Table A2.35: Continued.
Mineral Major operating companies
and major equity owners Location of main
facilities
Annual capacity
(103 tons)
Kyanite Svenska Kyanite AB (Svenska Mineral, 100%)
Quarry at Halskoberg
10
Limestone Kalproduktion Storugns AB (Nordkalk AB, 100%)
Mines at Gotland Island
3,000
Marble (m3) Borghamnsten AB Quarry at Askersund 15,000
A2.13.2 Inactive mines
According to the Swedish authorities on underground exploitation, the total number of abandoned mines is 25 in Northern Sweden and 775 in central and Southern Sweden. The location of some inactive underground mines is shown in Fig. A2.13. Additional information about many of them can be found in Table A2.36.
Table A2.36: Inactive underground mines in Sweden.
Name Mineral
exploited Location Owner Dates of operation
Stripa Fe Stripa Stripa Mine Service AB
15th century–1977?
Viscaria Cu Viscaria AB Recently closed Langdal Au, Zn, Cu Boliden AB Recently closed Pahtohavare Cu, Au Viscaria AB Recently closed Grangesberg Fe Closed 1989 Dannemora Fe 13th century–closed
1992 Lainejaur Ni 12 km North
of Mala 1941–1945
Enasen Gavleborg Luossavaara Fe LKAB Tuollavaara LKAB Svappavaara Fe LKAB Adak Cu Adak Swedish
Government 1933–1998?
Laver Cu Norrbotten Boliden AB 1936–1946 Rakkejaur Zn, Au, Ag Closed 1988
continued
www.witpress.com, ISSN 1755-8336 (on-line) WIT Transactions on State of the Art in Science and Engineering, Vol 26, © 2006 WIT Press

254 DISPOSAL OF HAZARDOUS WASTE IN UNDERGROUND MINES
Table A2.36: Continued.
Name Mineral
exploited Location Owner Dates of operation
Åkerberg Au 1989–(temporarily closed 1999)
Rävliden Zn, Cu, Pb, Au Closed 1991 Udden Zn, Cu, Pb, Au Closed 1990 Boliden Au, Cu, Zn,
Pb, Ag Closed 1967
Långsele Zn, Cu, Pb, Au Closed 1991 Långdal Zn, Pb, Au, Ag 1967–recently
closed Kedträsk Zn Intermittently mined
1998 Åkulla Östra Cu, Au, Ag 1997–recently
closed Falun Cu, Zn, Pb, Au Closed 1992 Stekenjokk Zn, Cu, Pb Closed 1988 Sala Pb, Zn, Ag Closed 1962
Other inactive mines with no additional information available are:
Northern district: Brännmyra, Rutjebäcken, Näsliden, Holmtjärn, Kimheden, Hornträskviken, Rävliden, Rävlidmyran, Kankberg, Åkulla västra, Åsen, Östra Högkulla.
Southern district: Smålands Taberg (iron), Hohults Mangangruva (manganese), Jakobsbergs Mangangruva (manganese), Kleva Nickelgruva (nickel), Ädelfors Guldgruva (gold), Sunnerskogs Koppargruva (copper), Rolfsby Stora Mangangruva (manganese), Gustavs Mangangruva (manganese), Storgruvan, Vretgruvan (manganese), Hedvigs Zink och Blygruva (zinc, lead), De Beschiska Koppargruvan (copper), Börgeltorps zinkgruva (zinc), Skälö Koppargruva (copper), Bjuvs Stenkolsgruva (coal, clay), Onslunda Gruvor (calcium fluoride), Långbans Gruvor (sulpide minerals), Getö Stora Silvergruva (silver), Hällefors Östra Silver-gruva (silver), Åmmebergs Zinkgruvor (zinc), Stråssa gruvfält (iron, sulphide miner-als?), Ljusnarsbergsfältet (iron, sulphide minerals?), Stripås Koppargruva (copper), Storgruvan (sulphide minerals?), Falu Koppargruva (copper, silver), Sågmyra Koppargruva (copper), Storgruvan i Furboberget (iron?), Garpenbergs Odalfält (iron).
www.witpress.com, ISSN 1755-8336 (on-line) WIT Transactions on State of the Art in Science and Engineering, Vol 26, © 2006 WIT Press

APPENDIX TO CHAPTER 2 255
Norrbotten:Vi= Viscaria, Li= Liikavaara, Lav= Laver
Skellefte Field:Ad= Adak, Ra= Rakkejaur, Å=Åkerberg, Rä= Rävliden, U= Udden, Bo= Boliden, Ls= Långsele, Ld= Långdal
Bergslagen:F = Falun, Gr= Grängesberg, Sal= Sala
Other areas:Ste= Stekenjokk, E = Enåsen
Figure A2.13: Location of inactive underground mines in Sweden (based on CM
Tracing).
www.witpress.com, ISSN 1755-8336 (on-line) WIT Transactions on State of the Art in Science and Engineering, Vol 26, © 2006 WIT Press

256 DISPOSAL OF HAZARDOUS WASTE IN UNDERGROUND MINES
A2.14 The Netherlands
A2.14.1 Active mines and mineral production
The Netherlands has no commercially exploitable reserves of metal ores. The only active mines that exist in the country extract industrial minerals. Active mines in the Netherlands and their annual production for 1998 are shown in Table A2.37.
Table A2.37: Mines in the Netherlands (based on the US Geological Survey).
Mineral Operating companies Name of the mines/location
Annual production (103 tons)
Limestone Ankerpoort NV (Lhoist SA, 100%)
Mines at Maastricht and Winterswijk 600
Salt Akzo Salt and Basic Chemicals BV Mines at Hengelo 2,000
Salt Akzo Salt and Basic Chemicals BV Mines at Delfzijl 2,000
A2.14.2 Inactive mines
No specific information could be retrieved on inactive mines of the country.
A2.15 The United Kingdom
A2.15.1 Active mines and mineral production
Major mineral production in UK for the years 1996–1998 is shown in Table A2.38.
Table A2.38: Major mineral production in the UK (based on the European Association of Mining Industries).
Production (103 tons unless otherwise specified)
Mineral 1996 1997 1998
Coal 50,196 48,495 41,276 Natural gas (oil equivalent) 84,618 86,350 90,467 Crude petroleum (including
condensates) 130,007 128,205 132,602
Tin/lead/zinc/iron 5.1 5.2 3.2 China/ball clay (sales) 3,161 3,216 3,364 Other clays and shale 12,483 11,795 12,394
continued
www.witpress.com, ISSN 1755-8336 (on-line) WIT Transactions on State of the Art in Science and Engineering, Vol 26, © 2006 WIT Press

APPENDIX TO CHAPTER 2 257
Table A2.38: Continued.
Production (103 tons unless otherwise specified)
Mineral 1996 1997 1998
Limestone and dolomite 103,119 105,034 106,000 Chalk (GB only) 9,239 9,550 9,500 Sandstone 17,522 18,499 18,700 Silica sand 4,861 4,704 4,600 Sand/gravel (land/marine) 96,377 98,383 100,000 Igneous rock 50,903 48,771 49,000 Gypsum 2,000 2,000 2,000 Rock salt 2,200 1,800 700 Brine salt 4,812 4,861 4,800 Fluorspar 65 64 63 Barytes 93 74 68 Potash (KCl) 1,030 941 1,014
In addition, active mines, their owners and annual production for 1998 are
shown in Table A2.39.
Table A2.39: Active mines (based on the US Geological Survey).
Mineral
Major operating companies and major
equity owners Location of main
facilities
Annual capacity
(103 tons)
Aggregate ARC Ltd. (Hanson Plc., 100%) Foster Yoeman Ltd.
50 quarries in various locations Glensanda quarry at Oban
50,000
15,000
Ball clay Watts, Blake, Bearne & Co. Plc.
Various operations in northern and southern Devon
500
China clay (kaolin)
ECC Group Plc. Mines and plants in Devonshire and Dorsetshire
3,000
Coal RJB Mining Plc. 19 mines in various locations
40,000
Fluorspar Durham Industrial Minerals Ltd.
Mines in Weardale 50
Fluorspar Laporte Industries Plc. Mill at Stoney Middleton, Mines in Derbyshire
70
Gypsum British Gypsum Ltd. Mines in Cumbria, Nottinghamshire, and Sussex
3,500
continued
www.witpress.com, ISSN 1755-8336 (on-line) WIT Transactions on State of the Art in Science and Engineering, Vol 26, © 2006 WIT Press

258 DISPOSAL OF HAZARDOUS WASTE IN UNDERGROUND MINES
A2.15.2 Inactive mines
Some inactive underground mines in the UK are presented in Table A2.40.
Table A2.39: Continued.
Mineral
Major operating companies and major
equity owners Location of main
facilities
Annual capacity
(103 tons)
Potash Cleveland Potash Ltd. Boulby Mine, Yorkshire 500 Salt, rock Imperial Chemical
Industries Plc. Mines at Winsford,
Cheshire 3,000
Salt, rock Irish Salt Mining and Exploration Co.
Carrick Fergus, Northern Ireland
300
Sand and gravel
TMC Pioneer Aggregates Ltd.
Chelmsford, Essex 1,000,000
Silica, sand Hepworth Minerals and Chemicals Ltd.
Operations in Cambridgeshire, Cheshire Humberside, and Norfolk
6,000
Slate, natural Alfred McAlpine Slate Ltd.
Penrhyn quarry, Bethesda, North Wales
25
Talc Alex Sandison and Son Ltd.
Unst, Shetland Islands 15
Talc Shetland Talc Ltd. (Anglo European Minerals Ltd., 50%; Dalriada Mineral Ventures Ltd. 50%)
Cunningsburg, Shetland Islands
35
Tin, ore Crew Group of Canada South Crofty Mine, Cornwall (Closed March 1998)
1,800
Table A2.40: Inactive underground mines in the UK.
Name Location Mineral exploited Dates of operation
Annesley-Bentinck Near Kirkby, Nottinghamshire
Coal Closed in 2000
Silverdale (deep mine) Staffordshire Coal Closed in 1998 South Crofty Redruth, Cornwall Tin Closed in 1998 Frazers Hush Rookhope/North
Pennine Fluorspar Closed in 1998–1999
Groverake Rookhope/North Pennine
Fluorspar Closed in 1998–1999
www.witpress.com, ISSN 1755-8336 (on-line) WIT Transactions on State of the Art in Science and Engineering, Vol 26, © 2006 WIT Press