Embed Size (px)
Citation preview

16
CHAPTER 2
PROPOSED METHOD FOR ELECTROGASTROGRAM
ACQUISITION
2.1 INTRODUCTION
Most of the people around the world face the problems related to
health especially due to the food intake and disorders in the digestive system.
Nowadays Endoscope procedure is followed to investigate the problems in the
digestive system disorders, which is a tedious, expensive and invasive
method. A non-invasive, low cost and painless method called
Electrogastrogram (EGG) has been devised for the detection of electrical
signal cutaneously from the stomach and it is an initial mode of investigation
for gastric disorders before encouraging the Endoscope procedure for
uncomplicated gastric disease and benign tumors. Due to its non-invasive
nature and recent advances in techniques of EGG recording and computerized
analysis, EGG has become an attractive tool among the researchers to study
the electrophysiology of the stomach and pathophysiology of gastric motility
disorders and is currently utilized in both research and clinical settings.
Unlike ECG, EEG, EMG, Electrogastrogram signal is not available
in any of the databases. The aim of this research is to design a methodology to
acquire good quality of noise free EGG signal, low cost, less complexity in
acquisition for any subject with or without symptoms for the preliminary
investigation of digestive system disorders before the invasive procedure is
novel research challenge. This chapter discusses the different methods

17
developed in this thesis to acquire the EGG signal efficiently, selection of electrodes, positioning of electrodes cutaneously and recording procedure.
2.2 LITERATURE REVIEW
Walter Alvarez (1920), a gastroenterologist first performed and
reported about Electrogastrography and in 1921, recorded the first human
EGG by placing two electrodes on the abdominal surface of ‘‘a little old
woman’’ and connected them to a sensitive string galvanometer. A sinusoid-
like EGG with a frequency of 3 cycles/min (cpm) was then recorded.
Harrison Tumpeer (1926), a pediatrician is the second investigator to discover
the EGG. He used limb leads to record the EGG from a 5 week old child who
was suffering from pyloric stenosis and observed the EGG as looking like an
ECG (electrocardiogram) with a slowly changing baseline.
Davis (1957), a psychophysiologist published two papers on the
validation of the EGG using simultaneous recordings from needle electrodes
and a swallowed balloon. Although Davis made only slow progress in EGG
research, his two papers had stimulated several other investigators to begin
doing EGG research. Stern (2000), started to work in Davis’ lab to do a
research in EGG. Stevens and Worrall (1974) were probably the first ones
who applied the spectral analysis technique to EGG and then analyzed EGG
data using Fourier transform. Brown et al (1975) mentioned that if recording
was started within an hour of attaching electrodes there was often a large
amount of electrode noise and respiratory artifact is observed. Smout et al (1980)
showed that the amplitude of the EGG increases when contractions occur.
Koch et al (1985) reported their study on simultaneous recordings
of the EGG and fluoroscopy. They repeatedly observed the correspondence
between EGG waves and antral contractions during simultaneous EGG-
fluoroscopy recordings. To extract information about both the frequency of

18
EGG and time variations of the frequency, a running spectral analysis method
using FFT was introduced by van der Schee and Grashus (1987). Waldhausen
et al (1990) studied adout the gastrointestinal myoelectric and clinical pattern
recovery after aparotomy
Chen et al. (1989) developed a modern spectral analysis technique
based on an adaptive autoregressive moving average model. This method
yields higher frequency resolution and more precise information about the
frequency variations of the gastric electrical activity. It is especially useful in
detecting dysrhythmic events of the gastric electrical activity with short
durations. Sobakin et al (1962) performed the EGG in 164 patients and
61 healthy controls and reported that ulcers caused no change in the EGG, but
that pyloric stenosis produced a doubling of amplitude, and stomach cancer
caused a breakup of the normal 3 cpm rhythm. This was probably the first
large-scale clinical use of the EGG.
In the past two decades, numerous studies have been reported on
the clinical use of the EGG including understanding the relationship between
the EGG and gastric motility, gastric myoelectrical activity in pregnant
women, gastric myoelectrical activity in diabetics or gastroparetic patients,
gastric myoelectrical activity in patients with dyspepsia and prediction of
delayed gastric emptying using the EGG. Stern (2000) wrote “the history of
EGG can be described as three beginnings, a length period of incubation, and
a recent explosion”.
Zhishun Wang and Chen (2001) identified that myoelectrical
recording of gut contains slow rhythmicity and fast rhythmicity (spikes). They
said that conventional method is not accurate in the separation of the slow
wave and the spikes. They introduced a novel and fast blind source separation
(BSS) algorithm to extract spike activities from the myoelectrical recordings

19
obtained in dogs and it is not affected by the high frequency components of
the slow wave. The independent component analysis (ICA) is performed
using fourth order statistic movements (Kurtosis). They observed that the
detection of gastrointestinal motility is important and clinical
gastroenterology and gastroenterological research. They also said that motility
parameters are useful in the identification of gastrointestinal motility patterns.
Anna Kascika- Jonderko et al (2006) carried out a study on
conductive area size of recording electrodes affecting the quality of a
multichannel electrogastrogram and they found that type 2222 yields a stable
between electrode- electrical conductivity throughout the examination and
type 2660 (Ag/Agcl) is recommended because it offers a good performance in
EGG acquiring and it is not require any supplementation with a conductive
gel. They found single channel is a classical one and they declared that huge
research work still has to be performed to overcome it. For analysis of EGG
signal they applied three algorithms namely – A running spectrum analysis,
overall spectrum analysis, cross channel analysis for both preprandial and
postprandial condition. The authors found that 2-2.5 cm2 conductive areas is
sufficient to obtain an accurate result with good quality of electrodes, careful
observation is done in the procedure of skin preparation. They also declared
that current system of bioelectrical signal acquisition, conditioning and
analysis are to be perfect to avoid noisy source of a weak electrical signal
across the abdominal wall from the stomach to the abdominal surface. Jung
(2006) designed and implemented telemetry capsule for measuring EGG. Jin
et al (2007) reported EGG is useful for evaluating the effect of illumination
and taste stimulation.
Krusiec and jonderko (2008) checked reproducibility of parameters
of multichannel electrogastrogram in subjects for different condition

20
comprising of normal subjects and abnormal subjects. They found that
reproducibility of multichannel electrogastrographic parameters did not suffer
between normal and abnormal subjects. Also they observed that gender; test
meals did not affect the reproducibility and Medium Term Reproducibility
(MTR) worse than the Short Term Reproducibility (STR). From the finding
the average percentage of slow wave coupling (APSWC) provides a good
reproducibility for clinical application than Maximum Dominant Frequency
Difference (MDFD) and Spatial Dominant Power Difference (SDPD). They
conducted this study according to Helsinki declaration. The acquisition is
performed either with a pair of active electrode with reference electrode or
pair of active electrode with ground electrode. They analyze the EEG by
applying three algorithms used by Anna Kascika- Jonderko et al 2006.
Jang et al (2009) said that cutaneous electrogastrogram recording
suits for non invasive gastrointestinal diagnosis. They developed a portable
EEG recording system with voice recording devices with low supply voltages,
low power consumption, and software demodulation to simplify the
complexity of the system. It is small in size, compact and suitable for long
term portable recording.
Contreras et al (2010) recorded EGG signals with three pair of
electrodes cutaneously with cut off frequency of 1 Hz for low pass filter and
acquired with a sampling frequency of 10Hz. They analyzed the EGG signals
online and also they said that signal can also be reanalyzed offline for
generating EGG database with latest windows 2000/XP and vista. They
classified the signals in four possible conditions based on the frequency as
tachygastria, bradygastria, arrhythmic and typical conditions using spectrum
value and percentage of each pacemaker frequency. The authors declared that
there is no public database of EGG in different conditions. Also they said that
using the relevance of this work a database can be created and new parameters
can also be studied. They also mentioned that EGG characteristics (or)

21
electrical parameters obtained from it for the dysfunction in electromechanical
functions of the stomach by introducing a non invasive technique which is
accepted in the diagnostic clinic in mexico.
2.3 ELECTROGASTROGRAM
EGG is a non-invasive method for the recording of gastric
myoelectrical activity that controls gastric motility. Although the first
measurement of the EGG was reported 90 years ago (Walter Alvarez 1921),
the progress in this field has been very slow, especially compared with other
cutaneous electrophysiological measurements, such us the Electrocardiography
(ECG) because of its difficulty in data acquisition, lack of understanding,etc.
Due to the advancement in quantitative analysis of EGG, more and more
physicians and biomedical researchers have been interested in this field.
Abnormality in EGG arises due to recurrent nausea, vomiting, dyspepsia,
stomach ulcer, cyclic vomiting syndrome, etc which signals that the stomach
is not emptying food normally. If the EGG is abnormal, it confirms that the
problem probably is with the stomach’s muscles or the nerves that control the
muscles (Chen and Mccallum 1991) .
EGG is similar to an electrocardiogram of the heart. It is the
recording of the electrical signals that travel through the muscles of the
stomach and control the muscle’s contraction. EGG used when there is a
suspicion that the muscles of the stomach or the nerves controlling the
muscles are not working normally. Recording is done by placing the electrode
cutaneously over the stomach and the electrical signals from the stomach’s
muscles are sensed by the electrode and recorded on a computer for analysis.
In normal individuals, EGG is a regular electrical rhythm generated by the
muscles of the stomach and the power (voltage) of the electrical current
increases after the meal. In patients with abnormalities of the muscles or
nerves of the stomach, the rhythm often is irregular or there is no post-meal

22
increase in electric power (Chen et al 1999). EGG does not have any side
effects and it is a painless study. The normal EGG frequency is found to be
approximately 3 cycles per minute.
2.3.1 Measurement of Electrogastrogram
The stomach Gastric Myoelectrical Activity (GMA) can be
measured serosally, intraluminally, or cutaneously. The serosal recording can
be obtained by placing electrodes on the serosal surface of the stomach
surgically. The intraluminal recording can be acquired by incubating a
catheter with recording electrodes into the stomach. Suction is usually applied
to assure a good contact between the electrodes and the stomach mucosal
wall. The serosal and intraluminal electrodes can record both slow waves and
spikes, since these recordings represent myoelectrical activity of a small
number of smooth muscle cells. These methods are invasive and their
applications are limited in animals and laboratory settings. EGG, a cutaneous
measurement of GMA using surface electrodes, is widely used in humans and
clinical settings, since it is non-invasive and does not disturb the ongoing
activity of the stomach (Chen and Mccallum 1991). A number of validation
studies have documented the accuracy of the EGG by comparing it with the
recording obtained from mucosal and serosal electrodes (Hamilton et al
1986). Reproducibility of the EGG recording has been demonstrated, with no
significant day-to-day variations. In adults, age and gender do not seem to
have any influence on the EGG. In this thesis, recording is performed non-invasively using surface electrodes.
2.4 ANATOMY OF THE STOMACH
The main function of the stomach is to process and transport food.
After feeding, the contractile activity of the stomach helps to mix, grind and
eventually evacuate small portions of chyme into the small bowel, while the
rest of the chyme is mixed and ground. Anatomically, the stomach can be
23
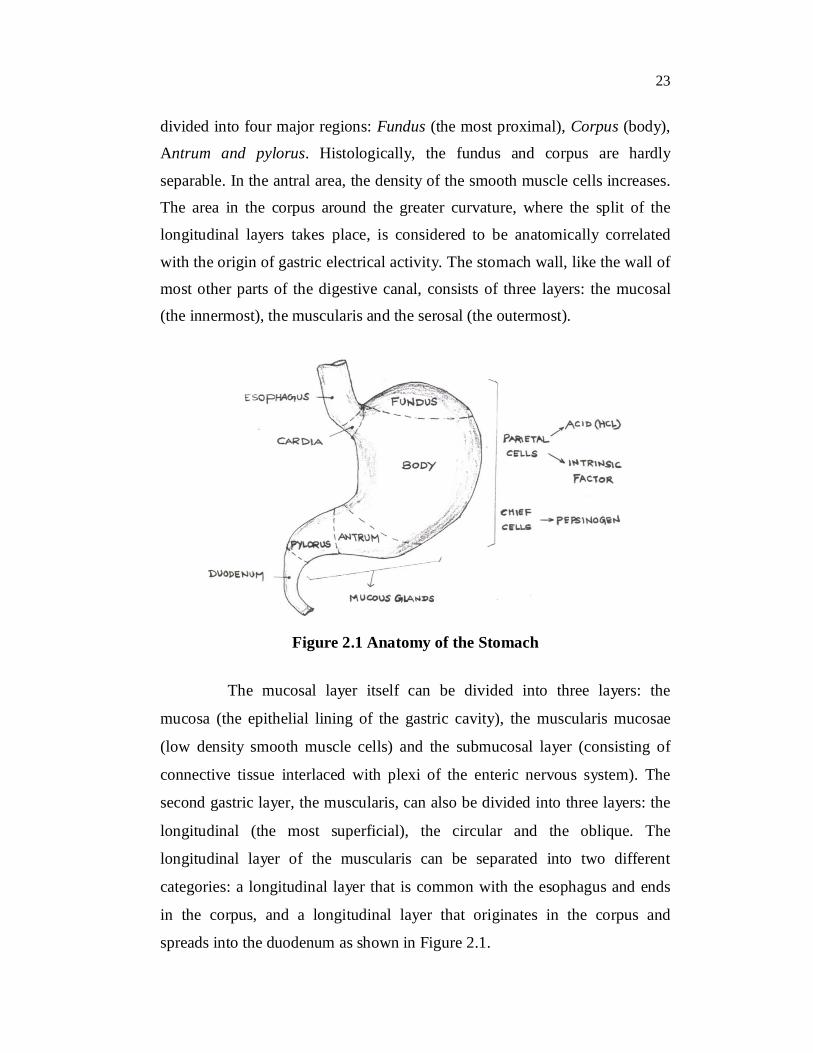
divided into four major regions: Fundus (the most proximal), Corpus (body),
Antrum and pylorus. Histologically, the fundus and corpus are hardly
separable. In the antral area, the density of the smooth muscle cells increases.
The area in the corpus around the greater curvature, where the split of the
longitudinal layers takes place, is considered to be anatomically correlated
with the origin of gastric electrical activity. The stomach wall, like the wall of
most other parts of the digestive canal, consists of three layers: the mucosal
(the innermost), the muscularis and the serosal (the outermost).
Figure 2.1 Anatomy of the Stomach
The mucosal layer itself can be divided into three layers: the
mucosa (the epithelial lining of the gastric cavity), the muscularis mucosae
(low density smooth muscle cells) and the submucosal layer (consisting of
connective tissue interlaced with plexi of the enteric nervous system). The
second gastric layer, the muscularis, can also be divided into three layers: the
longitudinal (the most superficial), the circular and the oblique. The
longitudinal layer of the muscularis can be separated into two different
categories: a longitudinal layer that is common with the esophagus and ends
in the corpus, and a longitudinal layer that originates in the corpus and
spreads into the duodenum as shown in Figure 2.1.

24
2.4.1 Normal Gastric Myoelectrical Activity
Myoelectrical activity is originated along the gastrointestinal tract.
In vitro studies using smooth muscle strips of the stomach have revealed
independent GMA from different regions of the stomach (Smout et al 1980).
The highest frequency of the gastric myoelectrical activity was recorded in the
corpus and the lowest frequency in distal antrum. However, in vivo studies
demonstrated a uniform frequency in the entire stomach under healthy
conditions, because the myoelectrical activity in the corpus with the highest
frequency drives or paces the rest of stomach into the same higher frequency.
GMA is composed of slow waves and spike potentials. The slow wave is also
called the pacesetter potential, or electrical control activity. The spike
potentials are also called action potentials or electrical response activity.
While slow waves originated from the smooth muscles, in vitro
electrophysiological studies suggest that Interstitial Cells of Cajal (ICC) are
responsible for the generation and propagation of the slow wave (Sanders,
1996).
Frequency of normal slow waves is species-dependent,
approximately 3 cpm in humans and 5 cpm in dogs, with little day-to-day
variations. The slow wave is known to determine the maximum frequency and
propagation of gastric contractions. Figure 2.2 presents an example of normal
gastric slow waves measured from a patient. Normal 3 cpm distally
propagated slow waves are observed. Spike potentials are known to be
directly associated with gastric contractions, that is, gastric contractions occur
when the slow wave is superimposed with spike potentials (Chen et al 1993).
In the stomach, it is not uncommon to record gastric contractions with an
absence of spike potentials in the electrical recording. Some other forms of
superimposed activity are also seen in the electrical recording in the presence
of gastric contractions (Chen J et al 1994).

25
2.5 EGG SIGNALS
EGG signal for the normal activity is defined as an electrical signal
at a frequency of 3 cpm and it is shown in Figure 2.2.
0 10 20 30 40 50 60-1.5
-1
-0.5
0
0.5
1
1.5
Time (sec)
Am
plitu
de in
mV
Figure 2.2 EGG of Normal Subjects
Digestive System disorders namely bradygastria, dyspepsia, nausea,
tachygastria, ulcer and vomiting are considered for the analysis in this
investigation. Brief detail of the above mentioned disorders is presented below.
2.5.1 Bradygastria
Bradygastria is defined as a decreased rate of electrical pacemaker
activity in the stomach which is less than 2 cpm for at least 1 minute. The
EGG pattern for bradygastria is shown in Figure 2.3. It may be associated
with nausea, gastroparesis, irritable bowel syndrome, and functional dyspepsia.
0 10 20 30 40 50 60-1.5
-1
-0.5
0
0.5
1
1.5
Time (sec)
Am
plitu
de in
m
V
Figure 2.3 EGG of Bradygastria

26
2.5.2 Dyspepsia
Dyspepsia (Indigestion) is a vague feeling of discomfort in the
upper belly or abdomen during or right after eating or it is also known as
upset stomach. This includes:
A feeling of heat, burning, or pain in the area between the
navel and the lower part of the breastbone.
A feeling of fullness that is bothersome and occurs soon after
the meal begins or when it is over.
It can be accompanied by bloating, belching, nausea, or heartburn.
Dyspepsia is a common problem, and is frequently due to Gastro Esophageal
Reflux Disease (GERD) or gastritis (Kenneth 1995 and Sha et al 2009), but
for some cases it may be the first symptom of peptic ulcer disease (an ulcer of
the stomach or duodenum) and occasionally cancer. Figure 2.4 is the EGG for
dyspepsia having a frequency of 4–5 cpm.
0 10 20 30 40 50 60-1
-0.5
0
0.5
1
Time (sec)
Am
plitu
de in
m
V
Figure 2.4 EGG of Dyspepsia Subject
2.5.3 Nausea
Nausea is defined as a sensation of unease and discomfort in the
upper stomach with an involuntary urge to vomit. It often, but not always,

27
precedes vomiting. A person can suffer nausea without vomiting. Some
common causes of nausea are motion sickness, dizziness, fainting,
gastroenteritis (stomach infection) or food poisoning. Nausea may also be
caused by stress, anxiety, disgust, worry and depression.
0 10 20 30 40 50 60-0.8
-0.6
-0.4
-0.2
0
0.2
0.4
0.6
0.8
Time (sec)
Am
plitu
de in
m
V
Figure 2.5 EGG of Nausea Subject
EGG pattern of Nausea having a frequency of 3.5–6 cpm is shown
in Figure 2.5.
2.5.4 Tachygastria
Tachygastria is defined as the increased rate of electrical activity in the stomach. A one minute recording having more than 4 cycles is shown in Figure 2.6. It is associated with nausea, gastroparesis, irritable bowel syndrome, and functional dyspepsia.
0 10 20 30 40 50 60-0.8
-0.6
-0.4
-0.2
0
0.2
0.4
0.6
0.8
Time (sec)
Am
plitu
de in
m
V
Figure 2.6 EGG of Tachygastria

28
2.5.5 Ulcer or Peptic Ulcer
Stomach ulcer or peptic ulcer is small erosion (hole) in the gastrointestinal tract. The most common type, duodenal, occurs in the first 12 inches of small intestine beyond the stomach. Ulcers of that form in the stomach are called gastric ulcers. An ulcer is not contagious or cancerous. Duodenal ulcers are almost always benign, while stomach ulcers may become malignant. A peptic ulcer is a sore in the lining of the stomach or the duodenum, the first part of the small intestine. Burning stomach pain is the most common symptom. The pain
May come and go for a few days or weeks.
May disturb one’s activity when the stomach is empty.
EGG pattern of Ulcer having frequency of 6-8.5 cpm is shown in Figure 2.7.
0 10 20 30 40 50 60-1
-0.5
0
0.5
1
Time (sec)
Am
plitu
de in
m
V
Figure 2.7 EGG of Ulcer Subject
2.5.6 Vomiting
Vomiting is the forceful expulsion of contents of the stomach and
often, the proximal small intestine. It is a manifestation of a large number of
conditions, many of which are not primary disorders of the gastrointestinal

29
tract. Regardless of the cause, vomiting can have serious consequences,
including acid-base derangements, volume and electrolyte depletion,
malnutrition and aspiration pneumonia.
Figure 2.8 shows the EGG recorded for a vomiting subject. The
frequency is observed to be 5.5-6.5 cpm.
0 10 20 30 40 50 60-1
-0.5
0
0.5
1
Time (sec)
Am
plitu
de in
mV
Figure 2.8 EGG of Vomiting Subject
2.6 MATERIALS AND METHODS
EGG data acquisition is done by conducting the study in
accordance with the Helsinki declaration (Krusiec and Jonderko 2008) by
explaining about the procedure to all subjects (normal and abnormal) under
the guidance and monitoring of reputed hospital gastroenterologist for their
acceptance to participate in this study. More than thousand EGG samples
which included patients and normal subjects in both male and female category
of different age groups participated ( Dirgenali et al 2006, Pfaffenbach et al
1995 and Parkman et al 1996)in this recording as shown in Table 2.1.
Electrogastrogram is recorded under preprandial (before food) and
postprandial (after food) condition with a minimum duration of half an hour.
The subjects are studied at gastroenterology department of a PSG Hospitals,
Coimbatore, MEDINDIA Hospitals, Coimbatore and at department of Biomedical

30
Engineering of Sri Ramakrishna Engineering College for which the certification is included in the Appendix I.
Table 2.1 Sex and Age Distribution of Normal Subjects and Patient Groups
EGG Mean Age (years) Male Female Normal 33 32 18
Bradygastria 28 27 23
Dyspepsia 38 29 21
Nausea 45 28 22
Tachygastria 36 26 24
Ulcer 34 31 19
Vomiting 35 19 31
2.6.1 EGG Electrodes
Electrodes are the sensors which tap the electrical signals from the
outer layer of the stomach. Surface electrodes like silver/silver chloride
(Ag/Agcl) shown in Figure 2.9 are used for this purpose which falls under the
type 2222(Anna Kascika- Jonderko et al 2006).
Figure 2.9 Ag/Agcl Electrodes for Recording EGG

31
It is available in two sizes, standard 20 mm and miniature 11 mm.
These electrodes provide stable recordings for various physiological
measurements including sleep recordings, exercise testing, pediatric
monitoring and the recording of low voltage DC and low frequencies like the
signals from the stomach. Surface electrodes are very popular because of their
small covering area and adhesive to provide highly accurate, optimal
recordings.
Demerits of Passive Electrodes(Ag/Agcl)
High skin contact impedance due to their irregular surfaces,
and consequently they introduce high frequency noise.
Introduce dc offset into front-end electronic sensing circuits
due to motion artifacts.
Gel or other adhesive materials need to be used.
Not reusable when used with an adhesive.
High impedance signals are susceptible to physical
movements and power line interference.
In addition to Ag/Agcl, active electrode shown in Figure 2.10 is
also tried out in this thesis to acquire the EGG signal cutaneously. The role of
the active electrode is to pick up a bio potential signal while transforming
high source impedance to low source impedance (Merritt et al 2008 and
Hagemann et al 1985). Due to the high source impedance the signal loses
energy and becomes weaker. The output impedance of the active electrode is
low and reduces the interference of the electrically and mechanically induced
noise. Thus interference due to 50 Hz supply harmonics and the
electromagnetic interference is reduced by using active electrode. Schematic
of the active electrode is shown in Figure 2.11. They are used to buffer the

32
signals and also provide impedance matching. Silver coins are placed on the
surface of the stomach to tap the signal. The active electrodes are well
protected within a shield to reduce electromagnetic interference.
Merits of Active Electrodes
Pick up a bio potential signal while transforming high source
impedance to low source impedance.
Buffer is used for impedance matching
No external signal interference
Reusable
Only drawback is a separate power supply requirement for the IC.
Figure 2.10 Active Electrodes for Recording EGG

33
Figure 2.11 Active Electrodes Schematic
For acquisition of EGG, the electrodes sense the electrical signals
coming from the stomach's muscles cutaneously and data is recorded on a
computer for further analysis with different techniques.
2.6.2 Electrode placement
Standard electrocardiographic type electrodes are commonly used
for EGG recordings. Although there is no established standard, it is generally
accepted that the active recording electrodes should be placed as close to the
antrum as possible to yield a high signal-to-noise ratio. The EGG signals can
be recorded with either unipolar or bipolar electrodes, but bipolar recording
yields signals with a higher signal-to-noise ratio. The electrical signals are
generally produced in the mid-corpus of the stomach where the electrical

34
activity takes place. The positioning of the Ag/ Agcl electrodes or Active
Electrode (AE) for tapping of these signals is shown in Figure 2.12.
Figure 2.12 Electrode Positioning for EGG Recording
Two electrodes A and B are placed in the fundus and the mid
corpus of the stomach. The third electrode C is placed as ground at the end of
the stomach region for patient safety i.e. with respect to figure, Electrode A
is shown in red color, it is positioned in the midclavicular line (left side)
approximately two inches below the left costal margin, Electrode B is shown
in Black color, it is placed at the midpoint between the xiphoid and umbilicus
and ground Electrode C or reference electrode shown in green color is
positioned in the midclavicular line on the right side (Krusiec and jonderko
2008).

35
2.6.3 EGG Recording Procedure
EGG is vulnerable to motion artifacts due to the nature of
cutaneous measurement. Accordingly, a careful and proper preparation before
the recording is crucial in obtaining reliable data. EGG signals are very weak,
it is very important to minimize the impedance between the skin and
electrodes. The abdominal surface where electrodes are to be positioned
should be shaved if necessary, cleaned and abraded with some sandy skin-
preparation jelly (e.g. K-Y Jelly, produced by Johnson & Johnson Co) in
order to reduce the impedance between the bipolar electrodes and skin. The
EGG may contain severe motion artifacts if the skin is not well prepared. The
subject undergoing EGG procedure needs to be in a comfortable supine
position or sit in a reclining chair in a quiet room throughout the study (Anna
Kascika- Jonderko et al 2006,Krusiec and jonderko 2008 and Contreras et al
2010). The supine position is recommended for recording EGG, because the
subject is more relaxed in this position, and thus introduces fewer motion
artifacts. The subject should not be engaged in any conversation and should
remain as still as possible to prevent motion artifacts. Recordings are made
for both fasting and after a meal with the patient lying quietly. The study
takes two or three hours.
2.7 EGG ACQUISITION METHODS
To acquire this EGG signal, different methods are adopted with
including high-pass and band pass filtering is used to extract spikes from the
myoelectrical recording with slow waves with less than 1 Hz and spikes
(higher frequency) with higher than 1Hz and low pass filter with cutoff
frequency 1Hz (Zhishun Wang and Chen 2001 and Contreras et al 2010).
They are discussed in this section.

36
Method A
Figure 2.13 shows the block diagram of EGG acquisition with
Microcontroller (Intel 8051).
A
B
C
Figure 2.13 Microcontroller Based EGG Recording
The electrodes are placed on the surface of the stomach and the
signals are tapped from the mid corpus region. Since these signals are of low
amplitude, its amplified using instrumentation amplifier and given to a second
order low pass Butterworth filter to remove the noise, ripples and unnecessary
disturbance. DC supply is used to energize the op amps used in the filter and
amplifier circuits. This method uses microcontroller based system with Visual
basic and Virtins software to acquire the EGG. This signal is given to the
microcontroller and is transferred to the PC with a serial interface circuit for
bit by bit transfer.
The data is displayed on the PC using Visual basic. This displays
the name, age, amplitude and frequency which are saved and kept as EGG
database for normal and abnormal subject. The signal from the filter is given

37
to a protection circuit and then applied as input to the sound card and are
viewed using Virtins Software which displays the waveform. The signals are
analyzed to classify normal EGG or abnormal EGG based on the amplitude and frequency.
Method A is a simple way to acquire the EGG cutaneously.
However it has some drawbacks. They are
The signal fed through the sound card also picks up the
environmental noise along with EGG.
Virtins software is basically used for analyzing sound. Except
for very strong contractions of the stomach, most of the EGG
signals were suppressed by noise and was not displayed correctly.
Method B
Method B is similar to Method A, where the VB and Virtins
software is replaced by LabVIEW. LabVIEW has its own advantages like, the
built-in user interface components such as buttons, graphs etc and literally
requires no programming. The data terminals appear on the block diagram
and it is compatibility with hardware. LabVIEW software which uses the
graphical data flow programming technique is used for the investigation of
digestive system disorders. Although this method has an advantage with
respect to easy analysis by developing subVIs, still it has the same
disadvantages as method A because it uses the sound card.
Method C
Figure 2.14 represents the block diagram for EGG acquisition
using DAQ card. The amplified signal is applied to the Data Acquisition Card (DAQ). DAQ is an instrument is supported by LabVIEW software.

38
A
B
C
Figure 2.14 Block Diagram for Recording EGG with DAQ Set-up
Figure 2.15 Screenshot of EGG Recording by Method C
The key function of the DAQ is to act as an interface between the
external signal and the subject. After amplification the signal is sent to the
DAQ. DAQ digitizes this signal and makes it suitable for further processing.
DAQ assistant is a module in the LabVIEW flow diagram which has set of
parameters that should be selected to acquire the signal from the DAQ. There
are various other noises that will be obtained during signal acquisition process
namely respiratory effects, disturbances due to bowel movements, etc. In

39
order to reject these noises a Butterworth low pass filter of tenth order is used.
The screen shot of EGG acquisition with DAQ set-up is shown in Figure 2.15.
This method is used for acquiring the EGG data that is analyzed statistically as
discussed in chapter 3. The cost of the DAQ is the main drawback in this method.
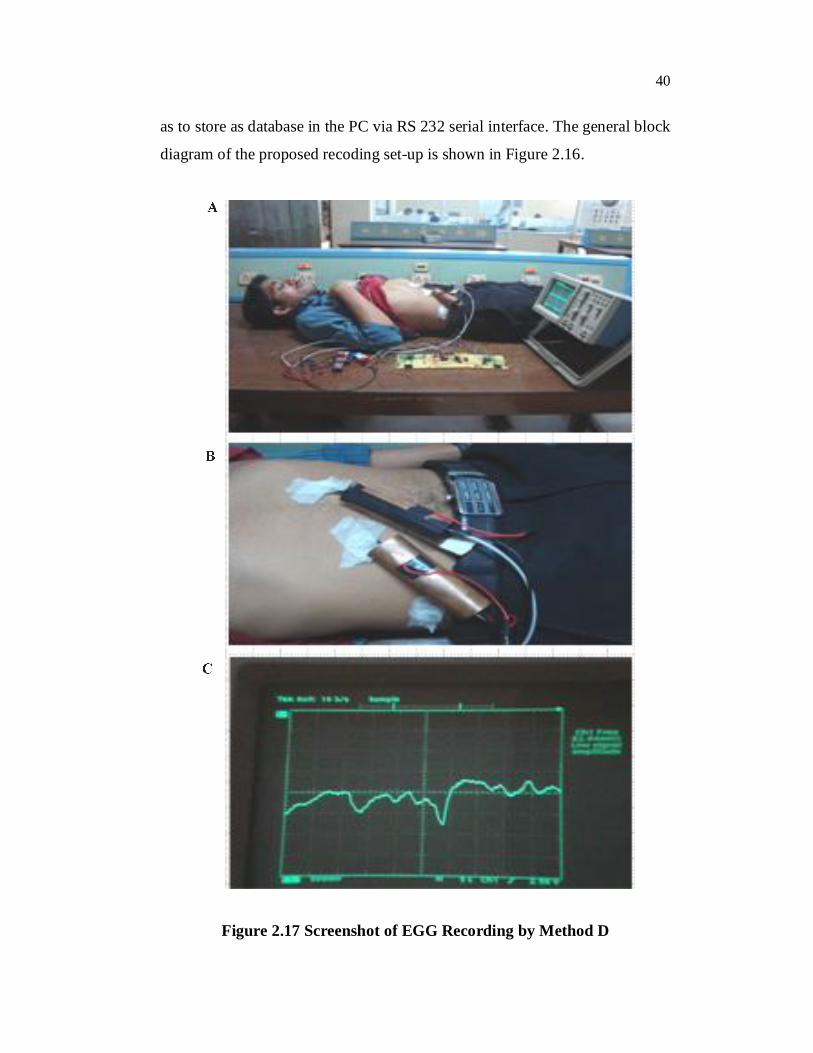
Method D
In this recoding set-up, active electrodes are used to acquire the
electrical signals directly from the stomach, which are used to buffer the
signals and also provide impedance matching. The active electrodes are well
protected within a shield to reduce electromagnetic interference.
A
B
C
Figure 2.16 Block Diagram for Recording EGG with Active Electrode
EGG from active electrode undergoes signal conditioning in SCU unit, which
includes instrumentation amplifier (IA) and filter. The noise due to
respiratory, cardiac and other bio signals along with motion artifacts is also
acquired with EGG. This is eliminated in the filter section and the frequency
range from 1 to 10 cpm of EGG is viewed in the digital storage scope (DSO).
EGG is applied to data scope to convert the analog form into digital form so
40
as to store as database in the PC via RS 232 serial interface. The general block
diagram of the proposed recoding set-up is shown in Figure 2.16.
Figure 2.17 Screenshot of EGG Recording by Method D
41
The screenshots are shown in Figure 2.17. Figure 2.17(A) is the
recording set-up, Figure 2.17(B) shows placement of Electrode and
Figure 2.17(C) is the display screen.
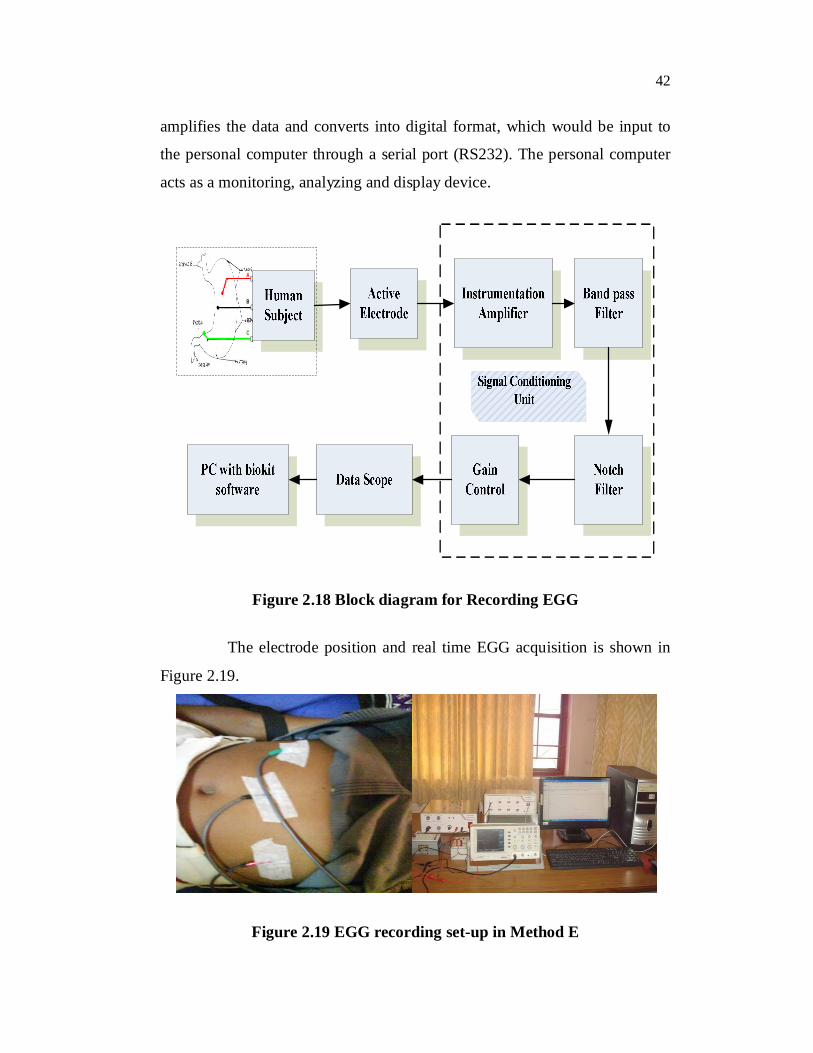
Method E
Electrogastrogram recording set-up using Method E is shown in the
Figure 2.18. The bio signal from the stomach due to motility is tapped with
active electrodes cutaneously. The electrodes output is given as an input to the
SCU which consists of Instrumentation amplifier, Band pass filter, Notch
filter and Gain control. SCU includes amplification, filtering, converting,
range matching, isolation and any other processes required to make sensor
output suitable for further processing. In SCU, an instrumentation amplifier is
used to amplify the potential detected by the electrodes.
An amplifier accepts a voltage signal as an input and produces a
linearly scaled version of this signal at the output. It is a closed-loop fixed-
gain amplifier, usually differential, and has high input impedance, low drift
and high common-mode rejection ratio over a wide range of frequencies. A
band-pass filter is a device that passes frequencies within a certain range and
rejects frequencies outside that range. Notch filter is known as band-cut filter
or band-reject filter. The function of this filter is to remove some frequency
portion of a signal. It is used to reduce or prevent feedback. Gain control is an
adaptive system found in many electronic devices. The average output signal
level is fed back to adjust the gain to an appropriate level for a range of input
signal levels. Signal conditioning unit primarily utilized for data acquisition,
in which sensor signals must normalized, filtered to levels suitable for analog-
to-digital conversion to recording and analyzing using computer processor.
A Datascope is used with biokit software for capturing and
analyzing EGG signals. It is an 8 channel data acquisition system which
42
amplifies the data and converts into digital format, which would be input to
the personal computer through a serial port (RS232). The personal computer
acts as a monitoring, analyzing and display device.
A
B
C
Figure 2.18 Block diagram for Recording EGG
The electrode position and real time EGG acquisition is shown in
Figure 2.19.
Figure 2.19 EGG recording set-up in Method E

43
Figure 2.20 displays the snapshots of the EGG signals recorded for
normal, bradygastria and tachygastria subjects.
Figure 2.20 Screenshot of EGG recorded by Method E
Performance comparison of all the methods is tabulated in
Table 2.2. The electrode selected for acquisition and the recording procedure
was similar to the method presented by Anna Kascika- Jonderko et al (2006)
and Krusiec and jonderko (2008) have used CVp, Coefficient of Variation to
measure the reproducibility of EGG signals. This is reported as an alternative
for making large number of observation on single subject (Jones and Payne
1997).
Here recordings were performed in subjects for 0.5 hour to 2 hour
duration out of which 1 minute recording samples after obtaining stability in
acquisition was used to create the database. By visual inspection and Method
E was certified by the physician for acquisition. Around 1000 samples of
EGG signal was recorded for the seven classes. From this database on an
average of 500 samples were randomly selected for training and testing.

44
Table 2.2 Comparison of Proposed EGG Acquisition Methods
Sl. No. Method Description Acquisition properties Quality of Signal captured
1 A
Ag/Agcl Electrode is used. Micro controller with Visual Basic
and Virtins software is used.
EGG signal from electrodes are fed with sound card slot. So, external surrounding noise included with EGG signals.
EGG pattern is captured with more noise. Most signal do not lie in standard
frequency range. Reduced amplitude.
2 B
Ag/Agcl Electrode is used. Micro controller with LabVIEW
software is used.
EGG signal to be acquired is interfaced with LabVIEW software through serial port. So delay in acquisition of EGG signal.
Visualization of EGG pattern is improved.
EGG frequency obtained is greater or lesser than the standard values.
3 C
Ag/Agcl Electrode is used. Virtual Instrument (DAQ) is used.
Acquisition process simplified due to the use of DAQ.
Denoising of EGG signal is achieved with LabVIEW software.
EGG signal recorded lies in standard frequency range.
4 D
Active Electrode replaced Ag/Agcl Electrode.
EGG is viewed with DSO and data is acquired using datascope.
Proper shielding is required to reduce electromagnetic interference.
Increase in EGG signal amplitude.
5 E
Active Electrode is used. SCU is modified with filter and
gain control. Biokit software is used along with
data scope to create EGG data base.
Acquisition complexity is minimized with proper designing of SCU and shielding.
Visualization of EGG pattern is good. Recorded EGG signal lies in standard
frequency range. Increase in amplitude of EGG signal.

45
2.8 CREATION OF EGG DATABASE
In order to create a database, prior information about a set of
symptoms and the corresponding gastric disorders have been gathered from
gastroenterologist of reputed hospital as mentioned in Appendix I. The
digestive system disorders and the corresponding symptoms obtained from
gastroenterologist are listed below as Di and Sj respectively, where ‘i’ varies
from 1 to 6 and ‘j’ varies from 1 to15 (Chattopadhyay et al 2012).
S1 Abdominal pain D1 Bradygastria
S2 Belching D2 Dyspepsia
S3 Vomiting Sensation D3 Nausea
S4 Abdominal bloating D4 Vomiting
S5 Abdominal discomfort D5 Ulcer
S6 Stomach gramps D6 Tachygastria
S7 Heart burn
S8 Constipation
S9 H.Pyroli bacterial infection
S10 Gastritis
S11 Eating disorders
S12 Food Poisoning
S13 Virus Infection
S14 Electrical activity
S15 Irritable bowel syndrome
Approximately 1000 subjects were studied, based on the prior
information from gastroenterologist. The EGG database is formed with
approximately 500 subjects grouped as an average of 70 for each category of
6 disorders and normal category using Baye’s theorem based on the
conditional probability. Under the guidance of physician of gastroenterology
department, Sri Ramakrishna Hospital a separate setup was made at

46
Biomedical Engineering department of Sri Ramakrishna Engineering College,
Coimbatore to record EGG signals. Initially the database was created from the
sample obtained from MEDINDIA Hospital and PSG Hospital, Coimbatore.
From the database the threshold for normal and abnormal is formulated in
conformity with physician. This was used as the reference or ground truth.
The stability of recordings was verified at PSG Hospitals and MEDINDIA
Hospitals, Coimbatore. 60 samples per minute of EGG data for normal and
disorder subjects were used as inputs for classification.
2.9 CONCLUSION
This chapter discusses the selection of electrodes, positioning of
electrodes cutaneously, recording procedure and different methods of
acquisition of EGG. From the EGG database, approximately 500 subjects
with 70 subjects in 6 different digestive disorders along with normal subject
are selected from the database. This database is analyzed for the classification
of digestive system disorders by applying statistical parameter with Naive
Bayesian Classifier, Wavelet Transform, Neural Network and Fuzzy
clustering techniques.