Embed Size (px)
Citation preview
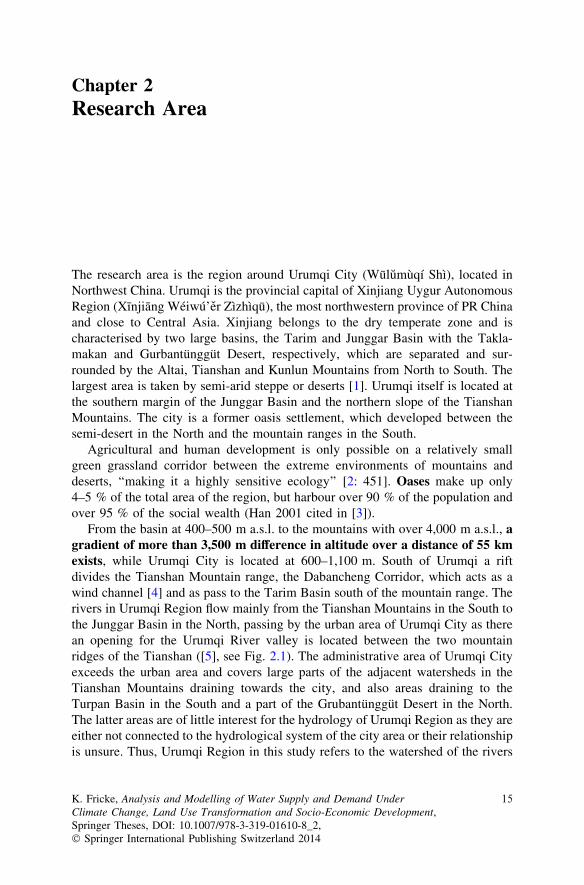
Chapter 2Research Area
The research area is the region around Urumqi City (Wulumùqí Shì), located inNorthwest China. Urumqi is the provincial capital of Xinjiang Uygur AutonomousRegion (Xınjiang Wéiwú’er Zìzhìqu), the most northwestern province of PR Chinaand close to Central Asia. Xinjiang belongs to the dry temperate zone and ischaracterised by two large basins, the Tarim and Junggar Basin with the Takla-makan and Gurbantünggüt Desert, respectively, which are separated and sur-rounded by the Altai, Tianshan and Kunlun Mountains from North to South. Thelargest area is taken by semi-arid steppe or deserts [1]. Urumqi itself is located atthe southern margin of the Junggar Basin and the northern slope of the TianshanMountains. The city is a former oasis settlement, which developed between thesemi-desert in the North and the mountain ranges in the South.
Agricultural and human development is only possible on a relatively smallgreen grassland corridor between the extreme environments of mountains anddeserts, ‘‘making it a highly sensitive ecology’’ [2: 451]. Oases make up only4–5 % of the total area of the region, but harbour over 90 % of the population andover 95 % of the social wealth (Han 2001 cited in [3]).
From the basin at 400–500 m a.s.l. to the mountains with over 4,000 m a.s.l., agradient of more than 3,500 m difference in altitude over a distance of 55 kmexists, while Urumqi City is located at 600–1,100 m. South of Urumqi a riftdivides the Tianshan Mountain range, the Dabancheng Corridor, which acts as awind channel [4] and as pass to the Tarim Basin south of the mountain range. Therivers in Urumqi Region flow mainly from the Tianshan Mountains in the South tothe Junggar Basin in the North, passing by the urban area of Urumqi City as therean opening for the Urumqi River valley is located between the two mountainridges of the Tianshan ([5], see Fig. 2.1). The administrative area of Urumqi Cityexceeds the urban area and covers large parts of the adjacent watersheds in theTianshan Mountains draining towards the city, and also areas draining to theTurpan Basin in the South and a part of the Grubantünggüt Desert in the North.The latter areas are of little interest for the hydrology of Urumqi Region as they areeither not connected to the hydrological system of the city area or their relationshipis unsure. Thus, Urumqi Region in this study refers to the watershed of the rivers
K. Fricke, Analysis and Modelling of Water Supply and Demand UnderClimate Change, Land Use Transformation and Socio-Economic Development,Springer Theses, DOI: 10.1007/978-3-319-01610-8_2,� Springer International Publishing Switzerland 2014
15
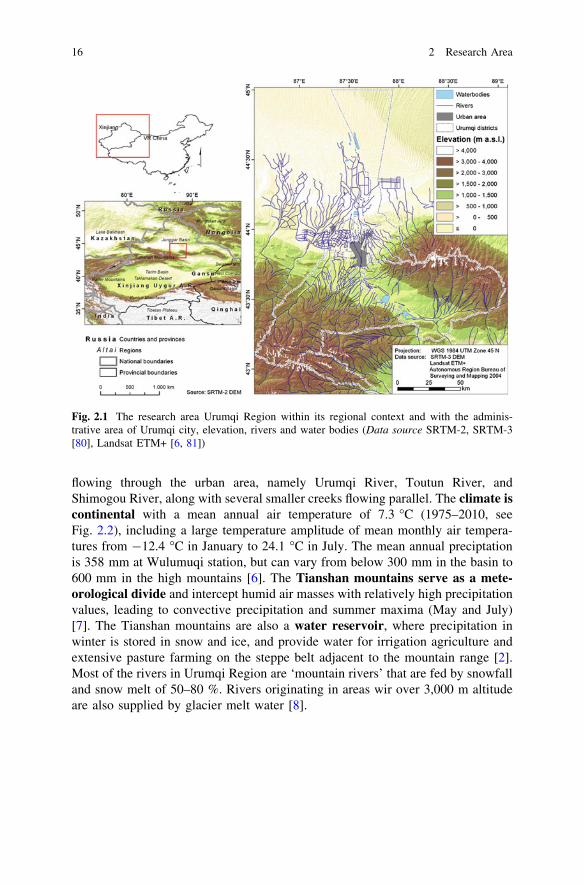
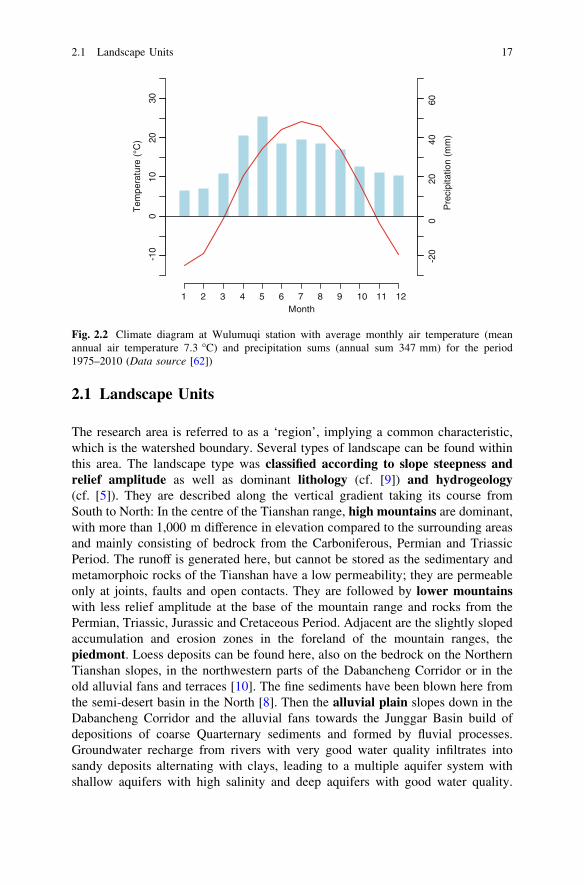
flowing through the urban area, namely Urumqi River, Toutun River, andShimogou River, along with several smaller creeks flowing parallel. The climate iscontinental with a mean annual air temperature of 7.3 �C (1975–2010, seeFig. 2.2), including a large temperature amplitude of mean monthly air tempera-tures from -12.4 �C in January to 24.1 �C in July. The mean annual preciptationis 358 mm at Wulumuqi station, but can vary from below 300 mm in the basin to600 mm in the high mountains [6]. The Tianshan mountains serve as a mete-orological divide and intercept humid air masses with relatively high precipitationvalues, leading to convective precipitation and summer maxima (May and July)[7]. The Tianshan mountains are also a water reservoir, where precipitation inwinter is stored in snow and ice, and provide water for irrigation agriculture andextensive pasture farming on the steppe belt adjacent to the mountain range [2].Most of the rivers in Urumqi Region are ‘mountain rivers’ that are fed by snowfalland snow melt of 50–80 %. Rivers originating in areas wir over 3,000 m altitudeare also supplied by glacier melt water [8].
Fig. 2.1 The research area Urumqi Region within its regional context and with the adminis-trative area of Urumqi city, elevation, rivers and water bodies (Data source SRTM-2, SRTM-3[80], Landsat ETM+ [6, 81])
16 2 Research Area
2.1 Landscape Units
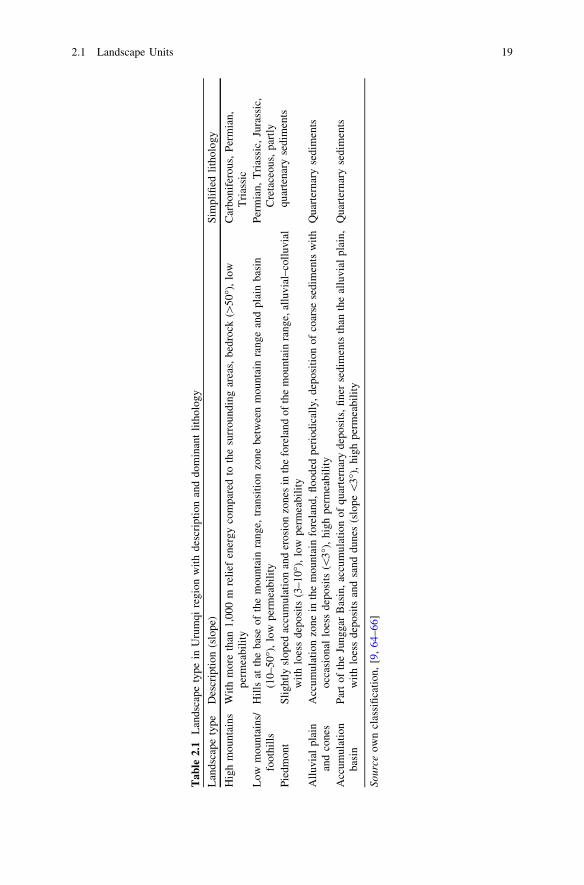
The research area is referred to as a ‘region’, implying a common characteristic,which is the watershed boundary. Several types of landscape can be found withinthis area. The landscape type was classified according to slope steepness andrelief amplitude as well as dominant lithology (cf. [9]) and hydrogeology(cf. [5]). They are described along the vertical gradient taking its course fromSouth to North: In the centre of the Tianshan range, high mountains are dominant,with more than 1,000 m difference in elevation compared to the surrounding areasand mainly consisting of bedrock from the Carboniferous, Permian and TriassicPeriod. The runoff is generated here, but cannot be stored as the sedimentary andmetamorphoic rocks of the Tianshan have a low permeability; they are permeableonly at joints, faults and open contacts. They are followed by lower mountainswith less relief amplitude at the base of the mountain range and rocks from thePermian, Triassic, Jurassic and Cretaceous Period. Adjacent are the slightly slopedaccumulation and erosion zones in the foreland of the mountain ranges, thepiedmont. Loess deposits can be found here, also on the bedrock on the NorthernTianshan slopes, in the northwestern parts of the Dabancheng Corridor or in theold alluvial fans and terraces [10]. The fine sediments have been blown here fromthe semi-desert basin in the North [8]. Then the alluvial plain slopes down in theDabancheng Corridor and the alluvial fans towards the Junggar Basin build ofdepositions of coarse Quarternary sediments and formed by fluvial processes.Groundwater recharge from rivers with very good water quality infiltrates intosandy deposits alternating with clays, leading to a multiple aquifer system withshallow aquifers with high salinity and deep aquifers with good water quality.
-20
020
4060
Pre
cipi
tatio
n (m
m)
Month
Tem
pera
ture
(°C
)
1 2 3 4 5 6 7 8 9 10 11 12
-10
010
2030
Fig. 2.2 Climate diagram at Wulumuqi station with average monthly air temperature (meanannual air temperature 7.3 �C) and precipitation sums (annual sum 347 mm) for the period1975–2010 (Data source [62])
2.1 Landscape Units 17
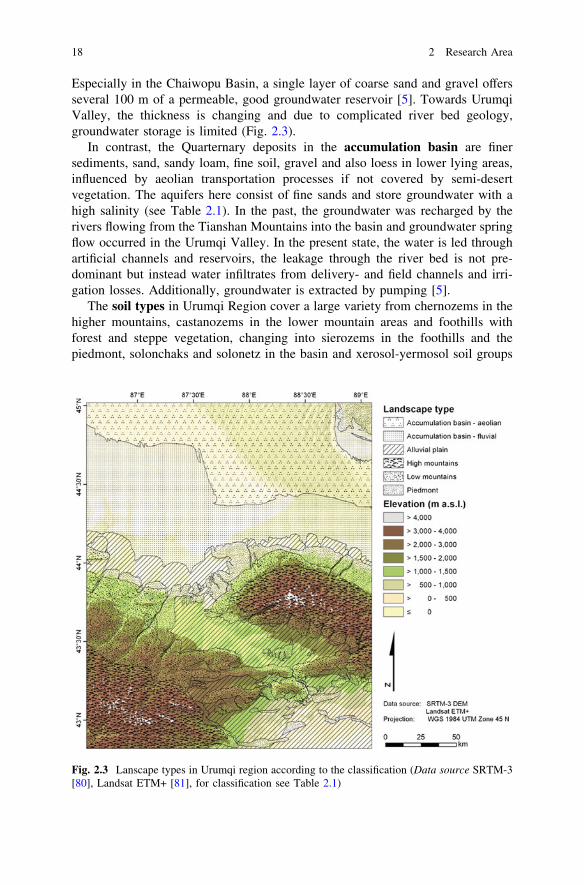
Especially in the Chaiwopu Basin, a single layer of coarse sand and gravel offersseveral 100 m of a permeable, good groundwater reservoir [5]. Towards UrumqiValley, the thickness is changing and due to complicated river bed geology,groundwater storage is limited (Fig. 2.3).
In contrast, the Quarternary deposits in the accumulation basin are finersediments, sand, sandy loam, fine soil, gravel and also loess in lower lying areas,influenced by aeolian transportation processes if not covered by semi-desertvegetation. The aquifers here consist of fine sands and store groundwater with ahigh salinity (see Table 2.1). In the past, the groundwater was recharged by therivers flowing from the Tianshan Mountains into the basin and groundwater springflow occurred in the Urumqi Valley. In the present state, the water is led throughartificial channels and reservoirs, the leakage through the river bed is not pre-dominant but instead water infiltrates from delivery- and field channels and irri-gation losses. Additionally, groundwater is extracted by pumping [5].
The soil types in Urumqi Region cover a large variety from chernozems in thehigher mountains, castanozems in the lower mountain areas and foothills withforest and steppe vegetation, changing into sierozems in the foothills and thepiedmont, solonchaks and solonetz in the basin and xerosol-yermosol soil groups
Fig. 2.3 Lanscape types in Urumqi region according to the classification (Data source SRTM-3[80], Landsat ETM+ [81], for classification see Table 2.1)
18 2 Research Area
Tab
le2.
1L
ands
cape
type
inU
rum
qire
gion
wit
hde
scri
ptio
nan
ddo
min
ant
lith
olog
y
Lan
dsca
pety
peD
escr
ipti
on(s
lope
)S
impl
ified
lith
olog
y
Hig
hm
ount
ains
Wit
hm
ore
than
1,00
0m
reli
efen
ergy
com
pare
dto
the
surr
ound
ing
area
s,be
droc
k([
50�)
,lo
wpe
rmea
bili
tyC
arbo
nife
rous
,P
erm
ian,
Tri
assi
cL
owm
ount
ains
/fo
othi
lls
Hil
lsat
the
base
ofth
em
ount
ain
rang
e,tr
ansi
tion
zone
betw
een
mou
ntai
nra
nge
and
plai
nba
sin
(10–
50�)
,lo
wpe
rmea
bili
tyP
erm
ian,
Tri
assi
c,Ju
rass
ic,
Cre
tace
ous,
part
lyqu
arte
nary
sedi
men
tsP
iedm
ont
Sli
ghtl
ysl
oped
accu
mul
atio
nan
der
osio
nzo
nes
inth
efo
rela
ndof
the
mou
ntai
nra
nge,
allu
vial
–col
luvi
alw
ith
loes
sde
posi
ts(3
–10�
),lo
wpe
rmea
bili
tyA
lluv
ial
plai
nan
dco
nes
Acc
umul
atio
nzo
nein
the
mou
ntai
nfo
rela
nd,
floo
ded
peri
odic
ally
,de
posi
tion
ofco
arse
sedi
men
tsw
ith
occa
sion
allo
ess
depo
sits
(\3�
),hi
ghpe
rmea
bili
tyQ
uart
erna
ryse
dim
ents
Acc
umul
atio
nba
sin
Par
tof
the
Jung
gar
Bas
in,a
ccum
ulat
ion
ofqu
arte
rnar
yde
posi
ts,fi
ner
sedi
men
tsth
anth
eal
luvi
alpl
ain,
wit
hlo
ess
depo
sits
and
sand
dune
s(s
lope
\3�
),hi
ghpe
rmea
bili
tyQ
uart
erna
ryse
dim
ents
Sour
ceow
ncl
assi
fica
tion
,[9
,64
–66]
2.1 Landscape Units 19
in the semi-desert areas. Locally, other soil types with a high variability can occurdue to changes of rocktype, relief, land use and age of land surfaces [10]. Forexample the oasis soil near human settlements is influenced by anthropogenicreclamation and cultivation and in the fluvial terraces and irrigation areas Gleysolsand Fluvisols are abound [8, 10].
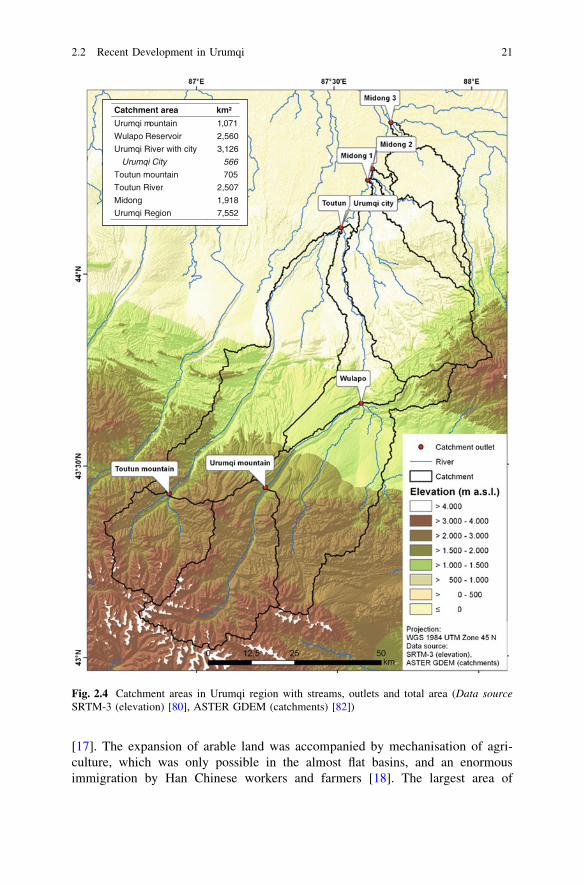
The catchments located within the administrative area and chosen as researcharea are Urumqi River basin (3,126 km2), Toutun River basin (1,069 km2) and thesmaller catchments in Midong District. Midong District does not have one clearlyidentifiable outlet; therefore the results for three sub-catchments covering thedistrict area were summed up to Midong catchment (1,918 km2). The combinedcatchments of Urumqi Region cover about 7,552 km2, therefore the hydrologicalprocesses are modelled on the catchment level and the spatial macro scaleaccording to Blöschl (1996 cited in [11]). The precipitation-runoff processescannot be described with a conceptual model on the catchment scale but it has tobe divided in several smaller areas or raster cells as in this study [12]. Thecharacteristics of the catchment areas are slightly different: Urumqi River basinincludes the catchment of Urumqi Mountain and Wulapo Reservoir, which extendover mountains, foothills and alluvial areas with agriculture, and the urban andsealed area of Urumqi City. The largest part of the catchment of Toutun River iscovered by mountainous and foothill areas. Midong catchment includes a smallmountainous part, but mainly semi-vegetated foothills and alluvial areas withagriculture and little sealed area of Midong District. The upstream watersheds arenested in the downstream catchment outlets (e.g. Urumqi mountain catchment isincluded in Wulapo catchment which is included in the Urumqi River catchment),except the catchment Urumqi City, which was calculated also separately to assessspecifically the characteristics of the urban area (Fig. 2.4).
2.2 Recent Development in Urumqi
Urumqi is an old Central Asian oasis city, formerly a trade centre on one branch ofthe Silk Road. Not until the twentieth century the Chinese government establishedtheir power and sovereign rights permanently. In 1948, the ‘urban area’ had only88,000 inhabitants [13: 64], in 2004, the population of Urumqi City exceeded the2 million mark and in 2009, the population counted 2.41 million inhabitants [14].The central Chinese government began intensified reclamation of farmland in thenorthwestern basins in the 1950s to improve the food self-sufficiency of NorthwestChina [5], release the population pressure from densely populated provinces in theEast and to support its dominant position in the Central Asian area. For thispurpose, state farms were established and farmland was reclaimed and cultivatedwith the construction of irrigation channels [15, 16]. This strategy is still supportedby subsidised low water prices [5]. The development of Xinjiang and also Urumqiwas mainly based on the strategy ‘one black, one white‘, meaning oil productionand cultivation of cotton or more generally resource extraction and agriculture
20 2 Research Area
[17]. The expansion of arable land was accompanied by mechanisation of agri-culture, which was only possible in the almost flat basins, and an enormousimmigration by Han Chinese workers and farmers [18]. The largest area of
Catchment area km²
Urumqi mountain 1,071
Wulapo Reservoir 2,560
Urumqi River with city 3,126
Urumqi City 566
Toutun mountain 705
Toutun River 2,507
Midong 1,918
Urumqi Region 7,552
Fig. 2.4 Catchment areas in Urumqi region with streams, outlets and total area (Data sourceSRTM-3 (elevation) [80], ASTER GDEM (catchments) [82])
2.2 Recent Development in Urumqi 21
regional development was located in the oasis belt and expanded from there intothe basins (cf. also [3]).
With the agricultural expansion, industry developed based on coal deposits andoil resources as well as natural gas, salt and valuable ore deposits in the circum-ference of Urumqi Region, but since the 1980s, the economic output mainly of thetertiary sector increased. During the last 60 years, Urumqi has undergone thetransformation from a region based on agriculture to a regional centre fortrading and industry. Urumqi is part of the Tianshan Northern Piedmont PlainIndustrial Belt, where the economic development of Northwestern China is con-centrated. The last two decades, Urumqi City had an average annual GDP growthrate of 10 % [19].
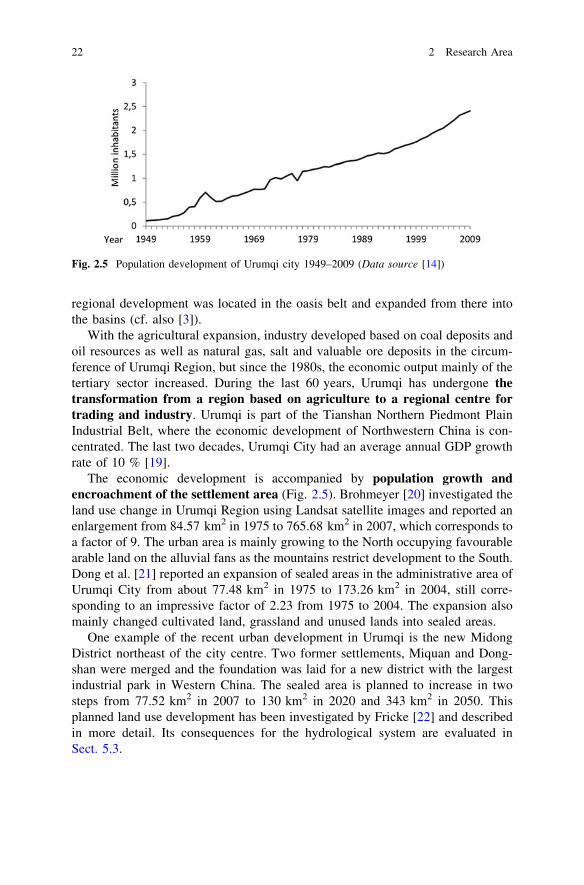
The economic development is accompanied by population growth andencroachment of the settlement area (Fig. 2.5). Brohmeyer [20] investigated theland use change in Urumqi Region using Landsat satellite images and reported anenlargement from 84.57 km2 in 1975 to 765.68 km2 in 2007, which corresponds toa factor of 9. The urban area is mainly growing to the North occupying favourablearable land on the alluvial fans as the mountains restrict development to the South.Dong et al. [21] reported an expansion of sealed areas in the administrative area ofUrumqi City from about 77.48 km2 in 1975 to 173.26 km2 in 2004, still corre-sponding to an impressive factor of 2.23 from 1975 to 2004. The expansion alsomainly changed cultivated land, grassland and unused lands into sealed areas.
One example of the recent urban development in Urumqi is the new MidongDistrict northeast of the city centre. Two former settlements, Miquan and Dong-shan were merged and the foundation was laid for a new district with the largestindustrial park in Western China. The sealed area is planned to increase in twosteps from 77.52 km2 in 2007 to 130 km2 in 2020 and 343 km2 in 2050. Thisplanned land use development has been investigated by Fricke [22] and describedin more detail. Its consequences for the hydrological system are evaluated inSect. 5.3.
Fig. 2.5 Population development of Urumqi city 1949–2009 (Data source [14])
22 2 Research Area
2.3 Water Supply and Consumption
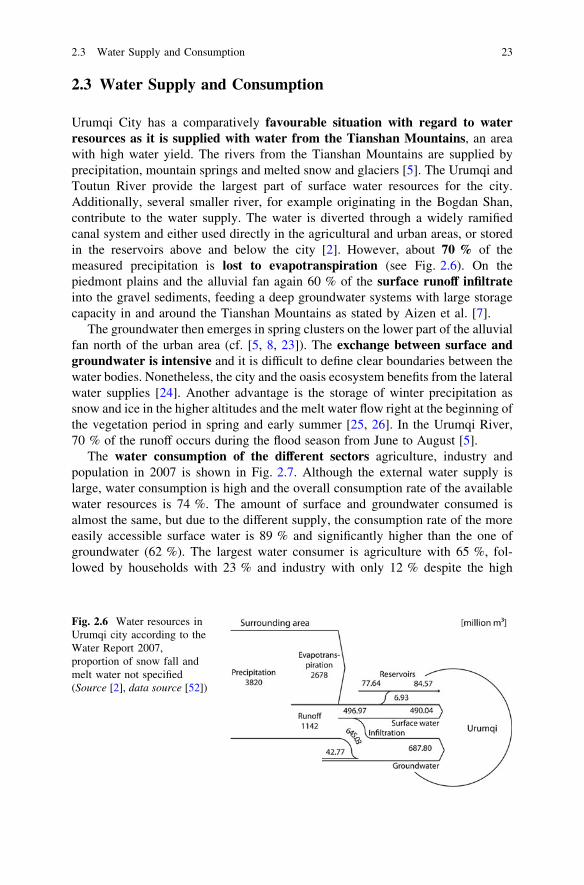
Urumqi City has a comparatively favourable situation with regard to waterresources as it is supplied with water from the Tianshan Mountains, an areawith high water yield. The rivers from the Tianshan Mountains are supplied byprecipitation, mountain springs and melted snow and glaciers [5]. The Urumqi andToutun River provide the largest part of surface water resources for the city.Additionally, several smaller river, for example originating in the Bogdan Shan,contribute to the water supply. The water is diverted through a widely ramifiedcanal system and either used directly in the agricultural and urban areas, or storedin the reservoirs above and below the city [2]. However, about 70 % of themeasured precipitation is lost to evapotranspiration (see Fig. 2.6). On thepiedmont plains and the alluvial fan again 60 % of the surface runoff infiltrateinto the gravel sediments, feeding a deep groundwater systems with large storagecapacity in and around the Tianshan Mountains as stated by Aizen et al. [7].
The groundwater then emerges in spring clusters on the lower part of the alluvialfan north of the urban area (cf. [5, 8, 23]). The exchange between surface andgroundwater is intensive and it is difficult to define clear boundaries between thewater bodies. Nonetheless, the city and the oasis ecosystem benefits from the lateralwater supplies [24]. Another advantage is the storage of winter precipitation assnow and ice in the higher altitudes and the melt water flow right at the beginning ofthe vegetation period in spring and early summer [25, 26]. In the Urumqi River,70 % of the runoff occurs during the flood season from June to August [5].
The water consumption of the different sectors agriculture, industry andpopulation in 2007 is shown in Fig. 2.7. Although the external water supply islarge, water consumption is high and the overall consumption rate of the availablewater resources is 74 %. The amount of surface and groundwater consumed isalmost the same, but due to the different supply, the consumption rate of the moreeasily accessible surface water is 89 % and significantly higher than the one ofgroundwater (62 %). The largest water consumer is agriculture with 65 %, fol-lowed by households with 23 % and industry with only 12 % despite the high
Fig. 2.6 Water resources inUrumqi city according to theWater Report 2007,proportion of snow fall andmelt water not specified(Source [2], data source [52])
2.3 Water Supply and Consumption 23
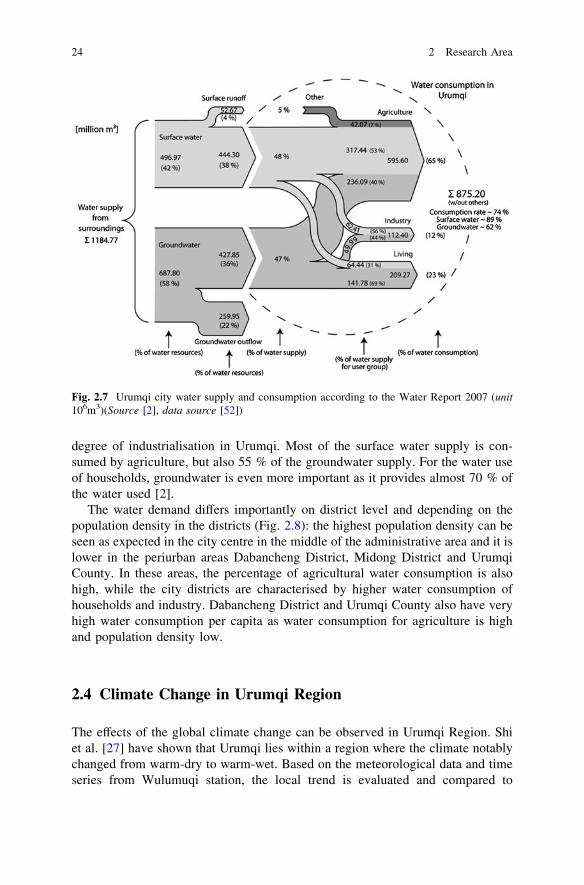
degree of industrialisation in Urumqi. Most of the surface water supply is con-sumed by agriculture, but also 55 % of the groundwater supply. For the water useof households, groundwater is even more important as it provides almost 70 % ofthe water used [2].
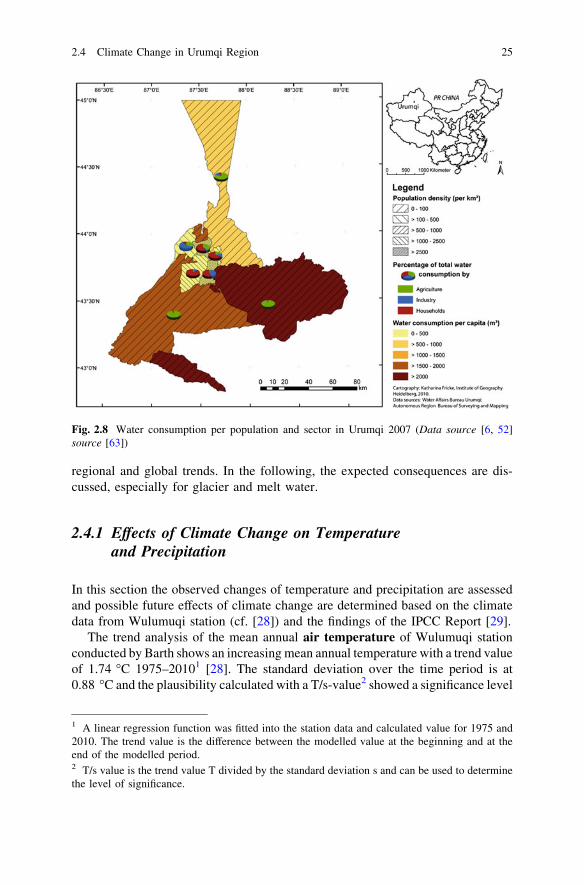
The water demand differs importantly on district level and depending on thepopulation density in the districts (Fig. 2.8): the highest population density can beseen as expected in the city centre in the middle of the administrative area and it islower in the periurban areas Dabancheng District, Midong District and UrumqiCounty. In these areas, the percentage of agricultural water consumption is alsohigh, while the city districts are characterised by higher water consumption ofhouseholds and industry. Dabancheng District and Urumqi County also have veryhigh water consumption per capita as water consumption for agriculture is highand population density low.
2.4 Climate Change in Urumqi Region
The effects of the global climate change can be observed in Urumqi Region. Shiet al. [27] have shown that Urumqi lies within a region where the climate notablychanged from warm-dry to warm-wet. Based on the meteorological data and timeseries from Wulumuqi station, the local trend is evaluated and compared to
Fig. 2.7 Urumqi city water supply and consumption according to the Water Report 2007 (unit106m3)(Source [2], data source [52])
24 2 Research Area
regional and global trends. In the following, the expected consequences are dis-cussed, especially for glacier and melt water.
2.4.1 Effects of Climate Change on Temperatureand Precipitation
In this section the observed changes of temperature and precipitation are assessedand possible future effects of climate change are determined based on the climatedata from Wulumuqi station (cf. [28]) and the findings of the IPCC Report [29].
The trend analysis of the mean annual air temperature of Wulumuqi stationconducted by Barth shows an increasing mean annual temperature with a trend valueof 1.74 �C 1975–20101 [28]. The standard deviation over the time period is at0.88 �C and the plausibility calculated with a T/s-value2 showed a significance level
Fig. 2.8 Water consumption per population and sector in Urumqi 2007 (Data source [6, 52]source [63])
1 A linear regression function was fitted into the station data and calculated value for 1975 and2010. The trend value is the difference between the modelled value at the beginning and at theend of the modelled period.2 T/s value is the trend value T divided by the standard deviation s and can be used to determinethe level of significance.
2.4 Climate Change in Urumqi Region 25
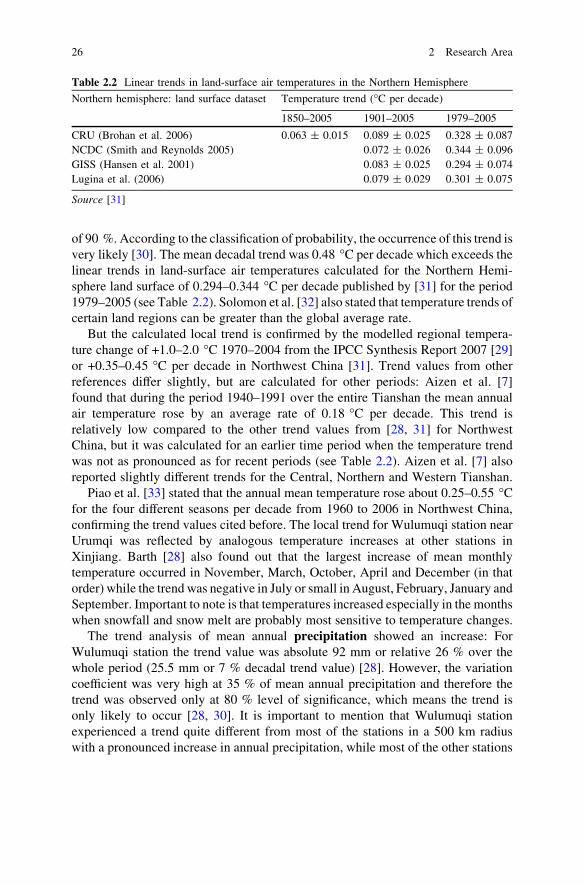
of 90 %. According to the classification of probability, the occurrence of this trend isvery likely [30]. The mean decadal trend was 0.48 �C per decade which exceeds thelinear trends in land-surface air temperatures calculated for the Northern Hemi-sphere land surface of 0.294–0.344 �C per decade published by [31] for the period1979–2005 (see Table 2.2). Solomon et al. [32] also stated that temperature trends ofcertain land regions can be greater than the global average rate.
But the calculated local trend is confirmed by the modelled regional tempera-ture change of +1.0–2.0 �C 1970–2004 from the IPCC Synthesis Report 2007 [29]or +0.35–0.45 �C per decade in Northwest China [31]. Trend values from otherreferences differ slightly, but are calculated for other periods: Aizen et al. [7]found that during the period 1940–1991 over the entire Tianshan the mean annualair temperature rose by an average rate of 0.18 �C per decade. This trend isrelatively low compared to the other trend values from [28, 31] for NorthwestChina, but it was calculated for an earlier time period when the temperature trendwas not as pronounced as for recent periods (see Table 2.2). Aizen et al. [7] alsoreported slightly different trends for the Central, Northern and Western Tianshan.
Piao et al. [33] stated that the annual mean temperature rose about 0.25–0.55 �Cfor the four different seasons per decade from 1960 to 2006 in Northwest China,confirming the trend values cited before. The local trend for Wulumuqi station nearUrumqi was reflected by analogous temperature increases at other stations inXinjiang. Barth [28] also found out that the largest increase of mean monthlytemperature occurred in November, March, October, April and December (in thatorder) while the trend was negative in July or small in August, February, January andSeptember. Important to note is that temperatures increased especially in the monthswhen snowfall and snow melt are probably most sensitive to temperature changes.
The trend analysis of mean annual precipitation showed an increase: ForWulumuqi station the trend value was absolute 92 mm or relative 26 % over thewhole period (25.5 mm or 7 % decadal trend value) [28]. However, the variationcoefficient was very high at 35 % of mean annual precipitation and therefore thetrend was observed only at 80 % level of significance, which means the trend isonly likely to occur [28, 30]. It is important to mention that Wulumuqi stationexperienced a trend quite different from most of the stations in a 500 km radiuswith a pronounced increase in annual precipitation, while most of the other stations
Table 2.2 Linear trends in land-surface air temperatures in the Northern Hemisphere
Northern hemisphere: land surface dataset Temperature trend (�C per decade)
1850–2005 1901–2005 1979–2005
CRU (Brohan et al. 2006) 0.063 ± 0.015 0.089 ± 0.025 0.328 ± 0.087NCDC (Smith and Reynolds 2005) 0.072 ± 0.026 0.344 ± 0.096GISS (Hansen et al. 2001) 0.083 ± 0.025 0.294 ± 0.074Lugina et al. (2006) 0.079 ± 0.029 0.301 ± 0.075
Source [31]
26 2 Research Area
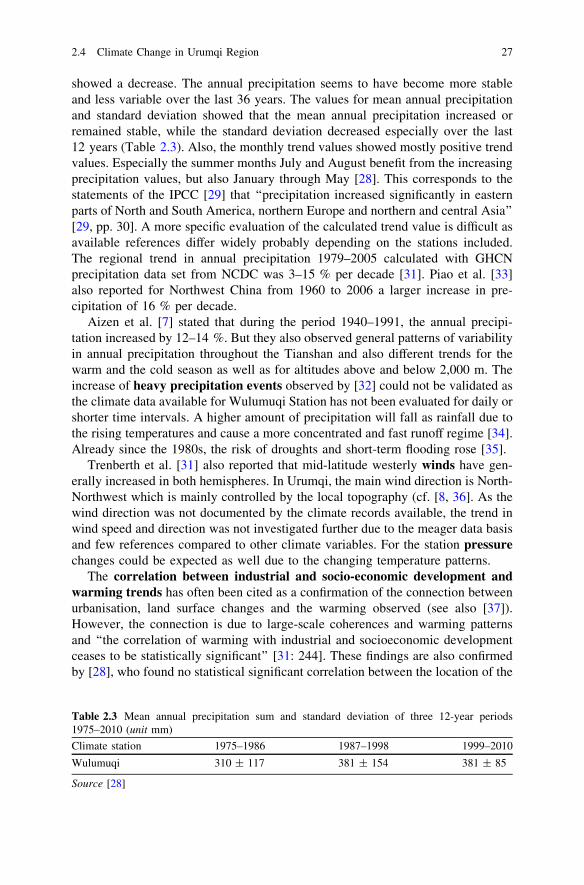
showed a decrease. The annual precipitation seems to have become more stableand less variable over the last 36 years. The values for mean annual precipitationand standard deviation showed that the mean annual precipitation increased orremained stable, while the standard deviation decreased especially over the last12 years (Table 2.3). Also, the monthly trend values showed mostly positive trendvalues. Especially the summer months July and August benefit from the increasingprecipitation values, but also January through May [28]. This corresponds to thestatements of the IPCC [29] that ‘‘precipitation increased significantly in easternparts of North and South America, northern Europe and northern and central Asia’’[29, pp. 30]. A more specific evaluation of the calculated trend value is difficult asavailable references differ widely probably depending on the stations included.The regional trend in annual precipitation 1979–2005 calculated with GHCNprecipitation data set from NCDC was 3–15 % per decade [31]. Piao et al. [33]also reported for Northwest China from 1960 to 2006 a larger increase in pre-cipitation of 16 % per decade.
Aizen et al. [7] stated that during the period 1940–1991, the annual precipi-tation increased by 12–14 %. But they also observed general patterns of variabilityin annual precipitation throughout the Tianshan and also different trends for thewarm and the cold season as well as for altitudes above and below 2,000 m. Theincrease of heavy precipitation events observed by [32] could not be validated asthe climate data available for Wulumuqi Station has not been evaluated for daily orshorter time intervals. A higher amount of precipitation will fall as rainfall due tothe rising temperatures and cause a more concentrated and fast runoff regime [34].Already since the 1980s, the risk of droughts and short-term flooding rose [35].
Trenberth et al. [31] also reported that mid-latitude westerly winds have gen-erally increased in both hemispheres. In Urumqi, the main wind direction is North-Northwest which is mainly controlled by the local topography (cf. [8, 36]. As thewind direction was not documented by the climate records available, the trend inwind speed and direction was not investigated further due to the meager data basisand few references compared to other climate variables. For the station pressurechanges could be expected as well due to the changing temperature patterns.
The correlation between industrial and socio-economic development andwarming trends has often been cited as a confirmation of the connection betweenurbanisation, land surface changes and the warming observed (see also [37]).However, the connection is due to large-scale coherences and warming patternsand ‘‘the correlation of warming with industrial and socioeconomic developmentceases to be statistically significant’’ [31: 244]. These findings are also confirmedby [28], who found no statistical significant correlation between the location of the
Table 2.3 Mean annual precipitation sum and standard deviation of three 12-year periods1975–2010 (unit mm)
Climate station 1975–1986 1987–1998 1999–2010
Wulumuqi 310 ± 117 381 ± 154 381 ± 85
Source [28]
2.4 Climate Change in Urumqi Region 27
climate station in relation to urban areas and the warming trend in NorthernXinjiang. Individual stations might suffer biases and require treatment on a case-by-case basis due to local geography and climate. However, these adjustmentalgorithms may not be applicable to other stations and parts of the world [38].
2.4.2 Consequences for Glacier and Melt Water
Snow and glacier melt water are important for the water supply of Urumqi Citydue to its location, but climate change will also influence these two parameters ofthe hydrological system. Variations in temperature and precipitation affect thesnow cover by determining snow fall and snow melt, albedo and surface energybudget or indirect feedbacks (e.g. summer moisture) [39]. For extratropical gla-ciers, glacier mass balance reacts to changes in temperature and precipitation inseveral ways: the location of the equilibrium line between ice accumulation andablation is mainly controlled by temperature, while the rate of accumulation andthe rate of ablation depend on snowfall as well as temperature and ice albedo,respectively.
With regard to snow fall and snow cover, [40] investigated the hydrologicalprocesses in subalpine forests during winter and modelled the system’s response toclimatic change. According to their model, the rise in air temperature led to ahigher proportion of rainfall in winter and the annually average snow depth wasreduced by 25 % �C-1. Aizen et al. [7] also state that an increase in air tem-pertature is accompanied by more liquid precipitation in the Tianshan Mountainsfrom the middle of the twentieth century to the present lead to a decrease in snowresources. In contrast, according to Qin et al. [41] no trends in snow depth or snowcover were detected in Western China since 1957 (cited in [39]). The effects onfreezing depths were ambiguous, thinner snow depths increased the freezing depthunder less isolating snow cover and rising temperatures decreased the freezingunder not snow covered areas. The decrease of snow cover due to increasingtemperatures would be compensated by increasing precipitation values. Whetherthe increase of precipitation would also increase runoff could not be evaluated asthe simulated changes of winter precipitation were too low [40].
On a global level, glaciers reportedly react to the rising temperatures due toclimate change. Meehl et al. [42] calculated a global average glacier and ice caps(all land ice except for the ice sheets of Greenland and Antarctica) surface massbalance sensitivity of -0.32–0.41 m year-1 �C-1 for a geographically and sea-sonally uniform rise in global temperature. However, these global average sensi-tivities cannot be used for local projections, which have to consider regional andseasonal temperature changes [37, 42]. Generally, precipitation can outweigh theloss of glacier mass due to increases in surface air temperature and ice melt: Meehlet al. [42] cite that an increase in precipitation of 20–50 % �C-1 is required tobalance increased ablation representing a variety of climatic regimes. Whether thisassumption can be applied depends on many local factors (local climate change,
28 2 Research Area
reaction of glacier to climate). Aizen et al. [7] reported for different regions in theTianshan different longterm trends of the key hydroclimatic variables such assurface air temperature, precipitation, runoff, glacier mass, and snow thickness. Ingeneral, surface air temperature increased as well as precipitation, but also adecrease in snow resources and glaciers was observed. The annual runoff corre-sponds with the type of precipitation (liquid or solid) and glacier behaviour: ‘‘Overthe last few decades, periods of glacier decline have coincided with declining riverrunoff’’ [7, pp. 1,393].
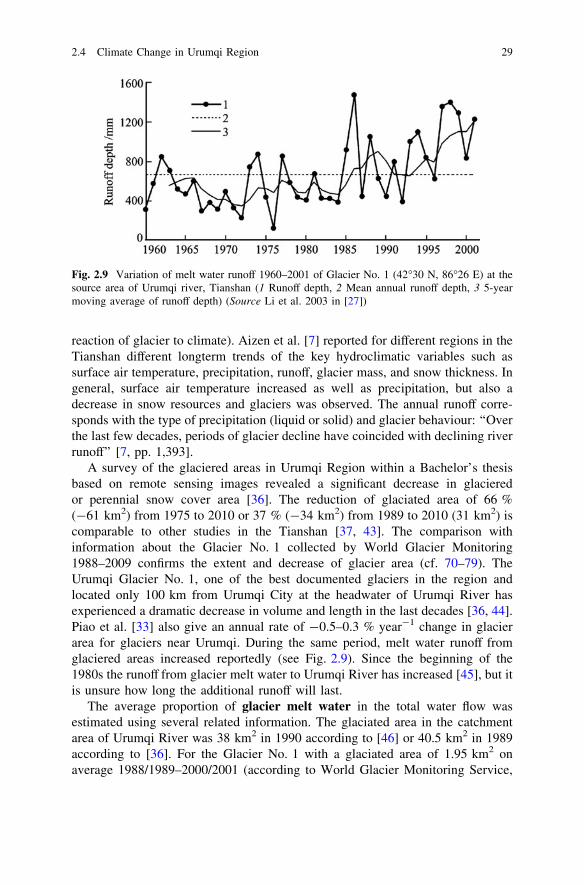
A survey of the glaciered areas in Urumqi Region within a Bachelor’s thesisbased on remote sensing images revealed a significant decrease in glacieredor perennial snow cover area [36]. The reduction of glaciated area of 66 %(-61 km2) from 1975 to 2010 or 37 % (-34 km2) from 1989 to 2010 (31 km2) iscomparable to other studies in the Tianshan [37, 43]. The comparison withinformation about the Glacier No. 1 collected by World Glacier Monitoring1988–2009 confirms the extent and decrease of glacier area (cf. 70–79). TheUrumqi Glacier No. 1, one of the best documented glaciers in the region andlocated only 100 km from Urumqi City at the headwater of Urumqi River hasexperienced a dramatic decrease in volume and length in the last decades [36, 44].Piao et al. [33] also give an annual rate of -0.5–0.3 % year-1 change in glacierarea for glaciers near Urumqi. During the same period, melt water runoff fromglaciered areas increased reportedly (see Fig. 2.9). Since the beginning of the1980s the runoff from glacier melt water to Urumqi River has increased [45], but itis unsure how long the additional runoff will last.
The average proportion of glacier melt water in the total water flow wasestimated using several related information. The glaciated area in the catchmentarea of Urumqi River was 38 km2 in 1990 according to [46] or 40.5 km2 in 1989according to [36]. For the Glacier No. 1 with a glaciated area of 1.95 km2 onaverage 1988/1989–2000/2001 (according to World Glacier Monitoring Service,
Fig. 2.9 Variation of melt water runoff 1960–2001 of Glacier No. 1 (42�30 N, 86�26 E) at thesource area of Urumqi river, Tianshan (1 Runoff depth, 2 Mean annual runoff depth, 3 5-yearmoving average of runoff depth) (Source Li et al. 2003 in [27])
2.4 Climate Change in Urumqi Region 29
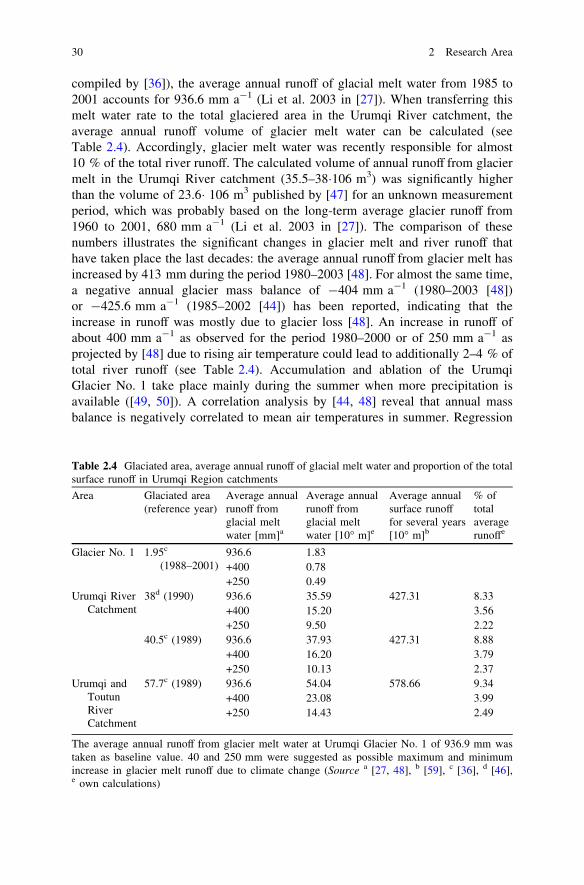
compiled by [36]), the average annual runoff of glacial melt water from 1985 to2001 accounts for 936.6 mm a-1 (Li et al. 2003 in [27]). When transferring thismelt water rate to the total glaciered area in the Urumqi River catchment, theaverage annual runoff volume of glacier melt water can be calculated (seeTable 2.4). Accordingly, glacier melt water was recently responsible for almost10 % of the total river runoff. The calculated volume of annual runoff from glaciermelt in the Urumqi River catchment (35.5–38�106 m3) was significantly higherthan the volume of 23.6� 106 m3 published by [47] for an unknown measurementperiod, which was probably based on the long-term average glacier runoff from1960 to 2001, 680 mm a-1 (Li et al. 2003 in [27]). The comparison of thesenumbers illustrates the significant changes in glacier melt and river runoff thathave taken place the last decades: the average annual runoff from glacier melt hasincreased by 413 mm during the period 1980–2003 [48]. For almost the same time,a negative annual glacier mass balance of -404 mm a-1 (1980–2003 [48])or -425.6 mm a-1 (1985–2002 [44]) has been reported, indicating that theincrease in runoff was mostly due to glacier loss [48]. An increase in runoff ofabout 400 mm a-1 as observed for the period 1980–2000 or of 250 mm a-1 asprojected by [48] due to rising air temperature could lead to additionally 2–4 % oftotal river runoff (see Table 2.4). Accumulation and ablation of the UrumqiGlacier No. 1 take place mainly during the summer when more precipitation isavailable ([49, 50]). A correlation analysis by [44, 48] reveal that annual massbalance is negatively correlated to mean air temperatures in summer. Regression
Table 2.4 Glaciated area, average annual runoff of glacial melt water and proportion of the totalsurface runoff in Urumqi Region catchments
Area Glaciated area(reference year)
Average annualrunoff fromglacial meltwater [mm]a
Average annualrunoff fromglacial meltwater [10� m]e
Average annualsurface runofffor several years[10� m]b
% oftotalaveragerunoffe
Glacier No. 1 1.95c
(1988–2001)936.6 1.83+400 0.78+250 0.49
Urumqi RiverCatchment
38d (1990) 936.6 35.59 427.31 8.33+400 15.20 3.56+250 9.50 2.22
40.5c (1989) 936.6 37.93 427.31 8.88+400 16.20 3.79+250 10.13 2.37
Urumqi andToutunRiverCatchment
57.7c (1989) 936.6 54.04 578.66 9.34+400 23.08 3.99+250 14.43 2.49
The average annual runoff from glacier melt water at Urumqi Glacier No. 1 of 936.9 mm wastaken as baseline value. 40 and 250 mm were suggested as possible maximum and minimumincrease in glacier melt runoff due to climate change (Source a [27, 48], b [59], c [36], d [46],e own calculations)
30 2 Research Area
results of the relationship between mean air temperature, glacier mass balance andmelt water runoff ‘‘suggest that the 1 �C summer temperature change leads to486 mm glacier mass loss and 250 mm runoff change’’ ([48]: Climate Change andGlacier Response).
2.5 Water Problems
Despite the advantageous location on the foot of the Tianshan Mountains, Urumqiexperiences several problems related to water supply and consumption. They havealready been illustrated by [2], so the most important ones will be presented in thissubsection. Due to the continental climate and high temperatures, a large amountof precipitation is lost to transpiration and especially evaporation as soon as it isput into use, during transport and storage in the open canal and reservoir system orcommon flood irrigation [51]. This leads to reduced water flow and an increasingconcentration of minerals and pollutants further away from the headwater of thestream. The continuous dynamic economic development of the region is the causefor other hydrological problems [52]. The growth of economy and population leadsto a growing direct (drinking, hygiene, production) and indirect water demand(water-intensive food production or production of needed goods). If the economyand population are growing too fast, water demand will rise despite adaptation ofdemand and a general reduction of the per capita water consumption which hasbeen documented for Urumqi City [53]. Simultaneously, water consumption risesdue to the (also increasing) standard of living, the distribution of water, newrequirements for water supply and discharge of pollutants and waste water willbecome one of the largest challenges for urban infrastructure and municipalgovernments [53].
The increased water demand during the last 20–30 years led to a pronouncedoverexploitation of surface and groundwater resources [53] and a demand-drivenwater scarcity which is measured by the use-to-availability indicator or con-sumption ratio as introduced before. In 2007, the consumption ratio in UrumqiRegion was on average 74 %, 89 % for the surface and 62 % for the groundwaterresources [54]. According to [55], this indicates that the extraction exceeds theappropriate level and is threatening the environmental flow necessary for theaquatic ecosystems. The population-driven water shortage is measured by thenumber of people per 106 m3 available water resources per year, also called watercrowding [55]. The value was 1,953 inhabitants per 106 m3 available waterresources per year for Urumqi in [54] and indicates real and severe water shortage.
A decrease of river flows to the downstream basins could be observed, whichled to a continuous deterioration of natural vegetation and large scale landdesertification (cf. [5, 23]). The streams coming from the Tianshan Mountains andflowing through Urumqi City and the green belt are increasingly used, dry upfaster and sooner than before [56]. Only 4 % of the original surface water flow isavailable to the environment, further increasing the risk of degradation and
2.4 Climate Change in Urumqi Region 31
desertification [57]. The water diverted for irrigation evapotranspirates instead ofsustaining river flow or infiltration into the groundwater. Falling groundwatertables below the city indicate a reduced recharge and unsustainable consumptionrate (cf. [54, 58, 59]). Zhou et al. [5] hold the irrigation water demand, sealed man-made reservoirs, canals, and diverted river flows accountable for the reduction ofgroundwater recharge in the Gobi zone. Due to the lower groundwater tables,percolation and springs outflows out of the alluvial fan joining the surface waterflow to the terminal lakes have been reduced as well.
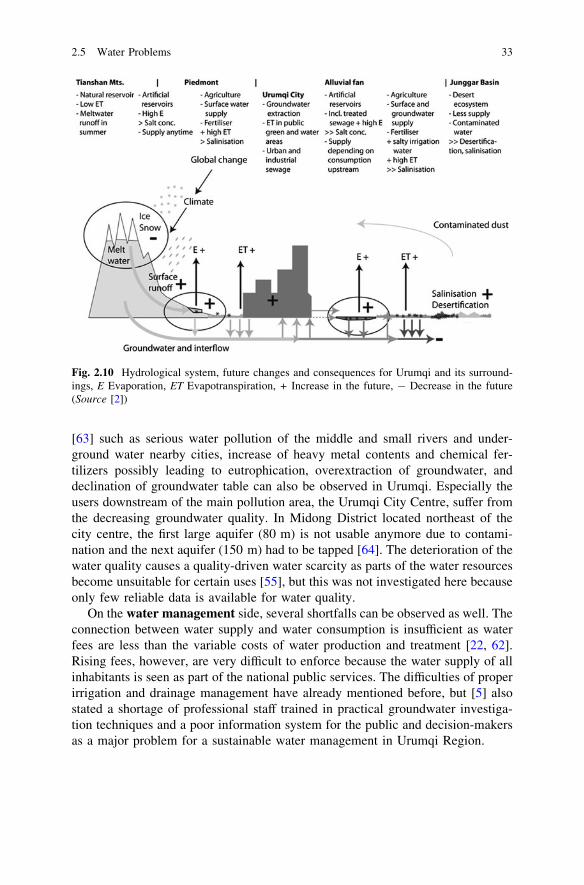
High evapotranspiration rates and insufficient irrigation and drainagemanagement lead to the accumulation of pollutants and salts on the agriculturalfields and soil salinisation on the middle sections of the downward slope from themountains to the semi-arid basin [5]. Overirrigation can also cause risinggroundwater tables in certain areas and secondary salinisation when the capillaryforces transports water to the surface where it is evaporated and leaves the solidsubstances behind. Wang and Cheng [60] reported that almost 20 % of the cul-tivated area in Urumqi was classified as salinised by the end of the 1990s. Thedisplacement and expansion of agricultural areas to the north by the enlargingurban area led to more agriculture in areas with less advantegous pedological andhydrological prerequisites. The pastoral area used by cattle husbandry is alsodiminished and threatening the livelihood of stock breeders in this area mostlycoming from other ethnic groups than the Han majority in Urumqi. Thus, theexpansion could also increase the social and ethnic conflict potential [61].Growing water withdrawal for the newly reclaimed areas and less groundwaterinfiltration on the sealed areas aggravates this situation. Another problem con-nected to the hydrological system is the air pollution over Urumqi City. With thestrong Northwest winds, the accumulated pollutants are blown out of the dried updownstream basins and agricultural fields and transported to Urumqi urban area inthe South as illustrated in Fig. 2.10.
The quality of surface water is generally poor due to the high consumptionrate and pollution through sewage discharge and transportation of waste. One ofthe most polluted rivers in Xinjiang due to the high density of larger industries andsmaller enterprises along its water side is the Shuimo River, which flows parallelto the Urumqi River [56]. Urumqi has an annual total wastewater discharge of144.9�106 m3 and an average amount of waste water treated of 74.96�106 m3 peryear (1996–2007), i.e. the average treatment rate was 52.37 % [62]. Since 2009and the operation of a new treatment plant the estimated treatment capacity of alltreatment plants at a national discharge standard of at least class ‘II’ (GB18918-2002) was 0.7353�106 m3 per day. Despite the large capacity, the average amountof treated waste water in Urumqi City was only 0.1912�106 m3 per day, averaging25 % of the treatment capacity. Both treatment rate and degree of capacity util-isation need to be improved. A remaining problem is furthermore the untreatedsewage in the past that led to an accumulation of pollutants and particles in thereservoirs below the city [2]. Because large amounts of pollutants are disseminatedinto the hydrological system and less water is available for their dilution,groundwater bodies become more and more polluted. Major problems stated by
32 2 Research Area
[63] such as serious water pollution of the middle and small rivers and under-ground water nearby cities, increase of heavy metal contents and chemical fer-tilizers possibly leading to eutrophication, overextraction of groundwater, anddeclination of groundwater table can also be observed in Urumqi. Especially theusers downstream of the main pollution area, the Urumqi City Centre, suffer fromthe decreasing groundwater quality. In Midong District located northeast of thecity centre, the first large aquifer (80 m) is not usable anymore due to contami-nation and the next aquifer (150 m) had to be tapped [64]. The deterioration of thewater quality causes a quality-driven water scarcity as parts of the water resourcesbecome unsuitable for certain uses [55], but this was not investigated here becauseonly few reliable data is available for water quality.
On the water management side, several shortfalls can be observed as well. Theconnection between water supply and water consumption is insufficient as waterfees are less than the variable costs of water production and treatment [22, 62].Rising fees, however, are very difficult to enforce because the water supply of allinhabitants is seen as part of the national public services. The difficulties of properirrigation and drainage management have already mentioned before, but [5] alsostated a shortage of professional staff trained in practical groundwater investiga-tion techniques and a poor information system for the public and decision-makersas a major problem for a sustainable water management in Urumqi Region.
Fig. 2.10 Hydrological system, future changes and consequences for Urumqi and its surround-ings, E Evaporation, ET Evapotranspiration, + Increase in the future, - Decrease in the future(Source [2])
2.5 Water Problems 33
In a nutshell, the demand-driven water scarcity (see also Sects. 2.2 and 2.3) isprone to worsen due to the socio-economic development despite the quite adv-antegeous situation at the Tianshan Mountains. At the same time, the effects ofclimate change on the hydrological system and water availability in the future areunsure and spatially variable (see Sects. 1.2.7 and 2.4) potentially inducing aclimate-driven water scarcity [55]. To predict the consequences for UrumqiRegion, on the one hand a water balance model simulating the water availabilitywill be presented in the next chapters, on the other the water demand will beprojected in Chap. 6.
References
1. Schultz, J. (2002). Die Ökozonen der Erde: 17 Tabellen, 5 Kästen. Ulmer, Stuttgart (UTBGeowissenschaften, Ökologie, Agrarwissenschaften, 1514), p. 320.
2. Fricke, K., Sterr, T., Bubenzer, O., & Eitel, B. (2009). The oasis as a mega city: Urumqi’s fasturbanisation in a semi-arid environment. Die Erde, 140(4), 449–463.
3. Jia, B., Zhang, Z., Ci, L., Ren, Y., Pan, B., & Zhang, Z. (2004). Oasis land-use dynamics andits influence on the oasis environment in Xinjiang China. Journal of Arid Environments,56(1), 11–26.
4. Dowamat, T. (1993). Xinjiang—My beloved home (452 p). Urumqi: Xinjiang People’sPublishing House.
5. Zhou, Y., Nonner, J. C., Li, W., et al. (2007). Strategies and techniques for groundwaterresources development in northwest China. Beijing: China Land Press, 338 p.
6. Autonomous Region Bureau of Surveying and Mapping (2004). Xinjiang-Weiyu’er-Zizhiqu-dituji: Xinjiang Uygur Autonomous Region Atlas (307 p). Beijing: Zhongguo ditu chubanshe.
7. Aizen, V. B., Aizen, E. M., Melack, J. M., & Dozier, J. (1997). Climatic and HydrologicChanges in the Tien Shan, Central Asia. Journal of Climate, 10, 1393–1403.
8. Roberts, B. (1987). Die ökologischen Risiken der Stadtentwicklung und Landnutzung inUrumqi, Xinjiang/China. Univ. Studiengang Geographie Fachber. 8, Bremen (BremerBeiträge zur Geographie und Raumplanung, 12), 277 p.
9. Bocco, G., Mendoza, M., & Velázquez, A. (2001). Remote sensing and GIS-based regionalgeomorphological mapping: A tool for land use planning in developing countries.Geomorphology, 39, 211–219.
10. Yuan, G., Lichtenfeld, A., & Stahr, K. (1988). Soils of the Manas River Area in NorthernXinjiang, People’s Republic of China. Zeitschrift für Pflanzenernährung und Bodenkunde,151(3), 152–163.
11. Uhlenbrook, S. (1999). Untersuchung und Modellierung der Abflussbildung in einemmesoskaligen Einzugsgebiet (201 p). Institut für Hydrologie der Universität Freiburg i. Br.,Freiburg (Freiburger Schriften zur Hydrologie, 10).
12. Plate, E. J., Zehe, E., & Maurer, Th. (2008). Einführung. In E. J. Plate & E. Zehe (Eds.),Hydrologie und Stoffdynamik kleiner Einzugsgebiete (pp. 1–28). Stuttgart: Schweizerbart.
13. Roberts, B. R. (1993). Water management in desert environments: A comparative analysis(337 p). Berlin: Springer (Lecture notes in earth sciences, 48).
14. Statistics Bureau of Urumqi (2010). Urumqi Statistical Yearbook 2010 (456 p). Beijing:China Statistics Press.
15. Gruschke, A. (1991). Neulanderschließung in Trockengebieten der VR China und ihreBedeutung für die Nahrungsversorgung der chinesischen Bevölkerung (227 p). Hamburg: IfA.
16. Kolb, A. (1986). Xinjiang als Naturraum und ökologisches Problemgebiet. Geoökodynamik,7, 29–40.
17. Becquelin, N. (2000). Xinjiang in the Nineties. The China Journal, 44, 65–90.
34 2 Research Area
18. Li, R. M. (1989). Migration to China’s Northern Frontier, 1953-1982. Population andDevelopment Review, 15(3), 503–538.
19. Statistics Bureau of Urumqi (2009). Urumqi Statistical Yearbook 2009 (506 p). Beijing:China Statistics Press.
20. Brohmeyer, F. (2011). Klassifikation der Landnutzung und ihrer Veränderung von 1975 bis2007 anhand von Satellitenbildern in der Region Urumqi (Nordwest-China) (53 p).Unpublished bachelor thesis, Ruprecht-Karls-Universität Heidelberg.
21. Dong, W., Zhang, X., Wang, B., & Duan, Z. (2007). Expansion of Urumqi urban area and itsspatial differentiation. Science China Series D: Earth Sciences, 50(Supp. I), 159–168.
22. Fricke, K. (2008). The development of Midong New District, Urumqi, PR China: Ecologicaland historical context and environmental consequences (165 p). Heidelberg University:Unpublished diploma thesis.
23. Chen, M., & Cai, Z. (2000). Groundwater resources and hydro-environmental problems inChina. In M. Chen & Z. Cai (Eds.), Groundwater resources and the related environ-hydrogeologic problems in China (pp. 38–44). Beijing: Seismological Press.
24. Contreras, S., Jobbágy, E. G., Villagra, P. E., Nosetto, M. D., & Puigdefábregas, J. (2011).Remote sensing estimates of supplementary water consumption by arid ecosystems of centralArgentina. Journal of Hydrology, 397(1-2), 10–22.
25. Berkner, A. (1993). Wasserressourcen und ihre Bewirtschaftung in der Volksrepublik China.Petermanns Geographische Mitteilungen, 137(2), 103–126.
26. Zhu, Y., Wu, Y., & Drake, S. (2004). A survey: obstacles and strategies for the developmentof ground-water resources in arid inland river basins of Western China. Journal of AridEnvironments, 59, 351–367.
27. Shi, Y., Shen, Y., Kang, E., Li, D., Ding, Y., Zhang, G., et al. (2007). Recent and futureclimate change in Northwest China. Climatic Change, 80, 379–393.
28. Barth, N. C. (2011). Auswertung der Temperatur- und Niederschlagsdaten von 15Klimastationen im Umkreis von Urumqi (AR Xinjiang, China) (65 p). Unpublishedbachelor thesis, Ruprecht-Karls-Universität Heidelberg.
29. Intergovernmental Panel on Climate Change (IPCC) (2007). Climate change 2007: Synthesisreport (73 p). Retrieved 11 Nov, 2011, from http://www.ipcc.ch/pdf/assessment-report/ar4/syr/ar4_syr.pdf.
30. Le Treut, H., Somerville, R., Cubasch, U., Ding, Y., Mauritzen, C., Mokssit, A., et al. (2007).Historical overview of climate change. In S. Solomon, D. Qin, M. Manning, Z. Chen, M.Marquis, K. B. Averyt et al. (Eds.), Climate change 2007: The physical science basis.Contribution of working group I to the fourth assessment report of the IntergovernmentalPanel on Climate Change (pp. 93–127). Cambridge: Cambridge University Press.
31. Trenberth, K. E., Jones, P. D., Ambenje, P., Bojariu, R., Easterling, D., Klein Tank, A., et al.(2007). Surface and atmospheric climate change. In S. Solomon, D. Qin, M. Manning, Z.Chen, M. Marquis, K. B. Averyt et al. (Eds.), Climate change 2007: The physical sciencebasis. Contribution of working group I to the fourth assessment report of theIntergovernmental Panel on Climate Change (pp. 235–336). Cambridge: CambridgeUniversity Press.
32. Solomon, S., Qin, D., Manning, M., Alley, R. B., Berntsen, T., Bindoff, N. L., et al. (2007).Technical summary. In S. Solomon, D. Qin, M. Manning, Z. Chen, M. Marquis, K. B. Averytet al. (Eds.), Climate change 2007: The physical science basis. Contribution of workinggroup I to the fourth assessment report of the Intergovernmental Panel on Climate Change(pp. 19–91). Cambridge: Cambridge University Press.
33. Piao, S., Ciais, P., Huang, Y., Shen, Z., Peng, S., Li, J. Z., et al. (2010). The impacts ofclimate change on water resources and agriculture in China. Nature, 467, 43–51.
34. Halike, Y., Eitel, B., & Küchler, J. (2008). Wasserverknappung und Wasserkonflikte in derzentralasiatischen Wüstenmetropole Urumqi/NW China. TU International, 61, 12–14.
35. Jiang, F., Zhu, C., Mu, G., & Hu, R. (2005). Magnification of flood disasters and its relation toregional precipitation and local human activities since the 1980s in Xinjiang, NorthwesternChina. Natural Hazards, 36, 307–330.
References 35
36. Fuchs, J. (2011). Multitemporale Detektion der Gletscherveränderung im östlichen Tian Shan(AR Xinjiang, China) im Kontext des Klimawandels: Untersuchungen am Beispiel derFlusseinzugsgebiete von Toutun, Shuixi und Urumqi (69 p). Heidelberg: Unpublishedbachelor thesis, Ruprecht-Karls-Universität Heidelberg.
37. Bolch, T. (2007). Climate change and glacier retreat in northern Tien Shan (Kazakhstan/Kyrgyzstan) using remote sensing data: Climate change impacts on mountain glaciers andpermafrost. Global and Planetary Change, 56(1-2), 1–12.
38. Trenberth, K. E., Jones, P. D., Ambenje, P., Bojariu, R., Easterling, D., Klein Tank, A., et al.(2007). Observations: Surface and atmospheric climate change. In S. Solomon, D. Qin, M.Manning, Z. Chen, M. Marquis, K. B. Averyt et al (Eds.), Climate change 2007: The physicalscience basis. Contribution of working group I to the fourth assessment report of theIntergovernmental Panel on Climate Change (SM.3-1-SM.3-11). Cambridge: CambridgeUniversity Press.
39. Lemke, P., Ren, J., Alley, R. B., Allison, I., Carrasco, J., Flato, G., et al. (2007). Observations:Changes in snow, ice and frozen ground. In S. Solomon, D. Qin, M. Manning, Z. Chen, M.Marquis, K. B. Averyt et al. (Eds.), Climate change 2007: The physical science basis.Contribution of working group I to the fourth assessment report of the IntergovernmentalPanel on Climate Change (pp. 337–383). Cambridge: Cambridge University Press.
40. Stadler, D., Bründl, M., Schneebeli, M., Meyer-Grass, M., & Flühler, H. (1998).Hydrologische Prozesse im subalpinen Wald im Winter (145 p). vdf Hochsch.-Verl. an derETH, Zürich.
41. Qin, D., S. Liu, & P. Li (2006). Snow cover distribution, variability, and response to climatechange in Western China. Journal of Climate, 19, 1820–1833.
42. Meehl, G. A., Stocker, T. F., Collins, W. D., Friedlingstein, P. G., Gregory, J. M., Kitoh, A.,et al. (2007). Global climate projections. In S. Solomon, D. Qin, M. Manning, Z. Chen, M.Marquis, K. B. Averyt et al. (Eds.), Climate change 2007: The physical science basis.Contribution of working group I to the fourth assessment report of the Intergovernmentalpanel on Climate Change (pp. 747–845). Cambridge: Cambridge University Press.
43. Niederer, P., Bilenko, V., Ershova, N., Hurni, H., Yerokhin, S., & Maselli, D. (2008). Tracingglacier wastage in the Northern Tien Shan (Kyrgyzstan/Central Asia) over the last 40 years.Climatic Change, 86, 227–234.
44. Han, T., Ding, Y., Ye, B., Liu, S., & Jiao, K. (2006). Mass-balance characteristics of UrumqiGlacier No. 1, Tien Shan China. Annals of Glaciology, 43, 323–328.
45. Ye, B., & Chen, K. (1997). A model simulating the processes response of Glacier and runoffto climatic change: A case study of Glacier No 1. In the Urumqi River China. ChineseGeographical Science, 7(3), 243–250.
46. Zhang, G., Sang, S., & Wang, X. (1990). Simulation of daily runoff in the Urumqi Riverbasin with the improved tank model. In H. Lang & A. Musy (Eds.), Hydrology inmountainous regions (pp. 693–700). IAHS: Wallingford.
47. Zhou, Y. (1999). River hydrology and water resources in Xinjiang (445 p). Urumqi: XinjiangScience and Technology Publishing House.
48. Ye, B., Yang, D, Jiao, K., Han, T., Jin, Z., Yang, H., & Li, Z. (2005). The Urumqi riversource Glacier No. 1, Tianshan, China. changes over the past 45 years. GeophysicalResearch Letters, 32. doi:10.1029/2005GL024178.
49. Huintjes, E., Li, H., Sauter, T., Li, Z., & Schneider, C. (2010). Degree-day modelling of thesurface mass balance of Urumqi Glacier No. 1, Tian Shan, China. The CryosphereDiscussions, 4, 207–232.
50. Xu, X., Pan, B., Hu, E., Li, Y., & Liang, Y. (2011). Responses of two branches of GlacierNo. 1 to climate change from 1993 to 2005, Tianshan, China. Quaternary International,236(1–2), 143–150.
51. Tao, S., Fu, C., Zeng, Z., & Zhang, Q. (1997). Two long-term instrumental climatic databases of the People’s Republic of China: ORNL:CDIAC-47, NDP039. Oak Ridge NationalLaboratory, TN: Carbon Dioxide Information Analysis Center. Retrieved 25 March, 2009,from http://cdiac.ornl.gov/epubs/ndp/ndp039/ndp039.html.
36 2 Research Area
52. Dong, W., & Zhang, X. (2011). Urumqi. Cities, 28(1), 115–125.53. Du, H., Zhang, X., & Wang, B. (2006). Co-adaptation between modern oasis urbanisation and
water resources exploitation: A case of Urumqi. Chinese Science Bulletin, 51 (Supp. I),189–195.
54. Water Affairs Bureau Urumqi (2007). Water report 2007 (24 p). Urumqi: Water AffairsBureau Urumqi City.
55. Falkenmark, M., Berntell, A., Jägerskog, A., Lundqvits, J., Matz, M., & Tropp, H. (2007). Onthe verge of a new water scarcity: A call for good governance and human ingenuity (19 p).Stockholm: SIWI.
56. Hao, Y. (1997). Water environment and sustainable development along the belt of Xinjiangsection of the new Eurasian continental bridge. Chinese Geographical Science, 7(3),251–258.
57. Babaev, A. G. (1999). Desert problems and desertification in Central Asia: The researches ofthe desert institute (293 p). Berlin: Springer.
58. Water Affairs Bureau Urumqi (2004). Water report 2004 (27 p). Urumqi: Water AffairsBureau Urumqi City.
59. Water Affairs Bureau Urumqi (2005). Water Report 2005 (27 p). Urumqi: Water AffairsBureau Urumqi City.
60. Wang, G., & Cheng, G. (1999). The ecological features and significance of hydrology withinarid inland river basins of China. Environmental Geology, 37(3), 218–222.
61. Hamann, B. (2007). Ökologische und sozioökonomische Entwicklungen am Südrand desDsungarischen Beckens/AR Xinjiang: vor dem Hintergrund des chinesischenTransformationsprozesses in den 90er Jahren des 20. Jahrhunderts (255 p). Dissertation,Technische Universität Berlin.
62. Yao, Y. (2011). Water reuse: A case study of Urumqi, China. In IWA (Ed.), 1st Central AsianRegional Young and Senior Water Professionals Conference 22–23 Sept, 2011. Almaty: CD-ROM.
63. Deng, W., Bai, J., & Yan, M. (2002). Problems and countermeasures of water resources forsustainable utilisation in China. Chinese Geographical Science, 12(4), 289–293.
64. Fricke, K. (2007). Protocol of the excursion to Midong New District October 28th 2007 (4 p),not published.
65. National Oceanic and Atmospheric Administration of the U.S. Department of CommerceNational Climatic Data Centre (NOAA NCDC) (2011). Global summary of the dayWulumuqi station, station number 514630. 22.08.1956–31.12.2010. Retrieved 16 May, 2011,from http://www7.ncdc.noaa.gov/CDO/cdo.
66. Fricke, K., & Bubenzer, O. (2011). Available water resources and water use efficiency inUrumqi, PR China. In: German Academic Exchange Service (Ed.), Future megacities inbalance young researchers’ symposium in Essen 9–10 Oct, 2010. DAAD Dok and Mat, 66,134–140.
67. Bruns, B. R., Ringler, C., & Meinzen-Dick, R. (2005). Water rights reform—Lessons forinstitutional design (360 p). Washington, DC: International Food Policy Research Institute.
68. Brunotte, E., Martin, C., Gebhardt, H., Meurer, M., Meusburger, P., Nipper, J., et al. (Eds.)(2002). Gast bis Ökol (426 p). Heidelberg, Berlin Spektrum Akad. Verl. (Lexikon derGeographie, 2).
69. Zhang, X., Zhou, K., & Ahati, J. (2011). Natural resources of arid Metropolitan Urumqi (223p). Urumqi: Xinjiang Art and Photography Publishing House.
70. WGMS (1991). Glacier mass balance bulletin No. 1 (1988–1989) (70 p). Zürich: IAHS(ICSI)/UNEP/UNESCO, World Glacier Monitoring Service.
71. WGMS (1993). Glacier mass balance bulletin No. 2 (1990–1991) (74 p). Zürich: IAHS(ICSI) / UNEP / UNESCO, World Glacier Monitoring Service.
72. WGMS (1994). Glacier mass balance bulletin No. 3 (1992–1993) (80 p). Zürich: IAHS(ICSI) / UNEP / UNESCO, World Glacier Monitoring Service.
73. WGMS (1996): Glacier mass balance bulletin No. 4 (1994–1995) (90 p). Zürich: IAHS(ICSI) / UNEP / UNESCO, World Glacier Monitoring Service.
References 37
74. WGMS (1999): Glacier mass balance bulletin No. 5 (1996–1997) (96 p). Zürich: IAHS(ICSI) / UNEP / UNESCO. World Glacier Monitoring Service.
75. WGMS (2001): Glacier mass balance bulletin No. 6 (1998–1999) (93 p). Zürich: IAHS(ICSI) / UNEP / UNESCO / WMO, World Glacier Monitoring Service.
76. WGMS (2003): Glacier mass balance bulletin No. 7 (2000–2001) (87 p). Zürich: IAHS(ICSI) / UNEP / UNESCO / WMO, World Glacier Monitoring Service.
77. WGMS (2005): Glacier mass balance bulletin No. 8 (2002–2003) (100 p). Zürich: IUGG(CCS) / UNEP / UNESCO / WMO, World Glacier Monitoring Service.
78. WGMS (2007): Glacier mass balance bulletin No. 9 (2004–2005) (100 p). Zürich: IUGG(IACS) / UNEP / UNESCO / WMO, World Glacier Monitoring Service.
79. WGMS (2009): Glacier mass balance bulletin No. 10 (2006–2007) (96 p). Zürich: ICSU(WDS) / IUGG (IACS) / UNEP / UNESCO / WMO, World Glacier Monitoring Service.
80. U.S. Geological Survey (2005). Shuttle Radar Topography Mission, Version 2, 3-arc secondresolution. Global Land Cover Facility, University of Maryland, College Park, Maryland.Retrieved 31 Jan, 2008, from http://glcf.umiacs.umd.edu/data/srtm/index.shtml.
81. NASA Landsat Program (2010). Landsat ETM+ scenes L1T, USGS, Sioux Falls. Retrievedfrom http://glovis.usgs.gov/.
82. U.S. Geological Survey & Japan ASTER Programme (2009). ASTER GDEM Version 1.NASA Land Processes Distributed Active Archive Center, Sioux Falls. Retrieved from 15Jul, 2009. http://earthexplorer.usgs.gov/.
38 2 Research Area

http://www.springer.com/978-3-319-01609-2