Embed Size (px)
Citation preview

33
CHAPTER 2
REVIEW OF LITERATURE
Research on biometric methods has gained renewed attention in recent
years brought on by an increase in security concerns. The recent world attitude
towards terrorism has influenced people and their governments to take action
and be more proactive in security issues. This need for security also extends to
the need for individuals to protect, among other things, their working
environments, homes, personal possessions and assets. Many biometric
techniques have been developed and are being improved with the most
successful being applied in everyday law enforcement and security
applications. Biometric methods include several state-of-the-art techniques.
Among them, fingerprint recognition is considered to be the most powerful
technique for utmost security authentication.
Advances in sensor technology and an increasing demand for biometrics
are driving a burgeoning biometric industry to develop new technologies. As
commercial incentives increase, many new technologies for person
identification are being developed, each with its own strengths and weaknesses
and a potential niche market. This chapter reviews some well-known
biometrics with special emphasis to fingerprint.
2.1. BIOMETRIC SECURITY : FROM 1950-2012
The term “Biometrics” is derived from the Greek words “bio” (life) and
“metrics” (to measure) (Rood and Hornak, 2008). Automated biometric
systems have only become available over the last few decades, due to the
significant advances in the field of computer and image processing. Although
biometric technology seems to belong in the twenty first century, the history of
biometrics goes back thousands of years. The ancient Egyptians and the
Chinese played a large role in biometrics history. Today, the focus is on using
biometric face recognition, iris recognition, retina recognition and identifying
34
characteristics to stop terrorism and improve security measures. This section
provides a brief history on biometric security and fingerprint recognition.
During 1858, the first recorded systematic capture of hand and finger
images for identification purposes was used by Sir William Herschel, Civil
Service of India, who recorded a handprint on the back of a contract for each
worker to distinguish employees (Komarinski, 2004).
During 1870, Alphonse Bertillon developed a method of identifying
individuals based on detailed records of their body measurements, physical
descriptions and photographs. This method was termed as “Bertillonage” or
anthropometrics and the usage was aborted in 1903 when it was discovered that
some people share same measurements and physical characteristics (State
University of New York at Canton, 2003).
Sir Francis Galton, in 1892, developed a classification system for
fingerprints using minutiae characteristics that is being used by researchers and
educationalists even today. Sir Edward Henry, during 1896, paved way to the
success of fingerprint recognition by using Galton's theory to identify prisoners
by their fingerprint impressions. He devised a classification system that
allowed thousands of fingerprints to be easily filed, searched and traced. He
helped in the first establishment of fingerprint bureau in the same year and his
method gained worldwide acceptance for identifying criminals (Scottish
Criminal Record Office, 2002).
The concept of using iris pattern for identification was first proposed by
Ophthalmologist Frank Burch in 1936 (Iradian Technologies, 2003). During
1960, the first semi-automatic face recognition system was developed by
Woodrow W. Bledsoe, which used the location of eyes, ears, nose and mouth
on the photographs for recognition purposes. In the same year, the first model
of acoustic speech production was creased by a Swedish Professor, Gunnar
Fant. His invention is used in today's speaker recognition system (Woodward
et al, 2003).

35
The first automated signature recognition system was developed by
North American Aviation during 1965 (Mauceri, 1965). This technique was
later, in 1969, used by Federal Bureau of Investigation (FBI) in their
investigations to reduce man hours invested in the analysis of signatures. The
year 1970 introduced face recognition towards authentication. Goldstein et al.
(1971) used 21 specific markers such as hair color, lip thickness to automate
the recognition process. The main disadvantage of such a system was that all
these features were manually identified and computed.
During the same period, Dr.Joseph Perkell produced the first behavioral
components of speech to identify a person (Woodward et al, 2003). The first
commercial hand geometry system was made available in 1974 for physical
access control, time and attendance and personal identification. The success of
this first biometric automated system motivated several funding agencies like
FBI Fund, NIST for the development of scanners and feature extraction
technology (Ratha and Bolle, 2004), which will finally lead to the development
of a perfect human recognizer. This resulted in the first prototype of speaker
recognition system in 1976, which was developed by Texas instruments and
was tested by US Air Force and the MITRE Corporation. In 1996, the hand
geometry was implemented successfully at the Olympic Games and the system
implemented was able to handle the enrollment of over 65,000 people.
Drs. Leonard Flom and Aran Safir, in 1985, found out that no two irises
are alike and their findings were awarded a patent during 1986. In the year
1988, the first semi-automated facial recognition system was deployed by
Lakewood Division of Los Angeles Country Sheriff's Department for
identifying suspects (Angela, 2009). This was followed by several land marked
contributiona by Sirovich and Kirby (1989), Turk and Pentland (1991), Philipis
et al. (2000) in the field of face recognition.
The next stage in fingerprint automation occurred at the end of 1994
with the Integrated Automated Fingerprint Identification System (IAFIS)
36
competition. The competition identified and investigated three major
challenges:
(1) digital fingerprint acquisition
(2) local ridge characteristic extraction and
(3) ridge characteristic pattern matching (David et al., 2005).
The first Automated Fingerprint Identification System (AFIS) was developed
by Palm System in 1993. During 1995, the iris biometric was officially released
as a commercial authentication tool by Defense Nuclear Agency and Iriscan.
The year 2000 envisaged the first face recognition vendor test (FRVT,
2000) sponsored by the US Government agencies and the same year paved way
for the first research paper on the use of vascular patterns for recognition (Im
et al., 2001). During 2003, ICAO (International civil Aviation Organization)
adopted blueprints for the integration of biometric identification information
into passports and other Machine Readable Travel Documents (MRTDs).
Facial recognition was selected as the globally interoperable biometric for
machine-assisted identity confirmation with MRTDs.
The first statewide automated palm print database was deployed by the
US in 2004. The Face Recognition Grand Challenge (FRGC) began in the same
year to improve the identification problem. In 2005, Iris on the move was
announced by Biometric Consortium Conference for enabling the collection of
iris images from individuals walking through a portal.
2.2. FINGERPRINT RECOGNITION SYSTEM – PAST TO PRESENT
Fingerprint imaging technology has been in existence for centuries.
Archaeologists have uncovered evidence suggesting that interest in fingerprints
dates to prehistory.
In Nova Scotia petroglyphs (from the time of pre-historic Native
Americans) showing a hand with exaggerated ridge patterns has been
37
discovered. In ancient Babylon and China, fingerprints were impressed on clay
tablets and seals. The use of fingerprints as a unique human identifier dates
back to second century B.C. China, where the identity of the sender of an
important document could be verified by his fingerprint impression in the wax
seal (Ruggles, 1996). In fourteenth-century Persia fingerprints were impressed
on various official papers. At that time, a governmental official observed that
no two fingerprints were exactly alike.
Using the newly invented microscope, Professor Marcello Malpighi at
the University of Bologna noted ridges on the surface of fingers in 1686. He
described them as loops and spirals but did not note their value as a means of
personal identification. Later, in 1823 at the University of Breslau, Professor
John Evangelist Purkinje published his thesis proposing a system of
classification based on 9 different fingerprint patterns. This was the first step
towards the modern study of fingerprints.
The first modern use of fingerprints occurred in 1856 when Sir William
Herschel, the Chief Magistrate of the Hooghly district in Jungipoor, India, had
a local businessman, Rajyadhar Konai, impress his handprint on the back of a
contract. Later, the right index and middle fingers were printed next to the
signature on all contracts made with the locals. The purpose was to frighten the
signer of repudiating the contract because the locals believed that personal
contact with the document made it more binding. As his fingerprint collection
grew, Sir Herschel began to realize that fingerprints could prove or disprove
identity. Despite his lack of scientific knowledge in fingerprinting he was
convinced that fingerprints are unique and permanent throughout life.
The French anthropologist, Alphonse Bertillon, devised the first widely
accepted scientific method of biometric identification in 1870. The Bertillon
system, Bertillonage, or anthropometry was not based on fingerprinting but
relied on a systematic combination of physical measurements. These, among
others, included measurements of the skull width, foot length, and the length of
38
the left middle finger combined with hair color, eye color, as well as face and
profile pictures. By grouping the data any single person could be placed into
one of 243 distinct categories. For the next thirty years, Bertillonage was the
primary method of biometric identification.
Dr. Henry Faulds, British Surgeon-Superintendent of the Tsukiji
Hospital in Tokyo, took up the study of fingerprints in the 1870’s after noticing
finger imprints on prehistoric pottery. In 1880, in the October 28 issue of the
British scientific periodical Nature, Dr. Faulds was the first to publish a
scientific account of the use of fingerprint as a means of identification. In
addition to recognizing the importance of fingerprints, for identification he
devised a method of classification as well. Dr. Faulds is credited for the first
fingerprint identification-based on a fingerprint left on an alcohol bottle. The
method of classification proposed by Dr. Faulds is called Henry Classification
system and is based on patterns such as loops and whorls, which is still used
today to organize fingerprint card files.
Continuing the work of Dr. Faulds, Sir William Herschel and Sir Francis
Galton established the individuality and permanence of fingerprints. This book,
“Fingerprints” from 1892, contains the first fingerprint classification system
containing three basic pattern types: loop, arch, and whorl. The system was
based on the distribution of the pattern types on the ten fingers, e.g. LLAWL
LWWLL. The system worked, but was yet to be improved with a classification
that was easier to administer. Sir Galton identified the characteristics used for
personal identification, the unique ridge characteristics known as minutiae,
which are often referred to as “Galton’s details”.
In 1892, Juan Vecetich, an Argentine Police official, made the first
criminal fingerprint identification. He was able to identify a woman, who had
murdered her two sons and cut her own throat in an attempt to avoid blame.
Her bloody print was left on a doorpost, proving her identity as the murderer.

39
2.2.1. Shift from Bertillonage to fingerprinting
During the 1890’s, Sir Edward Richard Henry, a British official in
Bengal believed that a fingerprinting system was the solution to his problem of
verifying the identity of criminals. He studied the works of Sir Galton and Sir
Henry and proved that they could be used to produce 1,024 primary
classifications, which was instituted in Bengal in 1897. The system is described
in his book, “Classification and Uses of Finger Prints”. In June 1897,
Bertillonage was replaced and the Henry Classification System became the
official method of identifying criminals in British India.
In 1901, Sir Henry, established the first fingerprint files in London.
Subsequently, within the next 25 years, the Henry Classification System was
adopted as the universally accepted method of personal identification by law
enforcement agencies throughout the world. It is still in use, though several
variants of the Henry Classification System exist.
In 1903, the Henry classification system was used to differentiate two
prisoners who were identical twins. The Bertillon system was not able to make
out the difference between identical twins and thus Henry classification system
was further strengthened.
Juan Vucetich also worked on a classification system based on the
findings of Sir Galton and years of experience in fingerprint forensics. His
system was published in his book, “Dactiloscopía Comparada” (Comparative
Fingerprinting) in 1904. His system, the Vucetich System, is still used in most
Spanish-speaking countries.
During the first 25 years of the 1900s, more and more agencies in the
U.S. started to send copies of their fingerprint cards to the National Bureau of
Criminal Identification. These files formed the nucleus of the FBI fingerprint
files when the Identification Division of the FBI was established in 1924. By
1946, the FBI had processed more than 100 million fingerprint cards in
40
manually maintained files. By 1971, this number had increased to 200 million
cards. The first country to adopt a national computerized form of fingerprint
imaging was Australia in 1986, which implemented fingerprint imaging
technology into its law enforcement system.
With the introduction of AFIS technology (Automated Fingerprint
Identification System), the files were split into computerized criminal files and
manually maintained civil files. Many files were found to be duplicated and the
records actually represented somewhere between 25 and 30 million criminals
and an unknown number of individuals in the civil files.
2.2.2. Fingerprint Features
While considering the various features involved with fingerprint
recognition, Galton introduced Level 2 features by defining minutiae points as
either ridge endings or ridge bifurcations on a local ridge. He also developed a
probabilistic model using minutiae points to quantify the uniqueness of
fingerprints (Galton, 1965). Although Galton discovered that sweat pores can
also be observed on the ridges, no method was proposed to utilize pores for
identification.
In 1912, Locard introduced the science of poroscopy, the comparison of
sweat pores for the purpose of personal identification (Locard, 1912). Locard
stated that like the ridge characteristics, the pores are also permanent,
immutable, and unique, and are useful for establishing the identity, especially
when a sufficient number of ridges are not available. Locard further studied the
variation of sweat pores and proposed four criteria that can be used for pore
based identification: the size of the pores, the form of the pores, the position of
the pores on the ridges and the number or frequency of the pores (Wentworth
and Wilder, 1932). It was observed that the number of pores along a centimeter
of ridge varies from 9 to 18, or 23 to 45 pores per inch and 20 to 40 pores
should be sufficient to determine the identity of a person (Ashbaugh, 1999).
41
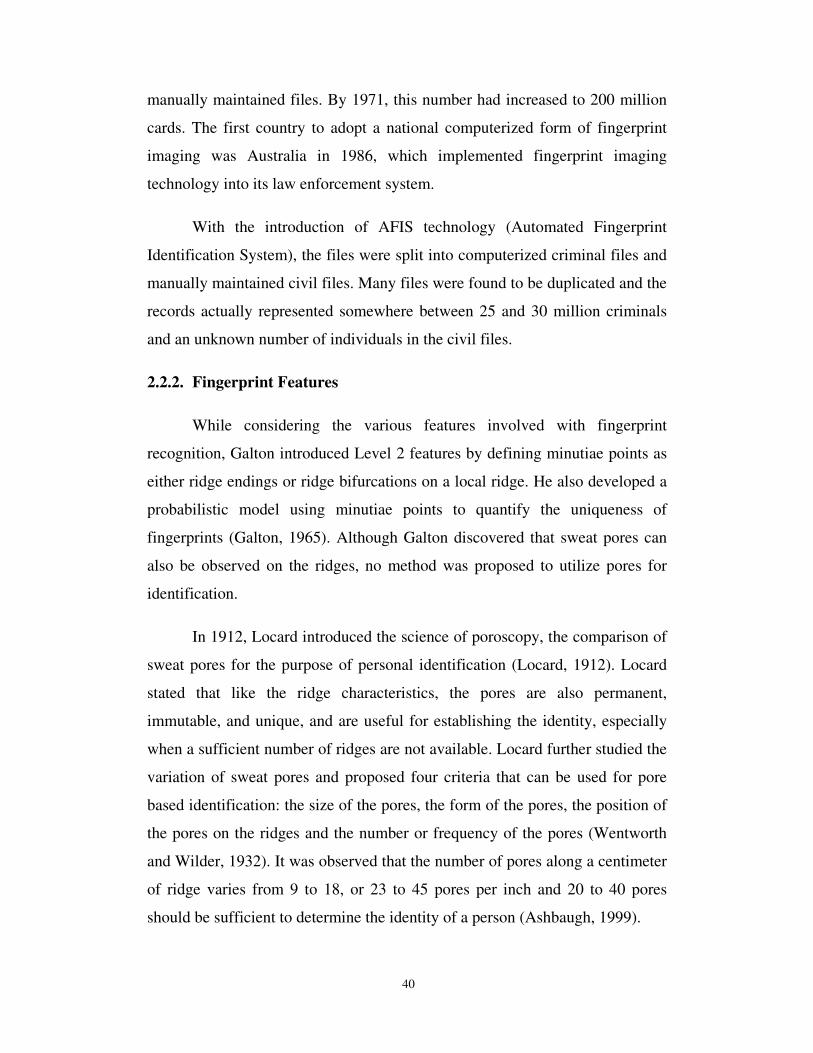
In particular, pores provide essential information for fragmentary latent
or partial print examination since the number of minutiae points in latent
fragment prints is often too few. One such example is given in Figure 2.1a and
2.1b, where two fingerprint segments from different fingers with only one
minutia is present. The two figures show a bifurcation at the same location on
similar patterns. Normal examination would find them in agreement, but their
relative pore locations differ. Even with this small sized print, it was possible to
extract about 20 pores in these images which are sufficient to successfully
determine a match or non-match between the two prints.
Figure 2.1 : Role of Pores in Fragmentary Latent Print Examination (Source : Ashbaugh, 1999)
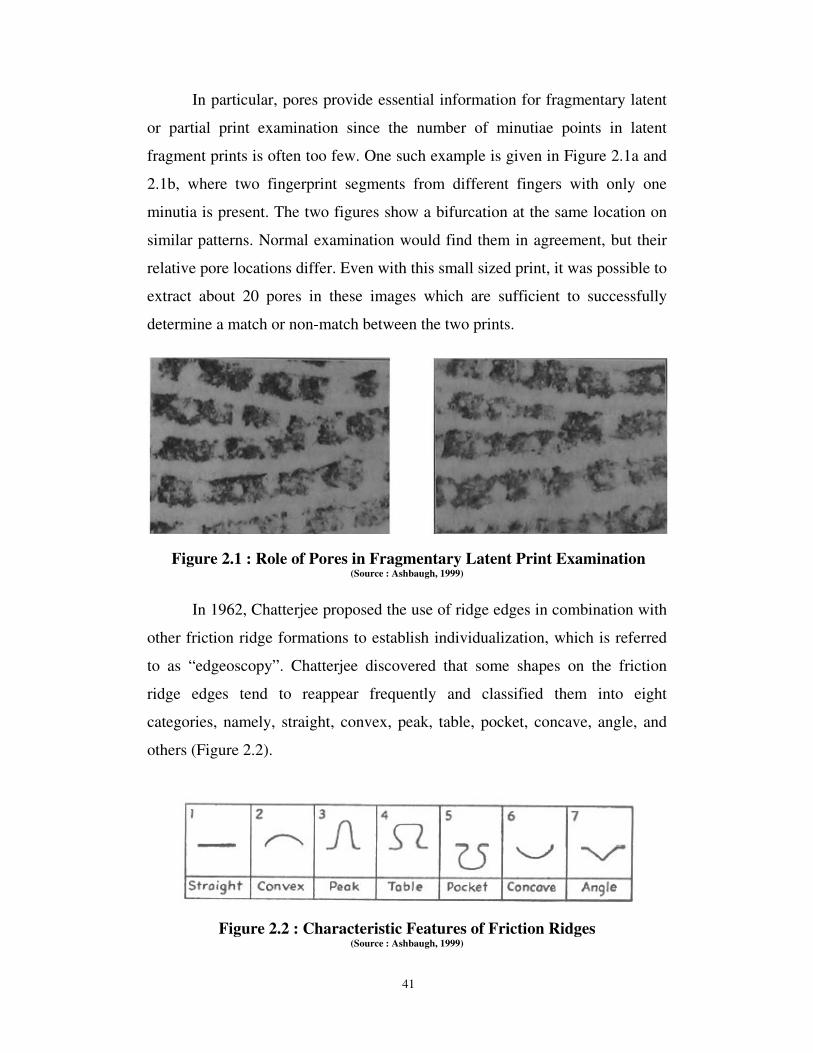
In 1962, Chatterjee proposed the use of ridge edges in combination with
other friction ridge formations to establish individualization, which is referred
to as “edgeoscopy”. Chatterjee discovered that some shapes on the friction
ridge edges tend to reappear frequently and classified them into eight
categories, namely, straight, convex, peak, table, pocket, concave, angle, and
others (Figure 2.2).
Figure 2.2 : Characteristic Features of Friction Ridges (Source : Ashbaugh, 1999)
42
Subsequent research established that all the edge characteristics along
friction ridges can be placed into one of these categories. It is believed that the
differences in edge shapes are caused by the effects of differential growth on
the ridge itself or a pore that is located near the edge of the friction ridge. In
theory, the density of ridge edge features can be very large, e.g., given the
average width of a ridge to be approximately 0.48 mm, a ridge 5 mm long
would contain approximately 20 edge characteristics. However, in practice, the
flexibility of the friction skin tends to mask all but the largest edge shapes.
Over the last 15 years, poroscopy and edgeoscopy have received
growing attention and have been widely studied by scientists of ridgeology, a
fundamental and essential resource for latent print examiners. It has been
claimed that shapes and relative positions of sweat pores and shapes of ridge
edges are as permanent and unique as traditional minutiae points, and, when
understood, they add considerable weight to the conclusion of identification
(Jain and Demirkus, 2007).
2.3. FINGERPRINT SENSING TECHNOLOGY
There are many different sensing methods to obtain the ridge-and-valley
pattern of finger skin or fingerprint (Xia and O’Gorman, 2003). Historically, in
law enforcement applications, fingerprints were mainly acquired offline.
Nowadays, most commercial and forensic applications accept live-scan digital
images acquired by directly sensing the finger surface with a fingerprint sensor
based on optical, solid-state, ultrasonic, and other imaging technologies.
The earliest known images of fingerprints were impressions in clay and
later in wax. Starting in the late 19th century and throughout the 20th century,
the acquisition of fingerprint images was mainly performed by using the “ink-
technique”. This kind of process is referred to as rolled offline fingerprint
sensing, which is still being used in forensic applications and background
checks of applicants for sensitive jobs.

43
Later “Live-scan” sensors with Frustrated Total Internal Reflection
(FTIR) principle were also invented. The sensors implemented earlier had the
disadvantage that they were ill-suited for wet or dry fingers and had to be
cleaned regularly to prevent grease and dirt from compromising the image
quality.
The past 15 years have envisaged tremendous development in the
fingerprint sensing technology. For example, Multispectral Fingerprint Imaging
(MSI) has been introduced by Lumidigm, Inc. (Rowe et al., 2005). Unlike
conventional optical fingerprint sensors, MSI devices scan the subsurface of
the skin by using different wavelengths of light (e.g., 470 nm (blue), 574 nm
(green), and 636 nm (red)). The fundamental idea is that different features of
skin cause different absorbing and scattering actions depending on the
wavelength of light. Fingerprint images acquired using the MSI technology
appear to be of significantly better quality compared to conventional optical
sensors for dry and wet fingers. Multispectral fingerprint images have also been
shown to be useful for spoof detection (Nixon and Rowe, 2005)
Later, in 2006, sensing technology based on multicamera system were
introduced. These were termed as “touchless imaging,” and were introduced by
TBS, Inc. (Parziale and Diaz-Santana, 2006). As suggested by the name,
touchless imaging avoids direct contact between the sensor and the skin and,
thus, consistently preserves the fingerprint “ground truth” without introducing
skin deformation during image acquisition. A touchless fingerprint sensing
device is also available from Mitsubishi (http://global.mitsubishielectric.com,
2006).
One of the most essential characteristics of a digital fingerprint image is
its resolution, which indicates the number of dots or pixels per inch (ppi).
Generally, 250 to 300 ppi is the minimum resolution that allows the feature
extraction algorithms to locate minutiae in a fingerprint image. FBI-compliant
sensors must satisfy the 500 ppi resolution requirement. However, in order to
44
capture pores in a fingerprint image, a significantly higher resolution (≥ 1,000
ppi) of image is needed.
Although it is not yet practical to design solid-state sensors with such a
high resolution due to the cost factor, optical sensors with a resolution of 1,000
ppi are available commercially. More excitingly, optical sensors with
resolutions of 4,000-7,000 ppi have also been developed, which not only allow
capturing Level 3 features for identification, but also pore activities (opening
and closing) for spoof detection.
Recent years have seen a new high resolution fingerprint device called
P3400. This is a small and cost effective fingerprint reader introduced by
Zvetco Inc. (http://www.zvetcobiometrics.com). This device can produce 500
dpi images and is constructed of high-quality aluminum. It is equipped with a
6-foot USB cable and is compatible with most biometric security access
software packages.
The compact Guardian (www.crossmatch.com/l-scan-guardian.php)
includes features such as patented auto capture capability and Perfect Roll
technology, making it ideal for foolproof fingerprint acquisition in high-volume
processing environments, such as visa issuance and border control. The device
can collect quality fingerprints at high resolution (500 dpi) in few seconds and
meets international standards that comply with government requirements in
many countries.
The ten-print MFS-500 live scanner is high resolution (500 and
1000dpi) devices designed and built for optical perfection. It can read plane
static fingerprints and can also be applied in 3- D print-pressed rolling scan. A
sensor provides very clear image and prevents dry fingerprint problems. A
variety of fingerprint identification software is added into the sensor to identify
the fingerprint. It is claimed by the manufacturers that the fingerprint captured
with this scanner can have the highest identification and matching ratio
45
(http://www.mantratec.com/ biometrics / SLAP-4-4-2- fingerprint - scanner -
forensic-biometrics-MFS-500.html).
Futronic FS80 USB2.0 Fingerprint Scanner (www.bayometric.com)
uses an advanced CMOS sensor technology and precise optical system to
deliver high quality fingerprint image. The finger is illuminated by 4 infra-red
LED's during scanning and the light intensity is automatically adjusted
according to scanning fingerprint's characteristics (wet, dry, blurred, etc.) to
optimize the quality of the captured fingerprint image. It captures an un-
distorted raw fingerprint image of 500dpi resolution into PC in 100msec. The
scanner can reject fake fingers made from silicone rubber and play-doh. It
supports fingerprint recognition, verification, authentication, and matching
applications.
The type of scanner used depends upon the application and environment
where it is to be implemented. In general, it is preferred to have scanners that
are products certified for compliance with the FBI's integrated automated
fingerprint identification system image quality specifications. These
specifications include details regarding fingerprint image resolution, size
(area), number of pixels, geometric accuracy, gray-level quantization and gray
range, spatial frequency response and signal-to-noise (SNR) ratio. The scanners
certified by the FBI as tested and in compliance with the FBI's Next Generation
Identification (NGI) initiatives and Integrated Automated Fingerprint
Identification System (IAFIS) Image Quality Specifications (IQS) as of 2012 is
presented in https://www.fbibiospecs.org/IAFIS/Default.aspx.
2.3.1. Fingerprint Acquisition Methods
This section presents the various acquisition methods used to obtain
fingerprints of an individual.

46
• Optical
Optical fingerprint imaging involves capturing a digital image of the
print using visible light. This type of sensor is, in essence, a specialized digital
camera. The top layer of the sensor, where the finger is placed, is known as the
touch surface. Beneath this layer is a light-emitting phosphor layer, which
illuminates the surface of the finger. The light reflected from the finger passes
through the phosphor layer to an array of solid state pixels (a charge-coupled
device), which captures a visual image of the fingerprint. A scratched or dirty
touch surface can cause a bad image of the fingerprint. A disadvantage of this
type of sensor is the fact that the imaging capabilities are affected by the
quality of skin on the finger. For instance, a dirty or marked finger is difficult
to image properly. Also, it is possible for an individual to erode the outer layer
of skin on the fingertips to the point where the fingerprint is no longer visible.
It can also be easily fooled by an image of a fingerprint if not coupled with a
“live finger” detector. However, unlike capacitive sensors, this sensor
technology is not susceptible to electrostatic discharge damage (Raul, 2007).
• Ultrasonic
Ultrasonic sensors make use of the principles of medical
ultrasonography in order to create visual images of the fingerprint. Unlike
optical imaging, ultrasonic sensors use very high frequency sound waves to
penetrate the epidermal layer of skin. The sound waves are generated using
piezoelectric transducers and reflected energy is also measured using
piezoelectric materials. Since the dermal skin layer exhibits the same
characteristic pattern of the fingerprint, the reflected wave measurements can
be used to form an image of the fingerprint. This eliminates the need for clean,
undamaged epidermal skin and a clean sensing surface (Majid and Saeed,
2005).
47
• Capacitance
Capacitance sensors utilize the principles associated with capacitance to
form fingerprint images. In this method of imaging, the sensor array pixels
each act as one plate of a parallel-plate capacitor, the dermal layer (which is
electrically conductive) acts as the other plate, and the non-conductive
epidermal layer acts as a dielectric (Setlak, 2005).
• Passive capacitance
A passive capacitance sensor uses the principle outlined above to form
an image of the fingerprint patterns on the dermal layer of skin. Each sensor
pixel is used to measure the capacitance at that point of the array. The
capacitance varies between the ridges and valleys of the fingerprint due to the
fact that the volume between the dermal layer and sensing element in valleys
contains an air gap. The dielectric constant of the epidermis and the area of the
sensing element are known values. The measured capacitance values are then
used to distinguish between fingerprint ridges and valleys (Setlak, 2005).
• Active capacitance
Active capacitance sensors use a charging cycle to apply a voltage to the
skin before measurement takes place. The application of voltage charges the
effective capacitor. The electric field between the finger and sensor follows the
pattern of the ridges in the dermal skin layer. On the discharge cycle, the
voltage across the dermal layer and sensing element is compared against a
reference voltage in order to calculate the capacitance. The distance values are
then calculated mathematically, and used to form an image of the fingerprint.
Active capacitance sensors measure the ridge patterns of the dermal layer like
the ultrasonic method. Again, this eliminates the need for clean, undamaged
epidermal skin and a clean sensing surface (Setlak, 2005). A comparison of
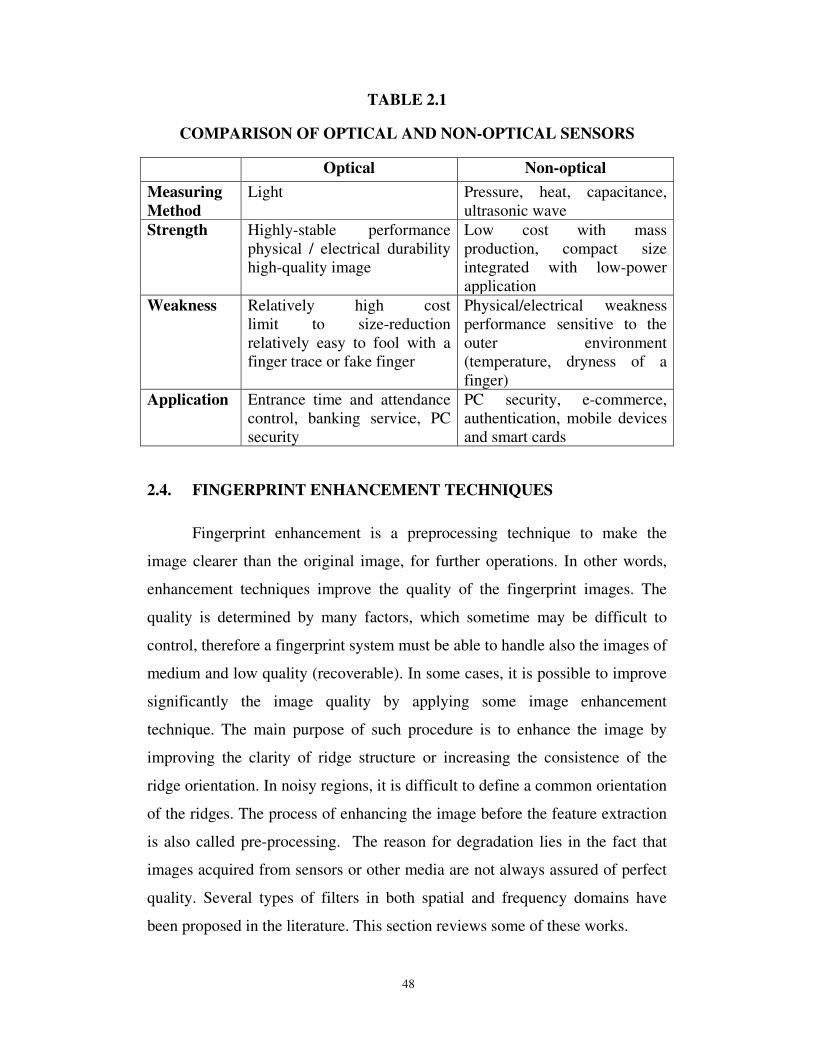
optical and non-optical live scan fingerprint scanners is given in Table 2.1.
48
TABLE 2.1
COMPARISON OF OPTICAL AND NON-OPTICAL SENSORS
Optical Non-optical
Measuring
Method
Light Pressure, heat, capacitance,
ultrasonic wave
Strength Highly-stable performance
physical / electrical durability
high-quality image
Low cost with mass
production, compact size
integrated with low-power
application
Weakness Relatively high cost
limit to size-reduction
relatively easy to fool with a
finger trace or fake finger
Physical/electrical weakness
performance sensitive to the
outer environment
(temperature, dryness of a
finger)
Application Entrance time and attendance
control, banking service, PC
security
PC security, e-commerce,
authentication, mobile devices
and smart cards
2.4. FINGERPRINT ENHANCEMENT TECHNIQUES
Fingerprint enhancement is a preprocessing technique to make the
image clearer than the original image, for further operations. In other words,
enhancement techniques improve the quality of the fingerprint images. The
quality is determined by many factors, which sometime may be difficult to
control, therefore a fingerprint system must be able to handle also the images of
medium and low quality (recoverable). In some cases, it is possible to improve
significantly the image quality by applying some image enhancement
technique. The main purpose of such procedure is to enhance the image by
improving the clarity of ridge structure or increasing the consistence of the
ridge orientation. In noisy regions, it is difficult to define a common orientation
of the ridges. The process of enhancing the image before the feature extraction
is also called pre-processing. The reason for degradation lies in the fact that
images acquired from sensors or other media are not always assured of perfect
quality. Several types of filters in both spatial and frequency domains have
been proposed in the literature. This section reviews some of these works.
49
The basic fingerprint image preprocessing operations are:
(i) Noise Reduction and
(ii) contrast enhancement which enhances the contrast between
darker and brighter curves in a fingerprint image.
There appear many algorithms and techniques proposed and applied to
fingerprint image enhancement. The main algorithms use Fourier transform
(Sherlock et al., 1994; Chikkerur and Govindaraju, 2005), Gabor filters,
Wavelet transform (Hsieh et al., 2003; Paul and Lourde, 2006; Ye et al., 2007;)
and minutiae filtering, applied to binary (Farina et al., 1999) or gray-scale
images (Maio and Maltoni, 1997).
One of the most widely cited fingerprint enhancement techniques is the
method employed by Hong et al. (1998), which is based on the convolution of
the image with Gabor filters tuned to the local ridge orientation and ridge
frequency. Gabor filters (Gabor, 1946) have both frequency-selective and
orientation-selective properties and have optimal joint resolution in both spatial
and frequency domains. Therefore, it is beneficial to use Gabor filters as
bandpass filters to remove the noise and preserve true ridge/valley structure.
The stages of this algorithm include normalisation, ridge orientation estimation,
ridge frequency estimation and filtering. This method was a follow up of their
previous work (Hong et al., 1996). In this work, the authors introduced a new
fingerprint enhancement algorithm that decomposes the input fingerprint image
into a set of filtered images. A set of band pass filters can efficiently remove
the undesired noise and preserve the true ridge/valley structure.
Yang et al. (2003) modified the method proposed by Hong et al. (1998)
by discarding the inaccurate prior assumption of sinusoidal plane wave, and
making the parameter selection process independent of fingerprint image.
Greenberg et al. (2000) proposed the use of an anisotropic filter that
adapts its parameters to the structure of the underlying sub-region. Wu et al.

50
(2004) proposed to convolve a fingerprint image with an anisotropic filter to
remove Gaussian noise and then apply Directional Median Filter (DMF) to
remove impulse noise. On visual inspection, the enhancement results of Wu et
al. (2004) appear to be superior to those obtained by Greenberg et al. (2000).
Sherlock et al. (1994) proposed a fingerprint enhancement method in the
Fourier domain. In this approach, a fingerprint image is convolved with pre-
computed filters, which result in a set of filtered images. The enhanced
fingerprint image is constructed by selecting each pixel from the filtered image
whose orientation is the closest to that of the original pixel.
Teddy and Martin (2002) described the latent fingerprint image
enhancement using spectral analysis technique. The latent fingerprints are often
blurred, incomplete, degraded and their spatial definition is not clear. This
paper has presented techniques from frequency (spectral) analysis that can be
used for the enhancement and restoration of degraded, noisy and sometimes
incomplete fingerprint by using high-pass Butterworth filter and/or band-pass
Butterworth filter. Rolled or flat fingerprint captured using ink or live scan
usually need only the spatial filtering techniques, such as brightness, contrast,
gamma and/or color map adjustment to examine the minutiae information.
However for latent fingerprint, besides the spatial image enhancement filtering,
one needs to use frequency (spectral) analysis techniques or a combination of
both spatial and frequency enhancement techniques to isolate and enhance the
degraded and often very weak, fingerprint information from a variety of
background patterns.
Chikkerur (2005) proposed an algorithm based on Short Time Fourier
Transformation (STFT), and a probabilistic approximation of dominant ridge
orientation and frequency was used instead of the maximum response of the
Fourier spectrum. The ridge orientation image, ridge frequency image and
foreground region image are generated simultaneously while performing the
STFT analysis.
51
E-Kyung and Bae (2006) proposed an adaptive filter according to
oily/dry/neutral images, instead of uniform filtering. To identify
oily/dry/neutral, five features such as Mean, Variance, Block directional
difference, Ridgevalley thickness ratio and Orientation change are used for
clustering by Ward’s clustering algorithm. After clustering, if the image is dry,
then the ridges are enhanced by extracting their centerlines and removing white
pixels, that is, ridge enhancement. For oily images, valleys are enhanced by
dilating thin and disconnected ones, that is, 0valley enhancement. For neutral
image, there is no need for filtration.
Recently, Chengpu et al. (2008) proposed the enhancement technique by
using the combination of Gabor filter and Diffusion filter methods. The authors
have combined the advantages of Gabor filtering and Diffusion filtering
methods and proposed an enhancement method using the two filters: the low-
pass filter (1D Gaussian filter) and the band-pass filter (1D Gabor filter).
2.5. SEGMENTATION TECHNIQUES
Before extracting the feature of a fingerprint, it is important to separate
the fingerprint regions (presence of ridges) from the background. This limits
the region to be processed, and therefore, reduces the processing time and false
feature extraction. A correct segmentation may be, in some cases, very
difficult, especially in poor quality fingerprint image or noisy images, such as
presence of latents. The same information used for quality extraction, such as
the contrast, ridge orientation and ridge frequency can be used for the
segmentation or inclusive of the quantified region quality may be used directly
by considering as background, the regions with quality below some threshold.
Normally, the segmentation is also computed by block in the same way as the
quality extraction.
Segmentation is considered as a critical step in automatic fingerprint
recognition. There is a large literature on segmentation dating back over 30
years (Jain and Dubes, 1988). Some previous approaches to image
52
segmentation, which provide the basis for more recent methods, include
boundary-based segmentation such as Canny edge detection (Canny, 1986),
region-based segmentation such as region growing (Adams and Bishof, 1994;
Chakraborty et al., 1996) and global optimization approaches such as those
based on Mumford-Shah functional (Klingler et al., 1988; Chakraborty et al.,
1996). The discussion of this section is divided into two parts. The first
presents some techniques that are general in nature and can be applied to any
type of images, while the second section presents works focused on segmenting
fingerprint from background.
Several approaches to fingerprint image segmentation are known from
literature. In early days, Mehtre et al. (1987) implemented a segmentation
algorithm that first partitioned a fingerprint image into blocks of 16 16
pixels. Then, each block was classified according to the distribution of the
gradients in that block. Later Mehtre and Chatterjee (1989) extended this
method by excluding blocks with a gray-scale variance that is lower than some
threshold.
The gray-scale variance in the direction orthogonal to the orientation of
the ridges was used to classify each 16 16 block by Ratha et al. (1995). Jain
and Ratha (1997) used the output of a set of Gabor filters as input to a
clustering algorithm that constructs spatially compact clusters. Sun and Ai
(1996) used dynamic threshold value (T) to binarize the input fingerprint
images, where the dynamic threshold was suggested by Moayer and Fu (1975).
The method used 5x5 pixels neighborhood to determine the local threshold
value (T), which is equal to the mean value of the 5x5 pixels.
The segmentation algorithm proposed by Bazen and Gerez (2000) was
based on the coherence and morphology to obtain smooth regions. The same
authors (Bazen and Gerez, 2001) enhanced their work to two more features
namely mean and variance along with coherence. An optimal linear classifier is
trained for the classification per pixel, while morphology is applied as post
53
processing to obtain compact clusters and to reduce the number of
classification errors.
Naji et al. (2002) proposed a segmentation algorithm based on
histogram equalizer and automated the method of choosing the threshold value
during segmentation.
Segmentation algorithms can generally be unsupervised, where a
threshold is set on detected features to segment the image, or supervised where
a simple linear classifier is used to classify features as part of region of interest
or the background. Examples of supervised methods include the work of
Alonso-Fernandez et al. (2005), where Gabor filters were used for
segmentation. Apart from supervised and unsupervised methods, neural
networks are also used. Barreto et al. (2005) train a neural network on the
Fourier spectrum of fingerprint images to segment the image. Similarly, Zhu
et al. (2006) utilized a neural network trained on the gradient of the fingerprint
orientation to segment the images. Wu et al. (2007) proposed an approach
based on strength of Harris corners in the image, which is used to extract the
region of interest. This approach used the corner strength measure to
distinguish between the region of interest and the background.
Segmentation process can become very complex and intricate because
the boundary between the region of interest and the background blurs due to
the presence of noise. Various segmentation methods are developed. But these
methods are not absolutely satisfying. For example, if there is a highly noisy
background region surrounding the poor contrast foreground of the fingerprint
image, these methods will fail to separate background with foreground. A
robust segmentation method is required to deal with low quality images and to
be insensitive to the contrast of the original images.
54
2.6. MATCHING ALGORITHMS
Fingerprint matching refers to finding the similarity between two given
fingerprint images. The choice of the matching algorithm depends on which
fingerprint representation is being used. Typically, a matching algorithm first
attempts to recover the translation, rotation and deformation parameters
between the given image pair and then determines the similarity between the
two images.
Fingerprint matching is considered a challenging problem due to the
noise in the fingerprint images, large intra-class variation and small interclass
variations between different impressions of the same finger. As each
authentication application has different performance requirement, there is a
need to continually improve the matching performance of the current systems.
This section reviews some of the reported matching algorithms.
The available matching algorithms can be broadly classified into five
categories depending on the type of features used. They are
• Correlation based matching
• Minutia based matching
• Ridge feature based matching
• Non-minutia based matching
• Hybrid Methods
2.6.1. Correlation Based Matching
In order to match two fingerprints using the correlation based technique,
the fingerprints are aligned and the correlation is computed for each
corresponding pixels, however, as the displacement and rotation are unknown it
is necessary to apply the correlation for all possible alignments. The singularity
information may be useful in order to find an approximated alignment. The
main drawback of this method is its computational complexity and less
tolerance to non-linear distortion and contrast variation.
55
There have been some alternative proposals that compute the correlation
locally instead of globally, in which only interesting regions (e.g., minutia and
singularity regions) are selected and matched. These algorithms use simple
techniques to align two fingerprint images and subtract the input image from
the template image to see if the ridges correspond. This method has several
disadvantages.
a. It fails if the images are highly distorted. The distortion is more
pronounced in global fingerprint patterns; thus considering the local
regions can minimize distortion to some extent. Bazen et al. (2000) and
Nandakumar and Jain (2004) present some approaches to localized
correlation-based matching.
b. Another factor that affects the performance of correlation-based
matching algorithms is the variations introduced through finger
pressure, skin condition, image brightness, contrast and ridge thickness
of the same finger. When these situations arise, a more sophisticated
correlation measures such as normalized cross-correlation or zero-mean
normalized cross-correlation are needed. These techniques can be used
to compensate contrast and brightness variations and the application of
enhancement, binarization and thinning steps may limit the ridge
thickness problem (David et al., 2005).
c. Increased complexity : The computational complexity of this method is
high. This problem can be solved by using Fourier domain method
(Coetzee and Botha, 1993) and Fourier-Mellin transformation (Sujan
and Mulqueen, 2002).
2.6.2. Minutia Based Methods
This is the most popular and is widely used in commercial applications,
because of its good performance and low computation time, especially for good
quality images. This method tries to align the minutiae of the input image
56
(query template) and stored templates (reference template) and find the number
of matched minutiae. After alignment, two minutiae are considered in matching
if the spatial distance and direction difference between them are smaller than a
given tolerance. A correct aligning of fingerprint is very important in order to
maximize the number of matched minutiae; this requires the computing of the
translation and rotation information, as well as other geometrical
transformations such as scale and distortion. In order to compute efficiently
aligning information, there have been many approaches proposed.
Fingerprint alignment or registration is a crucial step in fingerprint
recognition. Its goal is to retrieve the transformation parameters between
fingerprint images and then align them for matching. Some non-rigid
deformation or distortion could occur in fingerprint image acquisition. It is very
costly to model and remedy such distortions in fingerprint registration, and they
can be compensated to some extent in subsequent fingerprint matching. Thus, a
majority of existing fingerprint alignment methods consider only translation
and rotation, although some deformable models (Cappelli et al., 2001; Ross et
al., 2005) have been proposed.
According to the features used, the existing fingerprint alignment
methods can be divided into two categories, minutia based and non-minutia
feature based methods. Minutia based methods are now the most widely used
ones (Nanni and Lumini, 2008). Non-minutia feature based methods (Jain et
al., 2000; Zhang and Wang, 2002), include those using image intensity values,
orientation fields, cores, etc. One problem in applying these methods to partial
fingerprints is that the features required by them could be very few on the
fragments. Consequently, they will either lead to incorrect results or be not
applicable.
There are roughly two kinds of methods for estimating alignment
transformations. The first kind of methods quantizes the transformation
parameters into finite sets of discrete values and searches for the best solution
57
in the quantized parameter space (Ratha et al., 1996; Chang et al., 1997; Bazen
et al., 2000; Ross et al., 2002; Yager and Amin, 2005, 2006; Kryszczuk et al.,
2004a, 2004b; Liu et al., 2006). The alignment accuracy of these methods is
thus limited due to the quantization.
The second kind of methods first detects corresponding feature points
(or reference points) on fingerprints and then estimates the alignment
transformation based on the detected corresponding points (Jain et al., 1997;
Huvanandana et al., 2000; ; Jiang and Yau, 2000; Kovacs-Vajna, 2000; Jain et
al., 2000; Zhang and Wang, 2002; Tico and Kuosmanen, 2003; Chen et al.,
2006a, 2006b; Feng, 2008). Most of such methods make use of minutiae as the
feature points. As discussed before, however, it is problematic to align partial
fingerprints based on minutiae because of the lack of such features on the
fingerprint fragments.
The minutia-based methods use minutiae points as features and
represent different attributes such as location, orientation, type, quality of the
neighbourhood region, etc. Minutia-based techniques first find minutiae points
and then map their relative placement on the finger. However, there are some
difficulties when using this approach. It is difficult to extract the minutiae
points accurately when the fingerprint is of low quality. Also, this method does
not take into account the global pattern of ridges and furrows. Further,
fingerprint matching based on minutiae has problems in matching different
sized (unregistered) minutiae patterns. Local ridge structures cannot be
completely characterized by minutiae.
The minutia based method can further be classified as Global matching
(Ranade and Rosenfeld, 1980) and Local matching methods. The global
matching approaches try to simultaneously align all the minutiae points. The
alignment methods can be either implicit or explicit. The implicit method tries
to find the point correspondences, and, in the process, an optimal alignment is
obtained. The explicit algorithm aligns the minutiae sets first and then finds the
58
point of correspondences. Local matching approaches try to match local
minutiae structures, which are characterized by attributes that are invariant with
respect to global transformation.
The local versus global matching is a trade-off among simplicity, low-
computational complexity, high distortion tolerance (local matching) and high
distinctiveness (global matching). Local matching methods are more robust to
non-linear distortion and partial overlaps when compared to global approaches.
Matching local minutiae structures relax global spatial relationships, which are
considered to be highly distinctive, and therefore, reduce the amount of
information available for discriminating fingerprints.
Examples of global matching approaches include the use of Hough
transform (Stockman et al., 2000), hierarchical transform (Karu and Jain, 1996)
and adaptive elastic string matching algorithm (Cormen et al., 2001). Similarly,
examples of local matching approaches include Jiang and Yau (2000), Ratha et
al. (2000), Cormen et al. (2001) and Chikkerur et al. (2006).
2.6.3. Ridge Feature Based Matching
A matching using the ridge feature in form of finger code consists of
computing the difference of two finger code vectors (query and reference).
However, before applying the finger code, it is important to align the
fingerprint images, which is really a big problem, as in the case of other
methods. In some cases the singularity may be used for that purpose. A finger
code also may be used as a complementary to minutia based method in order to
improve the overall matching accuracy. The original approach of this method
used circular finger codes, considering as center the core point. The final result
of the finger code difference is normalized and averaged using the eight
directions and obtained a value that varies from 0 to 1. The lower the score, the
more similar are the fingerprints. Some threshold values are used to decide
whether there is matching or not.

59
2.6.4. Non-Minutia Based features
As mentioned previously, minutiae points have several disadvantages
and therefore alternative features are being examined. The popular alternative
features are
(i) Global and local texture information and
(ii) Level 3 features.
Global and local texture information are important alternatives to
minutiae. Textures are defined by spatial repetition of the basic elements and
are characterized by properties such as scale, orientation, frequency, symmetry,
and isotropy. Fingerprint ridge lines are mainly described but smooth ridge
orientation and frequency, except at singular regions. These singular regions
are discontinuities in a basically regular pattern and include the loops and
deltas at a coarse resolution and the minutiae points at a higher resolution.
Global texture analysis fuses contributions from different characteristic regions
into a global measurement and as a result, most of the available spatial
information is lost. Local texture analysis has proved to be more effective than
global feature analysis (Jain et al., 1999).
Hybrid methods that combine texture and minutiae features have also
been proposed (Nanni and Lumini, 2008). This method used Local Binary
Patterns (LBP)as fingerprint descriptors. In this system, two fingerprints to be
matched are first aligned using their minutiae, then the images are decomposed
in several overlapping sub-windows, each sub-window is convolved with a
bank of Gabor filters and, finally, the invariant local binary patterns histograms
are extracted from the convolved images.
Nikam and Agarwal (2008) also used LBP features along with wavelets
for fingerprint detection. Local binary pattern (LBP) histograms are used to
capture these textural details. Wavelet energy features, characterizing ridge
frequency and orientation information, are also used for improving the
60
efficiency of the proposed method. Dimensionalities of the feature sets are
reduced by running sequential forward floating selection (SFFS).
Existing matching algorithms can be classified into two categories,
global and local feature-based algorithms. Global feature-based algorithms aim
at recognizing an object as a whole. This class of algorithm is suitable for
recognition of homogeneous (textureless) objects, which can be easily
segmented from the image background. Examples include Hu moments
(Vuppala et al., 2007) and the eigenvectors of the covariance matrix of the
segmented object (Lee et al., 2005). Global features based Recognizers are
simple and fast but there are limitations in the reliability of object recognition
under variations. In contrast to this, local features based algorithms are more
suitable for textured objects and are more robust with respect to variations. The
advantages of local over global features are demonstrated by Ke et al. (2004).
Local features based algorithms focus mainly on the so-called keypoints.
In this context, the general scheme for object recognition usually involves three
important stages: The first one is the extraction of salient feature points (for
example corners) from both the test and model object mechanisms that aim to
keep the region characteristics insensitive to viewpoint and illumination
changes. The final stage is the matching between test and model images based
on the extracted features.
The development of image matching by using a set of local keypoints
can be traced back to the work of Moravec (1977). He defined the concept of
“points of interest” as being distinct regions in images that can be used to find
matching regions in consecutive image frames. The Moravec operator was
further developed by Harris and Stephens (1998) who made it more repeatable
under small image variations and near edges. Schmid and Mohr (1997) used
Harris corners to show that invariant local features matching could be extended
to the general image recognition problem. They used a rotationally invariant
descriptor for the local image regions in order to allow feature matching under
61
arbitrary orientation variations. Although it is rotational invariant, the Harris
corner detector is however very sensitive to changes in image scale, and
therefore, does not provide a good basis for matching images of different sizes.
Lowe (1999; 2001; 2004) overcame such problems by detecting the
points of interest over the image and its scales through the location of the local
extrema in a pyramidal Difference of Gaussians (DOG). The Lowe’s
descriptor, which is based on selecting stable features in the scale space, is
named the Scale Invariant Feature Transform (SIFT). Mikolajczyk and Schmid
(2005) experimentally compared the performances of several currently used
local descriptors and they found the SIFT descriptors to be the most effective,
as they yielded the best matching results.
It is only in the past few decades that SIFT is being used in fingerprint
recognition and verification. Yu and Huang (2009) proposed a SIFT-based
image fingerprinting approach that is robust to geometric transformations. The
algorithm using the SIFT features utilized a method based on area ratio
invariance of affine transformation to verify valid matched key point pairs
between the queried image and the pre-registered image. By counting the valid
matched pairs, they estimated whether the two images are homologous or not.
Park (2008) demonstrated the utility of SIFT representation for
fingerprint-based identification. In this, a map of gradient orientations was
generated around each local extremum and then the descriptor orientation
invariant was made. All gradient orientations are rotated with respect to the
major orientation (keypoints orientation) of the local extremum.
Iannizzotto and Rosa (2008) proposed another method that uses SIFT
features for fingerprint verification system. The aim was to re-formulate an
algorithm for fingerprint verification using SIFT to exploit the high degree of
parallelism inherent in a single-layer Cellular Neural Network.
62
2.6.5. Hybrid Methods
Recently, researchers have come up with hybrid fingerprint matchers by
making use of more than one basic approach to matching. For example, Ross
et al. (2003) have suggested the use of both minutiae and ridge flow
information to represent and match fingerprints. They have shown that the
performance of the minutia-based matcher presented by Jain et al. (1997) can
be significantly improved by using additional information provided by the
Finger Code method (Jain et al., 2000).
The local correlation-based fingerprint matching algorithm presented in
this paper is a similar attempt to improve the performance of a minutia-based
matcher by introducing a correlation step to ascertain the quality of each
minutia match. The gray-level information of the pixels around the minutiae
points contains richer information about the local region than the attributes of
the minutiae points. Hence, the spatial correlation of regions around
corresponding minutiae points is a good measure of the degree of similarity
between them.
The correlation-based fingerprint matcher proposed by Bazen et al.
(2000) selects certain distinctive regions in the template fingerprint image and
searches for those regions in the query image. However, their method is not
very robust to rotation. Beleznai et al. (2001), in order to improve the
recognition performance of a minutia-based matching system, exploit the
structural information around minutiae.
2.7. LEVEL 3 FEATURES BASED RECOGNITION
The use of Level 3 features in an automated fingerprint identification
system has been studied by only a few researchers. There is a growing interest
in using Level 3 features, such as pores (Stosz and Alyea, 1994; International
Biometric Group, 2008), ridge contours (Jain et al., 2007) and, dots and
incipient ridges (Chen and Jain, 2007), for fingerprint matching. It is claimed

63
that Level 3 features contain discriminating information and can improve the
performance of matching rolled/plain to rolled/plain fingerprints. This section
reviews works that focus on the extraction of pores and matching performance
from high resolution images.
A critical step in the pore based AFRS is the extraction of pores from
fingerprint images. The existing methods extract pores by using skeleton
tracking-based or filtering-based approaches. The skeleton-tracking-based
approaches are quite time- consuming and work well only with very high
quality fingerprint images. The filtering-based approaches are more efficient
and more robust. They use static isotropic pore models to detect pores.
2.7.1. Skeleton Tracking-based Approaches
Stosz and Alyea (1994) proposed a skeletonization-based pore
extraction and matching algorithm. Specifically, the locations of all end points
(with at most one neighbor) and branch points (with exactly three neighbors) in
the skeleton image are extracted and each end point is used as a starting
location for tracking the skeleton. The tracking algorithm advances one
element at a time until one of the following stopping criteria is encountered:
1) another end point is detected
2) a branch point is detected
3) the path length exceeds a maximum allowed value.
Condition 1 implies that the tracked segment is a closed pore, while Condition
2 implies an open pore. Finally, skeleton artifacts resulting from scars and
wrinkles are corrected and pores from reconnected skeletons are removed. The
result of pore extraction is shown in Figure 2.3.
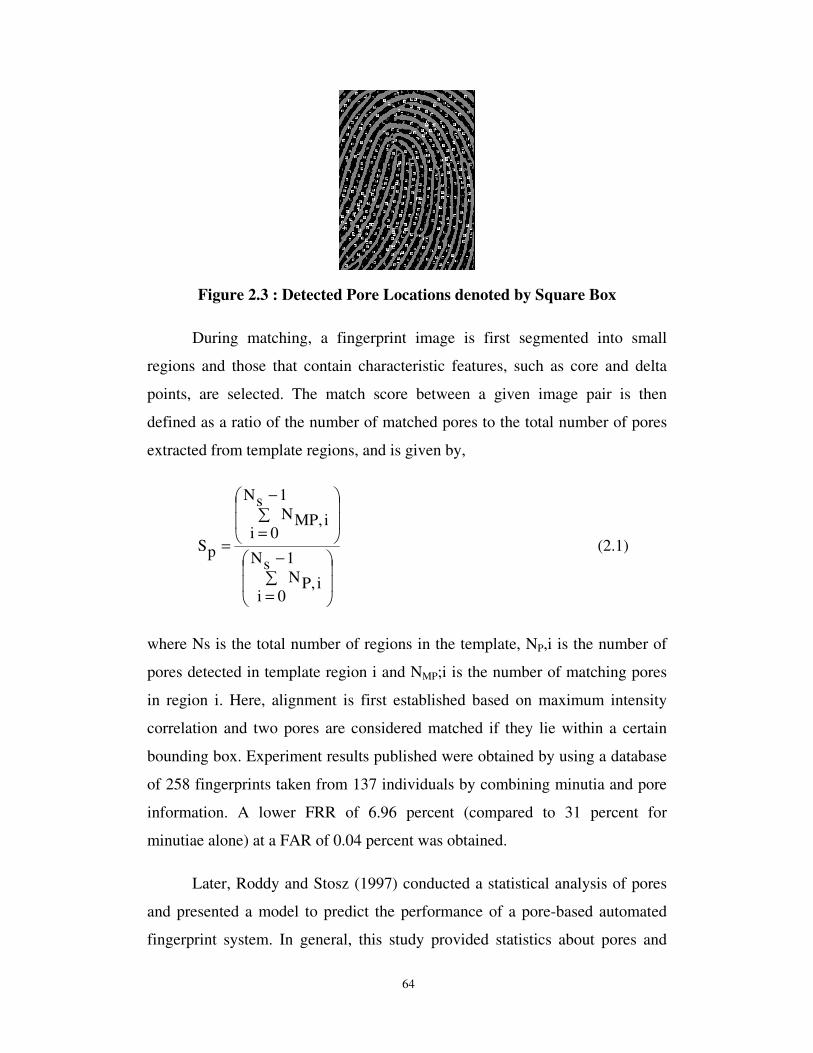
64
Figure 2.3 : Detected Pore Locations denoted by Square Box
During matching, a fingerprint image is first segmented into small
regions and those that contain characteristic features, such as core and delta
points, are selected. The match score between a given image pair is then
defined as a ratio of the number of matched pores to the total number of pores
extracted from template regions, and is given by,
��
�
�
��
�
��
−
=
��
�
�
��
�
��
−
=
=
1sN
0ii,PN
1sN
0ii,MPN
pS (2.1)
where Ns is the total number of regions in the template, NP,i is the number of
pores detected in template region i and NMP;i is the number of matching pores
in region i. Here, alignment is first established based on maximum intensity
correlation and two pores are considered matched if they lie within a certain
bounding box. Experiment results published were obtained by using a database
of 258 fingerprints taken from 137 individuals by combining minutia and pore
information. A lower FRR of 6.96 percent (compared to 31 percent for
minutiae alone) at a FAR of 0.04 percent was obtained.
Later, Roddy and Stosz (1997) conducted a statistical analysis of pores
and presented a model to predict the performance of a pore-based automated
fingerprint system. In general, this study provided statistics about pores and
65
demonstrates the efficacy of using pores, in addition to minutiae, for improving
the fingerprint recognition performance.
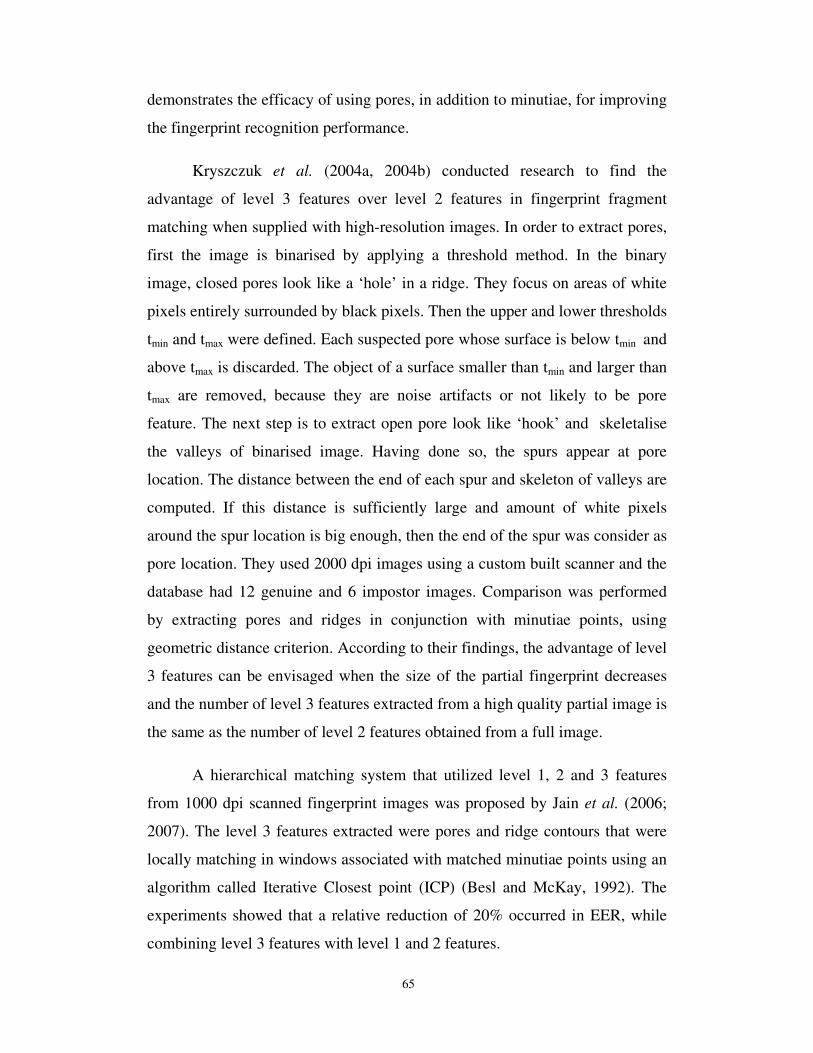
Kryszczuk et al. (2004a, 2004b) conducted research to find the
advantage of level 3 features over level 2 features in fingerprint fragment
matching when supplied with high-resolution images. In order to extract pores,
first the image is binarised by applying a threshold method. In the binary
image, closed pores look like a ‘hole’ in a ridge. They focus on areas of white
pixels entirely surrounded by black pixels. Then the upper and lower thresholds
tmin and tmax were defined. Each suspected pore whose surface is below tmin and
above tmax is discarded. The object of a surface smaller than tmin and larger than
tmax are removed, because they are noise artifacts or not likely to be pore
feature. The next step is to extract open pore look like ‘hook’ and skeletalise
the valleys of binarised image. Having done so, the spurs appear at pore
location. The distance between the end of each spur and skeleton of valleys are
computed. If this distance is sufficiently large and amount of white pixels
around the spur location is big enough, then the end of the spur was consider as
pore location. They used 2000 dpi images using a custom built scanner and the
database had 12 genuine and 6 impostor images. Comparison was performed
by extracting pores and ridges in conjunction with minutiae points, using
geometric distance criterion. According to their findings, the advantage of level
3 features can be envisaged when the size of the partial fingerprint decreases
and the number of level 3 features extracted from a high quality partial image is
the same as the number of level 2 features obtained from a full image.
A hierarchical matching system that utilized level 1, 2 and 3 features
from 1000 dpi scanned fingerprint images was proposed by Jain et al. (2006;
2007). The level 3 features extracted were pores and ridge contours that were
locally matching in windows associated with matched minutiae points using an
algorithm called Iterative Closest point (ICP) (Besl and McKay, 1992). The
experiments showed that a relative reduction of 20% occurred in EER, while
combining level 3 features with level 1 and 2 features.

66
Vatsa et al. (2009) used a score-level fusion technique and combined
level 2 and level 3 match scores to improve fingerprint recognition accuracy.
The match scores were obtained using classifiers which were first augmented
with a quality score that was determined using redundant discrete wavelet
transform of an image. These match scores were then fused using Dezert-
Smarandache theory. Experimental results showed that the performance of the
fusion method was high when compared with the existing fusion techniques
and the system worked well in presence of imprecise, inconsistent and
incomplete fingerprint information.
2.7.2 Filtering-Based Methods
Skeleton-tracking-based methods first binarize and skeletonize the
fingerprint image and then track the fingerprint skeletons. A pore is detected
when certain criteria are met during the tracking. However, skeletonization is
computationally expensive and very sensitive to noise and it works well only
on very high resolution fingerprint images of high quality. For example, the
fingerprint images used by Stosz and Alyea (1994), Roddy and Stosz (1997),
Kryszczuk et al. (2004a and 2004b) are all at least 2000 dpi.
Recently proposed approaches are filtering-based methods that detect
pores by using pore models to filter fingerprint images. Figure 2.4 shows three
typical isotropic pore models: Ray’s model (Ray et al., 2005), Jain’s model
(Jain, 2006, 2007), and the DoG (Difference of Gaussian) model (Parsons et
al., 2008).
Figure 2.4 : Three Typical Pore Isotropic Models (a) Ray’s model (Ray et al., 2005) (b) Jain’s model (Jain, 2006; 2007) (c) DoG model (Parsons et al., 2008)
67
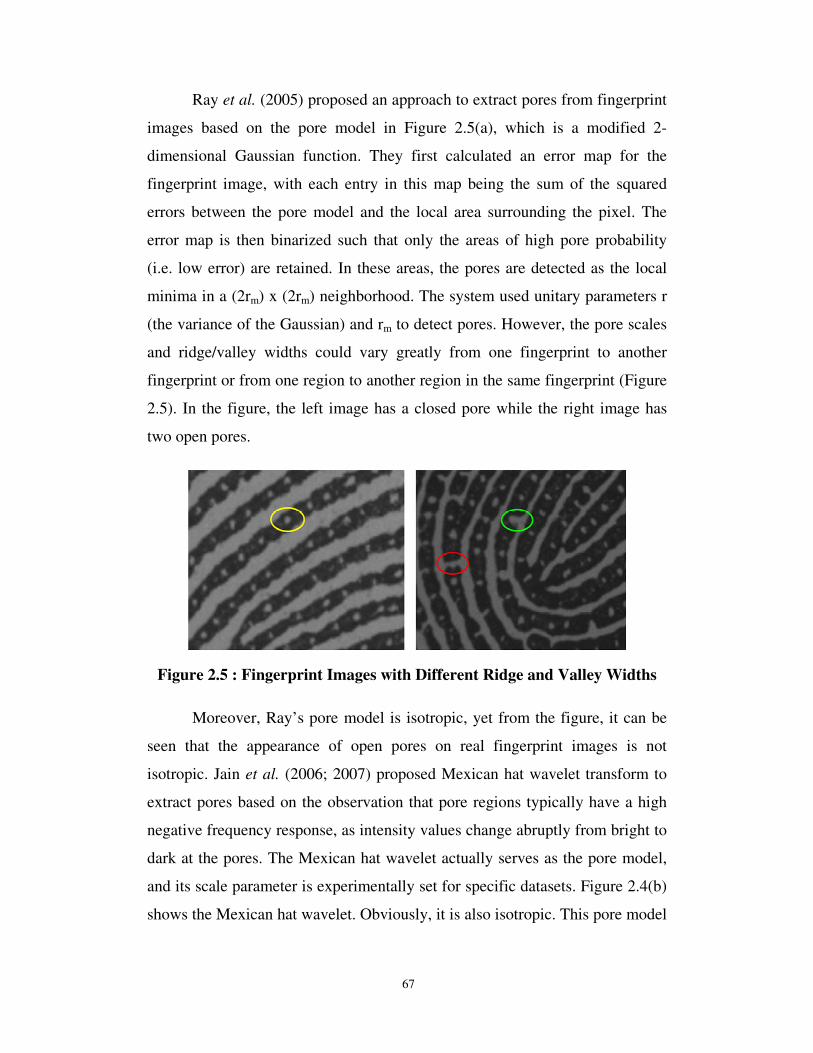
Ray et al. (2005) proposed an approach to extract pores from fingerprint
images based on the pore model in Figure 2.5(a), which is a modified 2-
dimensional Gaussian function. They first calculated an error map for the
fingerprint image, with each entry in this map being the sum of the squared
errors between the pore model and the local area surrounding the pixel. The
error map is then binarized such that only the areas of high pore probability
(i.e. low error) are retained. In these areas, the pores are detected as the local
minima in a (2rm) x (2rm) neighborhood. The system used unitary parameters r
(the variance of the Gaussian) and rm to detect pores. However, the pore scales
and ridge/valley widths could vary greatly from one fingerprint to another
fingerprint or from one region to another region in the same fingerprint (Figure
2.5). In the figure, the left image has a closed pore while the right image has
two open pores.
Figure 2.5 : Fingerprint Images with Different Ridge and Valley Widths
Moreover, Ray’s pore model is isotropic, yet from the figure, it can be
seen that the appearance of open pores on real fingerprint images is not
isotropic. Jain et al. (2006; 2007) proposed Mexican hat wavelet transform to
extract pores based on the observation that pore regions typically have a high
negative frequency response, as intensity values change abruptly from bright to
dark at the pores. The Mexican hat wavelet actually serves as the pore model,
and its scale parameter is experimentally set for specific datasets. Figure 2.4(b)
shows the Mexican hat wavelet. Obviously, it is also isotropic. This pore model

68
is also limited in that it cannot adapt itself to different fingerprints or different
regions on a fingerprint.
Another pore extraction method was proposed by Parsons et al. (2008).
Its basic idea is to use a band-pass filter to detect circle-like features. In other
words, the method assumes that pores appear as circular objects on fingerprint
images, and the pore is thus modeled by the DoG filter. Figure 2.4(c) shows
this pore model. This method did not consider the variation of pore scales in
fingerprint images but simply used a unitary scale in their model.
To deal with the limitations caused by the unitary scale, an adaptive
DoG-based pore extraction method was proposed by Zhao et al. (2008). It
divides a fingerprint image into blocks and defines for each block, a DoG filter
according to the local ridge period on the block. One limitation of the DoG-
based methods is that the pore models are isotropic. The underlying assumption
that pores are circular features does not hold well on real fingerprint images.
To solve the above issues, Zhao et al. (2010a; 2010b) showed that
instead of using the computationally expensive skeletonization method or scale
isotropic method for pore extraction, a simple adaptive anisotropic pore model
will prove to be efficient. In this method, the fingerprint image was partitioned
into blocks and a local pore model was determined for each block. With this
model, a matched filter was used to extract the pores within each block.
Experimental results using high resolution (1200 dpi) fingerprint images
demonstrated that the proposed pore model and the pore extraction method
could locate pores more accurately and robustly in comparison with other state-
of-the-art pore extractors.
Although some methods have been proposed to construct full fingerprint
templates from a number of partial fingerprint images (Choi et al., 2007), it is
expensive or even impossible to collect sufficient fingerprint fragments to
construct a reliable full fingerprint template. Moreover, some errors (e.g.,
spurious features) could be introduced in the construction process. Thus, it is
69
meaningful and very useful if algorithms can be developed for aligning and
matching partial fingerprints to partial fingerprints.
Some researchers have studied the problem of matching a partial
fingerprint to full template fingerprints. Jea and Govindaraju (2005) proposed a
minutia-based approach to matching incomplete or partial fingerprints with full
fingerprint templates. Their approach uses brute-force matching when the input
fingerprints are small and a few minutiae are presented, and uses secondary
feature matching otherwise. Since this approach is based on minutiae, it is very
likely to produce false matches when there are very few minutiae, and it is not
applicable when there are no minutiae on the fingerprint fragments.
2.8. CHAPTER SUMMARY
From the review, it is understood that the fingerprint recognition
technique is a dominant technology in the biometric market. In relation to the
research study, the review study also reveals the fact that even though several
success stories are published with relation to complete fingerprint recognition,
a perfect partial fingerprint recognition system is not yet eminent and still
requires careful examination in terms of accuracy, speed, memory utilization
and cost.
The main complaint against the use of level 3 features (pores) is its need
for high quality and high resolution images along with improvement in terms of
accuracy. But, now, due to the advancement of high speed hardware and
sophisticated software, this complexity has been reduced to a great extent. To
improve the accuracy of the partial fingerprint systems, the research work
proposes the use of multiple non-minutiae based features, combined with level
3 pore features. The methodology used in the proposed work is presented in the
next chapter.