Embed Size (px)
Citation preview
CHAPTER 2: WAREHOUSING
ECONOMIC PERFORMANCE Contents: Purpose, Warehousing - part of a logistics and supply chain management, ,Importance of Logistics and Warehousing Industry, Drivers of Change, Definition and MISC Code, Industry Size and Characteristics, Summary Statistics (Sub-sector Contribution to GDP, Productivity Performance),Enhancing Contribution of the Sector Through the Logistics and Trade Facilitation Masterplan (2015-2020), Malaysia’s Potential Logistics Output, and Overall Impact on the Economy, Malaysia’s Regional Standing.
Key Points:
This Chapter highlights the importance of warehousing as part of logistics and supply chain
management, its economic performance, drivers of change, industry size and characteristics, summary
statistics in terms of productivity, overall impact on the economy and Malaysia’s regional standing.
Transport and logistics involve a complex chain of activities, spread. Although transportation is core
component of logistics, logistics cover a wide range of other areas including storage, warehousing,
trucking services and equipment maintenance across multiple modes of transportation and
infrastructure points. The logistics industry is a crucial determinant of Malaysia’s competitiveness. Its
importance as an enabler and economic multiplier of the nation’s trade-dependent and export-
oriented economy cannot be over-emphasised.
In 2015, services sector remained as the largest contributor to the country's GDP at 53.5% to RM569
billion. It was also the largest employer with 8.6 million people. The Services sector is expected to grow
at 6.8% per annum and contribute 56.5% to the GDP in 2020, and provide 9.3 million jobs.
AEC, Urbanisation, Services Sector Liberalisation, Multimodality and E- Commerce as Key Drivers of
Change. The implementation of the ASEAN Economic Community (AEC) is likely to change the existing
structure of the logistics industry in ASEAN, impacting incumbents and new entrants, higher demand
of value added services and specialized and customized logistics focus. As markets open up, trade
barriers down and regional economies integrate under the ambit of AEC, the industry players need to
innovate and offer more value added services.
Major freight operators with better financial capabilities typically own or lease warehouses. In terms
of bonded licenses issued by the Royal Malaysian Customs, there were 1,828 bonded licenses issued
by the department during 2009-2013 period.
In setting the context for the development of the Logistics and Trade Facilitation Masterplan, a Profiling
Study of the freight logistics industry entitled, “Developing an Empirical and Diagnostic Base to Support
Strategic Planning for the Freight Logistics Industry” was conducted in 2013 by Frost & Sullivan for the
Economic Planning Unit (EPU).The study found that in Malaysia, only 14.9% of freight logistics
operators have a distribution centre. Of the operators with distribution centres, 86.7% are located in
Peninsular Malaysia, while only 3.3% are located in Sabah and 10% are located in Sarawak. Across
Malaysia, the average utilisation rate of the distribution centres is high: around 89% in Peninsular
Malaysia, 90% in Sabah and 95% in Sarawak. In terms of ownership, 67% of freight operators owned
their warehouses while 33% preferred the lease option, 29% of the freight operators have 250 m2 and
below of warehouse built up area, while another 21% of them have more than 5,000 m2 warehouse
built up area. Majority of warehouses in Sabah have 1,000 to 3,000 m2 built up area.
A total of 31% of end users in Malaysia are currently engaged with international freight logistic
providers while 21% are engaged with local ones. International freight logistic providers, usually
3PL/4PL are favoured because of their global recognition, better network coverage, service credibility
and most importantly their ability to provide integrated supply chain services to end users.
The warehouse industry in Malaysia is dominated by medium and small-sized companies (SMEs). As
such, and given high investment costs, most warehouses do not have specialised services such as cold
storage facilities, pick & pack facilities, and pre-retail services. Companies that do offer these value-
added services are usually large conglomerates or MNCs. Due to the limited competition in specialised
service areas, the warehouse industry is less inclined to innovate and make improvements to increase
efficiency and productivity.
The study indicated that although revenue output for the sector as a whole did increase significantly
by 56.7% from 2008 to stand at RM912,374,000 in 2010, the revenue per company has reduced. This
may be attributed to many smaller companies that have sprung up causing a fragmented market The
revenue output per storage was RM3,649,000 in 2010, a drop from RM3,649,000 in 2016.
The transportation and storage sub-sector’s contribution to Malaysia’s GDP has seen near continuous
growth (in terms of value) since 2006. In 2013, the sub-sector contributed MYR 28.6 billion (constant
2005 price) to Malaysia’s GDP, accounting for 3.63% of national GDP. This is an increase of MYR 8.2
billion compared to 2006, when the sub-sector contributed 3.57% of national GDP.
In the recent Productivity Report 2015/2016 of MPC, the Services sector registered a productivity level
of RM66,346 in 2015, compared to the manufacturing sector with the highest productivity level of
RM105,156, Agriculture (RM53,540) and Construction (RM35,673). In terms of productivity growth
manufacturing productivity growth registered the highest upsurge at 7.1% followed by construction at
5.5% while services registered 3.2%.
In terms of value added, employment and productivity growth and levels in 2015 ,the Transportation
and Storage sub-sector registered value added growth of 5.68% valued at RM37,326, employment
growth of 7.21% and a decline of 1.43% in terms of productivity growth to register productivity level of
RM58,665.
From the perspective of Malaysia’s regional performance, Malaysia was ranked 25th in the Global
Enabling Trade Report 2015 in the transportation services category mainly due to its high rankings in
the quality of transport infrastructure (ranked 14th) and quality of transport services (ranked 26th).
In the Logistics Performance Index (LPI) 2014 by World Bank, Malaysia ranked 25 out of 160 countries,
leading upper-middle-income nations, above China and Thailand. Malaysia ranked 25 out of 160
countries, leading upper-middle-income nations, above China and Thailand. The high-income nations
dominate the first 20 positions in the Logistics Performance Index 2014.
2.1 Purpose
This Chapter aims to highlight the importance of warehousing as part of logistics and supply
chain management, the increasing importance of the Services sector and Transport & Storage
sub-sector, its economic performance, drivers of change, industry size and characteristics,
summary statistics in terms of productivity, overall impact on the economy and Malaysia’s
regional standing.
2.2 Warehousing - part of a logistics and supply chain
management
Transport and logistics involve a complex chain of activities. Although transportation is core
component of logistics, logistics cover a wide range of other areas including storage,
warehousing, trucking services and equipment maintenance across multiple modes of
transportation and infrastructure points. The logistics industry is a crucial determinant of
Malaysia’s competitiveness. Its importance as an enabler and economic multiplier of the
nation’s trade-dependent and export-oriented economy cannot be over-emphasised.
Efficient logistics enable competition over a greater area, allowing key export industries to
compete for international markets, and domestic industries to be more competitive. The
logistics industry as backbone to global supply chain is vital to competitiveness and
connectivity as it stimulates trade, facilitates business efficiency and enhances growth. It has
strong linkages with most key industries in the economy and economic impact, as “an
increase in logistics total factor productivity of 1% is estimated to increase GDP by $2
billion” (Australian Logistics Council).
Malaysian logistics services sector enables the efficient transportation of a diverse range of
goods and services via its multi-modal, air, road or sea logistics networks. Creating efficient
and effective warehousing and distribution systems is vital to supply chain management and
the global economy. Changing business dynamics and the entry of global 3PLs have led to
the re-modelling of the supply chain including logistics and warehousing services.
Increasingly, warehouses are being used to serve several important functions, beyond mere
storage of products. The demand drivers for logistics services and facilities in Malaysia such
as industrial parks, free zones, warehouses/depots and distri-parks are manifold.
2.3 Increasing importance of services sector
In 2015, services sector remained as the largest contributor to the country's GDP at 53.5% to
RM569 billion. It was also the largest employer with 8.6 million people. (Figure 2.1). The
Services sector is expected to grow at 6.8% per annum and contribute 56.5% to the GDP in
2020, and provide 9.3 million jobs. In addition, specific targets to transform the Services
sector are : Increasing value added per worker from RM55,574 in 2013 to RM74,101 in
2020; Raising the contribution of knowledge-driven subsectors to GDP from 36% in 2014
to 40% in 2020; and Increasing the share of services exports value added from 12% in 2010
to 19% in 2020. The sector is expected to record broad-based growth across all sub-sectors.
Figure 2.1: Share of output and employment in main economic sectors, 2015
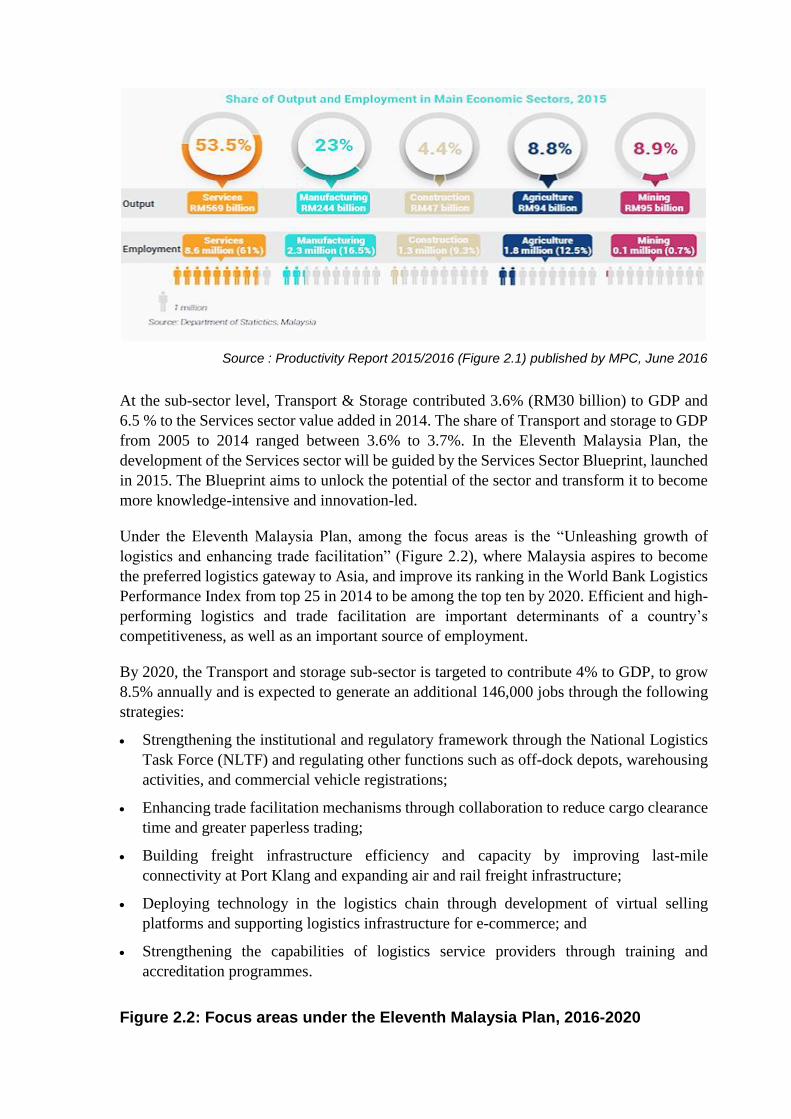
Source : Productivity Report 2015/2016 (Figure 2.1) published by MPC, June 2016
At the sub-sector level, Transport & Storage contributed 3.6% (RM30 billion) to GDP and
6.5 % to the Services sector value added in 2014. The share of Transport and storage to GDP
from 2005 to 2014 ranged between 3.6% to 3.7%. In the Eleventh Malaysia Plan, the
development of the Services sector will be guided by the Services Sector Blueprint, launched
in 2015. The Blueprint aims to unlock the potential of the sector and transform it to become
more knowledge-intensive and innovation-led.
Under the Eleventh Malaysia Plan, among the focus areas is the “Unleashing growth of
logistics and enhancing trade facilitation” (Figure 2.2), where Malaysia aspires to become
the preferred logistics gateway to Asia, and improve its ranking in the World Bank Logistics
Performance Index from top 25 in 2014 to be among the top ten by 2020. Efficient and high-
performing logistics and trade facilitation are important determinants of a country’s
competitiveness, as well as an important source of employment.
By 2020, the Transport and storage sub-sector is targeted to contribute 4% to GDP, to grow
8.5% annually and is expected to generate an additional 146,000 jobs through the following
strategies:
Strengthening the institutional and regulatory framework through the National Logistics
Task Force (NLTF) and regulating other functions such as off-dock depots, warehousing
activities, and commercial vehicle registrations;
Enhancing trade facilitation mechanisms through collaboration to reduce cargo clearance
time and greater paperless trading;
Building freight infrastructure efficiency and capacity by improving last-mile
connectivity at Port Klang and expanding air and rail freight infrastructure;
Deploying technology in the logistics chain through development of virtual selling
platforms and supporting logistics infrastructure for e-commerce; and
Strengthening the capabilities of logistics service providers through training and
accreditation programmes.
Figure 2.2: Focus areas under the Eleventh Malaysia Plan, 2016-2020
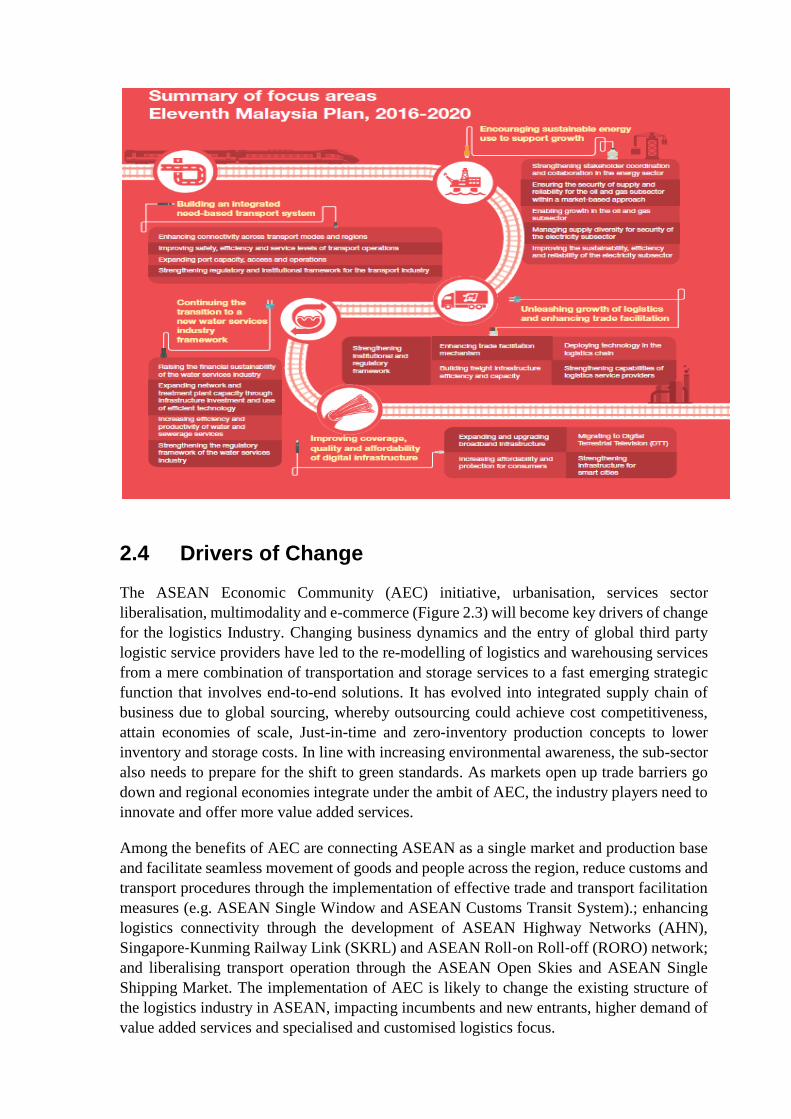
2.4 Drivers of Change
The ASEAN Economic Community (AEC) initiative, urbanisation, services sector
liberalisation, multimodality and e-commerce (Figure 2.3) will become key drivers of change
for the logistics Industry. Changing business dynamics and the entry of global third party
logistic service providers have led to the re-modelling of logistics and warehousing services
from a mere combination of transportation and storage services to a fast emerging strategic
function that involves end-to-end solutions. It has evolved into integrated supply chain of
business due to global sourcing, whereby outsourcing could achieve cost competitiveness,
attain economies of scale, Just-in-time and zero-inventory production concepts to lower
inventory and storage costs. In line with increasing environmental awareness, the sub-sector
also needs to prepare for the shift to green standards. As markets open up trade barriers go
down and regional economies integrate under the ambit of AEC, the industry players need to
innovate and offer more value added services.
Among the benefits of AEC are connecting ASEAN as a single market and production base
and facilitate seamless movement of goods and people across the region, reduce customs and
transport procedures through the implementation of effective trade and transport facilitation
measures (e.g. ASEAN Single Window and ASEAN Customs Transit System).; enhancing
logistics connectivity through the development of ASEAN Highway Networks (AHN),
Singapore‐Kunming Railway Link (SKRL) and ASEAN Roll‐on Roll‐off (RORO) network;
and liberalising transport operation through the ASEAN Open Skies and ASEAN Single
Shipping Market. The implementation of AEC is likely to change the existing structure of
the logistics industry in ASEAN, impacting incumbents and new entrants, higher demand of
value added services and specialised and customised logistics focus.
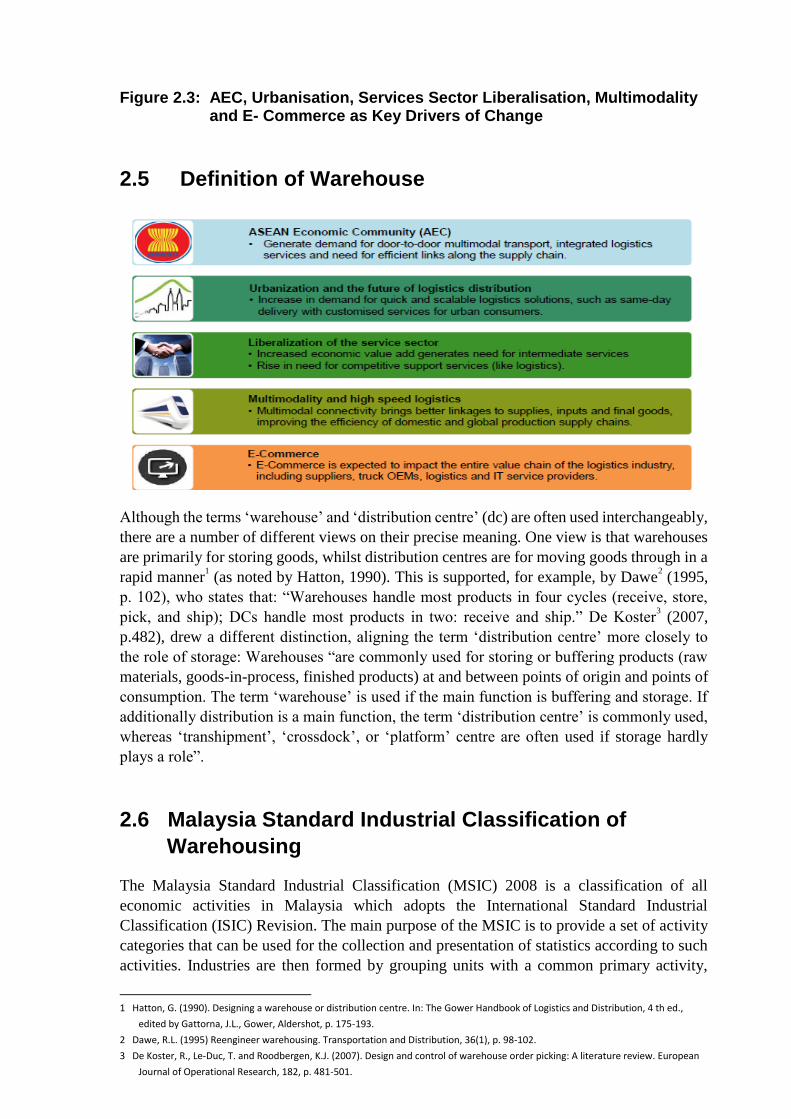
Figure 2.3: AEC, Urbanisation, Services Sector Liberalisation, Multimodality and E- Commerce as Key Drivers of Change
2.5 Definition of Warehouse
Although the terms ‘warehouse’ and ‘distribution centre’ (dc) are often used interchangeably,
there are a number of different views on their precise meaning. One view is that warehouses
are primarily for storing goods, whilst distribution centres are for moving goods through in a
rapid manner1 (as noted by Hatton, 1990). This is supported, for example, by Dawe
2 (1995,
p. 102), who states that: “Warehouses handle most products in four cycles (receive, store,
pick, and ship); DCs handle most products in two: receive and ship.” De Koster3 (2007,
p.482), drew a different distinction, aligning the term ‘distribution centre’ more closely to
the role of storage: Warehouses “are commonly used for storing or buffering products (raw
materials, goods-in-process, finished products) at and between points of origin and points of
consumption. The term ‘warehouse’ is used if the main function is buffering and storage. If
additionally distribution is a main function, the term ‘distribution centre’ is commonly used,
whereas ‘transhipment’, ‘crossdock’, or ‘platform’ centre are often used if storage hardly
plays a role”.
2.6 Malaysia Standard Industrial Classification of
Warehousing
The Malaysia Standard Industrial Classification (MSIC) 2008 is a classification of all
economic activities in Malaysia which adopts the International Standard Industrial
Classification (ISIC) Revision. The main purpose of the MSIC is to provide a set of activity
categories that can be used for the collection and presentation of statistics according to such
activities. Industries are then formed by grouping units with a common primary activity,
1 Hatton, G. (1990). Designing a warehouse or distribution centre. In: The Gower Handbook of Logistics and Distribution, 4 th ed.,
edited by Gattorna, J.L., Gower, Aldershot, p. 175-193.
2 Dawe, R.L. (1995) Reengineer warehousing. Transportation and Distribution, 36(1), p. 98-102.
3 De Koster, R., Le-Duc, T. and Roodbergen, K.J. (2007). Design and control of warehouse order picking: A literature review. European
Journal of Operational Research, 182, p. 481-501.
according to specified similarity criteria. MSIC can then be used to produce statistics by
activity or by industry, for enterprises as well as for establishments or kind of activity units.
The Warehouse business activities are based on Division 52 (Warehousing and support
activities for transportation) under Section H - Transportation and storage of the Malaysia
Services Industrial Code (MSIC) 2008 (Table 2.1).
The business activities that are considered to be within the scope are:
Table 2.1 : MSIC 2008: Warehousing & Storage
Class Item Description
DIVISION 52 : WAREHOUSING AND SUPPORT ACTIVITIES FOR TRANSPORTATION Group 521 : Warehousing and storage
5210 Warehousing and storage Includes:
(a) operation of storage and warehouse facilities for all kind of goods: operation of grain silos, general merchandise warehouses, freight, refrigerated warehouses, storage tanks, etc. (b) storage of goods in foreign trade zones (c) blast freezing Excludes:
(a) parking facilities for motor vehicles, see 52213 (b) operation of self-storage facilities, see 68102 (c) rental of vacant space, see 6810
52100 Warehousing and storage services Source: MSIC 2008
2.7 Industry Size and Characteristics
Key information such as number of warehouses and their locations, types, capacities,
ownership and utilisation rates are not readily available. In setting the context for the
development of the Logistics and Trade Facilitation Masterplan, a profile of the freight
logistics industry entitled, “Developing an Empirical and Diagnostic Base to Support
Strategic Planning for the Freight Logistics Industry” (the Profiling Study) was developed in
a preceding study conducted in 2013. This study by Frost & Sullivan for the Economic
Planning Unit (EPU) gathers inputs from industry players and findings through extensive
quantitative and qualitative assessment and international best practices benchmarking .Below
are extracts of findings from the above-mentioned study.
It was observed that the current service offerings provided include inbound transportation,
outbound transportation, inbound warehousing, outbound warehousing, freight forwarding,
order processing, fleet management & consolidation, information management, customer
service/support, vendor management support, billing/payment/transaction, packing and
labeling and value added services (customer service/support, assembly operations and
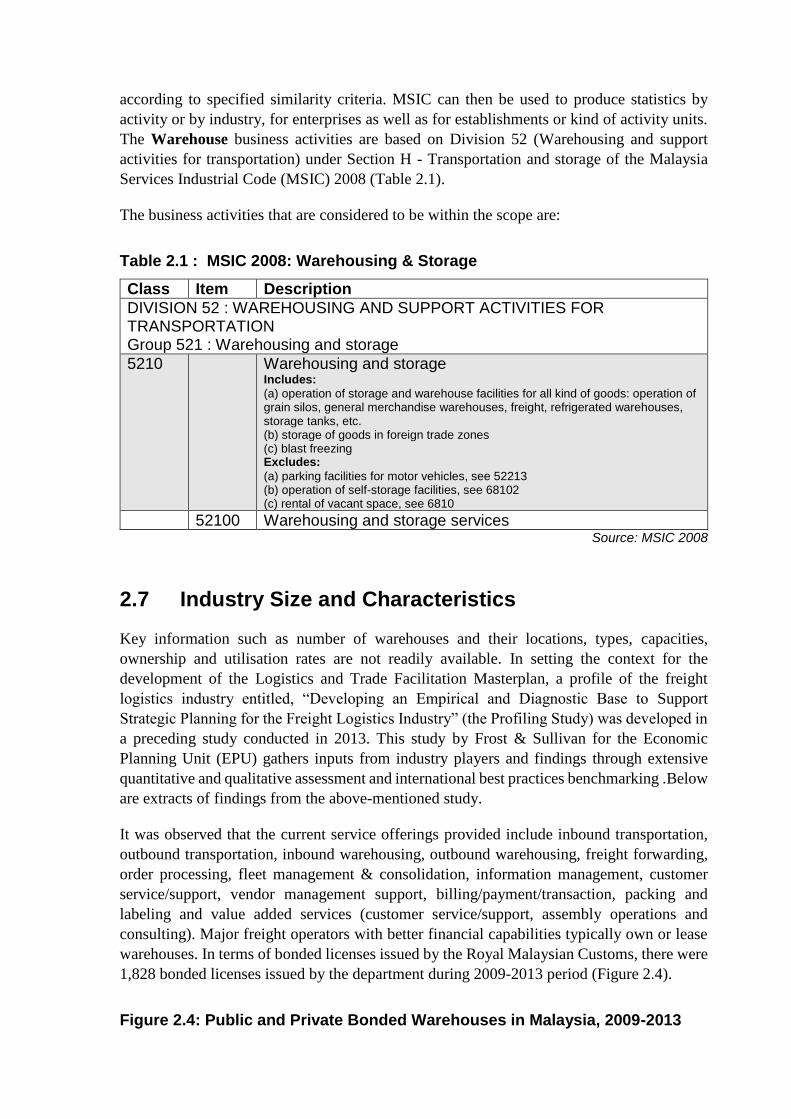
consulting). Major freight operators with better financial capabilities typically own or lease
warehouses. In terms of bonded licenses issued by the Royal Malaysian Customs, there were
1,828 bonded licenses issued by the department during 2009-2013 period (Figure 2.4).
Figure 2.4: Public and Private Bonded Warehouses in Malaysia, 2009-2013
Source: Royal Malaysian Customs
The study found that in Malaysia, only 14.9% of freight logistics operators have a distribution
centre. Of the operators with distribution centres, 86.7% are located in Peninsular Malaysia,
while only 3.3% are located in Sabah and 10% are located in Sarawak. Across Malaysia, the
average utilisation rate of the distribution centres is high: around 89% in Peninsular Malaysia,
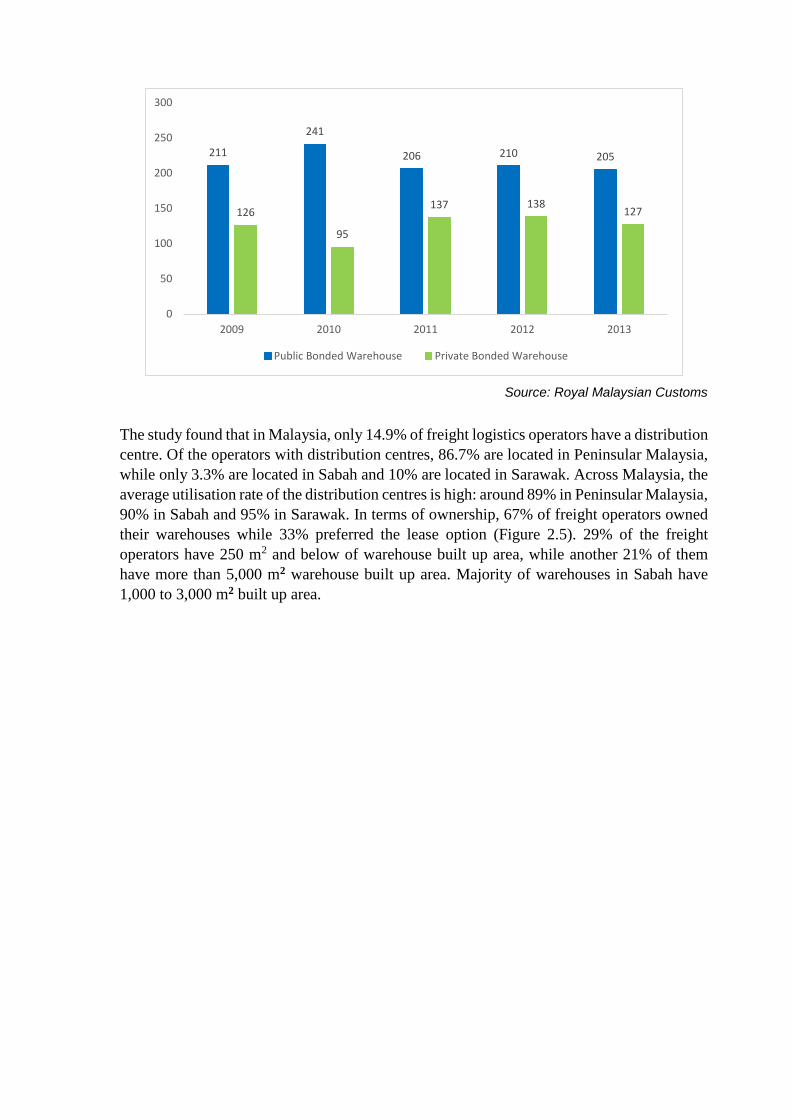
90% in Sabah and 95% in Sarawak. In terms of ownership, 67% of freight operators owned
their warehouses while 33% preferred the lease option (Figure 2.5). 29% of the freight
operators have 250 m2 and below of warehouse built up area, while another 21% of them
have more than 5,000 m2 warehouse built up area. Majority of warehouses in Sabah have
1,000 to 3,000 m2 built up area.
211
241
206 210 205
126
95
137 138127
0
50
100
150
200
250
300
2009 2010 2011 2012 2013
Public Bonded Warehouse Private Bonded Warehouse
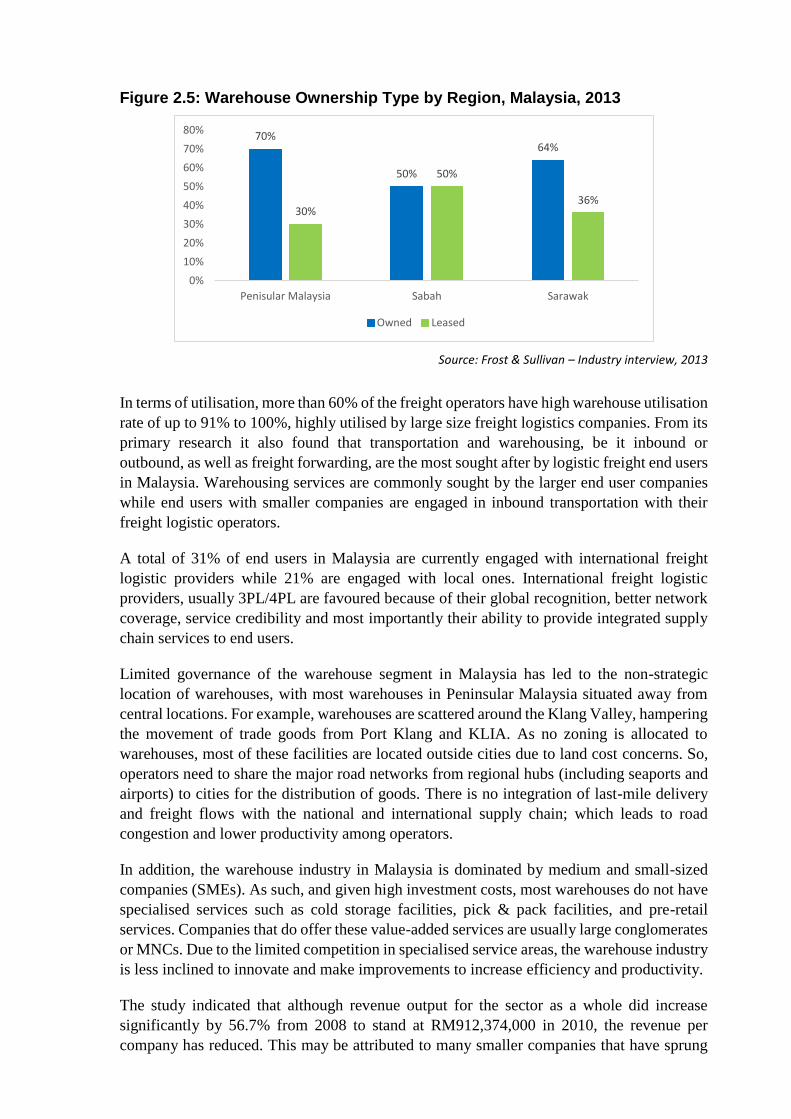
Figure 2.5: Warehouse Ownership Type by Region, Malaysia, 2013
Source: Frost & Sullivan – Industry interview, 2013
In terms of utilisation, more than 60% of the freight operators have high warehouse utilisation
rate of up to 91% to 100%, highly utilised by large size freight logistics companies. From its
primary research it also found that transportation and warehousing, be it inbound or
outbound, as well as freight forwarding, are the most sought after by logistic freight end users
in Malaysia. Warehousing services are commonly sought by the larger end user companies
while end users with smaller companies are engaged in inbound transportation with their
freight logistic operators.
A total of 31% of end users in Malaysia are currently engaged with international freight
logistic providers while 21% are engaged with local ones. International freight logistic
providers, usually 3PL/4PL are favoured because of their global recognition, better network
coverage, service credibility and most importantly their ability to provide integrated supply
chain services to end users.
Limited governance of the warehouse segment in Malaysia has led to the non-strategic
location of warehouses, with most warehouses in Peninsular Malaysia situated away from
central locations. For example, warehouses are scattered around the Klang Valley, hampering
the movement of trade goods from Port Klang and KLIA. As no zoning is allocated to
warehouses, most of these facilities are located outside cities due to land cost concerns. So,
operators need to share the major road networks from regional hubs (including seaports and
airports) to cities for the distribution of goods. There is no integration of last-mile delivery
and freight flows with the national and international supply chain; which leads to road
congestion and lower productivity among operators.
In addition, the warehouse industry in Malaysia is dominated by medium and small-sized
companies (SMEs). As such, and given high investment costs, most warehouses do not have
specialised services such as cold storage facilities, pick & pack facilities, and pre-retail
services. Companies that do offer these value-added services are usually large conglomerates
or MNCs. Due to the limited competition in specialised service areas, the warehouse industry
is less inclined to innovate and make improvements to increase efficiency and productivity.
The study indicated that although revenue output for the sector as a whole did increase
significantly by 56.7% from 2008 to stand at RM912,374,000 in 2010, the revenue per
company has reduced. This may be attributed to many smaller companies that have sprung
70%
50%
64%
30%
50%
36%
0%
10%
20%
30%
40%
50%
60%
70%
80%
Penisular Malaysia Sabah Sarawak
Owned Leased
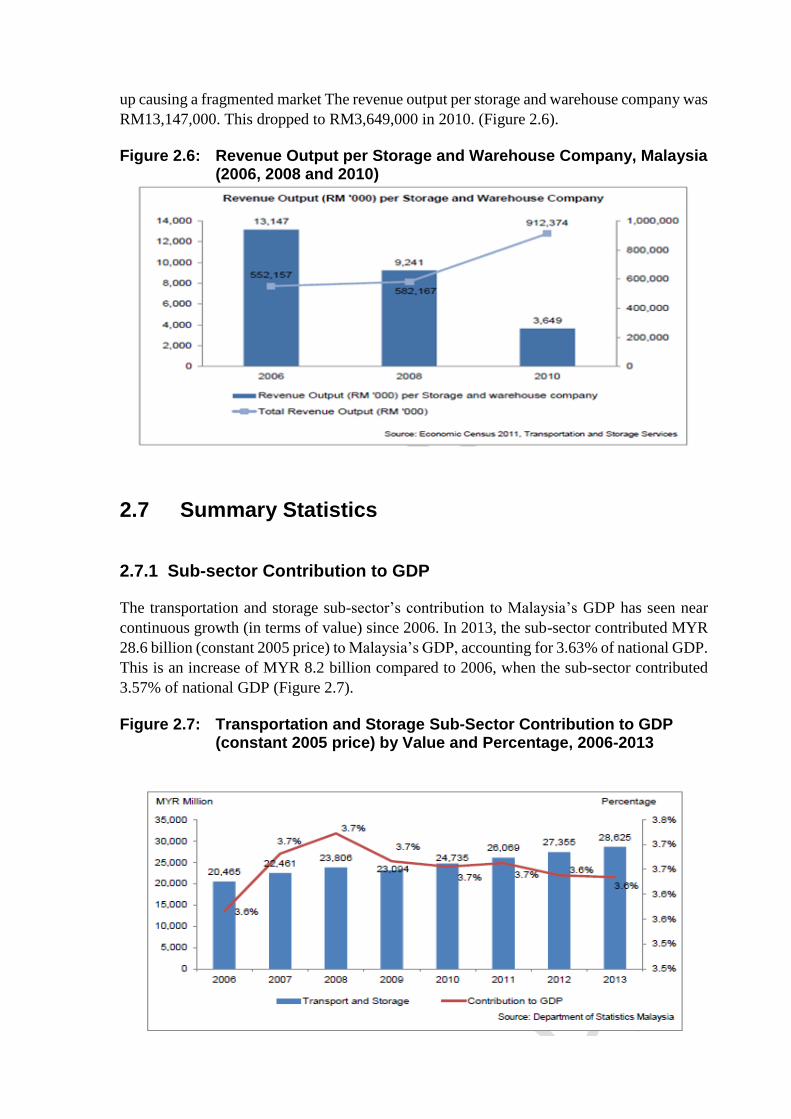
up causing a fragmented market The revenue output per storage and warehouse company was
RM13,147,000. This dropped to RM3,649,000 in 2010. (Figure 2.6).
Figure 2.6: Revenue Output per Storage and Warehouse Company, Malaysia (2006, 2008 and 2010)
2.7 Summary Statistics
2.7.1 Sub-sector Contribution to GDP
The transportation and storage sub-sector’s contribution to Malaysia’s GDP has seen near
continuous growth (in terms of value) since 2006. In 2013, the sub-sector contributed MYR
28.6 billion (constant 2005 price) to Malaysia’s GDP, accounting for 3.63% of national GDP.
This is an increase of MYR 8.2 billion compared to 2006, when the sub-sector contributed
3.57% of national GDP (Figure 2.7).
Figure 2.7: Transportation and Storage Sub-Sector Contribution to GDP (constant 2005 price) by Value and Percentage, 2006-2013
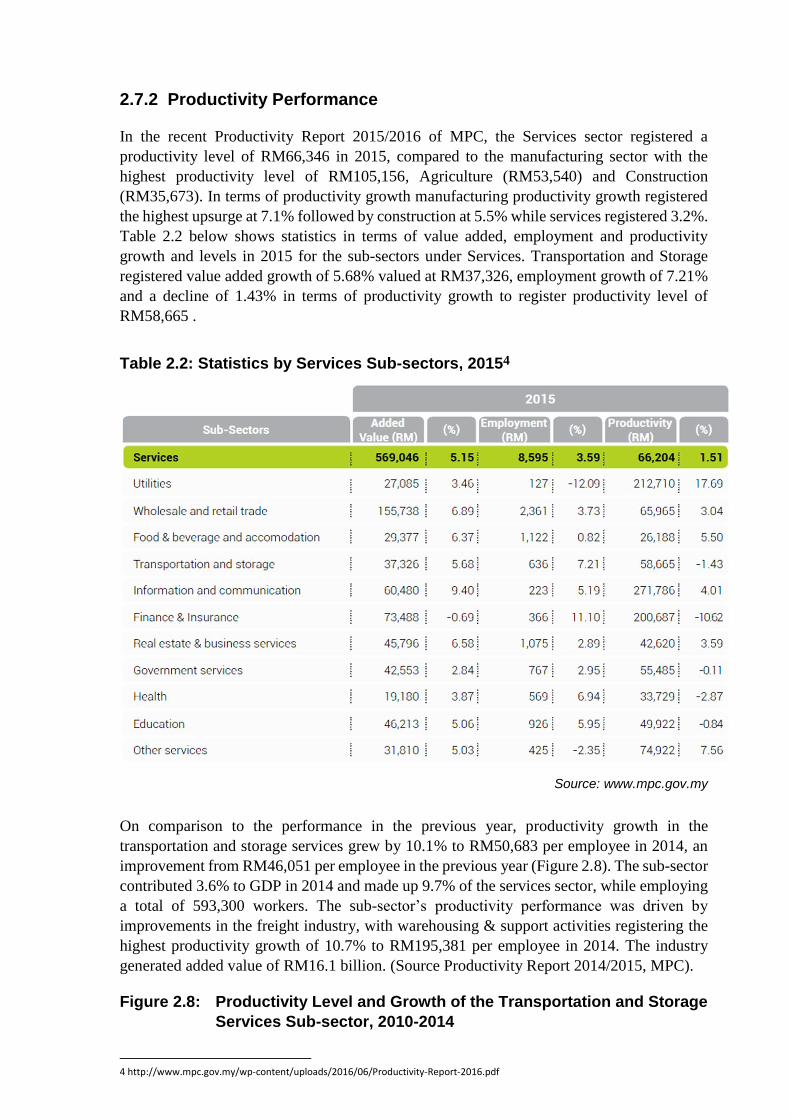
2.7.2 Productivity Performance
In the recent Productivity Report 2015/2016 of MPC, the Services sector registered a
productivity level of RM66,346 in 2015, compared to the manufacturing sector with the
highest productivity level of RM105,156, Agriculture (RM53,540) and Construction
(RM35,673). In terms of productivity growth manufacturing productivity growth registered
the highest upsurge at 7.1% followed by construction at 5.5% while services registered 3.2%.
Table 2.2 below shows statistics in terms of value added, employment and productivity
growth and levels in 2015 for the sub-sectors under Services. Transportation and Storage
registered value added growth of 5.68% valued at RM37,326, employment growth of 7.21%
and a decline of 1.43% in terms of productivity growth to register productivity level of
RM58,665 .
Table 2.2: Statistics by Services Sub-sectors, 20154
Source: www.mpc.gov.my
On comparison to the performance in the previous year, productivity growth in the
transportation and storage services grew by 10.1% to RM50,683 per employee in 2014, an
improvement from RM46,051 per employee in the previous year (Figure 2.8). The sub-sector
contributed 3.6% to GDP in 2014 and made up 9.7% of the services sector, while employing
a total of 593,300 workers. The sub-sector’s productivity performance was driven by
improvements in the freight industry, with warehousing & support activities registering the
highest productivity growth of 10.7% to RM195,381 per employee in 2014. The industry
generated added value of RM16.1 billion. (Source Productivity Report 2014/2015, MPC).
Figure 2.8: Productivity Level and Growth of the Transportation and Storage
Services Sub-sector, 2010-2014
4 http://www.mpc.gov.my/wp-content/uploads/2016/06/Productivity-Report-2016.pdf
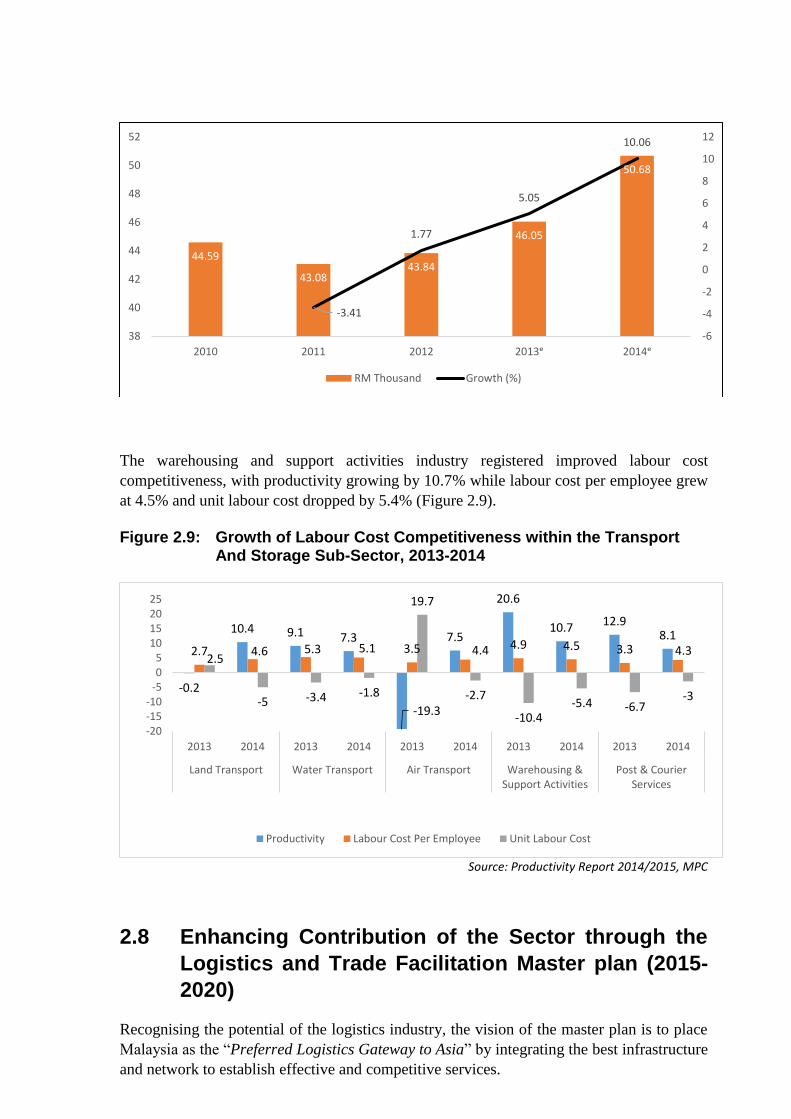
The warehousing and support activities industry registered improved labour cost
competitiveness, with productivity growing by 10.7% while labour cost per employee grew
at 4.5% and unit labour cost dropped by 5.4% (Figure 2.9).
Figure 2.9: Growth of Labour Cost Competitiveness within the Transport And Storage Sub-Sector, 2013-2014
Source: Productivity Report 2014/2015, MPC
2.8 Enhancing Contribution of the Sector through the
Logistics and Trade Facilitation Master plan (2015-
2020)
Recognising the potential of the logistics industry, the vision of the master plan is to place
Malaysia as the “Preferred Logistics Gateway to Asia” by integrating the best infrastructure
and network to establish effective and competitive services.
44.59
43.0843.84
46.05
50.68
-3.41
1.77
5.05
10.06
-6
-4
-2
0
2
4
6
8
10
12
38
40
42
44
46
48
50
52
2010 2011 2012 2013ᵉ 2014ᵉ
RM Thousand Growth (%)
-0.2
10.4 9.1 7.3
-19.3
7.5
20.6
10.7 12.98.1
2.7 4.6 5.3 5.1 3.5 4.4 4.9 4.5 3.3 4.32.5
-5 -3.4 -1.8
19.7
-2.7
-10.4-5.4 -6.7
-3
-20-15-10
-505
10152025
2013 2014 2013 2014 2013 2014 2013 2014 2013 2014
Land Transport Water Transport Air Transport Warehousing &Support Activities
Post & CourierServices
Productivity Labour Cost Per Employee Unit Labour Cost
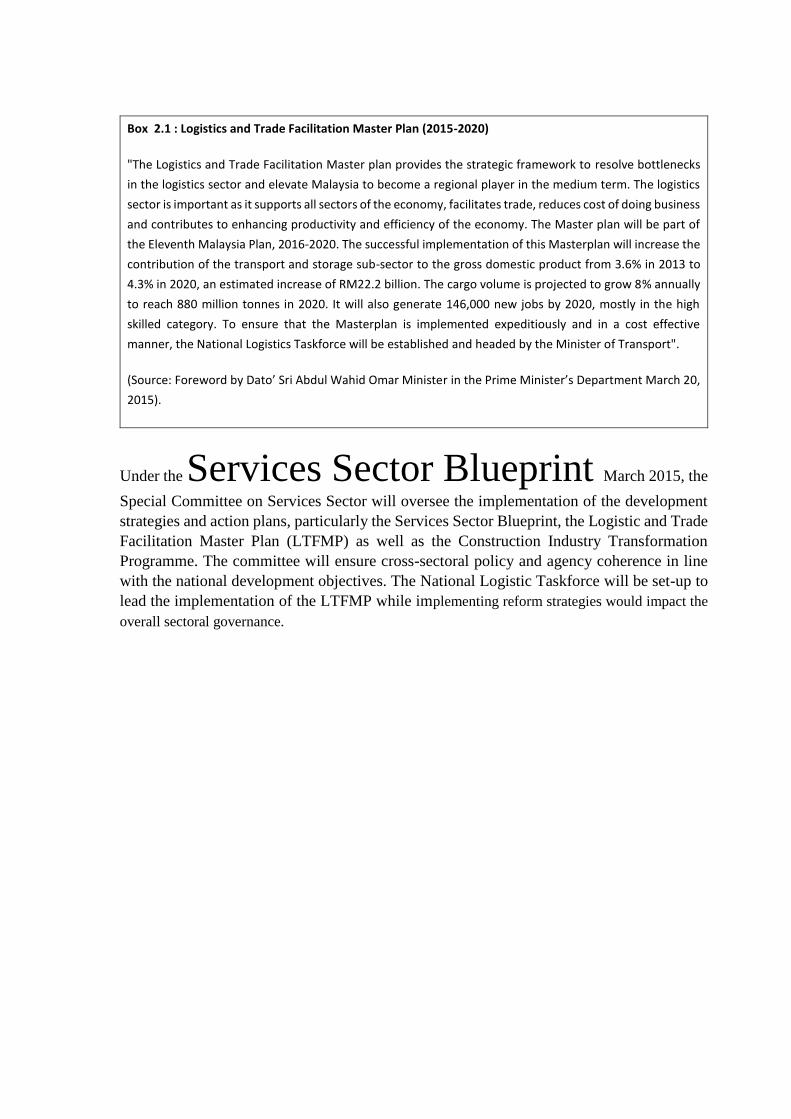
Box 2.1 : Logistics and Trade Facilitation Master Plan (2015-2020)
"The Logistics and Trade Facilitation Master plan provides the strategic framework to resolve bottlenecks
in the logistics sector and elevate Malaysia to become a regional player in the medium term. The logistics
sector is important as it supports all sectors of the economy, facilitates trade, reduces cost of doing business
and contributes to enhancing productivity and efficiency of the economy. The Master plan will be part of
the Eleventh Malaysia Plan, 2016-2020. The successful implementation of this Masterplan will increase the
contribution of the transport and storage sub-sector to the gross domestic product from 3.6% in 2013 to
4.3% in 2020, an estimated increase of RM22.2 billion. The cargo volume is projected to grow 8% annually
to reach 880 million tonnes in 2020. It will also generate 146,000 new jobs by 2020, mostly in the high
skilled category. To ensure that the Masterplan is implemented expeditiously and in a cost effective
manner, the National Logistics Taskforce will be established and headed by the Minister of Transport".
(Source: Foreword by Dato’ Sri Abdul Wahid Omar Minister in the Prime Minister’s Department March 20,
2015).
Under the Services Sector Blueprint March 2015, the
Special Committee on Services Sector will oversee the implementation of the development
strategies and action plans, particularly the Services Sector Blueprint, the Logistic and Trade
Facilitation Master Plan (LTFMP) as well as the Construction Industry Transformation
Programme. The committee will ensure cross-sectoral policy and agency coherence in line
with the national development objectives. The National Logistic Taskforce will be set-up to
lead the implementation of the LTFMP while implementing reform strategies would impact the
overall sectoral governance.
2.10 Malaysia’s Potential Logistics Output and overall
Impact on the Economy
In its current state, Malaysia’s transportation and storage sub-sector is expected to grow at a
CAGR of 5% from 2014 to 2020, contributing MYR 40.9 billion to Malaysia’s GDP, owing to
a resilient domestic economic environment as well as strong intra-Asia trade. This contribution
will make up 3.6% of national GDP. In terms of cargo volume and labour productivity, total
cargo volume is estimated to reach 0.74 billion tonnes (CAGR 5.5% between 2014 and 2020)
while labour productivity is estimated to achieve MYR 136,021 by 2020 (CAGR 3.6% between
2014 and 2020), (Figure 2.10).
With the implementation of the Masterplan, total cargo volume and labour productivity in the
transportation and storage sub-sector is expected to display further improvement. With the
Masterplan’s action items in place, total cargo volume is expected to reach 0.88 billion tonnes,
with CAGR of 8% between 2014 and 2020 (compared to 0.74 billion tonnes under normal
growth). In monetary terms, it is estimated that for every one tonne increase in cargo volume,
the transportation and storage sub-sector’s contribution to GDP increases by MYR 45,010.
Therefore, a CAGR of 8% increase in cargo volume between 2014 and 2020 will result in an
estimated contribution of an additional MYR 5.9 billion to national GDP by 2020. CAGR of 8
% increase in cargo volume between 2014 and 2020 will result in an estimated contribution of
an additional MYR 5.9 billion to national GDP by 2020. Labour productivity is expected to
improve at the rate 5% CAGR between 2014 and 2020 to reach MYR 149,711 (compared to
MYR 136,021 at CAGR 3.6% between 2014 and 2020). In monetary terms, every MYR 1,000
increase in labour productivity will increase the transportation and storage sub-sector’s
contribution to GDP by MYR 280 million. With productivity estimated to reach MYR 149,711,
an increase of 5% CAGR between 2014 and 2020, the transportation and storage sub-sector is
expected to contribute an estimated additional MYR 3.88 billion to GDP by 2020.
As a result of total cargo volume growth and labour productivity improvement from the
implementation of the Masterplan, the transportation and storage sub-sector is expected to grow
at an estimated CAGR of 8.5% from 2014 to 2020, contributing MYR 50.8 billion to
Malaysia’s GDP.
This contribution will make up 4.3% of national GDP. The sub-sector’s contribution to GDP
is consistent with that seen in the logistics industry in major developed economies such as the
US and European countries. According to Eurostat 2013, the transport industry in the EU
contributes 4.6% to the GDP of most member states.

Figure 2.10: Logistics Output Impact to Economy
Additionally, based on Malaysia’s impressive CAGR of more than 6% over the past five years
in sea and land transport freight volume, the logistics industry is poised to play a bigger role in
leading the country’s economic growth. High growth and proactive measures to strengthen the
logistics industry are expected to result in significant spinoff effects for the country, in the form
of increased business investment, a higher employment rate, an increase in the country’s
competitiveness level and a reduction in the cost of doing business.
Economic growth Malaysia recorded strong GDP growth of 5.3% with value added of RM830
billion in 2014. The growth was driven by strong domestic demand, substantial increase in
private and public sector consumption, and sustained foreign investment inflows. The economy
is projected to grow between 5.5% and 6.3% annually until 2020, with steady growth in all
economic sectors. Trade was valued at approximately RM1.45 trillion in 2014 and is expected
to grow 4.7% annually by 2020, backed by strong trade growth prospects in Asia.
2.11 Malaysia’s Regional Standing
Malaysia was ranked 25th in the Global Enabling Trade Report 2015 in the transportation
services category mainly due to its high rankings in the quality of transport infrastructure
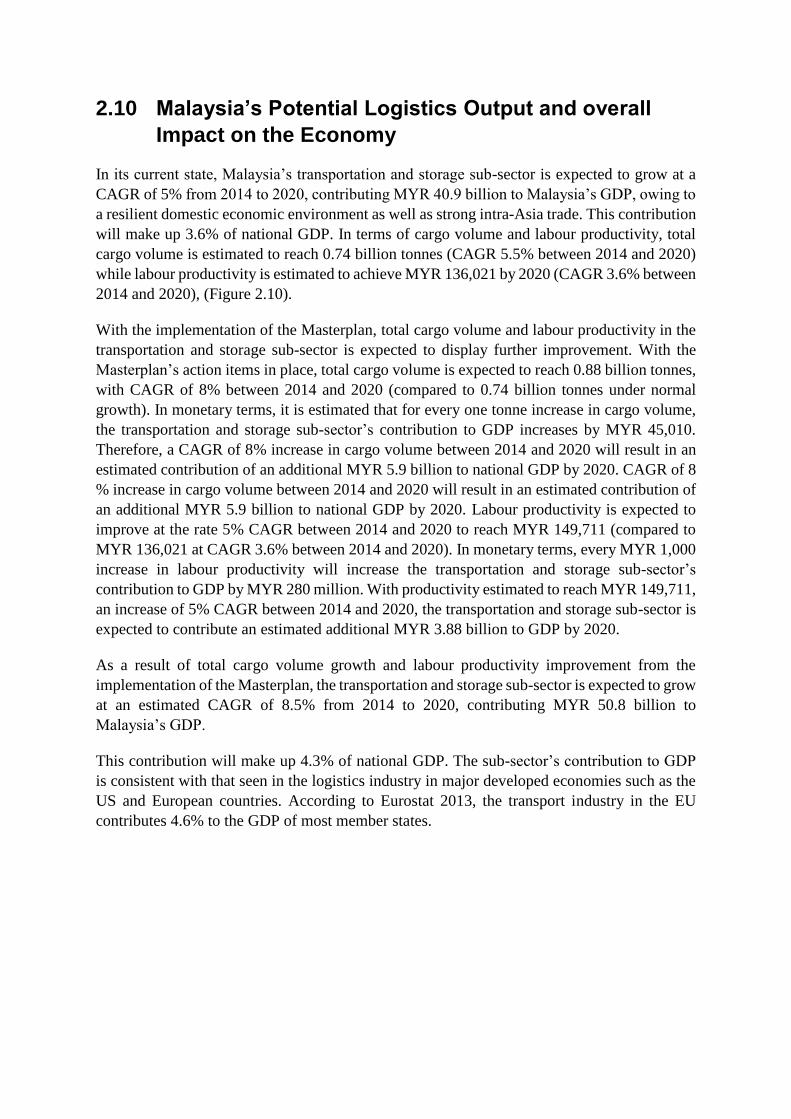
(ranked 14th) and quality of transport services (ranked 26th). In the Logistics Performance
Index (LPI) 2014 by World Bank, Malaysia ranked 25 out of 160 countries, leading upper-
middle-income nations, above China and Thailand. The high-income nations dominate the first
20 positions (Figures 2.11 and 2.12).
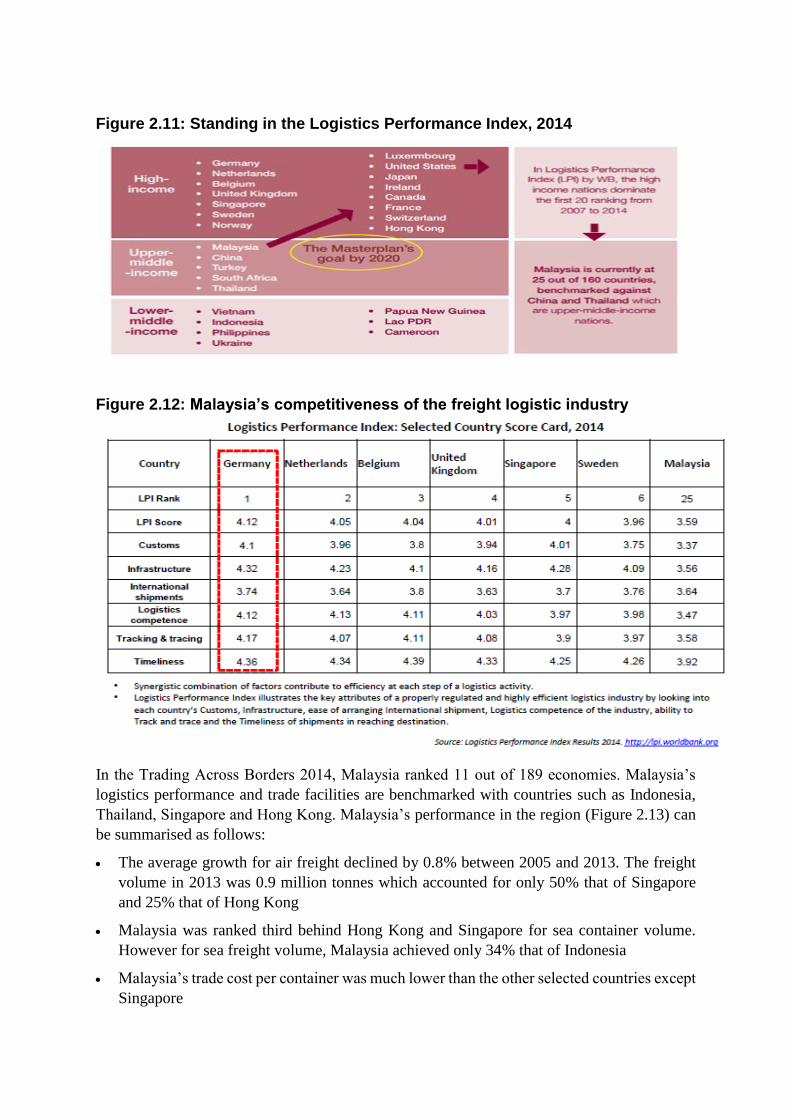
Figure 2.11: Standing in the Logistics Performance Index, 2014
Figure 2.12: Malaysia’s competitiveness of the freight logistic industry
In the Trading Across Borders 2014, Malaysia ranked 11 out of 189 economies. Malaysia’s
logistics performance and trade facilities are benchmarked with countries such as Indonesia,
Thailand, Singapore and Hong Kong. Malaysia’s performance in the region (Figure 2.13) can
be summarised as follows:
The average growth for air freight declined by 0.8% between 2005 and 2013. The freight
volume in 2013 was 0.9 million tonnes which accounted for only 50% that of Singapore
and 25% that of Hong Kong
Malaysia was ranked third behind Hong Kong and Singapore for sea container volume.
However for sea freight volume, Malaysia achieved only 34% that of Indonesia
Malaysia’s trade cost per container was much lower than the other selected countries except
Singapore
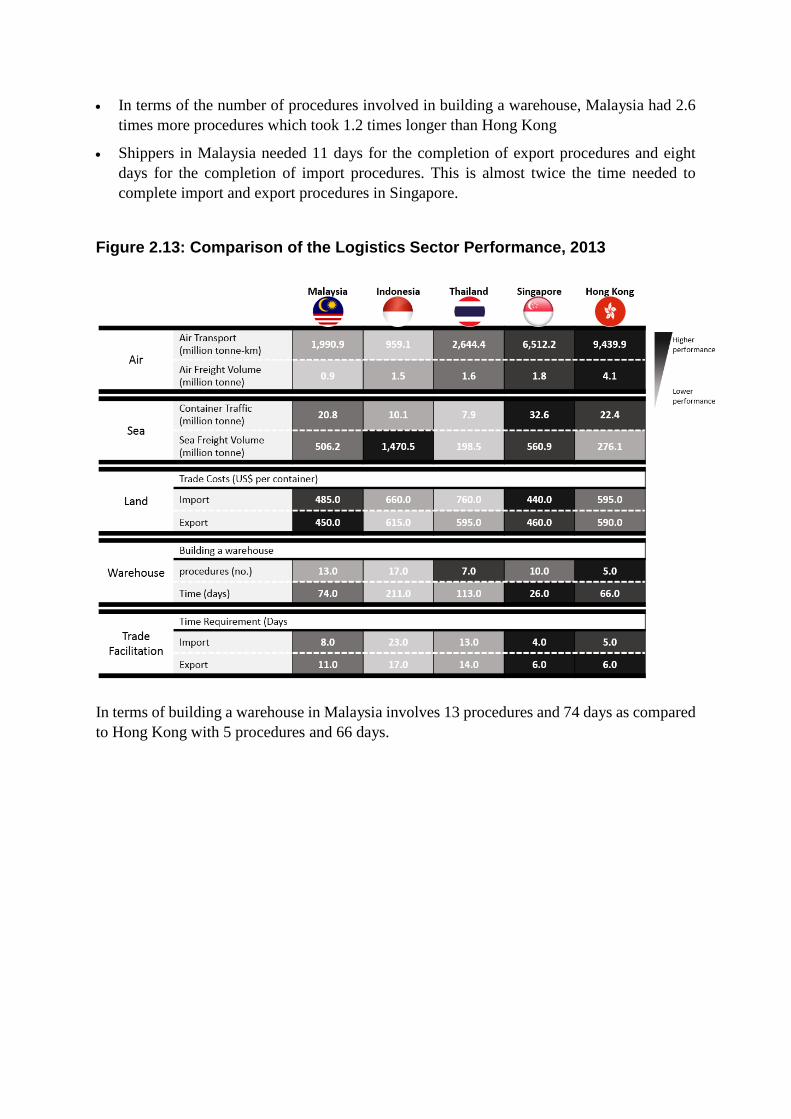
In terms of the number of procedures involved in building a warehouse, Malaysia had 2.6
times more procedures which took 1.2 times longer than Hong Kong
Shippers in Malaysia needed 11 days for the completion of export procedures and eight
days for the completion of import procedures. This is almost twice the time needed to
complete import and export procedures in Singapore.
Figure 2.13: Comparison of the Logistics Sector Performance, 2013
In terms of building a warehouse in Malaysia involves 13 procedures and 74 days as compared
to Hong Kong with 5 procedures and 66 days.